332 Pine Street, 4 th Floor, San Francisco, CA 94104 (415) 348-0300 Fax (415) 773-1790 www.fehrandpeers.com MEMORANDUM Date: May 6, 2014 To: Jason Patton, City of Oakland From: Nicole Foletta, Meghan Weir and Matthew Ridgway, Fehr & Peers Subject: Final Bicycle Boulevard Recommendations SF11-0552.01 The purpose of this memorandum is to provide citywide policy recommendations based on the examples of two proposed bicycle boulevard corridors. These policies will address stop control, traffic calming, and uncontrolled crossings. The City of Oakland’s Bicycle Master Plan (2007) proposes 32 miles of Bicycle Boulevards and provides the following definition for this bikeway type: Bicycle boulevards are bicycle routes on residential streets that prioritize through trips for bicyclists. The route should appeal to cyclists of varied skill levels by providing direct connections on streets with low traffic volumes. The route should reduce delay to bicyclists by assigning right-of-way to travel on the route. Traffic calming should be introduced as needed to discourage drivers from using the boulevard as a through route. (p. 66) The Plan includes the following design guidance on the implementation of Bicycle Boulevards: Intersection Control: Where feasible, modify stop signs and traffic signals to prioritize bicycle travel and improve bicycle safety along the bicycle boulevard. In particular, minimize the number of intersections where cross traffic does not stop. Such modifications to intersection control shall be contingent on an engineering analysis of operations and safety. (p. 83) Traffic Calming: Consider bicycle-friendly speed humps, traffic circles, and partial street closures on bicycle boulevards with speeds and/or volumes of motor vehicle traffic that are incompatible with the bicycle route and the character of the residential street. (p. 84) Two initial corridors were selected by the City for further study in developing bicycle boulevards: The Shafter Avenue/Webster Street bicycle route, which provides north/south access on neighborhood streets between Telegraph Avenue and College Avenue/Broadway, connecting Alcatraz Avenue at the north and West MacArthur Boulevard at the south. The following are the streets along this route which are within our study area:
Transcript
332 Pine Street, 4th Floor, San Francisco, CA 94104 (415) 348-0300 Fax (415) 773-1790 www.fehrandpeers.com
MEMORANDUM
Date: May 6, 2014
To: Jason Patton, City of Oakland
From: Nicole Foletta, Meghan Weir and Matthew Ridgway, Fehr & Peers
Subject: Final Bicycle Boulevard Recommendations
SF11-0552.01
The purpose of this memorandum is to provide citywide policy recommendations based on the
examples of two proposed bicycle boulevard corridors. These policies will address stop control,
traffic calming, and uncontrolled crossings.
The City of Oakland’s Bicycle Master Plan (2007) proposes 32 miles of Bicycle Boulevards and
provides the following definition for this bikeway type:
Bicycle boulevards are bicycle routes on residential streets that prioritize through
trips for bicyclists. The route should appeal to cyclists of varied skill levels by
providing direct connections on streets with low traffic volumes. The route should
reduce delay to bicyclists by assigning right-of-way to travel on the route. Traffic
calming should be introduced as needed to discourage drivers from using the
boulevard as a through route. (p. 66)
The Plan includes the following design guidance on the implementation of Bicycle Boulevards:
Intersection Control: Where feasible, modify stop signs and traffic signals to prioritize
bicycle travel and improve bicycle safety along the bicycle boulevard. In particular,
minimize the number of intersections where cross traffic does not stop. Such
modifications to intersection control shall be contingent on an engineering analysis of
operations and safety. (p. 83)
Traffic Calming: Consider bicycle-friendly speed humps, traffic circles, and partial street
closures on bicycle boulevards with speeds and/or volumes of motor vehicle traffic that
are incompatible with the bicycle route and the character of the residential street. (p. 84)
Two initial corridors were selected by the City for further study in developing bicycle boulevards:
The Shafter Avenue/Webster Street bicycle route, which provides north/south access on
neighborhood streets between Telegraph Avenue and College Avenue/Broadway,
connecting Alcatraz Avenue at the north and West MacArthur Boulevard at the south. The
following are the streets along this route which are within our study area:
Jason Patton May 6, 2014 Page 2 of 17
o Colby Street from Alcatraz Avenue to Claremont Avenue
o Forest Street from Claremont Avenue to Shafter Avenue
o Shafter Avenue from Forest Street to 48th
Street
o 48th
Street from Shafter Avenue to Webster Street
o Webster Street from 48th
Street to West MacArthur Boulevard
The Genoa Street/West Street bicycle route, which provides north/south access on
neighborhood streets immediately west of and parallel to Martin Luther King Jr. Way,
connecting Adeline Street near 61st Street at the north end and West Grand Avenue at the
south. The following are the segments along the route which are within our study area:
o Genoa Street from Adeline Street/Stanford Avenue to 52nd
Street
o 52nd
Street from Genoa Street to West Street
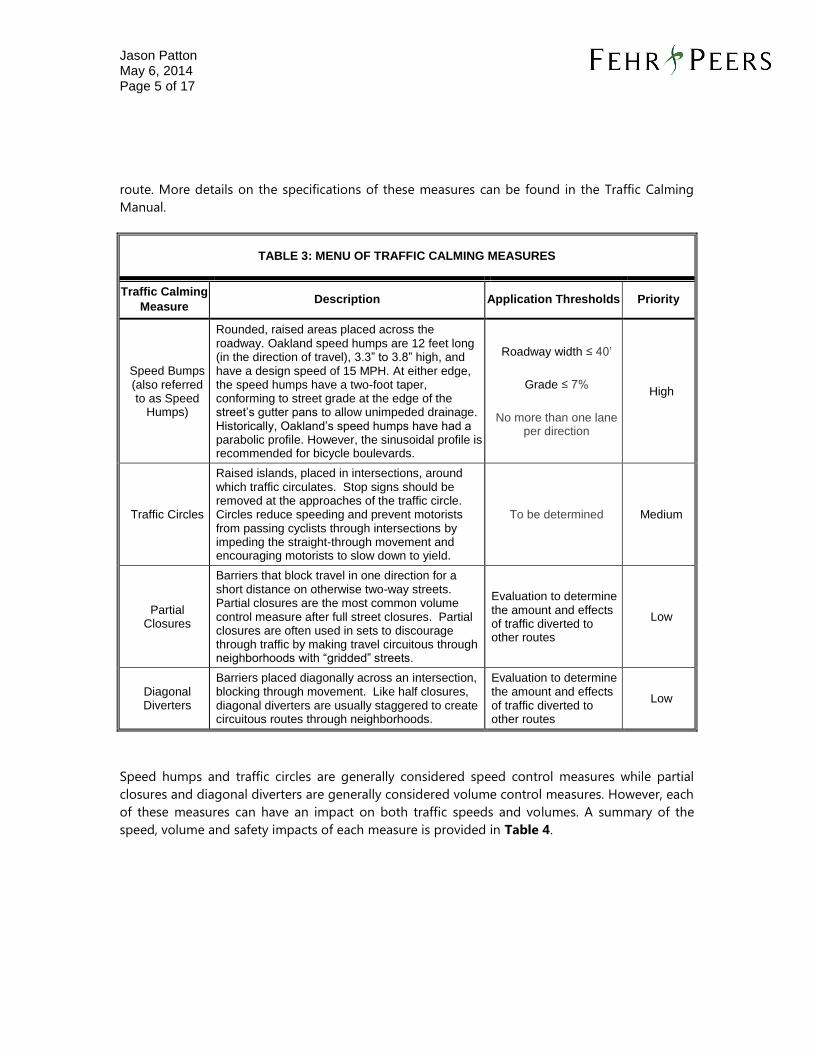
The two corridors were divided into segments A – J and each segment was evaluated to
determine whether it meets the target volume threshold of 3,000 or less average daily traffic
(ADT) and the target 85th
percentile speed threshold of 25 or fewer miles per hour (MPH), set
forth in the City’s Bicycle Boulevard Policies. Segments that do not meet these thresholds should
include traffic calming measures (Figure 1 and Table 1). Segments with ADTs between 1,500 and
3,000 are also candidates for traffic calming measures. All but two segments require at least some
traffic calming in order to comply with the speed and volume thresholds set forth in the City’s
Bicycle Boulevard Policies. This analysis is described in more detail in the Application of Bicycle
Boulevard Policies memorandum.
TABLE 1: COMPLIANCE WITH SPEED AND VOLUME THRESHOLDS
Segment Location Is the ADT ≤ 3000
vehicles?
Is the 85th
percentile
speed ≤ 25 mph?
Shafter Avenue Corridor
A Colby between Alcatraz and 61st NO (3,079 ADT) YES (23 MPH)
B Colby between 61st and Claremont NO (3,161 ADT) YES (23 MPH)
C Forest between Claremont and Shafter NO (5,381 ADT) YES (23 MPH)
D Shafter between Forest and 51st YES (2,109 ADT) NO (26 MPH)
E Shafter between 51st and 48
th and
48th
between Shafter and Webster
NO (3,211 ADT) NO (26 MPH)
F Webster between 48th and 43
rd YES (1,369 ADT) YES (24 MPH)
G Webster between 43rd
and 40th YES (1,643 ADT) NO (27 MPH)
H Webster between 40th and 38
th YES (2,334 ADT) NO (31 MPH)
Genoa Street Corridor
I Genoa between Adeline and 52nd
YES (366 ADT) YES (22 MPH)
J 52nd
between Genoa and West YES (2,041 ADT) NO (28 MPH)
Source: Fehr & Peers 2013
W S
t
Tele
grap
h Av
e
Broa
dway
Mar
ket S
t
40th St
Alcatraz Ave
San Pablo Ave
College Ave
Clar
emon
t Ave
Shattuck Ave
Shaf
ter A
ve
Broadway Ter
55th St
Mar
tin L
uthe
r Kin
g Jr
Way
51st St
Piedmont A
ve
Sacramento St
Stanford Ave
Miles Ave
52nd St
Emery St
Adel
ine
St
45th St
42nd St
Aileen St
Chabot Rd
41st St
43rd St
57th St
56th St
Dover St
35th St
King St
61st St
36th St
54th St
Manila Ave
49th St
53rd St
44th St
Howe St
Webster St
66th St
Genoa St
63rd St
33rd St
Apgar St
Prince St
60th St
Lawto
n Av
e
38th StLinda Ave
Ocean View Dr
55th St
California St
Colby St
Gilb
ert S
t
N St
Regent St
Acton St
Julia St
Harmon St
Ayala
Ave
Harwood Ave
Emer
ald
St
Montell St
Salem St
51st St
Whitmore St
Vice
nte
Way
60th St
MacArthurBART Station
Oakland
Berkeley 3,079 autos457 bikes23 mph17 mph
3,161 autos405 bikes23 mph17 mph
5,381 autos600 bikes23 mph17 mph
2,109 autos424 bikes26 mph19 mph
2,512 autos758 bikes26 mph18 mph1,369 autos
530 bikes24 mph19 mph
1,643 autos731 bikes27 mph20 mph
2,334 autos621 bikes31 mph24 mph
366 autos656 bikes22 mph14 mph
2,041 autos66 bikes28 mph21 mph
a
b
c
d
e
g
f
h
i
j
Average Daily TrafficAverage Daily Bicycles85th Percentaile SpeedMean Auto Speed
DATA COLLECTION LOCATIONSFIGURE 1
Not to Scale
N
SF11-0552 Oakland Traffic Calming\Graphics
W S
t
Tele
grap
h Av
e
Broa
dway
Mar
ket S
t
40th St
Alcatraz Ave
San Pablo Ave
College Ave
Clar
emon
t Ave
Shattuck Ave
Shaf
ter A
ve
Broadway Ter
55th St
Mar
tin L
uthe
r Kin
g Jr
Way
51st St
Piedmont A
ve
Sacramento St
Stanford Ave
Miles Ave
52nd St
Emery St
Adel
ine
St
45th St
42nd St
Aileen St
Chabot Rd
41st St
43rd St
57th St
56th St
Dover St
35th St
King St
61st St
36th St
54th St
49th St
53rd St
44th St
Howe St
Webster St
66th St
Genoa St
63rd St
33rd St
Apgar St
Prince St
60th St
Lawto
n Av
e
38th StLinda Ave
55th St
California St
Colby St
Gilb
ert S
t
N St
Regent St
Acton St
Julia St
Harmon St Harwood Ave
Emer
ald
St
Montell St
Salem St
51st St
60th St
MacArthurBART Station
Oakland
Berkeley 3,079 autos457 bikes23 mph17 mph
3,161 autos405 bikes23 mph17 mph
5,381 autos600 bikes23 mph17 mph
2,109 autos424 bikes26 mph19 mph
3,211 autos758 bikes26 mph18 mph1,369 autos
530 bikes24 mph19 mph
1,643 autos731 bikes27 mph20 mph
2,334 autos621 bikes31 mph24 mph
366 autos656 bikes22 mph14 mph
2,041 autos324 bikes28 mph21 mph
a
b
c
d
e
g
f
h
i
j
Average Daily TrafficAverage Daily Bicycles85th Percentaile SpeedMean Auto Speed
DATA COLLECTION LOCATIONSFIGURE 1
Not to Scale
N
SF11-0552 Oakland Traffic Calming\Graphics
Jason Patton May 6, 2014 Page 4 of 17
Toolbox of Measures
Bicycle Boulevard measures were broken down into four categories:
Stop Control Changes
Traffic Calming
Crossing Treatments
Speed Limits
Stop Control Changes
In order to minimize the number of intersections where cross traffic does not stop and reduce the
number of times bicyclists must stop along the bicycle boulevard, the following changes to stop
control at intersections may be considered:
TABLE 2: MENU OF STOP CONTROL CHANGES
Existing Intersection Configuration Stop Control Change Priority
Appropriate at intersections with two-way stop control where traffic must stop along the bicycle boulevard but not along the cross street approaches
Flipping stop signs (removing stop signs from the bicycle boulevard and placing them on the cross street)
High
Appropriate at two-way or all-way stop controlled intersections
Stop sign removal (in conjunction with installation of traffic circles)
Medium
Appropriate at intersections with all-way stop control where traffic volumes are low enough on the cross street to justify removal of stop signs on the bicycle boulevard approaches
Stop sign removal in one direction, conversion from all-way to two-way stop
Low
Appropriate at intersections with two-way stop control where traffic must stop along the bicycle boulevard but not along the cross street approaches
Stop sign addition, conversion from two-way to all-way stop
Low
Appropriate at intersections with two-way stop control where traffic must stop along the bicycle boulevard but not along the cross street approaches
No stop control change, installation of “cross traffic does not stop” signs
Low
Proposals for the removal of stop signs should be evaluated with the following criteria: average
daily traffic on the intersecting streets, sight distances, and crash history. An existing stop sign
could be in place to address a history of crashes, a sight distance issue, or a significant difference
in traffic volumes on the intersecting streets. If this is the case, consider installing a traffic circle in
conjunction with the removal of stop signs.
Traffic Calming
Table 3 summarizes traffic calming measures from the City of Oakland’s Traffic Calming Manual,
which were selected as being appropriate measures to implement on Bicycle Boulevards to
reduce traffic volumes and speeds, thus improving the safety and comfort for bicyclists along the
Jason Patton May 6, 2014 Page 5 of 17
route. More details on the specifications of these measures can be found in the Traffic Calming
Rounded, raised areas placed across the roadway. Oakland speed humps are 12 feet long (in the direction of travel), 3.3” to 3.8” high, and have a design speed of 15 MPH. At either edge, the speed humps have a two-foot taper, conforming to street grade at the edge of the street’s gutter pans to allow unimpeded drainage. Historically, Oakland’s speed humps have had a parabolic profile. However, the sinusoidal profile is recommended for bicycle boulevards.
Roadway width ≤ 40’
Grade ≤ 7%
No more than one lane per direction
High
Traffic Circles
Raised islands, placed in intersections, around which traffic circulates. Stop signs should be removed at the approaches of the traffic circle. Circles reduce speeding and prevent motorists from passing cyclists through intersections by impeding the straight-through movement and encouraging motorists to slow down to yield.
To be determined Medium
Partial Closures
Barriers that block travel in one direction for a short distance on otherwise two-way streets. Partial closures are the most common volume control measure after full street closures. Partial closures are often used in sets to discourage through traffic by making travel circuitous through neighborhoods with “gridded” streets.
Evaluation to determine the amount and effects of traffic diverted to other routes
Low
Diagonal Diverters
Barriers placed diagonally across an intersection, blocking through movement. Like half closures, diagonal diverters are usually staggered to create circuitous routes through neighborhoods.
Evaluation to determine the amount and effects of traffic diverted to other routes
Low
Speed humps and traffic circles are generally considered speed control measures while partial
closures and diagonal diverters are generally considered volume control measures. However, each
of these measures can have an impact on both traffic speeds and volumes. A summary of the
speed, volume and safety impacts of each measure is provided in Table 4.
Jason Patton May 6, 2014 Page 6 of 17
TABLE 4: MENU OF TRAFFIC CALMING MEASURES
Traffic Calming Measure
Speed Impacts
(Average percent change
in speed)
Volume Impacts
(Average percent change
in traffic volume)
Safety Impacts
(Average percent change
in annual number of
collisions)
Speed Humps -22% -18% -14%
Traffic Circles -11% -5% -73%
Partial Closures -19% -42% I/D
Diagonal Diverters -4% -35% I/D
Note: I/D = Insufficient data
Source: US Traffic Calming Manual, 2009
Speed humps are good for locations where very low speeds are desired and reasonable, and
where some increase in vehicle noise and exhaust is an acceptable tradeoff. The magnitude of
reduction in speed is dependent on the spacing of speed humps between points that require
drivers to slow. Sinusoidal speed humps are recommended on bicycle boulevards to improve
comfort of bicyclists. However, due to variations in construction techniques, the bicycle-
friendliness of speed humps can vary even among humps with the same profile type.
The City of Oakland has been installing speed humps since the 1990s and has an established
design and process for doing so. A number of speed humps are located on existing and proposed
bicycle boulevards that are in various stages of development. Based on feedback and discussion
over the years, Oakland’s cyclists have mixed feelings about speed humps. On the one hand,
speed humps are highly effective at reducing motorist speeds to that of cyclist speeds, making it
more comfortable for cyclists to share a travel lane with motorists. On the other hand, speed
humps can be distracting and uncomfortable to cyclists because of the jolt the cyclist feels upon
first reaching the hump plus the following jolt when the cyclist returns to street grade.
A sinusoidal speed hump profile may be able to realize the traffic calming benefits while
minimizing the negative effects on cyclists. By blending the edges of the hump into the roadway
surface, either edge of the hump no longer has an abrupt grade break that is experienced as a jolt
by the cyclist. At the same time, the height of the speed hump remains the same and continues to
slow motor vehicles.
Oakland’s speed humps generally have a parabolic profile where there is an abrupt grade break
between either edge of the hump and the street surface. This is in part a result of the construction
method where asphalt is mounded on top of the existing roadway surface and there is limited
opportunity to blend the edges the speed hump into the roadway surface. The following
recommendations are a means for developing more bicycle-friendly speed humps:
Jason Patton May 6, 2014 Page 7 of 17
(1) Engage the cycling community to identify the best and worst speed humps on frequently
traveled routes. Organize a group ride to discuss these locations in the field and come to
agreement amongst the group as to which speed humps are the best and the worst.
(2) Survey these speed humps to determine the geometry of their profiles.
(3) Conduct a pilot project to retrofit existing speed humps. The retrofit would mill and
overlay a section of the roadway on either side and through the speed hump. The result
would be a continuous patch of asphalt that maintains the height of the speed hump but
no longer has an abrupt grade break or seam at either edge of the speed hump.
(4) Based on the outcomes of the previous three recommendations, develop a design detail
and construction method for the installation of new speed humps with a sinusoidal
profile.
Traffic circles not only help to reduce traffic speeds and volumes, but can also reduce the number
of times a bicyclist must stop along a route by removing stop signs. Before installing a permanent
traffic circle, the City may want to consider implementing a pilot traffic circle program. The
benefits of a pilot program are that they are relatively inexpensive to implement and impacts can
be tested. The pilot program should be accompanied by extensive outreach to the local
community.
Similar to traffic circles, the City may wish to test the impacts of partial closures or diagonal
diverters through a temporary pilot program. Such a program can help to determine whether a
traffic circle, partial closure, or diagonal diverter would be more appropriate at a location. An
example of such a program is the Pop-Up MANGo: Temporary Greenway Installation and
Community Festival; an interactive community workshop to define the Michigan Avenue
Neighborhood Greenway project in Santa Monica, California. The workshop included temporary
installations of potential elements of the project including a traffic circle and turn restrictions.1
Crossing Treatments
In order to improve crossing of major arterials, the crossing treatments summarized in Table 5
may be considered along Bicycle Boulevards.
1 Planning efforts for the Michigan Avenue Neighborhood Greenway were launched in 2013 and were
funded by a Caltrans Environmental Justice Grant. http://www.smgov.net/Departments/PCD/Plans/Streetscapes/Michigan-Avenue-Neighborhood-Greenway/
“Cross Traffic Does Not Stop” signs (W4-4p) on bicycle boulevard approaches and Bicycle Traffic signs (W11-1) on intersecting streets
At intersections where cross traffic does not stop. Threshold: cross street traffic exceeds 5,000 ADT
1
High
Pavement Markings
“Bike xing ahead” legends on intersecting streets; chevrons to mark the cyclist path of travel through intersections; green-backed sharrows in intersections for cyclist wayfinding
“Bike xing ahead” legends on approaches and chevrons in intersections at major street crossings where cross traffic does not stop; green-backed sharrows in off-set intersections along the bike boulevard or in intersections where the bike boulevard turns; pending addition to CA MUTCD for chevrons and green-backed sharrows
High
Ladder crosswalks
Two-foot stripes and two-foot spaces oriented parallel to the roadway centerline and bounded by standard one-foot crosswalk stripes
At uncontrolled street crossings of bicycle boulevards to enhance the visibility of the intersection
Medium
Two-stage turn queue
boxes
A marked area within the intersection designated for queuing bicyclists to make two-stage turns; markings include a bicycle stencil and a turn arrow to indicate bicycle direction and positioning, and should be placed in a protected area (for example, aligned with an on-street parking lane or between the bicycle lane and pedestrian crossing); colored pavement inside the queuing area is recommended
At multi-lane signalized intersections for safe left-turns; where desirable to simplify turns from a bicycle lane or cycle track onto a bicycle boulevard; along roadways with high traffic speeds and/or traffic volumes. Multi-lane crossings, from major street onto bicycle boulevard (pending addition to CA MUTCD)
Low
Bike Boxes
A designated area at the head of a traffic lane at a signalized intersection that provides bicyclists with a safe and visible way to get ahead of queuing traffic during the red signal phase
At signalized intersections where there might be right or left-turning conflicts between bicyclists and motorists (pending addition to CA MUTCD)
Low
Rectangular rapid flashing
beacons
Active warning beacons for pedestrian crossings, located on the side of the road facing oncoming traffic (with secondary installations at medians); beacons are unlit when not activated, and use an irregular flashing pattern to alert drivers to presence of pedestrians when activated
At major uncontrolled street crossings where traffic signals are not warranted and cyclists are dismounting and crossing as pedestrians due to safety concerns; include both crosswalks and beacons at each to serve two-way bicycle traffic
Protected spaces in the center of the street to provide a two-stage crossing for cyclists; at least six feet wide (10 feet preferred), buffered by a raised curb
At multi-lane streets; where a bikeway crosses a moderate to high volume or high speed streets; where crossing distance is long or crossing two-way traffic is difficult; when desirable to restrict vehicle cross traffic or turning movements
Low
Traffic Signals
Signaling devices positioned at road intersection, pedestrian crossings and other locations to control competing flows of traffic
At major intersections with high volumes of traffic in both directions