O’NEIL COMMODITY CONSULTING Transportation and Export Report for 14 June 2018 Ocean Freight Insights and Comments: It has been a bumpy ride; or, in seaman’s terms, moderately rough seas in Dry-Bulk freight markets over the past six months. Physical rates have moved up and down in a two dollar per tonne range but always circled back to about where the year started off. Overall 2018 Dry-bulk rates have been fairly steady while trading in a narrow range; but have not improved much over Q4 of 2017. Market sentiment remains bullish (or at least hopeful) but it has been difficult to carve out any meaningful improvements in vessel rates or profitability. And the increase in bunker fuel costs has cut into operating profitability. This week the paper traders took pushed markets up again so we are now into a two week uptick in values. The Capesize vessel market has not followed the Panamax market higher so we will have to see if this week’s rally can be sustained. The S&D picture remains unchanged and international trade/tariff disputes are not helping the demand outlook BALTIC DRY-BULK PANAMAX INDEX CHANGES Recent history of freight values for Capesize vessels of Iron-Ore from West Australia to South China: Four weeks ago: $ 8.30-$8.60 Three weeks ago: $ 7.75-$8.20 Two weeks ago: $ 6.55-$6.85 One week ago: $ 7.50-$8.15 This week $ 7.55-$8.10 US Vessel Line-Ups/Estimated vessel berthing delays at U.S. Export Grain Elevators: Mississippi River: (10 elevators) 0-6 days Miss. River Mid-Stream loaders: (6+ Rigs) 0-2 days Texas Gulf (6 elevators) 0-2days Pacific Northwest: (9 elevators) 2-21 days (only 2 facilities over 7 days)
Transcript
O’NEIL COMMODITY CONSULTING
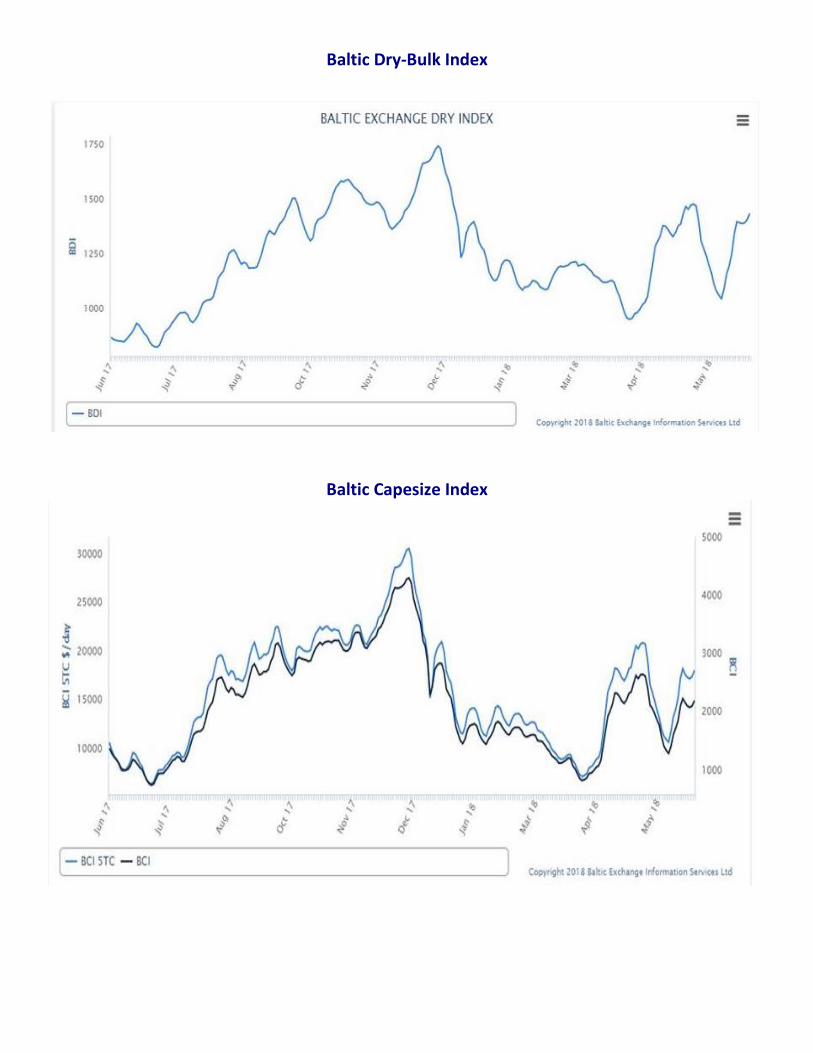
Transportation and Export Report for 14 June 2018 Ocean Freight Insights and Comments: It has been a bumpy ride; or, in seaman’s terms, moderately rough seas in Dry-Bulk freight markets over the past six months. Physical rates have moved up and down in a two dollar per tonne range but always circled back to about where the year started off. Overall 2018 Dry-bulk rates have been fairly steady while trading in a narrow range; but have not improved much over Q4 of 2017. Market sentiment remains bullish (or at least hopeful) but it has been difficult to carve out any meaningful improvements in vessel rates or profitability. And the increase in bunker fuel costs has cut into operating profitability. This week the paper traders took pushed markets up again so we are now into a two week uptick in values. The Capesize vessel market has not followed the Panamax market higher so we will have to see if this week’s rally can be sustained. The S&D picture remains unchanged and international trade/tariff disputes are not helping the demand outlook BALTIC DRY-BULK PANAMAX INDEX CHANGES
Recent history of freight values for Capesize vessels of Iron-Ore from West Australia to South China: Four weeks ago: $ 8.30-$8.60 Three weeks ago: $ 7.75-$8.20 Two weeks ago: $ 6.55-$6.85 One week ago: $ 7.50-$8.15 This week $ 7.55-$8.10
US Vessel Line-Ups/Estimated vessel berthing delays at U.S. Export Grain Elevators:
Mississippi River: (10 elevators) 0-6 days Miss. River Mid-Stream loaders: (6+ Rigs) 0-2 days Texas Gulf (6 elevators) 0-2days Pacific Northwest: (9 elevators) 2-21 days (only 2 facilities over 7 days)
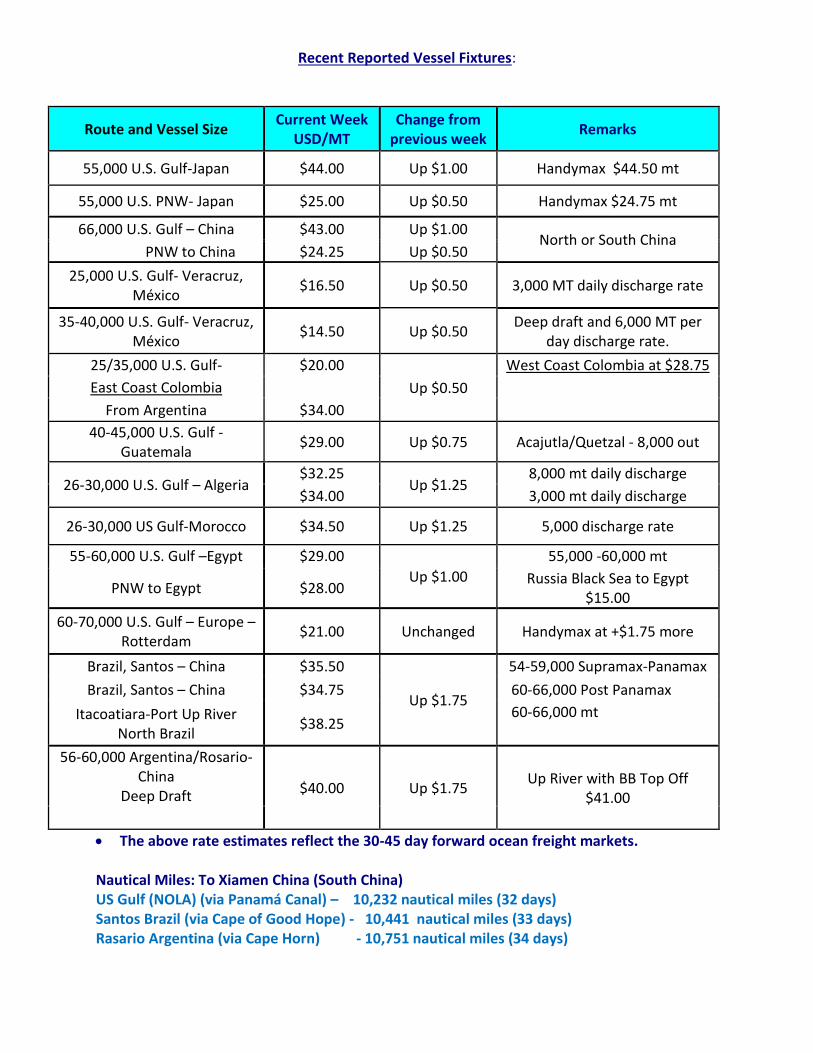
Recent Reported Vessel Fixtures:
Route and Vessel Size Current Week
USD/MT Change from
previous week Remarks
55,000 U.S. Gulf-Japan $44.00 Up $1.00 Handymax $44.50 mt
55,000 U.S. PNW- Japan $25.00 Up $0.50 Handymax $24.75 mt
66,000 U.S. Gulf – China $43.00 Up $1.00 North or South China
PNW to China $24.25 Up $0.50
25,000 U.S. Gulf- Veracruz, México
$16.50 Up $0.50 3,000 MT daily discharge rate
35-40,000 U.S. Gulf- Veracruz, México
$14.50 Up $0.50 Deep draft and 6,000 MT per
day discharge rate.
25/35,000 U.S. Gulf- $20.00
Up $0.50
West Coast Colombia at $28.75
East Coast Colombia
From Argentina $34.00
40-45,000 U.S. Gulf - Guatemala
$29.00 Up $0.75 Acajutla/Quetzal - 8,000 out
26-30,000 U.S. Gulf – Algeria $32.25
Up $1.25 8,000 mt daily discharge
$34.00 3,000 mt daily discharge
26-30,000 US Gulf-Morocco $34.50 Up $1.25 5,000 discharge rate
55-60,000 U.S. Gulf –Egypt $29.00
Up $1.00
55,000 -60,000 mt
PNW to Egypt $28.00 Russia Black Sea to Egypt
$15.00
60-70,000 U.S. Gulf – Europe – Rotterdam
$21.00 Unchanged Handymax at +$1.75 more
Brazil, Santos – China $35.50
Up $1.75
54-59,000 Supramax-Panamax
Brazil, Santos – China $34.75 60-66,000 Post Panamax
Itacoatiara-Port Up River North Brazil
$38.25 60-66,000 mt
56-60,000 Argentina/Rosario-China
Deep Draft $40.00 Up $1.75 Up River with BB Top Off
$41.00
The above rate estimates reflect the 30-45 day forward ocean freight markets. Nautical Miles: To Xiamen China (South China) US Gulf (NOLA) (via Panamá Canal) – 10,232 nautical miles (32 days) Santos Brazil (via Cape of Good Hope) - 10,441 nautical miles (33 days) Rasario Argentina (via Cape Horn) - 10,751 nautical miles (34 days)
Forward Curve for Baltic BPI Panamax Vessel Freight
Baltic Dry-Bulk Index
Baltic Capesize Index
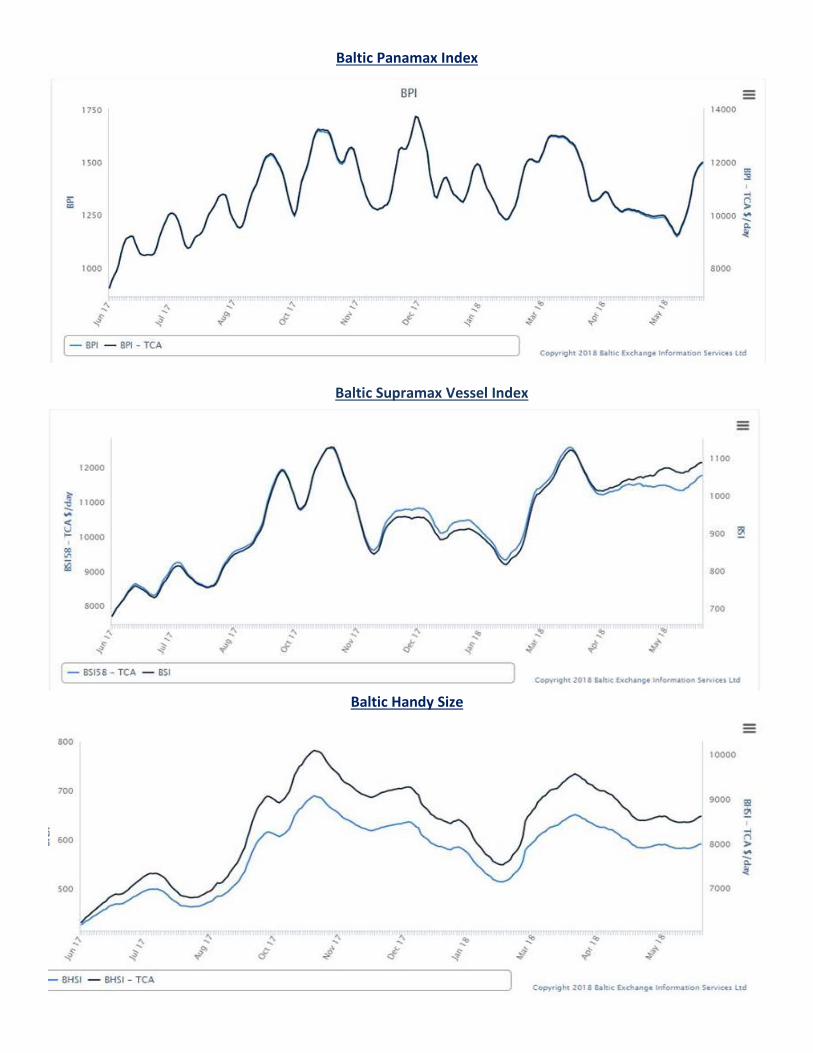
Baltic Panamax Index
Baltic Supramax Vessel Index
Baltic Handy Size
14 June 2018 U.S. FOB Vessel Export Market Values:
The Gulf spread between #2 & #3 YC is currently about 02 cents per bushel (0.80/mt)
Fob vessel Texas Gulf #2 Sorghum is about 93% the value of #2 Yellow Corn at NOLA U.S. SRW Wheat Fob Vessel at the Center U.S. Gulf
CME/CBOT July 2018 (CN8) Corn Futures Chart –
CME/CBOT July 2018 (WN8) SRW Wheat Futures Chart –
U.S. Soybean and SBM Markets Fob Vessel:
CME July 2018 Soybean (SN18) Futures Chart:
CME July 2018 Soybean Meal (SMN8) Futures Chart
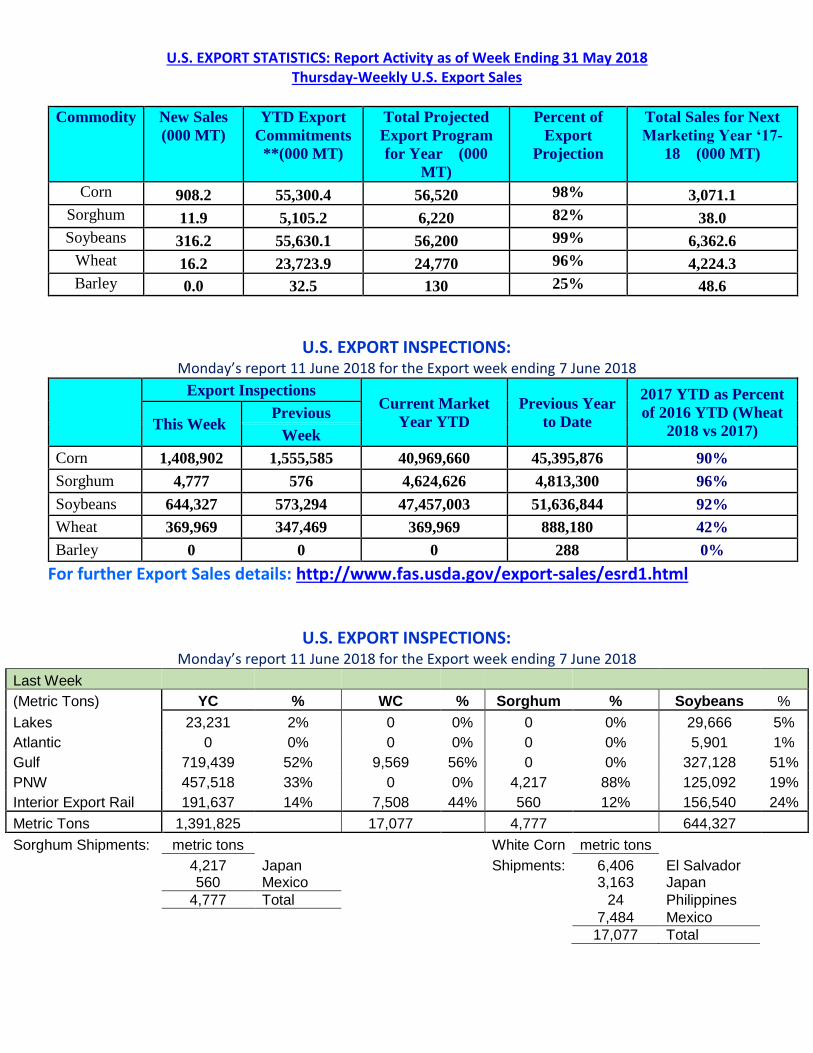
U.S. EXPORT STATISTICS: Report Activity as of Week Ending 31 May 2018 Thursday-Weekly U.S. Export Sales
Commodity New Sales
(000 MT)
YTD Export
Commitments
**(000 MT)
Total Projected
Export Program
for Year (000
MT)
Percent of
Export
Projection
Total Sales for Next
Marketing Year ‘17-
18 (000 MT)
Corn 908.2 55,300.4 56,520 98% 3,071.1
Sorghum 11.9 5,105.2 6,220 82% 38.0
Soybeans 316.2 55,630.1 56,200 99% 6,362.6
Wheat 16.2 23,723.9 24,770 96% 4,224.3
Barley 0.0 32.5 130 25% 48.6
U.S. EXPORT INSPECTIONS: Monday’s report 11 June 2018 for the Export week ending 7 June 2018
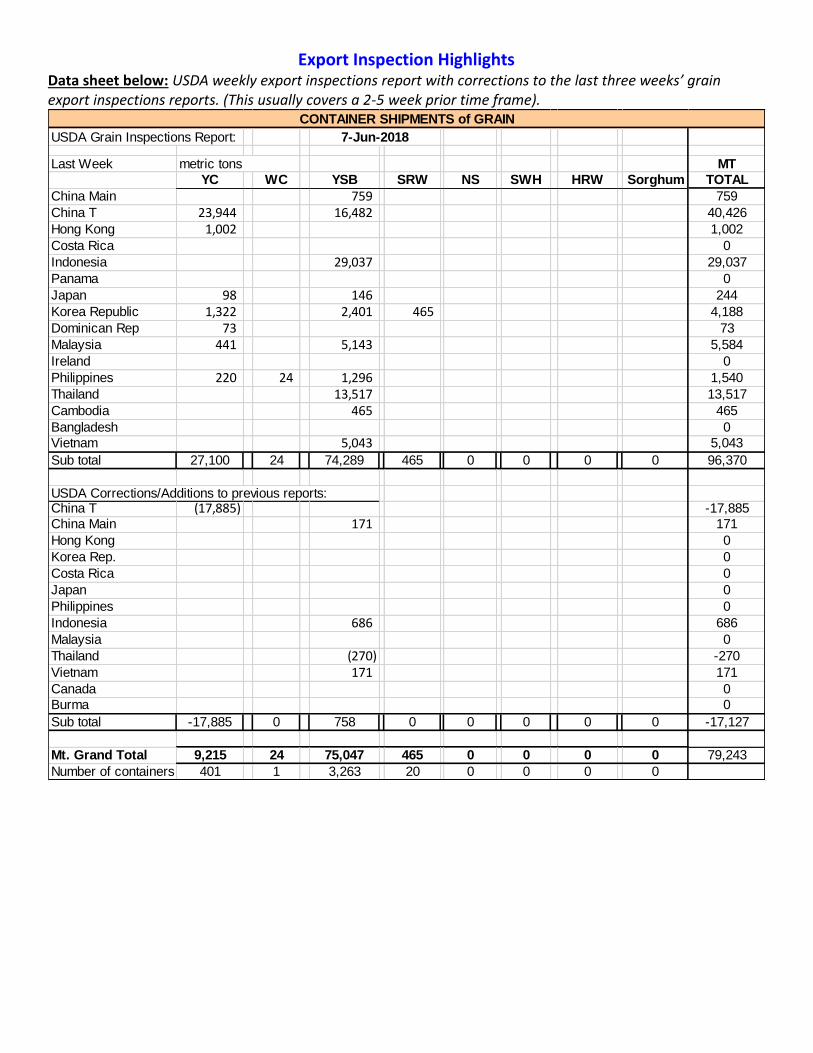
Data sheet below: USDA weekly export inspections report with corrections to the last three weeks’ grain export inspections reports. (This usually covers a 2-5 week prior time frame).
USDA Grain Inspections Report:
Last Week MT
YC WC YSB SRW NS SWH HRW Sorghum TOTAL
China Main 759 759
China T 23,944 16,482 40,426
Hong Kong 1,002 1,002
Costa Rica 0
Indonesia 29,037 29,037
Panama 0
Japan 98 146 244
Korea Republic 1,322 2,401 465 4,188
Dominican Rep 73 73
Malaysia 441 5,143 5,584
Ireland 0
Philippines 220 24 1,296 1,540
Thailand 13,517 13,517
Cambodia 465 465
Bangladesh 0
Vietnam 5,043 5,043
Sub total 27,100 24 74,289 465 0 0 0 0 96,370
USDA Corrections/Additions to previous reports:China T (17,885) -17,885
China Main 171 171
Hong Kong 0
Korea Rep. 0
Costa Rica 0
Japan 0
Philippines 0
Indonesia 686 686
Malaysia 0
Thailand (270) -270
Vietnam 171 171
Canada 0
Burma 0
Sub total -17,885 0 758 0 0 0 0 0 -17,127
Mt. Grand Total 9,215 24 75,047 465 0 0 0 0 79,243
Number of containers 401 1 3,263 20 0 0 0 0
CONTAINER SHIPMENTS of GRAIN
7-Jun-2018
metric tons
Jan - Dec 2017 Annual Totals versus 2018 Jan.-Dec. Year to Date Container Shipments (in MT)
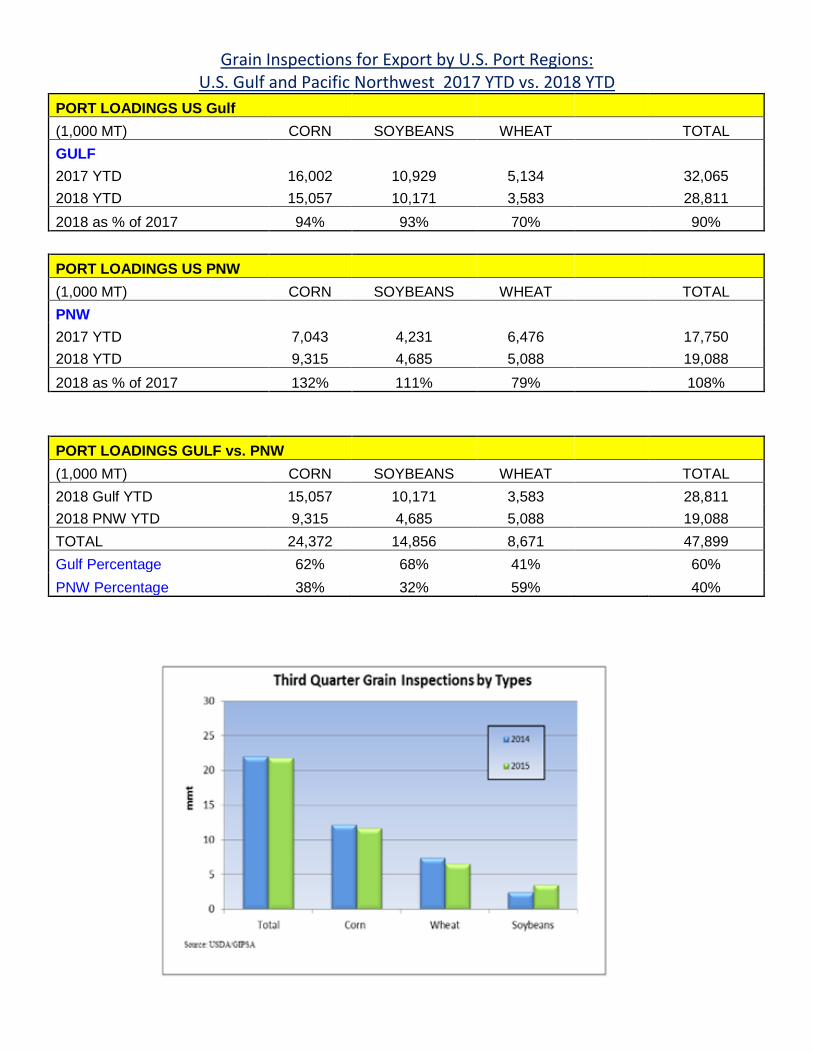
Grain Inspections for Export by U.S. Port Regions: U.S. Gulf and Pacific Northwest 2017 YTD vs. 2018 YTD
PORT LOADINGS US Gulf
(1,000 MT) CORN SOYBEANS WHEAT TOTAL
GULF
2017 YTD 16,002 10,929 5,134
32,065
2018 YTD 15,057 10,171 3,583 28,811
2018 as % of 2017 94% 93% 70% 90%
PORT LOADINGS US PNW
(1,000 MT) CORN SOYBEANS WHEAT TOTAL
PNW
2017 YTD 7,043 4,231 6,476
17,750
2018 YTD 9,315 4,685 5,088 19,088
2018 as % of 2017 132% 111% 79% 108%
PORT LOADINGS GULF vs. PNW
(1,000 MT) CORN SOYBEANS WHEAT TOTAL
2018 Gulf YTD 15,057 10,171 3,583
28,811
2018 PNW YTD 9,315 4,685 5,088 19,088
TOTAL 24,372 14,856 8,671 47,899
Gulf Percentage 62% 68% 41%
60%
PNW Percentage 38% 32% 59% 40%
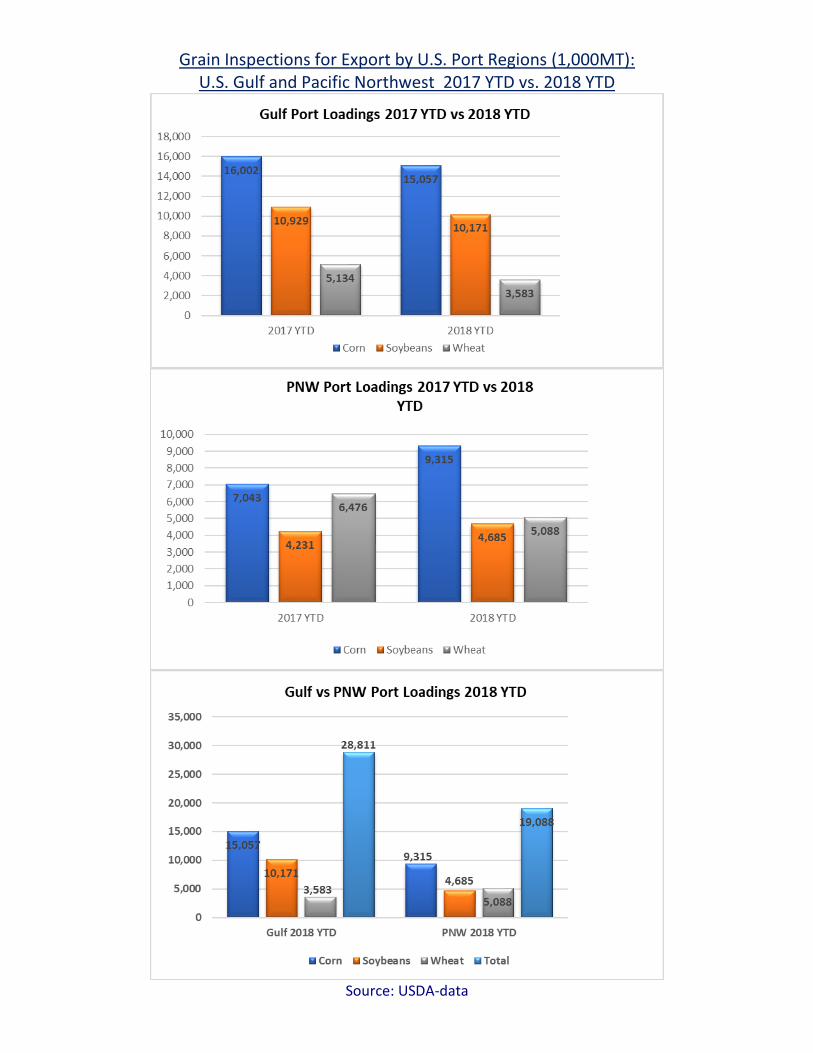
Grain Inspections for Export by U.S. Port Regions (1,000MT): U.S. Gulf and Pacific Northwest 2017 YTD vs. 2018 YTD
Source: USDA-data
2018 YTD Total Grain Exports reported by USDA (in MT)
**Please keep in mind that USDA does not report DDGS sales, or they would show as the
largest exports by container
Source: USDA
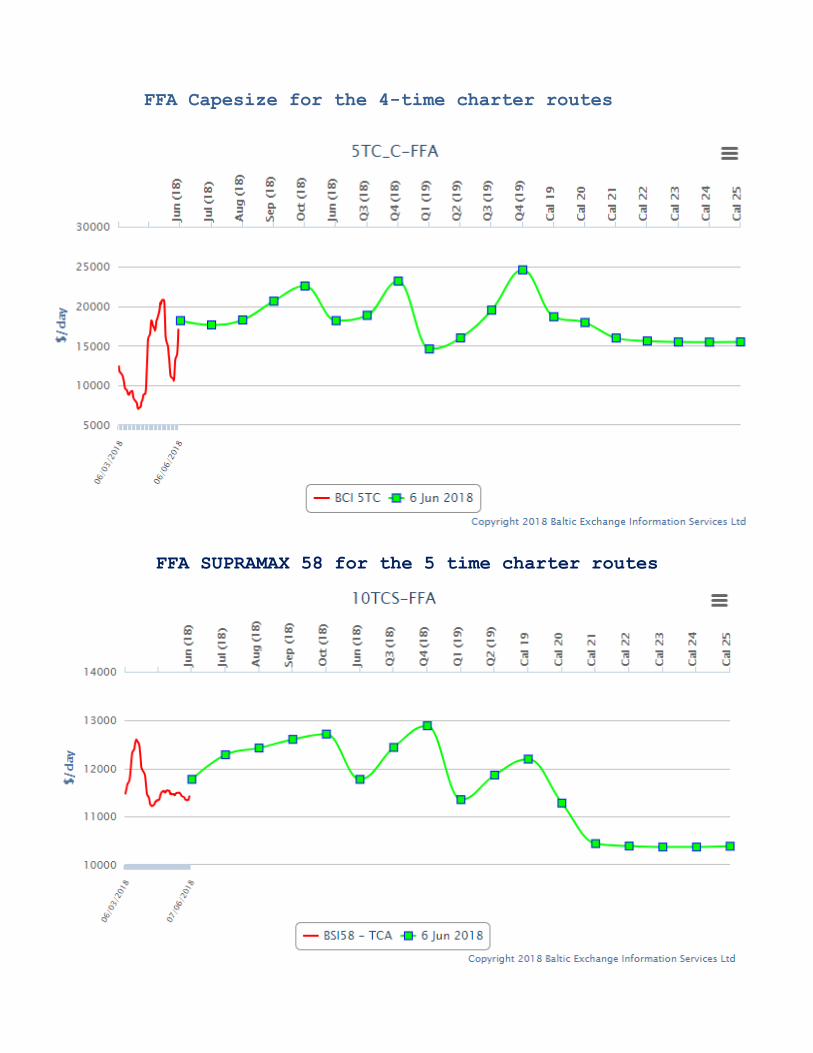
Shipping News
FFA Capesize for the 4-time charter routes
FFA SUPRAMAX 58 for the 5 time charter routes
U.S. RIVER BARGE FREIGHT
Current Barge Freight for Placement Last half July 2018
Secondary Rail Car Market for car placement period: Last Half July 2018.
www.grains.ksu.edu/igp Best Regards,
Jay Jay O'Neil Senior Agricultural Economist IGP at Kansas State University and O’Neil Commodity Consulting 785-410-2303 (cell) 785-532-2868 (office) [email protected]
Follow me on Twitter @ igpjay
*** The information in this market report is derived from sources believed to be reliable
and accurate but can not be guaranteed. Forward looking projections are never completely
accurate, and these markets move quickly.
All market data is subject to change with market conditions and Traders opinions.
Please obtain market updates and reconfirm all values with your regular freight supplier
before making any trading decisions based on this data. This message and any attachments
may contain confidential or privileged information and are only for the use of the
intended recipient of this message. If you are not the intended recipient, please notify
the sender by return email, and delete or destroy this and all copies of this message
and all attachments. Any unauthorized disclosure, use, distribution, or reproduction of
this message or any attachments is prohibited and may be unlawful.
This E-mail is covered by the Electronic Communications Privacy Act, 18 U.S.C. §§2510-