25
BOARD OF DIRECTORS’ REPORT for 2008 fiscal year
| Date post: | 11-Dec-2018 |
| Category: |
Documents |
| Upload: | trinhnguyet |
| View: | 213 times |
| Download: | 0 times |

BOARD OF DIRECTORS’ REPORT for 2008 fiscal year

1 BOARD OF DIRECTORS’ REPORT for 2008 fiscal year
CONTENTS
1. COMPANY’S MANAGEMENT
2. OUTLOOK OF THE ROMANIAN FINANCIAL MARKET IN 2008
Macroeconomic Indicators Monetary Market Capital Market
3. SIF BANAT-CRIŞANA PORTFOLIO MANAGEMENT
3.1. Evolution of Net Asset Value. Portfolio Structure 3.2 Stock Portfolio 3.3. The Portfolio Of Fixed Income Financial Instruments
4. RISK MANAGEMENT
5. RESEARCH ACTIVITIES
6. ORGANIZATIONAL DEVELOPMENT
7. CORPORATE COMMUNICATION
8. INFORMATION TECHNOLOGY
9. PENDING LITIGATIONS
10. INTERNAL AUDIT
11. INTERNAL CONTROL
12. DIVIDEND DISTRIBUTION
13. FINANCIAL RESULTS AS OF DECEMBER 31, 2008
Balance Sheet Extract as of December 31, 2008 Income Statement Cash-Flow
14. 2005-2008 MAJOR FINANCIAL RATIOS
15. NAME AND PROFESSIONAL QUALIFICATION OF THE MEMBERS OF THE BOARD OF DIRECTORS
16. INFORMATION REGARDING THE MAJOR EVENTS OCCURED SINCE THE END OF THE FISCAL YEAR
17. THE BOARD OF DIRECTORS’ PROPOSAL REGARDING THE PROFIT ALLOCATION

2 BOARD OF DIRECTORS’ REPORT for 2008 fiscal year
1. COMPANY’S MANAGEMENT
Societatea de Investiţii Financiare BANAT-CRIŞANA S.A. (further named SIF Banat-Crişana or the Company) is a Romanian legal person, set up as a joint stock company with entirely private capital.
SIF Banat-Crişana operates as a closed-end investment company under the Romanian National Securities Commission (CNVM) regulations, being included in the category of Other Undertakings for Collective Investments (AOPC) with a diversified investment policy (CNVM Certificate no. 258/14.12.2005).
In accordance with its bylaws, company’s management is ensured by a Board of Directors formed of 7 members. The current composition of the Board of Directors and the professional qualification of the members are presented at item 15 in the present report. The current members of the Board of Directors were elected by SIF Banat-Crişana’s Annual General Meeting held on April 23, 2005 for a four years’ term of office.
The Board of Directors’ activity was performed in compliance with the provisions of Company’s bylaws, Company Law no. 31/1990 and Law no.297/2004 regarding the capital market, with the amendments and subsequent supplements.
In 2008, the Board of Directors focused on attaining the strategic goals of growth and profitability, with a continuous emphasis on boosting the efficiency, strengthening risk management and cost reduction.
2. OUTLOOK OF THE ROMANIAN FINANCIAL MARKET IN 2008
Macroeconomic Indicators
At year end 2008, the annual inflation rate measured by the annual consumer price index (December 2007 versus December 2008) was of 6.3%, according to the National Bank of Romania (NBR) report in February 2009.
It is considered that the inflation target for 2008 of 3.8% ± 1% was missed.
The growth rate of GDP computed by the National Institute of Statistics was of 7.1%. The breakdown of growth rate on industries is the following:
- construction 26.1% - agriculture 21.4% - trade, hotels and restaurants 6.6% - industry 1.3%
The current account deficit in GDP for 2008 was estimated by the Romanian Prognosis Commission at 12.2%,
The projected unemployment rate for the end of 2008 was of 5.5% according to the Romanian Prognosis Commission. In 2009, it is expected a rise of unemployment against the decline of industry output, the economic slowdown and the fortuitous execution of more bank guarantees.
The real estate market has already experienced a decline. The growth in the construction industry will probably be of only 6.2% in 2009.
Signs of the current financial and economic crisis were evident in the second half of 2008, thus the Company was unable to attain the overall goals set for 2008 as can be seen in the chapters below.

3 BOARD OF DIRECTORS’ REPORT for 2008 fiscal year
Monetary Market
The monetary policy interest rate was1 of 10.25% at the end of 2008, induced by the need to reduce the risk of the persistence of inflation pressures generated by the RON depreciation, given the deepening of the effects of the global financial crises. In 2008, the rate of return of the interbank market increased in an environment marked by the change of the net position of the liquidity in the domestic banking system.
The average rate of return of new term deposits reached1 15.24%, for non-financial companies, respectively 14.13% (in November) for individuals.
The interest rate1 for new loans granted to non-banking companies was of 20.94% in RON as of December 2008 while for the new credits granted to individuals, the interest was of 17.45% in RON.
The interest rates on public securities continued to rise, reaching 14.25% for treasury certificates and 13% for treasury bonds as benchmark with maturity of 3 and 5 years. Foreign Currency Market
In 2008, the EUR appreciated1 against the RON from 3.5971 RON as of 03.01.2008 to 3.9852 RON for 1 EUR at year end, 10.78% respectively. As for the dollar, the appreciation against the RON amounted from 2.4377 RON for 1 USD as of 03.01.2008 to 2.8342 RON at year-end, 16.26% respectively.
Capital Market1
The Bucharest Stock Exchange recorded a market capitalization of RON 45.7 bn (about EUR 11.6 bn) at the end of 2008, down by 46.8% in RON, and, respectively by 52.7% in EUR as compared to year-end 2007 and an average daily volume of RON 14.65 mn (EUR 3.77 mn).
The BET_C index depreciated by 70.3% at the end of 2008 compared to the end of 2007, the BET index by 70.4%, the BET_FI index by 84% and the ROTX index by 69.6%.
The PER of the Bucharest Stock Exchange in 2008 was of 4.11, in a sharp decline as compared to 2007 (19.21). The global dividend yield was of 8.57% superior against 2007, of 2.18%. The PBV ratio of the Bucharest Stock Exchange market in 2008 was of 0.76, lower than in 2007 (3.03).
The Exchange segment - RASDAQ recorded at the end of 2008 a market capitalization of RON 12 bn, as compared to RON 24.4 bn at year-end 2007, respectively a decrease by 50%, a trade volume of only RON 1,562 mn (compared to RON 4,254 mn in 2007), achieved in 372,118 trades, compared to 668,118 trades in 2007. The visibility and capitalization of issuers on RASDAQ registered a steep decline as compared to 2007.
1General information sources: Bulletin 12/2008, Bucharest Stock Exchange and National Bank of Romania

4 BOARD OF DIRECTORS’ REPORT for 2008 fiscal year
3. SIF BANAT-CRIŞANA PORTFOLIO MANAGEMENT 3.1. EVOLUTION OF NET ASSET VALUE. PORTFOLIO STRUCTURE.
SIF Banat-Crişana’s portfolio management complies with CNVM regulations regarding the prudential criteria for the assets category and the ownership limits.
The portfolio management techniques rely on the main principles of economic and financial analysis and valuation. Over the last years, the scope of the investment analysis was enlarged, developing proprietary models of analysis and portfolio management.
As of December 31, 2008, SIF Banat-Crişana’s total asset value2 under management was of RON 1,093,761,348, lower by 47.07 % as compared to the same period in 2007.
The effects of the international financial crisis over the Romanian capital market generated a sharp fall in stock prices in 2008, the drop being severely exacerbated at the beginning of September, causing a sharp reduction in the market value of the managed portfolio. Under the circumstances, the value of SIF Banat-Crişana’s holdings in listed issuers decreased by 60.17% in December 2008 as compared to December 2007.
The value of unlisted stocks presented an upward trend, appreciating by 19.84% compared to the previous year, due to the fact that the financial results of these issuers as of June 2008 were reflected in the computation of net asset, results superior to the similar period in 2007.
The low return of short-term deposits in the first 10 months of 2008 determined the decrease of their weight in the portfolio.
The money instruments recorded an upward trend generated by their positive return, except the municipal bonds whose decrease was determined by their maturity.
SIF Banat-Crişana’s net asset value3 was of RON 1,011,256,968 at year-end 2008. NAV decreased by 50.06 % compared to 2007. This depreciation was mainly due to the sharp reduction in the market value of the total asset as compared to the previous year.
Correponding to net asset, the net asset value/share4 was of 1.8425 RON per share as of December 31, 2008.
2 Computed according to C.N.V.M.Regulation no. 15/2004 3 Computed according to C.N.V.M. Regulation no. 15/2004 4 Computed according to C.N.V.M.regulation no. 15/2004
20251914
1839 1779 1730 1701 1704 16771600
1477
12981182
1011
0
500
1000
1500
2000
Graficul evoluţiei valorii activului net al SIF Banat-Crişanaîn perioada dec. 2007 - dec. 2008miloane lei
EVOLUTION of SIF BANAT-CRIŞANA’s NET ASSET VALUE December 2007 – December 2008

5 BOARD OF DIRECTORS’ REPORT for 2008 fiscal year
The structure of SIF Banat-Crişana assets under management in 2008:
SIF BANAT-CRIŞANA PORTFOLIO
December 31, 2007 June 30, 2008 December 31, 2008 Annual
variation RON weight
in net asset value
RON weight in net asset
value
RON weight in net asset value
Public securities, treasury certificates
0 0% 6,962,459 0.39% 2,440,930 0.22%
Cash 120,803 0.01% 173,787 0.01% 152,494 0.01% 26.23% Receivables 11,816,748 0.57% 23,378,059 1.31% 6,417,948 0.59% -45.69% Bank deposits 82,843,735 4.01% 67,040,181 3.76% 28,495,700 2.61% -65.60% Municipal bonds 173,470 0.01% 107,533 0.01% 95,516 0.01% -44.94% Corporate bonds 5,267,954 0.25% 6,210,800 0.35% 6,390,289 0.58% 21.30% Listed shares 1,628,409,209 78.80% 1,305,713,191 73.27% 648,666,278 59.31% -60.17% Unlisted shares 328,848,557 15.91% 363,914,424 20.42% 394,081,096 36.03% 19.84% Other assets 8,901,274 0.43% 8,513,160 0.48% 7,021,096 0.64% -21.12% Total assets 2,066,381,750 100% 1,782,013,595 100% 1,093,761,348 100% -47.07% Total liabilities 41,562,553 2.01% 77,681,935 4.36% 82,504,379 7.54% 98.51% Net asset 2,024,819,197 97.99% 1,704,331,660 95.64% 1,011,256,968 92.46% -50.06% Net asset value/share 3.6892 3.1053 1.8425 -50.06%
As of December 31, 2008, SIF Banat-Crisana’s assets under management complied with the prudential limits set forth by C.N.V.M Regulation no 15/2004. 3.2 STOCK PORTFOLIO As of 31.12.2008, the stock portfolio represented 95.34% in the total value of SIF Banat-Crişana’s assets under management.
The stock portfolio management focused on attaining corporate growth and profitability goals set forth in 2008 operation plan.
The worldwide crisis influenced strongly the Romanian capital market, generating a general plunge in stock prices on BSE due to a reduced liquidity and high volatility.
Under the circumstances, SIF Banat-Crişana adopted a prudent investment strategy. The sharp drop in stock prices offered some buy opportunities that generated investments in an amount of RON 77.6 mn in 2008, exceeding by 5.77% the projected level.
However, the general drop in prices had a negative impact on the return on sales and it determined a substantial reduction in the sales plan projected by SIF Banat-Crişana for 2008. The stock portfolio value was also negatively affected, thus diminishing on a whole by 46.7% as compared to the previous year, the first decline after a stable increase over the last nine years.
Main indices of portfolio management:
2008 Goals Projected for 2008 Achieved in 2008 Percentage of achievement
Investments (RON) 73,400,000 77,633,393 105.77%
Revenues from dividends* (RON) 42,000,000 45,779,190 109.00%
Revenues from sales (RON) 105,008,529 19,914,130 18.96%
Profit relative to sales (RON) 64,730,674 13,937,935 21.53%
*Represents only the cash dividends
6 BOARD OF DIRECTORS’ REPORT for 2008 fiscal year
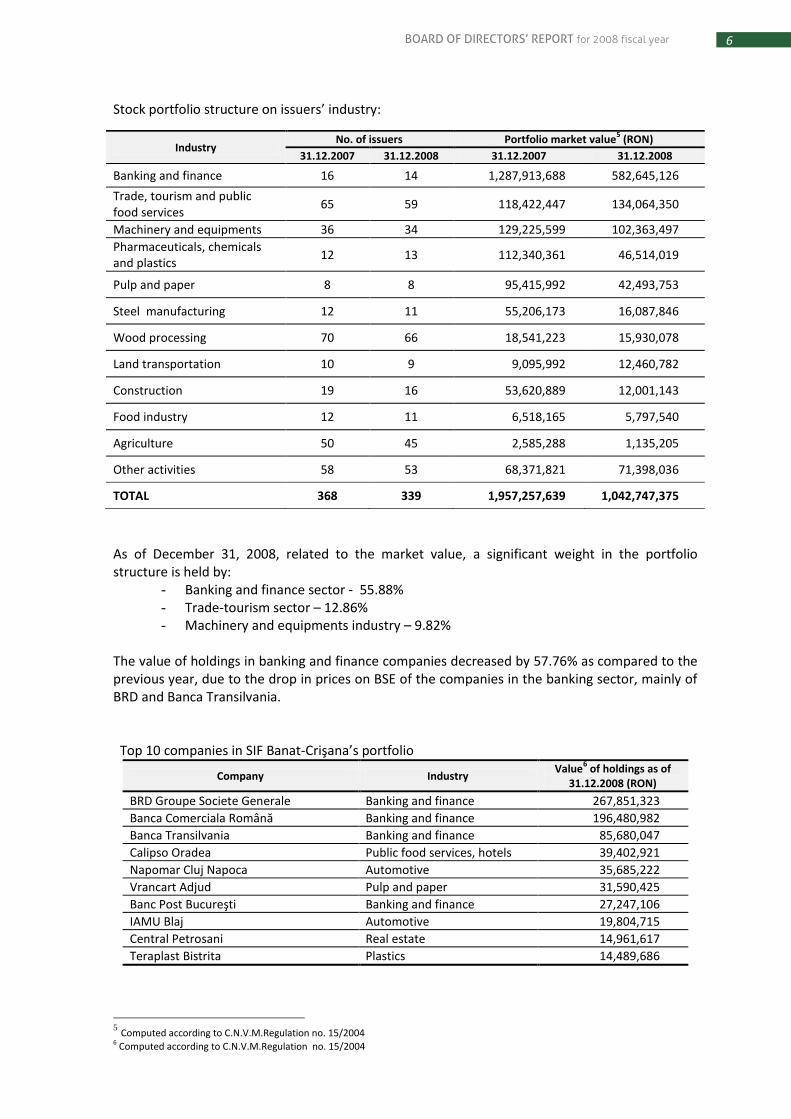
Stock portfolio structure on issuers’ industry:
As of December 31, 2008, related to the market value, a significant weight in the portfolio structure is held by:
- Banking and finance sector - 55.88% - Trade-tourism sector – 12.86% - Machinery and equipments industry – 9.82%
The value of holdings in banking and finance companies decreased by 57.76% as compared to the previous year, due to the drop in prices on BSE of the companies in the banking sector, mainly of BRD and Banca Transilvania. Top 10 companies in SIF Banat-Crişana’s portfolio
Company Industry Value
6 of holdings as of
31.12.2008 (RON)
BRD Groupe Societe Generale Banking and finance 267,851,323
Banca Comerciala Română Banking and finance 196,480,982
Banca Transilvania Banking and finance 85,680,047
Calipso Oradea Public food services, hotels 39,402,921
Napomar Cluj Napoca Automotive 35,685,222
Vrancart Adjud Pulp and paper 31,590,425
Banc Post Bucureşti Banking and finance 27,247,106
IAMU Blaj Automotive 19,804,715
Central Petrosani Real estate 14,961,617
Teraplast Bistrita Plastics 14,489,686
5 Computed according to C.N.V.M.Regulation no. 15/2004
6 Computed according to C.N.V.M.Regulation no. 15/2004
Industry No. of issuers Portfolio market value
5 (RON)
31.12.2007 31.12.2008 31.12.2007 31.12.2008
Banking and finance 16 14 1,287,913,688 582,645,126
Trade, tourism and public food services
65 59 118,422,447 134,064,350
Machinery and equipments 36 34 129,225,599 102,363,497
Pharmaceuticals, chemicals and plastics
12 13 112,340,361 46,514,019
Pulp and paper 8 8 95,415,992 42,493,753
Steel manufacturing 12 11 55,206,173 16,087,846
Wood processing 70 66 18,541,223 15,930,078
Land transportation 10 9 9,095,992 12,460,782
Construction 19 16 53,620,889 12,001,143
Food industry 12 11 6,518,165 5,797,540
Agriculture 50 45 2,585,288 1,135,205
Other activities 58 53 68,371,821 71,398,036
TOTAL 368 339 1,957,257,639 1,042,747,375

7 BOARD OF DIRECTORS’ REPORT for 2008 fiscal year
Portfolio structure on listed and unlisted companies:
Portfolio structure No.of companies Portfolio market value7 (RON)
31.12.2007 31.12.2008 31.12.2007 31.12.2008
Listed companies 144 136 1,628,409,209 648,666,278
Unlisted companies 224 203 328,848,430 394,081,097
Total portfolio 368 339 1,957,257,639 1,042,747,375
Against the escalation and prolongation of the effects of the global financial and economic crisis, 2008 was one of the hardest years on the capital market in Romania, the BSE indices undergoing dramatic plunges. In this year, the BSE reference index, BET lost 70.4%, the composite index, BET-C, recorded a decrease by 70.3%, BET-FI lost 84%. All the stocks traded on BSE closed out 2008 at negative returns. These circumstances embody the basic factor that generated the decrease in value of SIF Banat-Crişana holdings in listed companies, recording a fall by 60.7% at the end of December 2008 as compared to December 2007.
At the same time, the market value of the portfolio consisting of unlisted (closed) companies, whose value is computed relative to the total shareholders equity, appreciated by 19.8% in 2007.
Despite the worsening economic conditions in Q4, many portfolio companies posted good financial results especially for the first three quarters.
Portfolio structure on the size of the stakes held in the share capital of the issuers:
Holding category No.of issuers Portfolio market value7 (RON)
31.12.2007 31.12.2008 31.12.2007 31.12.2008 Under 5% 89 89 1,177,835,394 399,158,155
5-33% 228 206 521,752,039 371,347,285
33-50% 14 10 3,971,499 3,624,644
Over 50% 37 34 253,698,707 268,617,291
Total portfolio 368 339 1,957,257,639 1,042,747,375
As regards the portfolio structured on the size of stakes, the value of holdings under 5% in the share capital of the issuers recorded a sharp decline by 66.1% in 2008 compared to 2007. This category comprises important stakes in companies listed on BSE, recording a sharp drop in prices.
The number of issuers decreased by 22 in the 5-33% holding category as a result of:
the sale of the entire stakes held in 8 companies;
the exit of 14 companies from portfolio due to the completion of winding up procedures started in the previous years and to the striking-off of these companies in the Trade Register.
At year-end 2008, SIF Banat-Crişana held majority stakes in 34 issuers, compared to 37 in 2007. The three exits from majority stakes were represented by:
sale of a company (Dacia Meridian SA Hunedoara)
merger between Comalim Arad and SC Resapare Reparare Anvelope Arad
strike-off in the Trade Register of SC Comcereal Bistrita as a result of the completion of the winding up procedure started in the previous years.
A special focus was given to the close monitoring and analysis of the majority stakes to ensure the performance of these companies, implementing well structured development programs and a competitive management.
The management consulting provided by SIF Banat-Crişana’s experts contributed to the strong results of portfolio companies. Thus, out of the 34 majority holdings, in case of 9 companies the net profit rose by 20% in 2008 fiscal year as compared to the previous year.

8 BOARD OF DIRECTORS’ REPORT for 2008 fiscal year
In 2008, the general managers in 3 majoritary holdings were dismissed for poor results.
Throughout 2008, SIF Banat-Crişana launched and coordinated several merger projects of the majority holdings. The main aims of these projects were to cut down the administrative costs and to create stronger and more efficient companies economically and financially. These project were:
Merger of SC Comalim SA Arad (merging company) with SC Resapare, Reparare Anvelope SA Arad (merged company), concluded in 2008;
Merger of SC Arta Culinara SA Cluj Napoca ( merging company) with SC Pelicanul Mărăşti SA, SC Orizont Observator SA and SC Bistriţa SA ( merged companies), started in 2008.
In 2008, the revenues from the dividends due from the portfolio companies (for 2007 fiscal year) amounted to RON 45,779,190. Until the end of the year, the amount of RON 44,545,338 was collected, representing 97.30%.
SIF Banat-Crişana also recorded revenues generated by the share capital increases from issue premiums or the reserves set up from the net profit made by portfolio companies in amount of RON 33,732,191, by 45.8% over 2007.
Capital Market Transactions
In 2008, the company offered for sale mainly the companies that do not meet any longer the portfolio criteria, aiming at selling these businesses at the best price. The sales sequence of these underperforming companies was determined by the absorbtion capacity of the market.
The stakes sold in 2008 amounted to RON 19,914,130. Out of the total sale value, 66.73% was represented by the transactions concluded on the regulated market, 10.62% transactions with the stocks held in unlisted companies, 23% transactions where SIF Banat-Crişana expressed its withdrawal option due to their delisting/merger.
Throughout 2008, SIF Banat-Crişana exited in 17 issuers.
SIF Banat-Crişana launched 6 public offerings, out of which 2 were successfully completed ( Saif Tim Timişoara and TCI Invest SA Cluj Napoca).
In case of unlisted companies, SIF Banat-Crişana organized tenders for the sale of 6 companies; one transaction was concluded (Dacia Meridian SA Hunedoara).
Significant transactions were registered from the sale of stocks held in: TCI Invest Cluj Napoca – RON 4,614,780, Socep Constanta – RON 3,206,060, SAIF TIM Timişoara – RON 2,659,370, Unirea Universal Alba Iulia – RON 2,440,270, Azomureş Târgu Mureş – RON 1,780,591, Drăgana Cugir – RON 1,558,760, Dacia Meridian Hunedoara – RON 1,482,278.
Investments
The investments made in 2008 targeted the strategic goals to deliver more value to the portfolio, being performed both on the primary capital market by participation in share capital increases and seizing the investment opportunities offered by the secondary market (on the Bucharest Stock Exchange and the Rasdaq Electronic Exchange or through direct transactions).
Throughout 2008, the investments concluded amounted to RON 77,633,393 while at the end of 2008 the investments projects in progress amounted to RON 760,705.

9 BOARD OF DIRECTORS’ REPORT for 2008 fiscal year
The structure of investments on industries is presented in the graph below :
Significant investments made in 2008:
Direct acquisitions on BVB: BIOFARM Bucureşti – RON 6,699,851, PETROM Bucureşti – RON 6,347,051, BRD SOCIETE GENERALE – RON 4,030,206, COMELF Bistriţa – RON 3,282,768, IPROEB Bistriţa – RON 2,974,366, SNTGN TRANSGAZ Sibiu – RON 2,983,736, ARGUS Constanţa – RON 2,033,370 and ROMPETROL WELL SERVICES – RON 1,967,454.
Following the IPO performed in 2007, the conversion of allocation rights into shares in SNTGN TRANSGAZ was concluded in January 2008; being allocated stocks in value of RON 767,680.
Acquisitions on the primary market by participation in two IPOs: CONTOR GROUP Arad where the acquisition value of the shares allocated amounted to RON 990,386 and TERAPLAST GP Bistriţa where the acquisition value of the shares allocated amounted to RON 1,448,105.
Participation in share capital increases of the following portfolio companies: CALIPSO Oradea - with RON 10,950,000, BANCA TRANSILVANIA – with RON 5,346,721, NAPOMAR Cluj – with RON 7,651,950, CENTRAL Petrosani – with RON 4,319,192, COMPLEX LABORATOARE Cluj – with RON 3,900,000.
Investments made in 2008 on the primary capital market (participations in share capital increases):
Industry No.of companies
Investment value (RON)
Banking and finance 7 6,200,740
Trade-tourism 1 10,950,000
Construction 2 1,401,468
Real estate 3 8,244,192
Machinery and equipments 1 7,651,950
Chemicals and plastics 1 1,448,105
Others 8 2,477,019
Total 23 38,373,474
Chemicals and plastics4% Food industry
3%Other activities
15%
Banking and finance15%
Trade, tourism15%Extraction industry
8%
Pharmaceuticals9%
Real estate11%
Machinery and eqpt.20%

10 BOARD OF DIRECTORS’ REPORT for 2008 fiscal year
Investments made in 2008 on the secondary market (acquisitions of stocks listed on the Bucharest Stock Exchange and Rasdaq Electronic Market through direct transactions):
Industry No.of companies Investment value (RON)
Banking and finance 5 5,874,642
Extraction industry 1 6,347,051
Pharmaceuticals 2 6,723,851
Machinery and equipments 6 7,962,885
Others 30 12,351,490
Total 44 39,259,919
3.3. THE PORTFOLIO OF FIXED INCOME FINANCIAL INSTRUMENTS
The investments made in fixed income financial instruments contributed to the prudent diversification of the portfolio with positive effects on profitability.
SIF Banat-Crişana management applies an investment policy focused on the return-risk concept complying with the legal requirements of prudential diversification of the portfolio. The investment selection criteria in fixed income financial instruments rely on the achievable return, the correlation of the fixed income instruments maturity with Company’s necessary liquidity and the issuers’ creditworthiness.
In 2008, the main goals for this class of assets were:
- realizing positive returns to RON-denominated deposits;
- diversification of monetary investments by investing in the financial instruments offered by the domestic and international monetary market that comply with SIF Banat-Crişana’s strategy regarding the return/risk ratio.
In 2008, the average annual return of monetary investments was of 9.3% against the annual inflation of 6.3%.
The return realized at USD-denominated investments was of 6.4% versus the average LIBOR rate of 3.1% for the same period.
Under current conditions facing mergers and state capital injections to ensure a stable banking system, we focused on diminishing the liquidity and interest rate risks.
Risk dispersion was achieved by the diversification of monetary investments and the acquisition of financial instruments issued by banks in Romania and the European Union, that offered the best returns.
Monetary investments were made in the following main banks: Alpha Bank, Banca Comercială Română, BRD - Groupe Societe Generale, Bancpost, Banca Transilvania, Erste Bank, ING Bank, Procredit Bank.

11 BOARD OF DIRECTORS’ REPORT for 2008 fiscal year
The structure of investments in fixed income financial instruments as at December 31, 2008 is presented in the table below:
Type of investment Value of investment (RON) Weight in total
investments
Bank deposits 27,672,585 76.00%
Municipal bonds 93,639 0.26%
Corporate bonds on the primary market 4,548,500 12.49%
Corporate bonds on the secondary market 990,000 2.72%
Corporate bonds in foreign currency* on the primary market 708,550 1.95%
Treasury certificates 856,110 2.35%
REPO with treasury certificates 1,543,159 4.24%
Total investments 36,412,543 100% *computed at RON/USD exchange rate announced by NBR as of 31.12.2008
4. RISK MANAGEMENT
In terms of the nature of the business activity, the Company is exposed to some financial risks, namely: foreign currency risk, interest rate risk, credit risk, liquidity risk, cash flow risk, economic environment risk.
In 2008, as a result of the global financial crisis that has affected Romania as well, we witnessed a sharp depreciation of stock prices on BSE. As SIF Banat-Crişana holds a large number of listed stocks in its portfolio, the Company was strongly affected by the price risk.
The financial assets that expose the Company to potential risks concentrations comprise mainly the receivables from the main activity. These are presented in the balance sheet at the net value of the write-down for doubtful receivables. Company’s management monitors closely and constantly the credit risk exposal to prevent losses due to the concentration of credit in a specific sector or activity field.
Romania’s economy continues to display the characteristics specific to an emergent economy, presenting a degree of uncertainty regarding the development of the economic and social environment in the future. The Company is concerned about the assessment of the changes that will occur in the economic environment and their effects on the financial condition and the results of the Company. 5. RESEARCH ACTIVITIES
The main research directions and themes in 2008 were:
The development of market research and investment analysis programs and models; In order to support the investment decisions, sector analysis were performed and permanent activities were undertook to monitor and research the domestic and international capital market. The screening application was updated for a fast preliminary selection of some issuers; it was implemented a tool to monitor and analyze statistically the evolution of key foreign markets; studies were conducted to set the efficient frontier and to adopt an adequate investment strategy; applications dedicated to portfolio management were implemented as well.
Risk management – implementing the VaR calculation for the classes of active and liquid assets and further designing the risk matrix;
12 BOARD OF DIRECTORS’ REPORT for 2008 fiscal year
The results of the research activity, gathered in original scientific papers, of interest for the academic community in Romania, were presented at several scientific events held in 2008: the scientific session – Piata de capital (Equity Market), 6th edition, organized in Arad by SIF Banat-Crişana and the West University of Timisoara; “the Academic Days of Arad”, organized by the Vasile Goldis West University of Arad, held in May in Arad; “Valuation of the Capital Market” organized by the Academy of Economic Studies in Bucharest and the National Association of Romanian Valuers in June in Bucharest; “Valuation of Intangible Assets” organized by the National Association of Romanian Valuers at Iasi in the same month; the 3rd World Valuation Congress organized in Bucharest in September by WAVO (the World Association of Valuation Organizations) and the National Association of Romanian Valuers in September.
6. ORGANIZATIONAL DEVELOPMENT 2008 highlights:
Business organization and operation
The stock portfolio restructuring and the change in shareholders structure in several counties were the driving forces for business reorganization, namely the close down of SIF Banat-Crişana branches in: Alba Iulia, Oradea, Baia Mare, Zalău and Timişoara. The activities of these branch offices were redistributed.
The amendments to the Articles of Incorporation regarding the strike off the branch offices were authorized by CNVM Endorsement no. 50/15.10.2008.
Procedures /information flows
In order to improve the business operations, the Board of Directors approved 2 new procedures (one regarding the organization of general meetings of shareholders, the other regarding the aspects of internal regulation) and the review of other 5 procedures, with a view to comply with the legal changes and/or to enhance the operation flows.
At the end of 2008, 41 internal procedures were in force, thus ensuring an efficient information flow and strengthening the internal control.
Human resources development
In light of enhancing the professional development of the employees, 60 persons (68% of the total staff) attended business-related courses and workshops, covering the following fields: derivative market on BSE, preparing and disclosing the reports of the issuers traded on the regulated market BSE, corporate branding, audit, information security management audit, valuation, labor protection, trade law, labor law, organizational management, internal audit, communication strategies and the management of investors relation.
7. CORPORATE COMMUNICATION
SIF Banat-Crişana constantly aimed at complying with the corporate governance principles, ensuring an impartial treatment of all shareholders and an efficient communication with the financial community and the media.
The promoted communication campaigns met the transparency principles, by an accurate and timely disclosure of rigorous and quality information regarding the company activity and the

13 BOARD OF DIRECTORS’ REPORT for 2008 fiscal year
results obtained, reflecting the true image of the company, also targeting to better position on the market.
Being a socially responsible company, SIF Banat-Crişana assumes responsibilities not only towards its investors but also towards the local community and other groups interested. Thus, SIF Banat-Crişana proposes to contribute to the sustainable development and performance of the society.
8. INFORMATION TECHNOLOGY IT provided the support for improving the operational efficiency, sustaining the management processes.
In 2008, the main goals achieved were the following: - development of the electronic voting application for AGM - development of new applications regarding the human resources management - launching the new program development platform - replacing the entire computer network at the headquarters - improvement of over 25% of currently used applications.
9. PENDING LITIGATIONS As at December 31, 2008, the Company was involved in 187 litigations in courts. Out of the 187 litigations, SIF Banat-Crişana is plaintiff in 162 litigations and defendant in 25 litigations. Most of the litigations have as purpose cancellations of the resolutions of the general meetings of shareholders of portfolio companies (59 litigations) and recoveries of dividends (22 litigations). Throughout 2008, 27 litigations were solved and the amounts recovered through court decisions and forced execution amounted to RON 572,112.
The purpose of the resolutions of the general meetings of shareholders attacked in court is mainly increases or decreases of the share capital, spin-offs or dissolutions, as well as the sale of company assets in violation of the law and social interest. The Company decided to take legal action as the decisions of the general meetings of shareholders had been taken in disregard of the legal provisions and articles of association in what concerns the legal and statutory formalities regarding the convening and holding the general meetings, the preference right in increasing the share capital but also the excessive exertion of the rights of the majority shareholders, etc.
Other litigations in court regard the insolvency procedure in which SIF Banat-Crişana is either creditor or shareholder of the companies facing the insolvency procedure.
The last category of files consists of litigations in which SIF Banat-Crişana is defendant in files regarding claims or indemnification under Law 10/2001 or other normative acts that regulate the reinstatement of the property act of some assets of the companies in which SIF Banat-Crişana is or has been shareholder.
10. INTERNAL AUDIT The internal audit activity was carried out according to the 2008 audit plan approved by the Board of Directors. The audit plan was prepared in accordance with the company goals aiming at encompassing all the activities and operations performed by the company over the past two years, ensuring audit continuity.
The 2008 internal audit plan was prepared and approved by the Board of Directors with a view to cover many of the functional structures of the company.

14 BOARD OF DIRECTORS’ REPORT for 2008 fiscal year
The internal audit objectives are:
supporting the company to identify and valuate the significant risks with the purpose to submit an independent valuation of risk management, control and management processes
assisting the company in maintaining an efficient and effective control system
The main corporate activities and operations audited in 2008 were: - the management of the portfolio consisting of financial assets, the core incentives for
investment/divestment decisions and compliance with the approved competence limits; - securities trading, compliance with the short term investment policy and the approved
work procedures; - computation of net asset value, assets structure and compliance with the maximum
thresholds permitted, valuation of assets and liabilities according to CNVM regulations; - compliance with the provisions of the collective labor agreement, human resources
management, employees payroll; - monitoring and collecting the dividends from portfolio companies; - compliance with the procedures and legal regulations regarding drawing up, release and
disclosure of mandatory reports; - compliance with the procedure regarding the distribution of SIF Banat-Crisana dividends; - general inventory of the patrimony at the end of 2008; - compliance with the work procedures regarding the economical and administrative
activities - the compliance of branch offices with the internal regulations, work procedures and any
decision set forth by the Company management. The internal auditor prepared and submitted to SIF Banat-Crişana Board of Directors 17 periodic reports, comprising the results of the audits, the conclusions, recommendations, proposals and opinions. The auditor did not identify any material situations to be mediated by the Board of Directors.
In the internal auditor’s opinion, the audited activities and operations performed by SIF Banat-Crişana in 2008 are complying with Company’s policies, programs and management, the legal provisions and the internal regulations.
11. INTERNAL CONTROL
The Internal Control activity was carried out in accordance with the provisions of 2008 Inspection and Control Plan, approved in SIF Banat-Crişana’s Board of Directors meeting on January 25, 2008, the provisions of CNVM Regulation no. 15/2004, the working procedures and the internal regulations.
The action lines were: the control of the compliance with the regulations specific to the capital market and/or the internal procedures, keeping informed the company and the staff with the legal status of the capital market, endorsement of the documents sent by SIF Banat-Crişana to CNVM in order to obtain the authorizations provided by CNVM regulations, endorsement of the reports sent to other entities and CNVM, endorsement of Company’s information and advertising materials, other activities regarding the compliance of the company and its staff with the capital market laws in force and the internal regulations.
In 2008, the control activity reviewed the compliance with the working procedures and the capital market laws of the following activities: securities trading, computation and payment of 0.1% of the net asset to CNVM, transmission of reports and electronic reporting, compliance with the legal provisions regarding the persons having access to privileged information.

15 BOARD OF DIRECTORS’ REPORT for 2008 fiscal year
The findings revealed that the activities controlled comply with the laws in force, the regulations and the internal procedures. Further to control findings, proposals and recommendations were made to improve the activity and the working procedures.
12. DIVIDEND DISTRIBUTION
The payment of due dividends for 2007 fiscal year to SIF Banat-Crişana’s shareholders started on June 9, 2008. As of December 31, 2008, RON 23.3 mn were paid, out of the total dividends to be paid in amount of RON 33.5 mn, representing a percentage of payment of 71.2 %.
The dividend payment was performed according to the procedure approved by The Board of Directors; the dividend payment schedule as of December 31, 2008 is presented in the table below:
TOTAL DUE
DIVIDENDS FOR
2007
PAYMENT
By postal order
By bank transfers to natural persons
By bank transfers to
legal persons
Cash payments at cashier desks and by postal
order, by request
Payments to shareholders holding less
than 200 shares
Dividends to be paid (mn.RON)
33.487 6.121 5.736 15.061 3.852 2.717
Dividends paid (mn.RON)
23.839 5.820 5.150 12.720 0.148 0.0007
Payment percentage
71.19% 95.08% 89.78% 84.46% 3.84% 0.025%
RON 0.57 mn were paid in 2008, representing the due dividends for 1998-2006 fiscal years.
As of December 12, 2008, the dividend status on shareholders by category for 1998 – 2006 fiscal years paid until the above mentioned date is the following:
SHAREHOLDERS BY CATEGORY
Romanian natural persons
Non-resident natural persons
Romanian legal persons
Non-resident legal persons
Total dividends to be paid (mn RON) 138.824 5.031 13.644 16.091
Dividends paid (mn RON) 104.056 4.869 13.242 15.701
Payment percentage 74.96% 96.78% 97.05% 97.58%

16 BOARD OF DIRECTORS’ REPORT for 2008 fiscal year
13. FINANCIAL RESULTS AS OF DECEMBER 31, 2008
The financial statements as of December 31, 2008 were prepared according to CNVM Order no. 75/2005 regarding the approval of accounting regulations in compliance with the 4th EEC
Directive, amended .
Balance Sheet Extract as of December 31, 2008
- RON -
Indices
31 December
31 December
2007
2008
A. Fixed assets - total, out of which:
467,272,327
510,567,493
Financial assets
460,546,182
504,052,619
B. Current assets - total, out of which:
103,191,358
42,640,670
Receivables
94,785,931
38,643,189
Short-term financial investments
8,277,779
3,841,750
C. Prepayments
122,138
124,389
D. Payables within one year
41,230,164
46,160,481
E. Net current assets, net current liabilities
61,743,957
(4,111,210)
F. Total assets minus current liabilities
529,016,179
506,456,199
G. Payables in more than one year
35,628,110
H. Provisions
61,922,049
57,196,164
I. Deferred income
339,480
715,872
J. Capital and reserves I. Capital
54,884,927
54,884,927
III.Revaluation reserves
5,315,884
5,260,458
IV. Reserves - total
387,463,431
361,433,504
1. Legal reserves
10,976,985
10,976,985 2. Reserves set up from write-down of financial
assets**
-
(110,705,896)
3. Other reserves
376,486,446
461,162,415
V. Result carried forward***
(103,384,386)
(103,384,386)
VI. Result of fiscal year
122,814,274
95,437,422
Profit allocation
Total equity
467,094,130
413,631,925
** Reserves set up from the write-down of financial assets in amount of RON -110,705,896 for 2008 fiscal year, recorded under CNVM Order no. 75/2005 for the approval of Accounting Regulations in compliance with the 4
th EEC Directive, amended*.
*** The result carried forward in amount of RON -103,384,386 arising from the application of the Accounting Regulations in compliance with the 4
th EEC Directive in 2006.
As of December 31, 2008, the total assets represent 97% of the assets existing at the beginning of the year. The diminish is generated mainly by the recording of portfolio write-down, set on December 31, 2008.
The volume of financial assets, having a weight of 91% in total assets, presents an increase by 9.4% against the beginning of 2008, as a result of the following influences:
- investments made (acquisitions on the stock market, participation in the share capital increases performed by the companies in SIF portfolio);
The financial statements were prepared under the reserve that CNVM finalizes the amendment to Order no.75/2005 according to the provisions of art.36 in 4th EEC Directive. The realized profit is the result of the recognition of the write-down of financial assets directly in total equity.
17 BOARD OF DIRECTORS’ REPORT for 2008 fiscal year
- capitalization of some equity items (reserves from net profit, issue premiums, etc) by the portfolio companies and thus earning free shares;
- diminish of portfolio value by the write-down set for 2008. The financial assets held as of December 31, 2008 are recorded at the input value (par value or the acquisition cost, as the case may be) diminished by the write-down set as of December 31, 2008.
The diminish of equity by 11.4% against December 31, 2007 is due to recording the write-down of financial assets to reserves, set for 2008 (according to CNVM Order no.75/2005, amended) by CNVM Order no.11/2009.
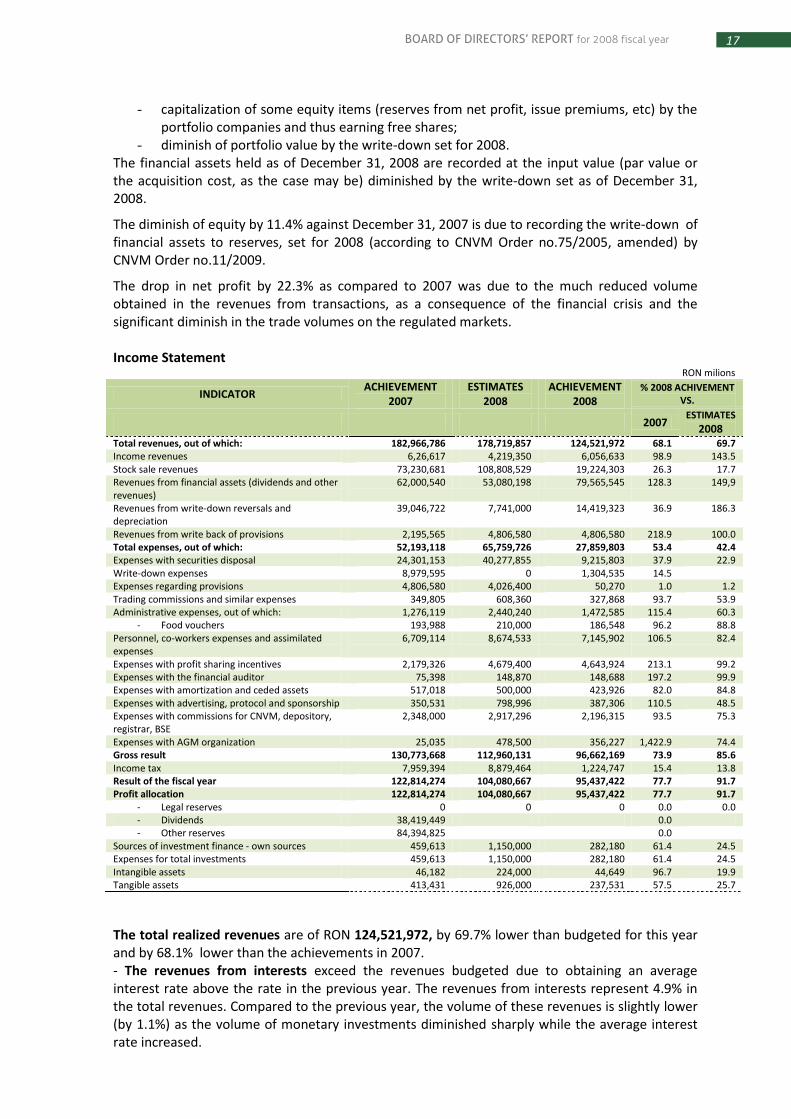
The drop in net profit by 22.3% as compared to 2007 was due to the much reduced volume obtained in the revenues from transactions, as a consequence of the financial crisis and the significant diminish in the trade volumes on the regulated markets. Income Statement
RON milions
INDICATOR ACHIEVEMENT
2007 ESTIMATES
2008 ACHIEVEMENT
2008 % 2008 ACHIVEMENT
VS.
2007 ESTIMATES
2008 Total revenues, out of which: 182,966,786 178,719,857 124,521,972 68.1 69.7 Income revenues 6,26,617 4,219,350 6,056,633 98.9 143.5 Stock sale revenues 73,230,681 108,808,529 19,224,303 26.3 17.7 Revenues from financial assets (dividends and other revenues)
62,000,540 53,080,198 79,565,545 128.3 149,9
Revenues from write-down reversals and depreciation
39,046,722 7,741,000 14,419,323 36.9 186.3
Revenues from write back of provisions 2,195,565 4,806,580 4,806,580 218.9 100.0 Total expenses, out of which: 52,193,118 65,759,726 27,859,803 53.4 42.4 Expenses with securities disposal 24,301,153 40,277,855 9,215,803 37.9 22.9 Write-down expenses 8,979,595 0 1,304,535 14.5 Expenses regarding provisions 4,806,580 4,026,400 50,270 1.0 1.2 Trading commissions and similar expenses 349,805 608,360 327,868 93.7 53.9 Administrative expenses, out of which: 1,276,119 2,440,240 1,472,585 115.4 60.3
- Food vouchers 193,988 210,000 186,548 96.2 88.8 Personnel, co-workers expenses and assimilated expenses
6,709,114 8,674,533 7,145,902 106.5 82.4
Expenses with profit sharing incentives 2,179,326 4,679,400 4,643,924 213.1 99.2 Expenses with the financial auditor 75,398 148,870 148,688 197.2 99.9 Expenses with amortization and ceded assets 517,018 500,000 423,926 82.0 84.8 Expenses with advertising, protocol and sponsorship 350,531 798,996 387,306 110.5 48.5 Expenses with commissions for CNVM, depository, registrar, BSE
2,348,000 2,917,296 2,196,315 93.5 75.3
Expenses with AGM organization 25,035 478,500 356,227 1,422.9 74.4 Gross result 130,773,668 112,960,131 96,662,169 73.9 85.6 Income tax 7,959,394 8,879,464 1,224,747 15.4 13.8 Result of the fiscal year 122,814,274 104,080,667 95,437,422 77.7 91.7 Profit allocation 122,814,274 104,080,667 95,437,422 77.7 91.7
- Legal reserves 0 0 0 0.0 0.0 - Dividends 38,419,449 0.0 - Other reserves 84,394,825 0.0
Sources of investment finance - own sources 459,613 1,150,000 282,180 61.4 24.5 Expenses for total investments 459,613 1,150,000 282,180 61.4 24.5 Intangible assets 46,182 224,000 44,649 96.7 19.9 Tangible assets 413,431 926,000 237,531 57.5 25.7
The total realized revenues are of RON 124,521,972, by 69.7% lower than budgeted for this year and by 68.1% lower than the achievements in 2007. - The revenues from interests exceed the revenues budgeted due to obtaining an average interest rate above the rate in the previous year. The revenues from interests represent 4.9% in the total revenues. Compared to the previous year, the volume of these revenues is slightly lower (by 1.1%) as the volume of monetary investments diminished sharply while the average interest rate increased.

18 BOARD OF DIRECTORS’ REPORT for 2008 fiscal year
- The revenues from the sale of shares represent 15.4% of the total revenues including the revenues from the sale of securities and gains from the sale of speculative stocks. The volume of these revenues is much lower than estimated in 2008 and the achievements in the previous year as a result of the outburst of the financial crisis and lack of opportunities. - The revenues from financial assets have a weight of 63.9% in total revenues including the due dividends from portfolio companies for 2007 and the revenues obtained as a result of share capital increases from issue premiums and reserves set up from net profit, made by portfolio companies and the distribution of shares proportional to the holdings. The increase of these revenues against the estimates is due to the revenues obtained as a result of share capital increases performed by portfolio companies. - The write-down reversals have a weight of 11.6% in the total revenues and they include:
- Reversal of write-down on securities attributable to the securities that exit the portfolio in 2008 and the revenues resulted from the increase of fair value of securities for which impairment losses were set up; - Reversal of write-down of current assets represents mainly the due dividends to be collected in 2008, for which adjustments for depreciation were recorded.
- Write back of provisions has a weight of 3.9% in the total revenues and they meet the estimates for 2008. The total expenses in 2008 amount to RON 27,859,803 and represent 42.4% in the estimates for 2008 and 53.4% of the expenses incurred in 2007. The diminish of the total volume of expenses was mainly generated as the securities sale targets were not reached in 2008 as a consequence of the financial crises. - Expenses with securities disposal hold the largest weight, 33.1% respectively, and they include the value of the securities held in the companies which were sold. The achievement of 22.9% of the estimates is in correlation with the revenues realized and is the effect of the non-fulfillment of sale targets. - Write-down expenses include the write-down of current assets (due dividends to be collected) and the value minuses from the write-downs of financial instruments (speculative shares), holding a weight of 4.7% in total expenses. - Personnel, co-workers expenses and assimilated expenses represent 25.6% in total expenses and they meet the budget estimates. - Expenses with profit sharing incentives hold a weight of 16.7% in total expenses and they meet the budget estimates for 2008. - Administrative and operation expenses represent 17.9% in total expenses and they meet the budget estimates in 2008.
The gross result in amount of RON 96,662,169 represents 85.6% of the estimates for 2008 and 73.9% of the achievements in the previous year. This diminish against the estimates is the result of non-achievement of revenues from transactions which were partially offset by the revenues from financial assets (dividends).
The income tax is much lower than the estimates and the achievements in the previous year as a result of the diminish of the gross profit and the increase of non-taxable revenues in the total revenues (revenues from dividends and write-down reversals).
The net result of the year in amount of RON 95,437,422 represents 91.7% of the estimates for 2008.
The total achieved investments in tangible and intangible assets amounted to RON 282,180, representing 24.5% of the estimates for 2008. Savings were made in IT devices and some planned investments were not made (car acquisition and branch offices refurbishing).

19 BOARD OF DIRECTORS’ REPORT for 2008 fiscal year
Cash-Flow
DIRECT METHOD RON milions
No INDICATOR Row no. ESTIMATES 2008 ACHIEVED 2008
A Cash flow from operating activities + Receipts from clients 01 64,200 610,949 - Payments to suppliers and employees 02 (20,955,471) (16,666,416) - Interest paid 03 - - Tax on profit paid 04 (11,578,814) (4,740,049) Net cash flow from operations 05 (32,470,085) (20,795,516)
B Cash flow from investments - Payments for purchases of shares and financial assets 06 (73,400,000) (80,325,426) - Payments for purchases of tangible assets 07 (1,150,000) (240,567) + Receipts from the sale of shares and financial assets 08 105,028,529 52,143,447 + Receipts from the sale of tangible assets 09 48,240 + Interest received 10 6,737,328 8,090,307 + Dividends received 11 45,000,047 47,110,385 - Other payments for investments 12 (1,939) + Other receipts from investments 13 4,717 Net cash flow from investments 14 82,215,904 26,829,164
C Cash flows from financing activities + Receipts from issue of shares 15 - - + Receipts from long term loans 16 - - - Dividends paid 17 (32,204,982) (30,366,905) Net cash from financing activities 18 (32,204,982) (30,366,905) Net increase in cash and cash equivalents 19 17,540,837 (24,333,257) Cash and cash equivalents at the beginning of the fiscal year 20 48,281,627 48,281,627 Cash and cash equivalents at the end of the fiscal year 21 65,822,464 23,948,370
The total cash flow presents a net diminish by RON 24,333,527 in net cash flow and net cash flow equivalents.
The cash at the end of the period in amount of RON 23,948,370 presents a diminish by 41,874,094 RON against the estimates, mainly due to the non-achievement of the securities sale targets and consequently lower receipts than planned. According to CNVM Order No. 75/2005 the cash and cash equivalent category comprise: cashier petty cash, bank current accounts on sight, bank deposits, investments, cash prepayments and other.
The total cash flow from operations reflects a cash diminish of RON 20,795,516 due to:
- receipts from rent, penalties related to dividends, the partial equivalent value of the bonds issued by Vest Metal SA Oradea and other revenues;
- payments to suppliers of goods and services (including the fees to CNVM, BSE, central depository, register company, etc) payment to and on behalf of the employees, other expenses paid for operation (sponsorships, other expenses) and the payment of income tax.
The drop in cash flow from operations by RON 11,674,569 against the estimates is a result of reduced volume of payments to suppliers and employees and the payment of income tax lower than the budget estimates.
Cash flow from investments reflects a cash surplus in amount of RON 26,829,164 lei due to:
- receipts from: sale of financial assets (shares, bonds and settlement of bank deposits with a maturity exceeding 3 months), sale of tangible assets, interests and dividends received and other receipts from investments (foreign exchange differences)
- payments for purchases of tangible assets, financial assets (shares and bonds) and other payments from investments (foreign exchange differences).

20 BOARD OF DIRECTORS’ REPORT for 2008 fiscal year
Net cash flow from investments decreased by RON 55,386,740 against the estimates, mainly due to the reduced receipts from the sale of shares and financial assets.
Cash flow from financing activities reflects a diminish of cash in amount of RON 30,366,905, representing dividend payments to shareholders, up the estimates.
Major financial ratios The financial ratios achieved as of December 31, 2008 according to the Income Statement and the Balance Sheet are presented in the table below, as compared to the estimates for 2008: Financial ratio 2008 ESTIMATES 2008 ACHIEVEMENTS 1. Liquidity and solvency ratio
- Current liquidity ratio = Current assets / current liabilities
2.71 0.91
-Quick ratio = (Current assets-Inventories) / current liabilities
2.71 0.91
- Solvency ratio = Total assets / Current liabilities
14.03 12.0
2. Profitability ratios [%]
- Net profit/Equity (ROE) 19.77 23.1
- Gross profit /Total assets (ROA) 17.84 17.5
- Gross profit margin rate = Gross profit / total revenues
63.21 77.63
- Income tax rate = Income tax / gross profit
7.86 1.27
3. Share ratios
- net worth/share (RON) 1.071 0.8578
- EPS(RON) 0.1896 0.1739
Liquidity and solvency ratios: - liquidity and quick ratios are lower than the estimates due to the significant diminish in current assets (bank deposits as a result of the purchase of financial assets) while current liabilities increase slightly (due dividends to shareholders). The two ratios are identical as the weight of inventories in the current assets is irrelevant. - the solvency ratio – is slightly below the estimates due to the diminish of total assets while the current liabilities increased slightly.
Profitability ratios: - financial return – the sharp decrease in equity, in absolute figures (decrease of reserves, due to recognizing the write-down of financial assets to reserves), as compared to the diminish of the net result that generated the rise of this ratio against estimates. - economical return – the simultaneous decrease both in total assets and in gross profit led to the achievement of an economic return at the level of the estimates. - gross profit margin ratio – increased against the estimates due to the reduced volume of total revenues achieved, but with an increase in the revenues not generating expenses, thus the gross profit slightly decreased as compared to the diminish in revenues. - income tax ratio – the achievement of a diminished tax rate was generated by the significant increase in the weight of non-taxable revenues (revenues from financial assets and the reversal of write-down of financial assets) in total revenues.
Share ratios: - net worth/share is below the 2008 estimates as a result of the diminish of the volume of total assets, financial assets respectively, due to the write-down set as of December 31, 2008. - EPS is slightly below the estimates due to the non-achievement of the planned net profit.

21 BOARD OF DIRECTORS’ REPORT for 2008 fiscal year
14. 2005-2008 MAJOR FINANCIAL RATIOS Financial return – ROE
Economical return -ROA
Revenues vs. Expenses (mn RON)
Annual net profit (mn RON)
Net asset computed according to C.N.V.M. Regulation no. 15/2004 (at year-end, in mn RON)

22 BOARD OF DIRECTORS’ REPORT for 2008 fiscal year
Market capitalization (at year-end, in mn.RON)
EPS (RON/share)
Net asset value /share (RON/share)
Assets under management
7 (RON)
Assets under management 2005 2006 2007 2008
Public securities 0 0 0 2.440.930
Cash (cashier petty cash, bank current account)
539,788 392,465 120,803 152,494
Receivables 26,543,611 13,347,560 11,816,748 6,417,948
Bank deposits 39,689,937 50,903,103 82,843,735 28,495,700
Municipal bonds 422,246 251,588 173,470 95,516
Corporate bonds 12,021,732 15,518,506 5,267,954 6,390,289
Listed shares 822,518,462 1,157,489,374 1,628,409,209 648,666,278
Unlisted shares 263,260,378 308,514,397 328,848,557 394,081,096
Other assets 6,538,918 7,647,168 8,901,274 7,021,096
Total assets 1,171,535,072 1,554,064,161 2,066,381,750 1,093,761,348
7 Assets value computed according to C.N.V.M.Regulation no. 15/2004

23 BOARD OF DIRECTORS’ REPORT for 2008 fiscal year
Stock portfolio indices
Achieved indices 2005 2006 2007 2008
Stock portfolio market value8 (in RON) 1,085,778,840 1,466,003,771 1,957,257,639 1,042,747,375
Number of companies held 483 434 368 339
Revenues from dividends (in RON) 35,033,840 34,265,707 38,738,084 45,779,190
Weight of listed companies in total stock portfolio
75.9% 78.96% 83.2% 62.2%
Investments on the capital market (in RON)
48,943,013 53,003,525 53,957,965 77,633,393
15. NAME AND PROFESSIONAL QUALIFICATION OF THE MEMBERS OF THE BOARD OF DIRECTORS
The list of the members of the Board of Directors serving as of December 31, 2008 is the following: Ioan Cuzman - Chairman of the Board of Directors Emil Cazan - Vice chairman of the Board of Directors Pavel Belean - member of the Board of Directors Zoltan Hosszu - member of the Board of Directors Ioan Moş - member of the Board of Directors Ionuţ Octavian Pătrăhău - member of the Board of Directors Ion Stancu - member of the Board of Directors Ioan Cuzman – is an economist, PhD in Economics, highly specialized in management and stock analysis. He is a Senior Lecturer at the Vasile Goldiş West University of Arad, Department of Economical-Financial Analysis. Since 1997, he is the Chairman of the Board of Directors of SIF Banat-Crişana and also the Chief Executive Officer. In April 2005 he has been re-elected to the Board of Directors, currently serving as Chairman and Chief Executive Officer.
Emil Cazan – is an economist, PhD in Economics, having a major in managament, international marketing, company valuation and winding up procedures. He is senior professor at the Faculty of Economics, within the West University of Timişoara, departments of General Management and Organizational Management. He serves as Scientific Director of S.C. ISE Performer-Consult S.A. He has been member of the Board of Directors of SIF Banat-Crişana since 2001, being re-elected and appointed as Vice Chairman in April 2005.
Pavel Belean – is an economist, PhD in Accounting, professor at the Aurel Vlaicu University of Arad, the head of the Accounting Finance Department. He has a wide experience in accounting and taxation. From 1998 to 2005, he was company auditor of SIF Banat-Crişana, being elected member of the Board of Directors in April 2005.
Zoltan Hosszu – holds a law degree, currently being a lawyer, member of Arad Bar Association. He opened a private law office in Arad. From 1990 to 1996 he has served as a senator in two terms of office, being a member of the privatization commission. He has been a long standing member of SIF Banat-Crişana’s Board of Directors since 1997, being re-elected in April 2005.
Ioan Moş - is an engineer, having an extensive experience in management, holding leadership positions at the Wagon Research and Design Institute of Arad. Since 1997 he has been a member of SIF Banat-Crişana’s Board of Directors, being re-elected in April 2005.
Ionuţ Octavian Pătrăhău - is an economist, MBA. He was former deputy general director of Banca Transilvania, presently being a member of the Bank’s Board of Directors and president of BT
24 BOARD OF DIRECTORS’ REPORT for 2008 fiscal year
Securities. He has been elected member of SIF Banat-Crişana’s Board of Directors by the General Meeting of Shareholders in April 2005.
Ion Stancu – is an economist, PhD in Economics, a member of the Romanian Financial Auditors’ Chamber. He has a successful academic career, presently being the Vice Rector at the Academy of Economic Studies in Bucharest. Since 1990 he is a member of the University Association of Financial Research, Tilburg – Holland. He is an associate professor at the University of Geneva. He has been a member of SIF Banat-Crişana’s Board of Directors since October 2003, being re-elected in April 2005.
16. INFORMATION REGARDING THE MAJOR EVENTS OCCURED SINCE THE END OF THE FISCAL YEAR
No major events occurred since the end of the fiscal year and until the preparation of the present report.
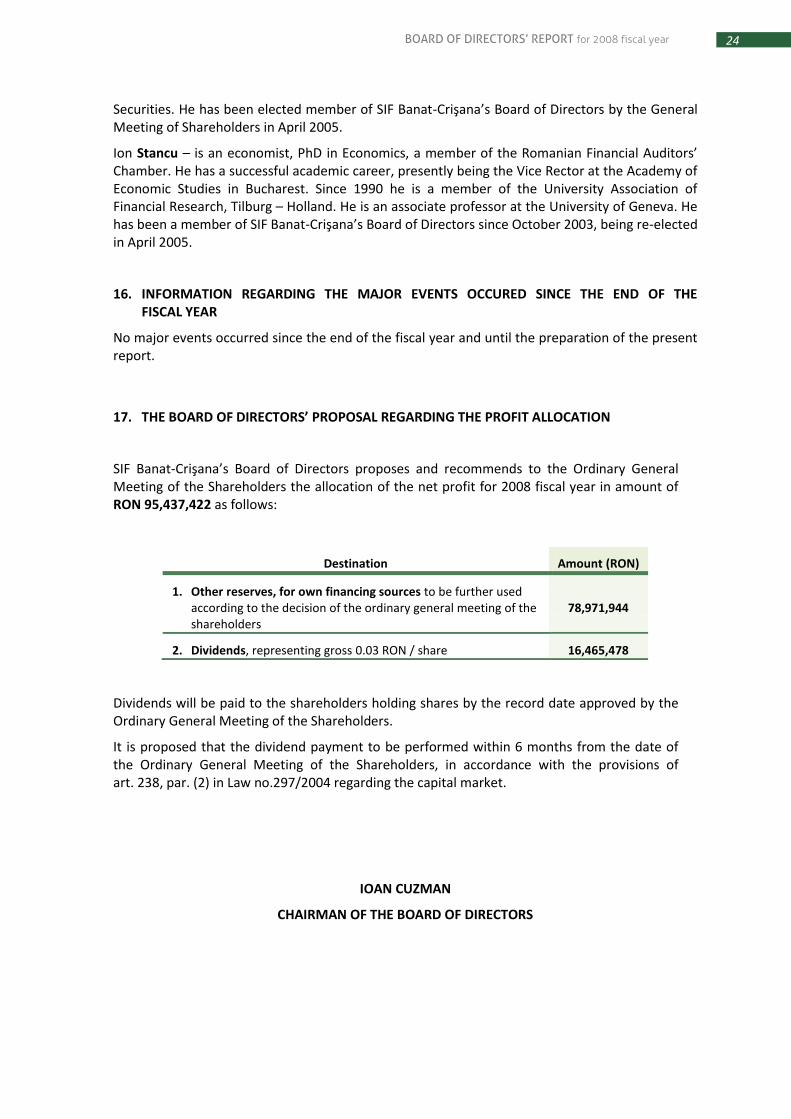
17. THE BOARD OF DIRECTORS’ PROPOSAL REGARDING THE PROFIT ALLOCATION
SIF Banat-Crişana’s Board of Directors proposes and recommends to the Ordinary General Meeting of the Shareholders the allocation of the net profit for 2008 fiscal year in amount of RON 95,437,422 as follows:
Destination Amount (RON)
1. Other reserves, for own financing sources to be further used according to the decision of the ordinary general meeting of the shareholders
78,971,944
2. Dividends, representing gross 0.03 RON / share 16,465,478
Dividends will be paid to the shareholders holding shares by the record date approved by the Ordinary General Meeting of the Shareholders.
It is proposed that the dividend payment to be performed within 6 months from the date of the Ordinary General Meeting of the Shareholders, in accordance with the provisions of art. 238, par. (2) in Law no.297/2004 regarding the capital market.
IOAN CUZMAN
CHAIRMAN OF THE BOARD OF DIRECTORS


