OAS TRADE, GROWTH AND COMPETITIVENESS STUDIES Analyses on trade and integration in the Americas Cost-Benefit Analysis of the Free Trade Zone System The Impact of Foreign Direct Investment in Costa Rica Ricardo Monge-González Julio Rosales-Tijerino Gilberto Arce-Alpízar A Publication of the Organization of American States Office for Trade, Growth and Competitiveness January 2005
Transcript
OAS TRADE, GROWTH AND COMPETITIVENESS STUDIES
Analyses on trade and integration in the Americas
Cost-Benefit Analysis of the Free Trade Zone System
The Impact of Foreign Direct Investment in Costa Rica
Ricardo Monge-González Julio Rosales-Tijerino Gilberto Arce-Alpízar
A Publication of the Organization of American States
Office for Trade, Growth and Competitiveness
January 2005
OAS TRADE, GROWTH AND COMPETITIVENESS STUDIES
The OAS Trade, Growth and Competitiveness Studies series addresses issues of importance to trade, economic integration, growth and competitiveness in the Western Hemisphere. The reports are prepared by the Office for Trade, Growth and Competitiveness Staff and invited authors and do not necessarily reflect the opinions of the OAS member states. An electronic version of this document is available on the Internet at a site maintained by the OTGC’s Foreign Trade Information System, which is also known by its Spanish acronym, SICE. The address is: http:/www.sice.oas.org/Tunit/tunite.asp General Secretariat Ambassador Luigi Einaudi, Acting Secretary-General Department of Integral Development Alfonso Quiñonez, Acting Director Office for Trade, Growth and Competitiveness José M. Salazar-Xirinachs, Director Series Coordinator Maryse Robert January 2005 OEA/Ser.D/XXII SG/TU/TUS-17 2005 Organization of American States, General Secretariat. All rights reserved. This publication or any portion thereof may not be reproduced or transmitted in any way without the permission of the General Secretariat of the OAS. The ideas, thoughts and opinions contained herein are not necessarily those of the OAS or of its Member States. All inquiries regarding this publication should be directed to: Organization of American States, Office for Trade, Growth and Competitiveness, 1889 F Street NW, Washington, D.C. 20006, U.S.A. Electronic Mail: [email protected]
OAS TRADE, GROWTH AND COMPETITIVENESS STUDIES
Cost-Benefit Analysis of the Free Trade Zone System The Impact of Foreign Direct Investment in Costa Rica*
Ricardo Monge-González Julio Rosales-Tijerino
Gilberto Arce-Alpízar**
A publication of the
Organization of American States Office for Trade, Growth and Competitiveness
1889 F Street NW Washington, D.C. 20006
USA
* Document prepared for the Foreign Trade Corporation of Costa Rica (PROCOMER). ** This document was prepared by Ricardo Monge, economist, Executive Director of the High-Technology Advisory Commission (CAATEC), member of the Central American Academy, and professor of international trade at Costa Rica’s Universidad Latina; Julio Rosales, economist, consultant for CAATEC and economic director of Ecoanalisis; and Gilberto Arce, consultant for Econanalisis and for various national and international bodies.
PREFACE A number of studies in the OAS Trade, Growth and Competitiveness Studies Series (formerly “OAS Trade Unit Studies series”) have addressed the question of how investment-related rules on goods and services can contribute to improving the investment climate in developed and developing countries alike. Several factors have been analyzed: the role of investment rules as commitment and signaling mechanisms to a transparent, stable, and predictable policy environment. The signaling effect of unilateral trade and investment liberalization, particularly for small countries, is much more powerful when bound in international agreements. Countries gain in credibility when narrowing the gap between bound and applied levels of market openness. This new study by Ricardo Monge-González, Julio Rosales-Tijerino, and Gilberto Arce-Alpízar takes a different approach to the role of investment and investment promotion mechanisms in development. Using a cost-benefit analysis, the authors show how free trade zones (FTZs) in Costa Rica have been successful over the last 15 years in facilitating a shift in foreign investment towards high-skill operations that provide employment opportunities in higher productivity and higher wage activities. This case study shows how FTZs, and complementary policies, have been a key mechanism in the movement of Costa Rica to a new growth trajectory based on higher productivity and higher wage activities. In examining the productive linkages between multinational firms (MNCs) and locally-based suppliers, this study highlights one of Costa Rica's greatest achievements in its quest to take advantage of globalization. Close to 150 Costa Rican firms are currently producing goods and services they sell to MNCs established in FTZs. Seventy-nine percent of these local suppliers are micro or small firms. The study also underlines the importance of knowledge spillovers and analyses some of its main channels. MNCs operating in Costa Rican FTZs provide training to local suppliers. Engineers, technicians, and administrators who once worked for multinationals in FTZs are now working for local suppliers. Through these and other mechanisms foreign direct investment in Costa Rica has made an important contribution to upgrading the skills and knowledge base of the economy. Research has shown that there are very few successful FTZ experiments in the world. Few countries have been able to foster linkages between multinationals and local suppliers. Even when performance of the FTZ is good, benefits do not spill over into the rest of the economy in most developing countries. Monge, Rosales and Arce explain in their study how small countries, like Costa Rica, can use FTZs as an efficient development tool. By drawing local suppliers into world markets, Costa Rican FTZs are indirectly contributing to increasing these firms' competitiveness. In fact, the study shows that FTZs have been a catalyst for the Costa Rican economy as they have supported, through extensive backward linkages, the country's efforts to integrate itself into the world economy. The OAS Trade Unit was established on April 3, 1995 under the Office of the Secretary General to support OAS Member States in carrying out the trade and integration-related mandates of the Summit of the Americas and Trade Ministerial Meetings. On September 15, 2004, the Trade Unit became the Office for Trade, Growth and Competitiveness (OTGC). The mission of the OTGC is to support OAS Member States in their efforts to promote prosperity and growth in the Hemisphere in the related areas of trade and integration, transparency and competitiveness, including in specific sectors such as tourism and other services sectors. The Office is organized in five sections: Trade; SICE (the Foreign Trade Information System); Tourism; Growth and Economic Analysis; and Competitiveness. At the OTGC, we firmly believe in the vision of the Summit of the Americas process. We are committed to strengthening democracy, economic integration, investment and free trade with a view to guaranteeing sustainable
development and improving the standards of living of the peoples of the Americas. The key objective of the OTGC is to support the integration process in the Hemisphere and provide assistance to OAS Member States in their efforts toward this goal. In so doing, we continue to provide analytical and technical support to countries, particularly smaller economies, for the conclusion and the establishment of the Free Trade Area of the Americas (FTAA) process. We also continue to respond to the trade-capacity building needs of OAS Members States through the FTAA Hemispheric Cooperation Program and other cooperation mechanisms under free trade agreements and integration processes in the Americas with a view to assisting countries in participating effectively in the negotiations, implementing their trade commitments, and adjusting to free trade and integration. Most importantly, we are committed to assisting countries with different levels of development and size of the economies in the design, formulation and implementation of policies aimed at strengthening their productive capacity and competitiveness so as to enable them to reap the benefits of free trade through economic growth and poverty alleviation. The OTGC is also promoting hemispheric and regional dialogue between OAS Member States and their civil society through the dissemination of information on trade-related issues. It is producing analyses on trade and growth-related issues at the micro and macroeconomic levels with a view to understanding the economic trends in Latin America and the Caribbean, and to identifying the key issues having an impact on the economic performance of these countries. The OTGC welcomes comments from readers on this and other studies, and hopes to contribute to fostering the dialogue on trade, economic integration and competitiveness-related issues in the Hemisphere. The views expressed in the OAS Trade, Growth and Competitiveness Studies series are the authors' own and should not be attributed to the General Secretariat of the OAS or any OAS Member State. José Manuel Salazar-Xirinachs Director Office for Trade, Growth and Competitiveness January 2005
ACKNOWLEDGEMENTS The authors would like to thank the President of the Central American Academy, Eduardo Lizano Fait, and the former Minister of Foreign Trade, Alberto Trejos Zuñiga, for their valuable comments on the preliminary versions of the document. Likewise, they are grateful for the assistance provided by PROCOMER, in particular through its former manager Manfred Kissling, Ricardo Matarrita Venegas, Luis Alonso Sancho Rubí, Mauricio Umaña Torres, and Víctor Díaz Salazar. They are also grateful to the Central Bank of Costa Rica for the information it supplied, and especially to Francisco de Paula Gutiérrez, William Calvo Villegas, Gabriela Alfaro Vargas, and Henry Vargas Campos. Thanks are also due to Unimer Research International, in particular to Valeria Lentini, for her efforts in developing the survey conducted as part of this study; Andrés Rodríguez, for his suggestions in designing the survey form; and to all the national companies and local suppliers who collaborated in the survey. The authors express their appreciation for the outstanding support provided by Cindy Alfaro Azofeifa, a CAATEC research assistant, and Alejandro Castro Solano, for his electronic data processing work. Thanks also go out to Professors S. S. Chen and R. A. Gopinah for participating in discussions on the methodological aspects of the study and for their useful comments in that regard, and to the Organization of American States (OAS), and in particular José Manuel Salazar, for their valuable efforts in publishing this study. The views expressed in this document are the authors’ own and not necessarily those of the CAATEC Foundation, the OAS, or any other organization or institution that supported this initiative. Responsibility for any errors or omissions in the document rests exclusively with the authors.
Introduction……………………………………………………………………………………………… ……………… 5 I. Origin, Characteristics and Evolution of the Free Trade Zone System in Costa Rica…...
7
1.1. The Origin of the Free Trade Zones……………………………………………………………….. 7 1.2. Costa Rica's Free Trade Zones……………………………………………………………………….. 7 1.3. The Evolution of FTZs in Costa Rica………………………………………………………………
10
II. Macroeconomic Impacts of FDI Under the Free Trade Zone System in Costa Rica……
15
2.1. Economic Growth………………………………………………………………………………………… 15 2.2. Exports and Balance of Payments…………………………………………………………………… 16 2.3. Employment and Real Wages…………………………………………………………………………
20
III. Spillovers of FDI Under the FTZ System……………………………………………………………….
27
3.1. Backward Linkages Between Multinationals and Local Firms……………………………. 27 3.1.1. Characteristics of Local Supplier Firms……………………………….……..………… 29 3.1.2. The Relationship Between Local Suppliers and MNCs………………………….. 29 3.2. Identifying Knowledge Spillovers……………………………………………………………………
32
IV. Cost-Benefit Analysis of the Free Trade Zone System……………………………………………..
37
4.1. Identifying Costs and Benefits of the Free Trade Zone System………………………….. 37 4.2. Methodology for Determining the Net Benefit of FTZs……………………………………. 38 4.3. Main Findings………………………………………………………………………………………………
41
V. Social Impacts of FDI: Cartago and the Canton of Belen ………………………….…………….
47
VI. Final Considerations and Policy Recommendations ………………………………………………
53
Annex. Estimating Wage Elasticity with Respect to FDI in Costa Rica …………….…………….
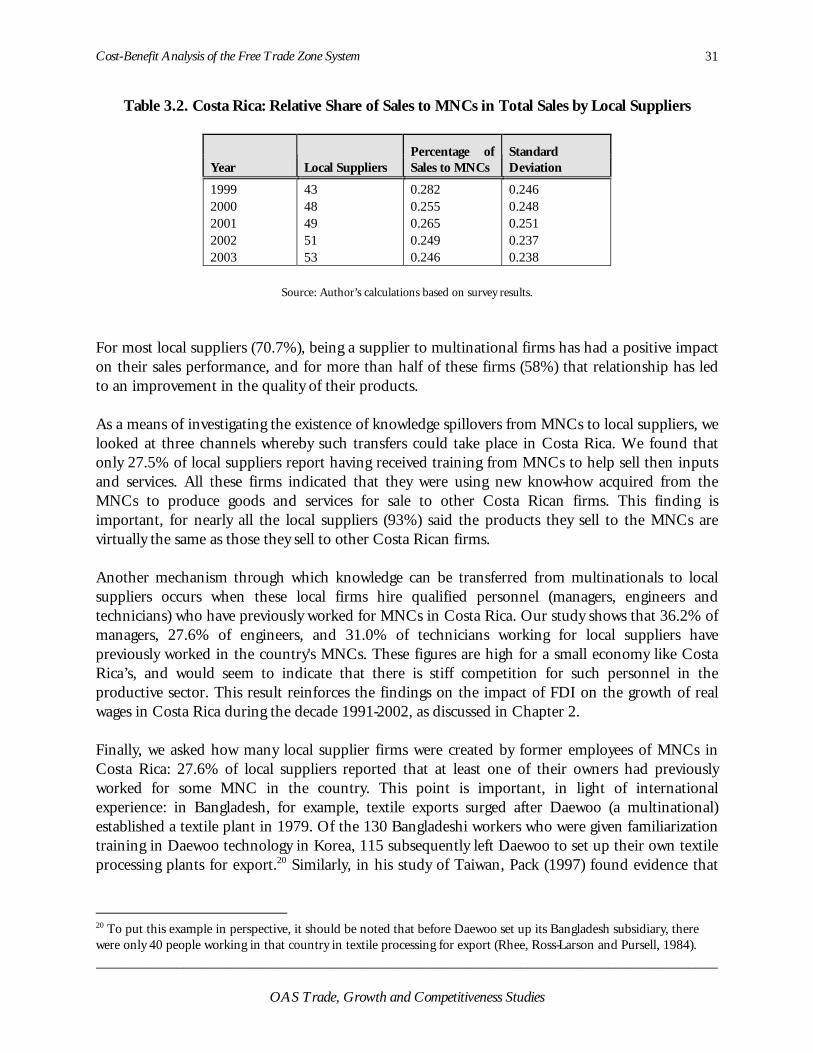
Table 1.1. Costa Rica: Export Incentives under the Three Systems………………………… 9 Table 2.1. Wage Elasticity with Respect to FDI for Selected Countries………………….. 24 Table 2.2. Costa Rica: Wages and the Stock of FDI, 1991-2002 …………………………… 24 Table 2.3. Costa Rica: Impact of FDI on Real Wages ………………………………………….. 25 Table 3.1. Costa Rica: Relationship between Local Suppliers and MNCs………………. 30 Table 3.2. Costa Rica: Relative Share of Sales to MNCs in Total Sales by Local
Suppliers…………………………………………………………………………………………..
31 Table 3.3. Costa Rica: Impact of Linkages between Multinationals and Local
Suppliers on the Productivity of those Suppliers, 2003 (t statistics)…………
35 Table 4.1 Costa Rica: FTZ Administration and FDI Promotion Costs …………………. 42 Table 4.2. Costa Rica: Net Direct Benefit, Total and by Degree of Technology of
Firms………………………………………………………………………………………………..
43 Table 4.3. Costa Rica: Net Direct Benefit by Sector …………………………………………….. 45 Table 5.1. Indicators for Firms in the Free Zones of Belén and Cartago ………………… 47 Table A.1. Costa Rica: Share of labor and FDI Remuneration in Gross National
Product ……………………………………………………………………………………………
58
Graphs in the Text
Graph 1.1. CR: Annual FDI Flows………………………………………………………………………. 10 Graph 1.2. CR: Five-year FDI Flows…………………………………………………………………….. 10 Graph 1.3. FDI Flows and FTZ Share………………………………………………………………….. 11 Graph 1.4. Costa Rica: Composition of Goods Exports from FTZs………………………… 12 Graph 1.5. Costa Rica: Exports by FTZ Companies………………………………………………. 13 Graph 2.1. Costa Rica: Value Added by FTZs………………………………………………………. 15 Graph 2.2. CR: Share of Total GDP……………………………………………………………………. 15 Graph 2.3. Growth of FTZ Exports……………………………………………………………………… 16 Graph 2.4. Share in Total Exports……………………………………………………………………….. 16 Graph 2.5. Costa Rica: Technological Intensity of FTZ Goods Exports…………………… 17 Graph 2.6. Costa Rica: Exports and Imports of Goods by FTZ Firms……………………… 17 Graph 2.7. Costa Rica: Trade Deficit, Overall and Excluding FTZs………………………… 18 Graph 2.8. Costa Rica: Current Account Deficit………………………………………………….. 19 Graph 2.9. Costa Rica: Local Purchases by FTZs…………………………………………………… 19 Graph 2.10. Costa Rica: Number of FTZ Jobs………………………………………………………… 20 Graph 2.11. Share of FTZ Jobs in Total Industrial Employment………………………………. 20 Graph 2.12. Costa Rica: Determinants of Labor Demand by FTZ Firms…………………… 21 Graph 2.13. Costa Rica: Average Wage, Industry-wide and FTZ ……………………………… 22 Graph 2.14. Costa Rica: Value Added per Worker…………………………………………………. 22 Graph 4.1. Costa Rica: Average HTM Wage………………………………………………………… 44 Graph 4.2. Costa Rica: Average Non-HTM Wage…………………………………………………. 44
Cost-Benefit Analysis of the Free Trade Zone System 1
EXECUTIVE SUMMARY Over the last two decades Costa Rica has stepped up its efforts to attract foreign direct investment (FDI), as part of its new, outward-oriented strategy for development. One of the tools introduced under this policy is the Free Trade Zones (FTZ) System. Two decades after the process of opening Costa Rica's economy began, the Trade Promotion Office (PROCOMER, in Spanish) set out to analyze the possible impacts of FDI associated with the free trade zones, recognizing that there has been little analysis of this issue in the country, and that there is a need to deal with the challenges posed by the new rules of the game that the World Trade Organization (WTO) imposes on developing countries in terms of attracting FDI. The study was prepared by the Costa Rican High Technology Advisory Committee Foundation (CAATEC, in Spanish), taking a cost-benefit approach to the FDI that has flowed into Costa Rica under the Free Trade Zones System, primarily in the last few years. The main results of this research can be summarized as follows:
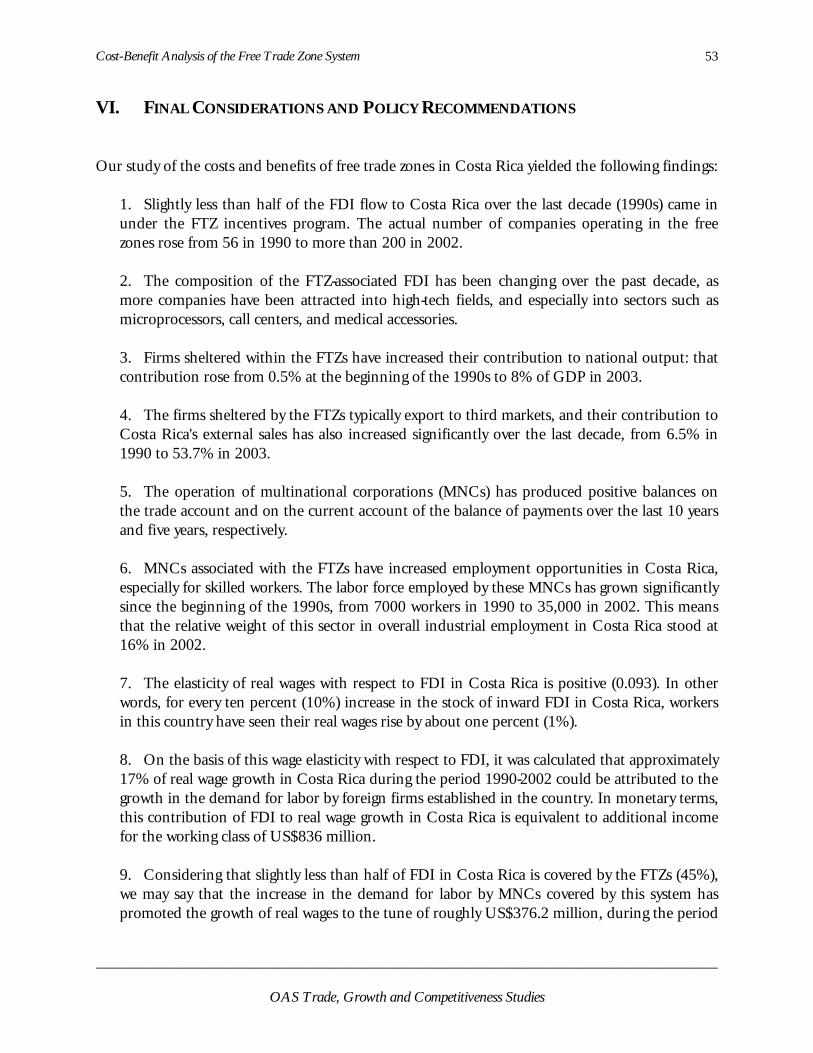
1. Slightly less than half of the FDI flow to Costa Rica over the last decade (the 1990s) came in under the FTZ incentives program. The actual number of companies operating in the free trade zones rose from 56 in 1990 to more than 200 in 2002.
2. The composition of the FTZ-associated FDI has been changing over the past decade, as
more companies have been attracted into high-tech fields, and especially into sectors such as microprocessors, call centers, and medical accessories.
3. Firms sheltered within the FTZs have increased their contribution to national output:
that contribution rose from 0.5% at the beginning of the 1990s to 8% of GDP in 2003.
4. The firms sheltered by the FTZs typically export to third markets, and their
contribution to Costa Rica's external sales has also increased significantly over the last decade, from 6.5% in 1990 to 53.7% in 2003.
5. The operation of multinational corporations (MNCs) has produced positive balances
on the trade account and on the current account of the balance of payments over the last 10 years and five years, respectively.
6. MNCs associated with the FTZs have increased employment opportunities in Costa
Rica, especially for skilled workers. The labor force employed by these MNCs has grown significantly since the beginning of the 1990s, from 7,000 workers in 1990 to 35,000 in 2002. This means that the relative weight of this sector in overall industrial employment in Costa Rica stood at 16% in 2002.
Cost-Benefit Analysis of the Free Trade Zone System 2
7. The elasticity of real wages with respect to FDI in Costa Rica is positive (0.093). In other words, for every ten percent (10%) increase in the stock of inward FDI in Costa Rica, workers in this country have seen their real wages rise by nearly one percent (1%).
8. On the basis of this wage elasticity with respect to FDI, it was calculated that
approximately 17% of real wage growth in Costa Rica during the period 1990-2002 could be attributed to the growth in the demand for labor by foreign firms established in the country. In monetary terms, this contribution of FDI to real wage growth in Costa Rica is equivalent to additional income for the workforce of US$836 million.
9. Considering that slightly less than half of FDI in Costa Rica is covered by the FTZs
(45%), we may say that the increase in the demand for labor by MNCs covered by this system has promoted the growth of real wages to the tune of roughly US$376.2 million, during the period 1991-2002. That is, an increase of US$25.2 per worker per year in this economy, an important contribution for Costa Rican workers.
10. In examining the productive linkages between MNC firms and locally based suppliers
of inputs and services, we identified 143 firms that are currently producing and selling inputs and services to MNCs in Costa Rica. Most of those firms have had a relationship of several years' standing with the MNCs.
11. Nearly all local suppliers (99.3%) belong to the sector of micro, small and medium-
sized firms (MSMEs). That is 12.1% of local suppliers are microenterprises (fewer than five employees), 67.2% are small (between 6 and 30 employees), 20% are mid-sized (between 31 and 100 employees).
12. In terms of the relationship between local suppliers and MNCs, we found that the
majority (77.4%) of those suppliers began operations with MNCs during the time when the economy was being opened, i.e. beginning in the mid-1980s, when Costa Rica changed its development model from one of import substitution to an outward-oriented growth strategy.
13. The MNCs have constituted a new market for the MSMEs of Costa Rica, the majority
of which (55%) do not export directly. This has allowed those firms to become indirect exporters.
14. The relationship between local suppliers and the MNCs has had a major impact on the
export performance of those local suppliers. 15. We found that the great majority of local suppliers (89.7%) were already operating in
the country long before they established their business relationship with the MNCs, and that only 10.3% of these firms do not sell their products or services to at least two MNCs.
Cost-Benefit Analysis of the Free Trade Zone System 3
16. For the great majority of local suppliers (70.7%), being a supplier to multinational corporations has had a positive impact on their sales performance, and for more than half of these firms (58%) that relationship has led to a significant improvement in the quality of their products.
17. With respect to the existence of "knowledge spillovers" from MNCs to local suppliers,
we found that only 27.5% of local suppliers report having received training from the MNCs. All of those firms indicated that they used the new knowledge acquired from the MNCs to produce goods and services that they then sold to other Costa Rican firms.
18. When it comes to the hiring of highly skilled personnel (managers, engineers and
technicians), the study shows that 36.2% of managers, 27.6% of engineers, and 31.0% of technicians working for local suppliers had worked previously in MNCs in this country. Those figures are high for a small economy like Costa Rica’s, and would seem to indicate sharp competition in the productive sector for human resources of this kind. This outcome reinforces the findings about the impact of FDI on the growth of real wages in Costa Rica during the decade 1991-2002.
19. 27.6% of local suppliers reported that one of their owners had previously worked for
MNCs in this country. This finding is significant when viewed in light of international experience, which offers a wealth of such examples.
20. In examining the possible backward linkages between multinational firms and local
firms, in terms of the latter firms’ total productivity, we found evidence that the impact is both positive and significant. We also found evidence showing the importance of knowledge spillovers from the multinationals operating in Costa Rica, including the training that MNCs provide to local suppliers and the fact that engineers, technicians and administrators who once worked for MNCs in Costa Rica are now working for local suppliers. All of these findings, together with the previous comments, provide support for the efforts that the Costa Rican authorities, the private sector and the academic world have been making for the establishment and successful operation of the Costa Rica-PROVEE program (a program for creating linkages between local firms and MNCs).
21. The cost-benefit analysis on the operations of MNCs that were active in the free trade
zones between 1997 and 2002 produced the following results:
• The net direct benefit (NDB) of FTZs amounts to US$727.2 million for the year 2002. This figure is equal to an average NDB per firm of approximately US$8.1 million, during the period under study. Moreover, in general terms, we may say that the investment that the country has made to attract foreign direct investment and to administer this system has been more than compensated by the direct benefits flowing from the operation of MNCs covered by the FTZs.
Cost-Benefit Analysis of the Free Trade Zone System 4
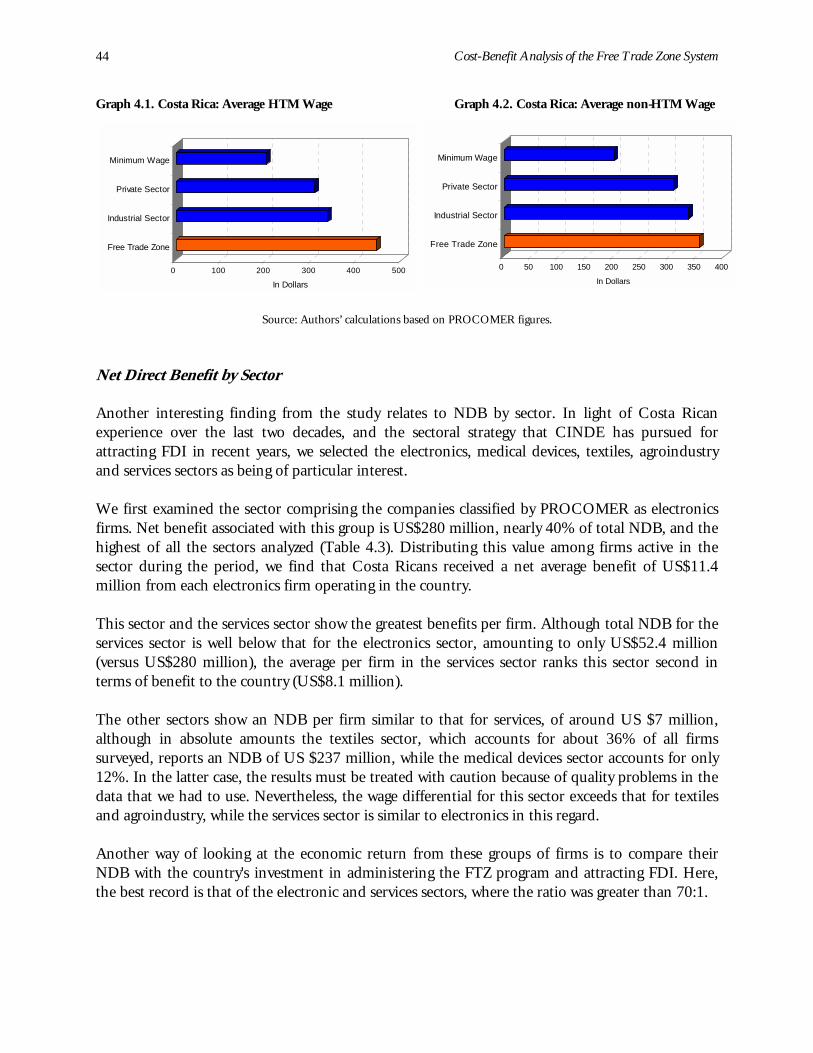
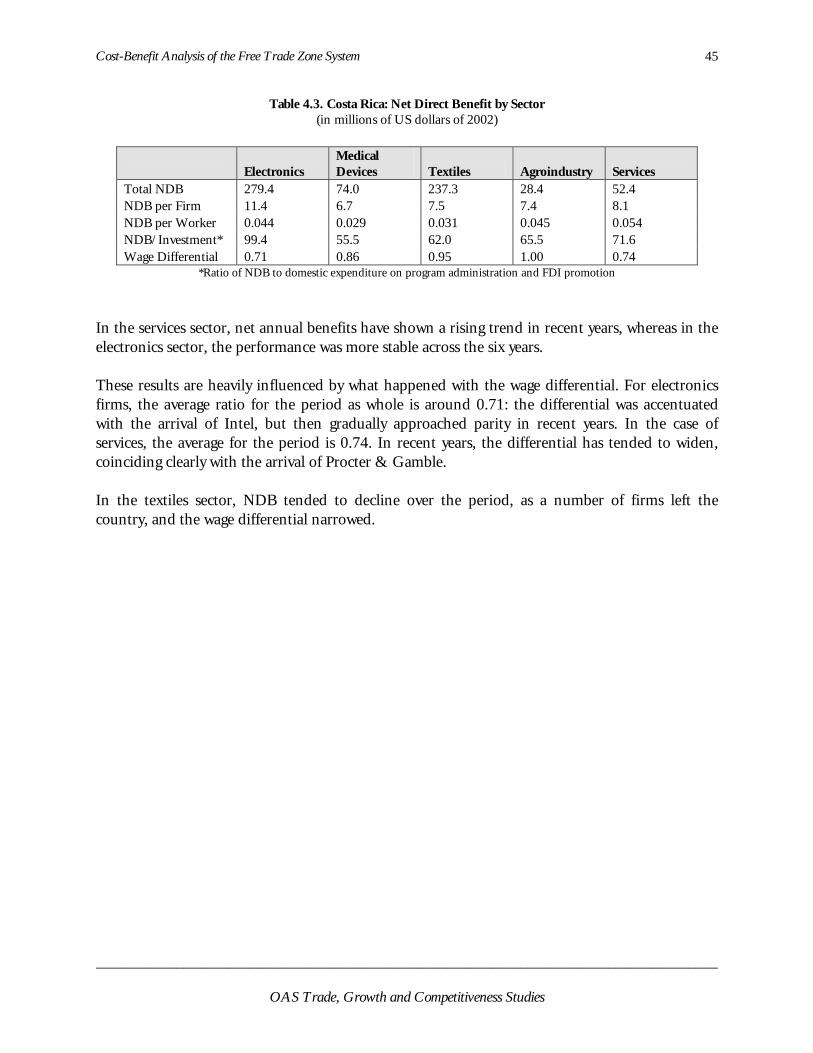
• The NDB derives in large part (more than 60%) from the wage differential between the free trade zones and the rest of the country. There is also an important impact (around 19%) from that differential in terms of payments into the social security system and income tax revenues. The contribution of local purchases by MNCs is 17%, and the rest of the NDB comes primarily from the fees that the MNCs pay to PROCOMER for membership in the system, municipal taxes, and interest on debts contracted in local currency. • The ratio between NDB and the expenses incurred by CINDE and PROCOMER to attract FDI and to administer the FTZs, respectively, was estimated at 69:1. • Dividing the resulting NDB among the high-tech multinationals (HTM) and non-high tech multinationals (non-HTMs), we find that the NDB of the former amounts on average to US$10.6 million, while for other firms the average NDB is US$7.0 million. This result confirms the policy that the country has followed in recent years to attract foreign investment into high-tech activities, which make more intensive use of skilled labor. • In analyzing NDB according to the sector in which the FTZ firms are active, we found evidence that allows us to rank them as follows, by order of importance: in the electronics sector, each firm has generated a NDB of US$11.4 million; in the medical devices sector, the average NDB per firm is US$6.7 million; in the services sector, the NDB is US$8.1 million; for the textile and agro industry firms, the average NDB amounts to US$7.5 million and US$7.4 million, respectively.
22. We interviewed local leaders in the cantons of Belén and Cartago about the social
impact of MNCs covered by the FTZs, and found that most of these people viewed those effects as positive. In particular, they pointed to greater employment opportunities and higher wages, as well as the generation of productive linkages with local businesses, new knowledge that can be applied in environmental protection, and the social responsibility shown by the firms.
All of the results discussed in this study would seem to support the policy that Costa Rica has followed for attracting FDI through the Free Trade Zones program. We therefore recommend a redoubling of efforts to attract foreign investment, by improving the investment climate and the foreign and domestic determinants of investment in the country, and that programs for creating linkages between local firms and MNCs (i.e. Costa Rica-PROVEE) be reinforced as a mechanism for transferring expertise from the latter to the former. To have attempted to identify the major obstacles to attracting FDI to the country would have exceeded the scope of this work, but that task, as well as the work of defining a strategy for attracting investment, should continue to be a national priority, given the positive impact that FDI has on the Costa Rican economy.
Cost-Benefit Analysis of the Free Trade Zone System 5
Introduction During the second half of the 1980s Costa Rica launched a process of opening its economy by liberalizing imports, promoting exports, and attracting foreign direct investment (FDI). While there have been a number of studies on the various impacts of import liberalization and trade promotion, little attention has been paid to the impact of FDI flows into the Costa Rican economy, in particular FDI associated with the high-technology industry and the use of increasingly skilled labor, which has been growing steadily in importance since the 1990s. In this new context, the Trade Promotion Office (PROCOMER) decided to examine the possible impacts of FDI coming into the country under the free trade zones system. That decision reflected both the shortage of analysis in this field and the need to deal with the challenges posed by the new rules of the game that the World Trade Organization (WTO) imposes on developing countries in terms of attracting FDI. This study, prepared by the High Technology Advisory Commission of Costa Rica (CAATEC), takes a cost-benefit approach to analyzing the FDI that has flowed into Costa Rica under the free trade zones (FTZ) system. The document is divided into seven chapters, including the introduction. The first chapter describes the origin, characteristics and performance of the free trade zones in Costa Rica. The second chapter begins to describe the impacts from firms covered by the FTZ on the macroeconomic setting, on economic growth, on the performance of the export sector, on the balance of payments, on employment generation, and on growth in real wages. Estimating this last impact of FDI (on the growth in real wages) is in fact one of the main contributions of this effort: the impact turned out to be both positive and significant. The third chapter continues the analysis of the benefits of FDI, this time at the microeconomic level, by examining the spillovers that MNCs covered by the FTZs generate for the rest of the economy, using a survey of more than 50 local suppliers that produce and sell inputs and services for the MNCs. The fourth chapter summarizes the main findings from the previous chapters and opens the discussion of the costs associated with the FTZs and with attracting FDI to Costa Rica, paving the way for a cost-benefit analysis of the system. Although this is not included explicitly in the cost-benefit analysis, the fifth chapter examines some of the social impacts of FDI in Costa Rica, on the basis of interviews with stakeholders from the province of Cartago, home to the country’s first metropolitan free trade zone industrial park, and the Canton of Belén, which has attracted some major high-tech firms. Finally, the sixth chapter summarizes the conclusions and policy recommendations emerging from the study.
Cost-Benefit Analysis of the Free Trade Zone System 7
I. ORIGIN, CHARACTERISTICS AND EVOLUTION OF THE FREE TRADE ZONE
SYSTEM IN COSTA RICA 1.1. The Origin of the Free Trade Zones The free trade zone is an idea that dates back to medieval times when towns around the Baltic and in Asia began into exploit the concept of the free port. That system gave rise to large entrepot or warehousing centers for marketing products from various regions. These free ports offered various customs advantages and marketing facilities, in the form of better warehousing and greater access to the transportation means of the time. Because sea transport was the dominant mode, the free trade zones were initially located near the ports, but as other modes of international transport became more important free trade zones also appeared near airports and border crossings. The FTZs began to shed their purely trading nature in the middle of the past century, when some countries began to see them as an ideal location for the processing of raw materials and intermediate products into final goods. This gave rise to what are known today as industrial free trade zones, designed to increase local value-added, and to generate more employment, industrial development, and productive investment. Given the growing importance of FTZs and their positive impacts on the countries that established them, special incentive packages came to be offered, in addition to the benefits of strategic location, streamlined procedures and market access, to attract firms into these new production centers. In recent decades, with trade liberalization and the revolution in information and communication technologies (ICTs), especially the Internet, firms have been moving towards new ways of doing business. This has meant changes in market organization and in the traditional concept of competitiveness. In this context, business relationships have taken on many forms, sparking the need to address the concept of value chains, at the local, national, regional and global levels, so as to exploit the comparative advantages of each particular region or country. With these trends, the free trade zones have become a mechanism for integrating developing countries into international markets by allowing them to compete more aggressively for foreign direct investment or domestic savings. Indeed, there is frequent talk today of "satellite plants" and outsourcing in countries such as India or China, which are further decentralizing productive processes around the world. 1.2. Costa Rica's Free Trade Zones Free trade zones emerged in Costa Rica with the promulgation of Law 6695 of December 10, 1981, the Export Processing Zones and Industrial Parks Law, as a mechanism for promoting the export of nontraditional products and fostering productive investment by attracting foreign direct investment. This policy was part of the new outward-oriented development strategy that Costa Rica adopted in response to the worst economic crisis the country had faced since the Great Depression of the 1930s (Monge and Lizano, 1997). The intent was to create a diversified productive basis, through the export of nontraditional products, that would give the Costa Rican economy greater
Cost-Benefit Analysis of the Free Trade Zone System 8
stability in the face of shifting terms of trade for its previously dominant exports (coffee, bananas, sugar and meat) and imports (manufactured products). After more than 30 years of pursuing import substitution, the new set of policies to improve the country's economic importance included a sharp reduction in protectionism for manufacturing and some agricultural activities, withdrawal of the State from certain business sectors, the creation of incentives for nontraditional exports and tourism, and the elimination of other distortions that, together with protectionism, had tended to produce both an absolute and a relative bias against exports (Corrales and Monge, 1990). The policy also sought to achieve macroeconomic stability and to establish a realistic exchange rate system that would not disadvantage the country's competitiveness on world markets. In short, the objective was to tap a new source of long-term economic growth by exporting new products to new markets and attracting foreign direct investment (De Ferranti, 2002). At the outset, the FTZs also tried to take advantage of investment opportunities in less-developed geographic areas, to promote their development. Article 2 of the law authorized the establishment of FTZs in the provinces of Puntarenas, Limon and Guanacaste, as a means of attracting investment that would generate employment in these historically underdeveloped areas. The results, however, were disappointing, and the experience showed that, in order to operate there, businesses required the kind of infrastructure and human resources not available in those provinces. The concept of FTZs in the initial legislation was very restrictive, limited to "controlled areas with no permanent residents, devoted to the handling, processing, manufacture and production of articles for export or re-export to third markets." The law also restricted the activities in which firms established under that system could engage, by excluding services for example. This situation was corrected in 1990 by Law 7210, which included services within the activities covered by the FTZ system. Moreover, the new law placed no constraints on exports in terms of markets or the type of products to be exported. As demonstrated in Table 1.1, the incentives offered by the FTZ system (which were not the only ones that Costa Rica used to promote exports), are strictly fiscal in nature. Beyond ensuring neutrality of treatment vis-à-vis foreign competition (exemption from all types of taxation on imports of raw materials, inputs and capital goods), the most important incentive is the exemption granted on income tax up to 100% for 8 or 12 years, and 50% for an additional 4 or 6 years, depending on whether the company installs itself in a relatively less-developed area.
Cost-Benefit Analysis of the Free Trade Zone System 9
Table 1.1. Costa Rica: Export Incentives Under the Three Systems
Incentives Under the Three Export Promotion Systems
Income Tax Exemption
Customs Tariff Exemption
Exemption from Other Import Duties
Tax Credit Certificate (CAT)
Other Benefits
Export Contract Only for firms eligible for benefits before April 3, 1992 (1)
As per regulations As per regulations Only for firms with export contract before December 31, 1992 (2)
Temporary Entry NO Suspension of all
taxes on goods destined for export
Suspension of all taxes on goods destined for export
NO NO
Free Trade Zones For companies operating under the program. For existing development companies. Not for new companies developing industrial parks.
For all goods, except vehicles as defined by the law.
For all goods, except vehicles as defined by the law.
NO Exemption from sales and consumption tax; from real estate and asset transfer taxes; from tax on remittances abroad; from municipal taxes and license fees. Free transaction of foreign exchange. 15% payroll bonus for firms in less-developed zones.
(1) This benefit expired on October 31, 1996. (2) Companies benefiting from the new CAT rates are eligible for this benefit until 1999. Source: Public Sector Balance Act 6955, Income Tax Act 7293 and Free Trade Zones Act 7210.
Source: Academia de Centroamérica (1997). Costa Rica: Una Economía en Recesión. Informe sobre la Economía en 1996.
A comparative study in 2001 showed that, when it comes to income tax exemptions, the country is more attractively positioned than its main competitors in Latin America. Nevertheless, with respect to research and development incentives, strategic partnership facilitation, land acquisition, and public utility rates, Mexico, Puerto Rico and Brazil offer greater advantages that Costa Rica (Rosales and Arroyo, 2001). If we compare FDI incentives in Costa Rica with those offered by countries such as Ireland and Sweden, we find that income tax treatment in Costa Rica is more favorable for investors, but that this is offset by the financial incentives that those countries offer, such as grants, nonrefundable contributions, subsidies, and credit facilities. A similar situation appears when Costa Rica’s FDI incentives are compared with those in Southeast Asia.
Cost-Benefit Analysis of the Free Trade Zone System 10
1.3. The Evolution of FTZs in Costa Rica Since the mid-1980s Costa Rica has seen increasing flows of FDI, largely thanks to the economic liberalization program undertaken in those years, the greater access that Costa Rican products have enjoyed in the US market through the Caribbean Basin Initiative (CBI), as well as the availability of skilled workers and the efforts to attract foreign investment made by the Costa Rican Coalition for Development Incentives (CINDE), in cooperation with the national authorities (2001).1 Other favorable factors have been the country's political and economic stability, and the benefits associated with the free trade zone system (Graph 1.1). Yet it is since the second half of the 1990s that the country has recorded the greatest inflow of FDI, primarily from high-tech firms and businesses engaged in international services such as back-office and call centers (Graph 1.2). Graph 1.1. Costa Rica: Annual FDI Flows Graph 1.2. Costa Rica: Five-year FDI Flows
0
100
200
300
400
500
600
700
1970
1972
1974
1976
1978
1980
1982
1984
1986
1988
1990
1992
1994
1996
1998
2000
2002
2004
*
Milli
ons
of d
olla
rs
158
2,668
287 269434
1,111
2,403
0
500
1000
1500
2000
2500
3000
70-74 75-79 80-84 84-89 90-94 95-99 00-04*
Milli
ons
of d
olla
rs
* BCCR projection Source: Authors’ calculations using BCCR and UNCTAD data
In this context, and with one firm already operating in the Moin FTZ and another in the Santa Rosa FTZ, the Export Free Trade Zones Corporation authorized establishment of the Cartago Industrial Park and Free Trade Zone (PIZFC). This was the first to operate in the Central Valley, and it was managed by a private company. Its success sparked the interest of other private firms in type of business arrangement, particularly after the mid-1990s.2 It was because the government had had relatively little success in developing industrial parks that it gave the Export Free Trade Zones Corporation the power to contract for their administration under concessions. In effect, the State's role was to promote the FTZ system and not to run it.
1 More than 60% of the firms that have set up in Costa Rican FTZs in the last 15 years are US-owned. 2 There are currently about 10 industrial parks, most of them located near the Juan Santamaria International Airport.
Cost-Benefit Analysis of the Free Trade Zone System 11
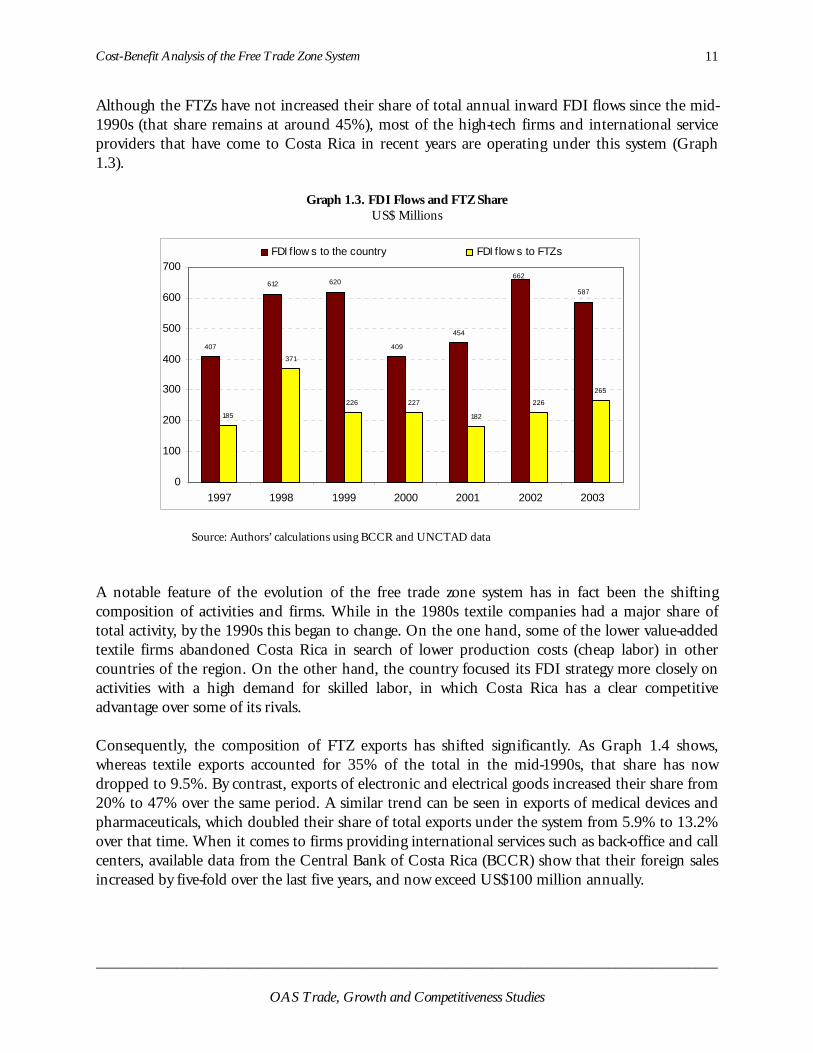
Although the FTZs have not increased their share of total annual inward FDI flows since the mid-1990s (that share remains at around 45%), most of the high-tech firms and international service providers that have come to Costa Rica in recent years are operating under this system (Graph 1.3).
Graph 1.3. FDI Flows and FTZ Share US$ Millions
407
612 620
409
454
587
185
371
226 227
182
226
265
662
0
100
200
300
400
500
600
700
1997 1998 1999 2000 2001 2002 2003
FDI f low s to the country FDI f low s to FTZs
Source: Authors’ calculations using BCCR and UNCTAD data
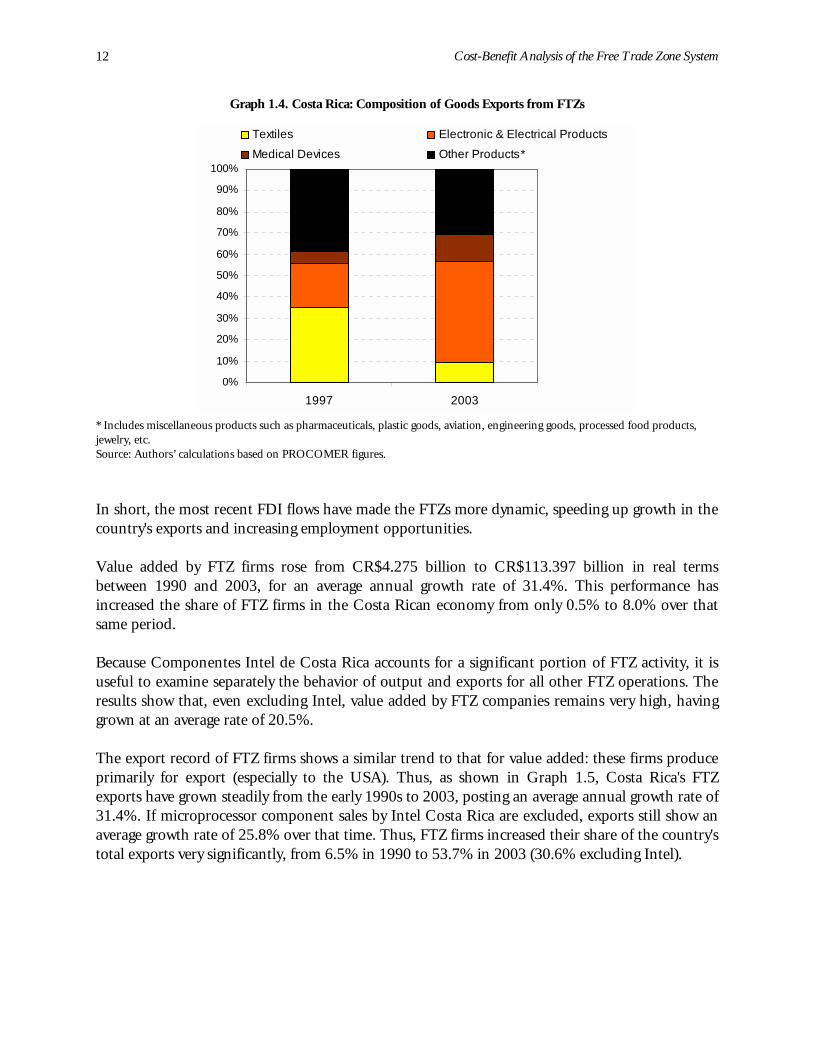
A notable feature of the evolution of the free trade zone system has in fact been the shifting composition of activities and firms. While in the 1980s textile companies had a major share of total activity, by the 1990s this began to change. On the one hand, some of the lower value-added textile firms abandoned Costa Rica in search of lower production costs (cheap labor) in other countries of the region. On the other hand, the country focused its FDI strategy more closely on activities with a high demand for skilled labor, in which Costa Rica has a clear competitive advantage over some of its rivals. Consequently, the composition of FTZ exports has shifted significantly. As Graph 1.4 shows, whereas textile exports accounted for 35% of the total in the mid-1990s, that share has now dropped to 9.5%. By contrast, exports of electronic and electrical goods increased their share from 20% to 47% over the same period. A similar trend can be seen in exports of medical devices and pharmaceuticals, which doubled their share of total exports under the system from 5.9% to 13.2% over that time. When it comes to firms providing international services such as back-office and call centers, available data from the Central Bank of Costa Rica (BCCR) show that their foreign sales increased by five-fold over the last five years, and now exceed US$100 million annually.
Cost-Benefit Analysis of the Free Trade Zone System 12
Graph 1.4. Costa Rica: Composition of Goods Exports from FTZs
0%
10%
20%
30%
40%
50%
60%
70%
80%
90%
100%
1997 2003
Textiles Electronic & Electrical Products
Medical Devices Other Products* * Includes mjewelry, etc.
iscellaneous products such as pharmaceuticals, plastic goods, aviation, engineering goods, processed food products,
Source: Authors’ calculations based on PROCOMER figures.
In short, the most recent FDI flows have made the FTZs more dynamic, speeding up growth in the country's exports and increasing employment opportunities. Value added by FTZ firms rose from CR$4.275 billion to CR$113.397 billion in real terms between 1990 and 2003, for an average annual growth rate of 31.4%. This performance has increased the share of FTZ firms in the Costa Rican economy from only 0.5% to 8.0% over that same period. Because Componentes Intel de Costa Rica accounts for a significant portion of FTZ activity, it is useful to examine separately the behavior of output and exports for all other FTZ operations. The results show that, even excluding Intel, value added by FTZ companies remains very high, having grown at an average rate of 20.5%. The export record of FTZ firms shows a similar trend to that for value added: these firms produce primarily for export (especially to the USA). Thus, as shown in Graph 1.5, Costa Rica's FTZ exports have grown steadily from the early 1990s to 2003, posting an average annual growth rate of 31.4%. If microprocessor component sales by Intel Costa Rica are excluded, exports still show an average growth rate of 25.8% over that time. Thus, FTZ firms increased their share of the country's total exports very significantly, from 6.5% in 1990 to 53.7% in 2003 (30.6% excluding Intel).
Cost-Benefit Analysis of the Free Trade Zone System 13
Graph 1.5. Costa Rica: Exports by FTZ Companies
0
500
1000
1500
2000
2500
3000
3500
4000
1990
1991
1992
1993
1994
1995
1996
1997
1998
1999
2000
2001
2002
2003
Mill
ions
of $
Total Exports
Exports excl. Intel
Source Authors’ calculations based on PROCOMER figures.
The foregoing is consistent with the findings of Bolin (1999), who compared the export performance of countries with and without FTZ programs and found that the exporting capacity of countries with FTZs tends to exceed that of countries that do not use this type of system, the prime explanation being that FTZs level the playing field for firms vis-à-vis their foreign competitors (Rhee, 1986). The decline in FTZ export performance between 2000 and 2001 is a direct reflection of the sharp drop in Intel's activity, which was hard-hit by the worldwide economic recession and the bursting of the Internet bubble on the stock market. In fact, if Intel's exports are excluded, we can see from Graph 1.5 that exports by the remaining FTZ companies in Costa Rica rose steadily over the entire period from 1990 to 2003. Another noteworthy feature of FDI covered by the FTZ system is that investors come primarily from the United States, in contrast to what has happened in other Central American countries, where such investment is a local or Asian in origin (Robles and Rodríguez, 2003). In fact, Jenkins et al. (2001) show that US capital accounts for 62% of free trade zone firms established in Costa Rica.
Cost-Benefit Analysis of the Free Trade Zone System 14
With respect to the labor force employed by FTZ firms, this has grown significantly, from 7000 in 1990 to 35,000 in 2002. It accounted for 15.6% of industrial employment in 2002, compared to only 3.8% in 1990. This labor force consists primarily of skilled workers, and indeed its human resources are one of Costa Rica’s principal sources of advantage (Monge, 2001). This growth is not surprising, when it is remembered that the number of firms operating under the system rose from 56 in 1990 to more than 200 in 2002, and that these firms have invested heavily, year after year, in Costa Rica.3
3 In the last five years (1997-2003) around 60% of FDI flows into Costa Rica represented investments by foreign companies already established in the country, including those within and outside the FTZ system.
Cost-Benefit Analysis of the Free Trade Zone System 15
II. MACROECONOMIC IMPACTS OF FDI UNDER THE FREE TRADE ZONE SYSTEM
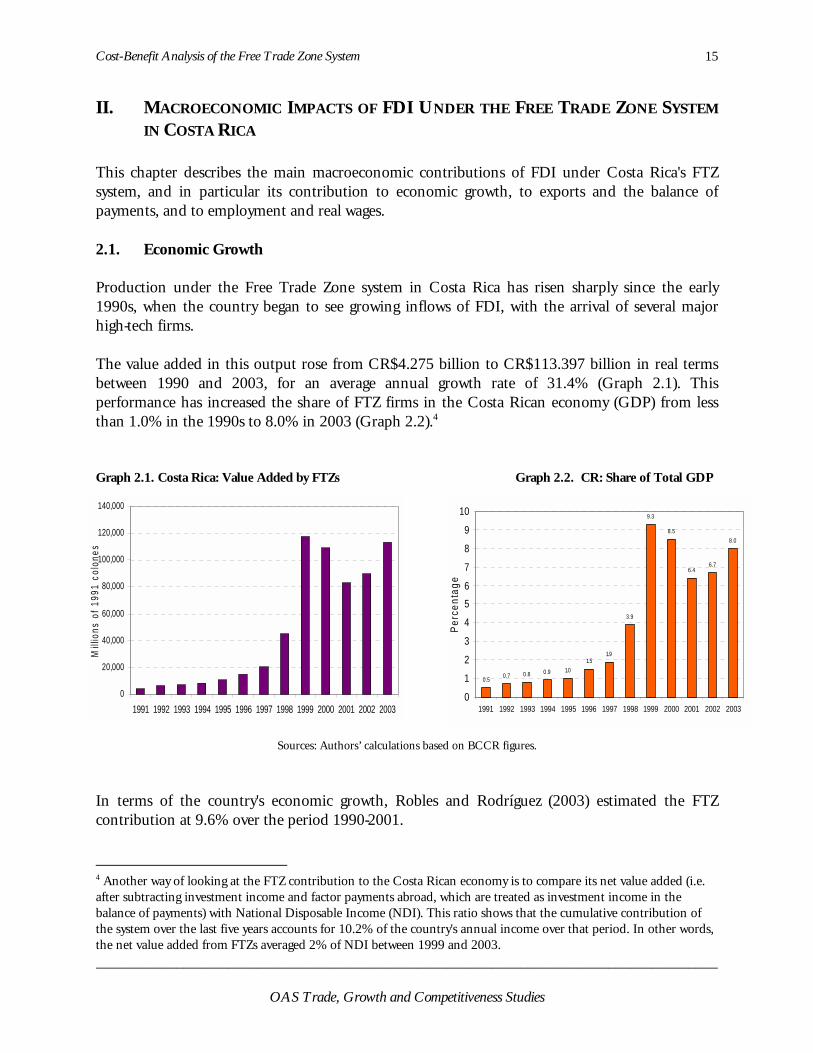
IN COSTA RICA This chapter describes the main macroeconomic contributions of FDI under Costa Rica's FTZ system, and in particular its contribution to economic growth, to exports and the balance of payments, and to employment and real wages. 2.1. Economic Growth Production under the Free Trade Zone system in Costa Rica has risen sharply since the early 1990s, when the country began to see growing inflows of FDI, with the arrival of several major high-tech firms. The value added in this output rose from CR$4.275 billion to CR$113.397 billion in real terms between 1990 and 2003, for an average annual growth rate of 31.4% (Graph 2.1). This performance has increased the share of FTZ firms in the Costa Rican economy (GDP) from less than 1.0% in the 1990s to 8.0% in 2003 (Graph 2.2).4 Graph 2.1. Costa Rica: Value Added by FTZs Graph 2.2. CR: Share of Total GDP
4 Another way of looking at the FTZ contribution to the Costa Rican economy is to compare its net value added (i.e. after subtracting investment income and factor payments abroad, which are treated as investment income in the balance of payments) with National Disposable Income (NDI). This ratio shows that the cumulative contribution of the system over the last five years accounts for 10.2% of the country's annual income over that period. In other words, the net value added from FTZs averaged 2% of NDI between 1999 and 2003.
Cost-Benefit Analysis of the Free Trade Zone System 16
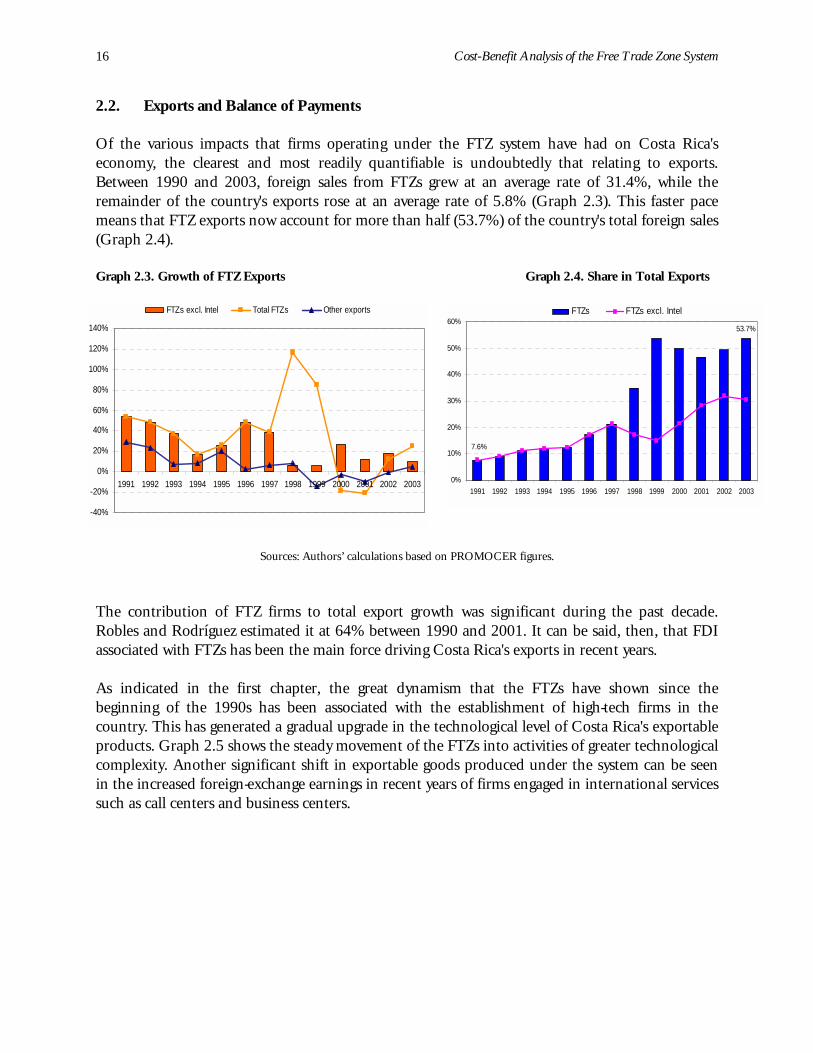
2.2. Exports and Balance of Payments Of the various impacts that firms operating under the FTZ system have had on Costa Rica's economy, the clearest and most readily quantifiable is undoubtedly that relating to exports. Between 1990 and 2003, foreign sales from FTZs grew at an average rate of 31.4%, while the remainder of the country's exports rose at an average rate of 5.8% (Graph 2.3). This faster pace means that FTZ exports now account for more than half (53.7%) of the country's total foreign sales (Graph 2.4). Graph 2.3. Growth of FTZ Exports Graph 2.4. Share in Total Exports
Sources: Authors’ calculations based on PROMOCER figures.
The contribution of FTZ firms to total export growth was significant during the past decade. Robles and Rodríguez estimated it at 64% between 1990 and 2001. It can be said, then, that FDI associated with FTZs has been the main force driving Costa Rica's exports in recent years. As indicated in the first chapter, the great dynamism that the FTZs have shown since the beginning of the 1990s has been associated with the establishment of high-tech firms in the country. This has generated a gradual upgrade in the technological level of Costa Rica's exportable products. Graph 2.5 shows the steady movement of the FTZs into activities of greater technological complexity. Another significant shift in exportable goods produced under the system can be seen in the increased foreign-exchange earnings in recent years of firms engaged in international services such as call centers and business centers.
Cost-Benefit Analysis of the Free Trade Zone System 17
Graph 2.5. Costa Rica: Technological Intensity of FTZ Goods Exports
0%
10%
20%
30%
40%
50%
60%
70%
80%
90%
100%
1994 1997 1998 2000 2002
ScaleIntensive
ResourceIntensive
LaborIntensive
DifferentiatedProduct
Scientif ic base
Source: Authors’ calculations based on OECD-UN trade data
The positive impact of the FTZs, through their export effect, can also be seen in the balance of payments. The FTZ system has been recording a steadily rising surplus on its physical trade account (exports less imports), as high-tech firms and international service companies have entered the country (Graph 2.6).
Graph 2.6. Costa Rica: Exports and Imports of Goods by FTZ Firms
Cost-Benefit Analysis of the Free Trade Zone System 18
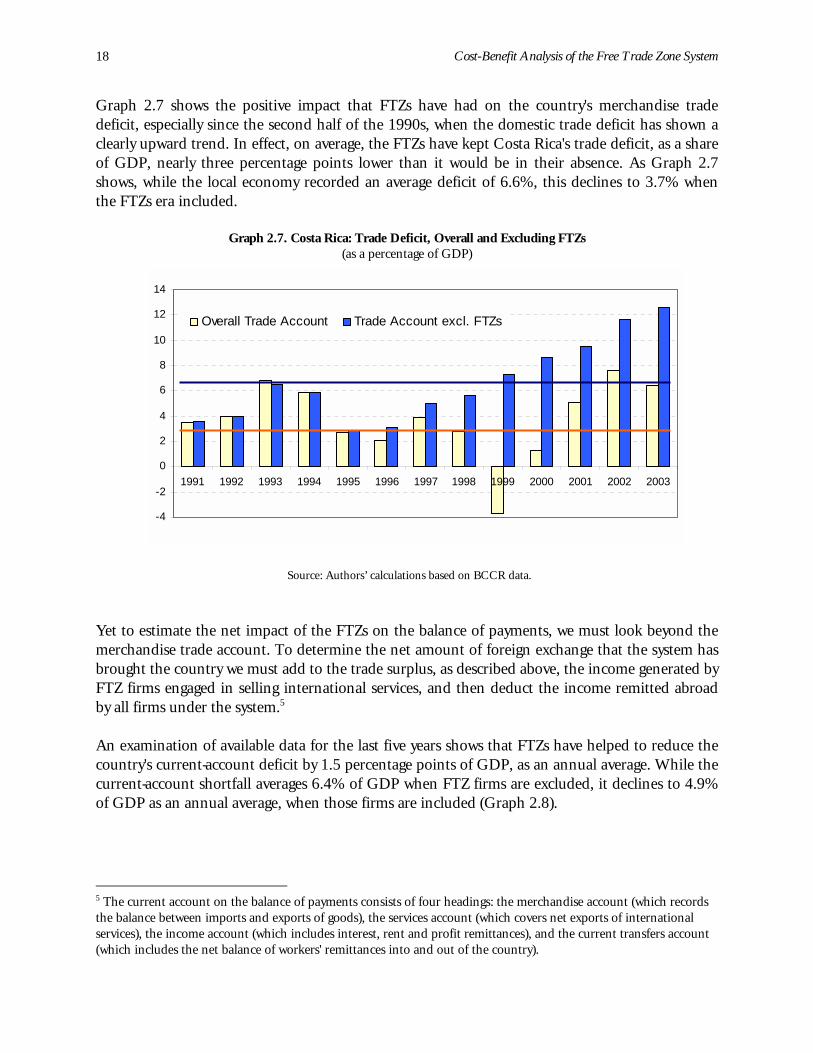
Graph 2.7 shows the positive impact that FTZs have had on the country's merchandise trade deficit, especially since the second half of the 1990s, when the domestic trade deficit has shown a clearly upward trend. In effect, on average, the FTZs have kept Costa Rica's trade deficit, as a share of GDP, nearly three percentage points lower than it would be in their absence. As Graph 2.7 shows, while the local economy recorded an average deficit of 6.6%, this declines to 3.7% when the FTZs era included.
Graph 2.7. Costa Rica: Trade Deficit, Overall and Excluding FTZs (as a percentage of GDP)
Yet to estimate the net impact of the FTZs on the balance of payments, we must look beyond the merchandise trade account. To determine the net amount of foreign exchange that the system has brought the country we must add to the trade surplus, as described above, the income generated by FTZ firms engaged in selling international services, and then deduct the income remitted abroad by all firms under the system.5 An examination of available data for the last five years shows that FTZs have helped to reduce the country's current-account deficit by 1.5 percentage points of GDP, as an annual average. While the current-account shortfall averages 6.4% of GDP when FTZ firms are excluded, it declines to 4.9% of GDP as an annual average, when those firms are included (Graph 2.8).
5 The current account on the balance of payments consists of four headings: the merchandise account (which records the balance between imports and exports of goods), the services account (which covers net exports of international services), the income account (which includes interest, rent and profit remittances), and the current transfers account (which includes the net balance of workers' remittances into and out of the country).
Cost-Benefit Analysis of the Free Trade Zone System 19
Graph 2.8. Costa Rica: Current Account Deficit (as a percentage of GDP)
0123456789
1999 2000 2001 2002 2003
Per
cent
age
Overall Trade Account Trade Account excl. FTZs
Source: Authors’ calculations based on PROCOMER and BCCR data.
In terms of the foreign exchange contribution to the Costa Rican economy, the figures shown above represent an average annual inflow of US$243.5 million, accounting for 16.3% of Costa Rica's average annual international monetary reserves. Moreover, the statistics show that in the last five years the FTZs have received on average about 45% of the FDI recorded as entering the country. This represents an average annual contribution of US$225 million to the capital account in the balance of payments. Finally, a further positive impact of the FTZs on the balance of payments lies in the local purchases of inputs and services that these firms buy from Costa Rican SMEs, which represent indirect exports for the national economy. In absolute terms, they show a rising tendency overtime, as can be seen in Graph 2.9. Nevertheless, when compared with the total imports of raw materials by FTZ firms, local purchases represented on average only 6% during the last 10 years.
Graph 2.9. Costa Rica: Local Purchases by FTZs
0
10
20
30
40
50
60
70
80
90
1993 1994 1995 1996 1997 1998 1999 2000 2001 2002
Mill
ions
of $
Source: Authors’ calculations based on PROCOMER data.
Cost-Benefit Analysis of the Free Trade Zone System 20
The most recent economic literature on backward and forward linkages and spillovers arising from the relationship between multinational firms and local firms producing goods and services tends to highlight the importance of the FTZs as a potential source of productive spillovers for domestic firms and for the economy in general. Recognizing the importance of this topic, Chapter 3 of this paper examines the possible impact in greater detail, based on a survey of a representative sample of local suppliers.6 2.3. Employment and Real Wages The Impact of FDI on Employment Level s
A characteristic feature of Costa Rica's FTZs since the 1990s has been their demand for skilled labor. The gradual shift to more technology- and knowledge-intensive activities in the zones, together with the arrival of firms in the electronics and medical equipment fields, has favored the employment of more highly skilled human resources. International service firms, for their part, have increased the demand for staff with bilingual and accounting skills. As shown in Graph 2.10, employment in the FTZs has grown significantly since the early 1990s, rising from 7,000 workers in 1990 to around 35,000 in 2002, reflecting one of Costa Rica's advantages for attracting FDI, which is its skilled workforce. With the sustained growth in the number of firms in FTZs, the share of their employment in total Costa Rican industrial employment has also been rising, and stood at 16% in 2002 (Graph 2.11).7 Graph 2.10. Costa Rica: Number of FTZ Jobs Graph 2.11. Share of FTZ Jobs in Total
Source: Authors’ calculations based on PROCOMER and BCCR data.
Multinational corporations point to labor skills as a determining factor in their decisions to invest in a given country. This is particularly true of firms in the high-tech fields (UNCTAD, 1996). The Foreign Investment Advisory Services (FIAS) found, in a 1999 survey of 61 leading US firms in
6 Fifty-eight (58) of the 143 active suppliers in Costa Rica were surveyed. 7 This ratio is derived by dividing the number of FTZ employees by total registered employment in the Costa Rican industrial sector, using official figures.
Cost-Benefit Analysis of the Free Trade Zone System 21
electronics, medical accessories and services, that the educational level of workforce is one of the prime factors that influence where a firm will set up shop abroad. In the specific case of Costa Rica, Rosales and Gipson (2001) found that for firms in the electronic, electrical and medical devices sectors operating in the free trade zones, education is one of the principal factors that led to their selection of the country as a destination for their direct investment. Other aspects indicated by those companies as important, such as the skills and abilities, speed of learning, and productivity of the workforce, are also directly related with the level of education that Costa Rican workers possess (Graph 2.12).
Graph 2.12. Costa Rica: Determinants of Labor Demand by FTZ Firms
Source: Rosales and Gipson (2001)
aid by MNCs: A Partial Equilibrium Approach
he higher demand for labor by FTZ firms has translated into better wages for MNC employees nder this system. In comparison with the average industrial wage in Costa Rica over the last five ars, the average rate paid by FTZ employers is around 20% higher (Graph 2.13).
Cost-Benefit Analysis of the Free Trade Zone System 22
Graph 2.13. Costa Rica: Average Wage, Industry-Wide and FTZ (last 5 years)
Source: Authors’ calculations based on PROCOMER and BCCR data.
This finding is consistent with the rising trend in value-added per worker in FTZ companies, which exceeds that in local industry by a wide margin (Graph 2.14). In fact, Rodríguez-Clare et al. (2002) found that labor productivity in FTZ firms rose by 10% between 1991 and 2000.
Graph 2.14. Costa Rica: Value Added Per Worker
Source: Authors’ calculations based on PROCOMER and BCCR data.
Cost-Benefit Analysis of the Free Trade Zone System 23
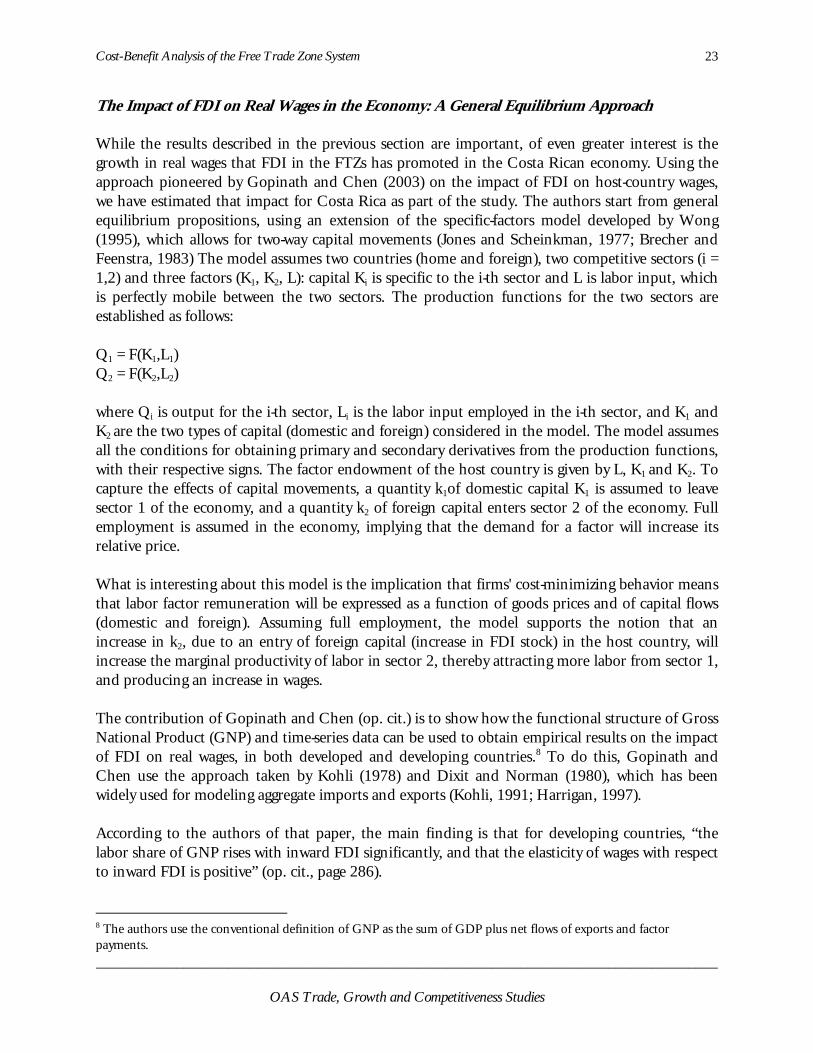
The Impact of FDI o Approach
hile the results described in the previous section are important, of even greater interest is the rowth in real wages that FDI in the FTZs has promoted in the Costa Rican economy. Using the pproach pioneered by Gopinath and Chen (2003) on the impact of FDI on host-country wages, e have estimated that impact for Costa Rica as part of the study. The authors start from general quilibrium propositions, using an extension of the specific-factors model developed by Wong 995), which allows for two-way capital movements (Jones and Scheinkman, 1977; Brecher and
eenstra, 1983) The model assumes two countries (home and foreign), two competitive sectors (i = ,2) and three factors (K1, K2, L): capital Ki is specific to the i-th sector and L is labor input, which perfectly mobile between the two sectors. The production functions for the two sectors are stablished as follows:
1 = F(K1,L1) 2 = F(K2,L2)
here Qi is output for the i-th sector, Li is the labor input employed in the i-th sector, and K1 and 2 are the two types of capital (domestic and foreign) considered in the model. The model assumes
assumed to leave ctor 1 of the economy, and a quantity k2 of foreign capital enters sector 2 of the economy. Full
employment is assumed in r a factor will increase its lative price.
hat is at laboomesti notion that an crease crease from sector 1,
nd prod
he contationalf FDI ohen us idely us
ccording to the authors of that paper, the main finding is that for developing countries, “the labor share of GNP ris of wages with respect
inward FDI is positive” (op. cit., page 286).
n Real Wages in the Economy: A General Equilibrium
Wgawe(1F1ise QQ wKall the conditions for obtaining primary and secondary derivatives from the production functions, with their respective signs. The factor endowment of the host country is given by L, K1 and K2. To capture the effects of capital movements, a quantity k1of domestic capital K1 is se
the economy, implying that the demand fore W interesting about this model is the implication that firms' cost-minimizing behavior means
r factor remuneration will be expressed as a function of goods prices and of capital flows c and foreign). Assuming full employment, the model supports thein k2, due to an entry of foreign capital (increase in FDI stock) in the host country, will
the marginal productivity of labor in sector 2, thereby attracting more laborucing an increase in wages.
ribution of Gopinath and Chen (op. cit.) is to show how the functional structure of Gross Product (GNP) and time-series data can be used to obtain empirical results on the impact n real wages, in both developed and developing countries.8 To do this, Gopinath and e the approach taken by Kohli (1978) and Dixit and Norman (1980), which has beened for modeling aggregate imports and exports (Kohli, 1991; Harrigan, 1997).
th(dinina TNoCw A
es with inward FDI significantly, and that the elasticityto
8 The authors use the conventional definition of GNP as the sum of GDP plus net flows of exports and factor payments.
Cost-Benefit Analysis of the Free Trade Zone System 24
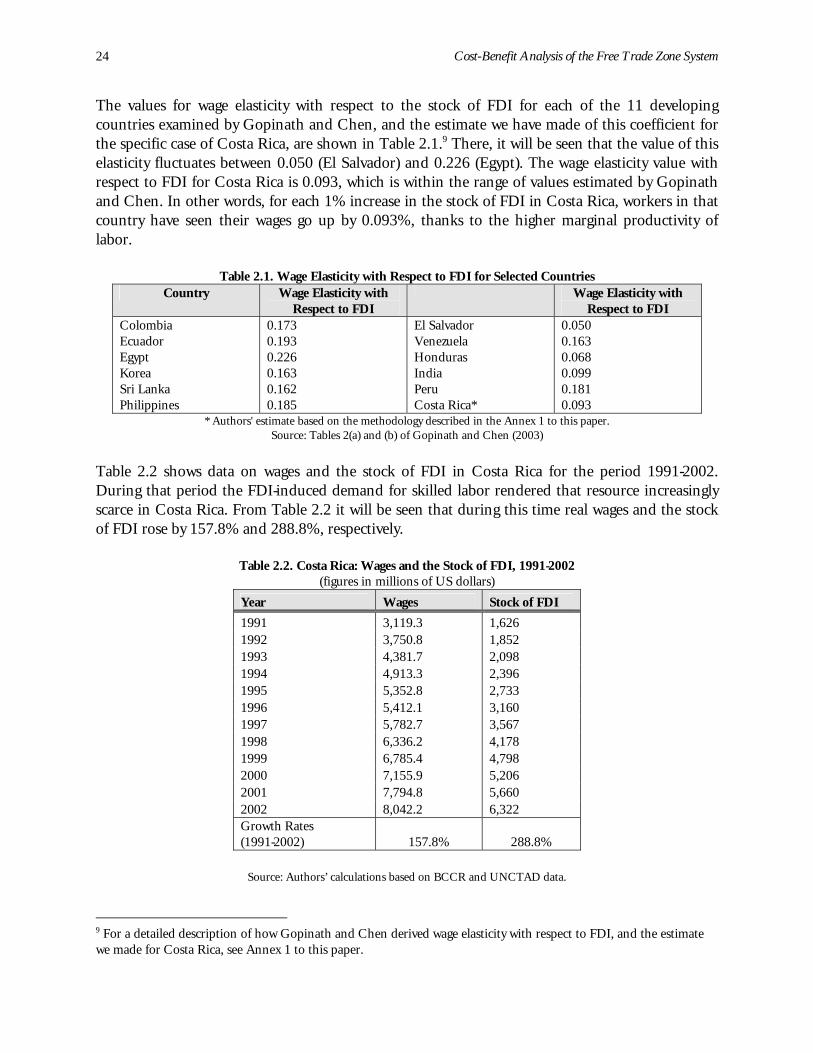
The values for wage elasticity with respect to the stock of FDI for each of the 11 developing untries examined by Gopinath and Chen, and the estimate we have made of this coefficient for co
the specific case of Costa Rica, are shown in Table 2.1.9 There, it will be seen that the value of this elasticity fluctuates between 0.050 (El Salvador) and 0.226 (Egypt). The wage elasticity value with respect to FDI for Costa Rica is 0.093, which is within the range of values estimated by Gopinath and Chen. In other words, for each 1% increase in the stock of FDI in Costa Rica, workers in that country have seen their wages go up by 0.093%, thanks to the higher marginal productivity of labor.
Table 2.1. Wage Elasticity with Respect to FDI for Selected Countries Country Wage Elasticity with Country Wage Elasticity with
Colombia Respect to FDI Respect to FDI
Ecuador
Sri Lanka
0.173 0.193 0.226 0.163 0.162
El Salvador Venezuela Honduras India Peru
0.050 0.163 0.068 0.099 0.181
Egypt Korea
Philippines 0.185 Costa Rica* 0.093 * Authors' estimate based on the methodology described in the Annex 1 to this paper.
Source: Tables 2(a) and (b) of Gopinath and Chen (2003)
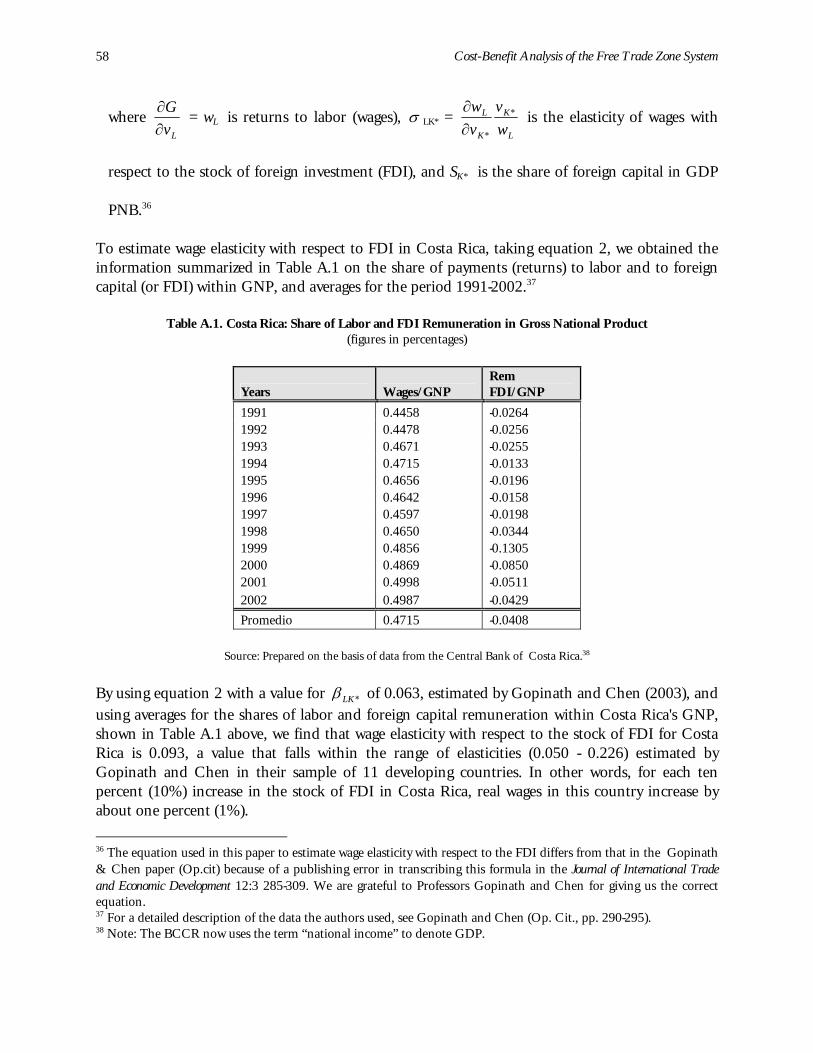
Table 2.2 shows data on wages and the stock of FDI in Costa Rica for the period 1991-2002. During that period the FDI-induced demand for skilled labor rendered that resource increasingly scarce in Costa Rica. From Table 2.2 it will be seen that during this time real wages and the stock of FDI rose by 157.8% and 288.8%, respectively.
Table 2.2. Costa Rica: Wages and the Stock of FDI, 1991-2002 (figures in millions of US dollars)
Source: Authors’ calculations based on BCCR and UNCTAD data.
imate
r Costa Rica, see Annex 1 to this paper.
9 For a detailed description of how Gopinath and Chen derived wage elasticity with respect to FDI, and the estwe made fo
Cost-Benefit Analysis of the Free Trade Zone System 25
Taking the values obtained for wage elasticity with respect to FDI, and the growth rates for real wages and the stock of FDI in Costa Rica, as shown in Tables 2.1 and 2.2, we went on to estimate the contribution of FDI to real wage growth in this country. Table 2.3 shows the results of that exercise. They support the conclusion that the inflow of FDI to Costa Rica between 1991 and 2002 had a positive and significant impact on real wage growth in this country: 17% of the growth in real wages can be attributed to the increase in the stock of FDI over that period (i.e. to the FDI-induced increase in the marginal productivity of labor). This represents a very important contribution by FDI to the economic welfare of Costa Rican workers, estimated in monetary terms t US$836 million over the past decade (1991-2002).
T pact of FD Wages
ousands of US dollars)
(1) Rate of Growth of FDI Stock 1991/2002 88.8%
a
able 2.3. Costa Rica: Im(figures in th
I on Real
2th of Re 1ty with R 0
(4) Rate of Wage Growth Due to FDI 6.8% 2
(2) Rate of Grow al Wages 1991/2002 57.8% (3) Wage Elastici espect to FDI Stock .093
(5) R % atio (4)/(2) 17.0(6) Growth of Rea 4,922.8 l Wages Between 1991 and 2002 in US$ Millions (7) Contribution of FDI to Real Wage Growth in US$ Millions 836.0
Source: Authors’ calculations based on Tables 2.1 and 2.2.
Because FDI associated with the FTZ accounts for approximately half (45%) of FDI inflows to
osta Rica during the period 1991-2002, we may conclude that the increased demand for labor by MNCs in the FTZs h ly US$376.2 million over the same period. That is, an in per year in this economy.10
Cas produced an increase in real wages of approximate
10 Estimated as the average contribution during the eleven years period divided by the total labor force of Costa Rica by the year 2002 (approximately 1.3 million workers
Cost-Benefit Analysis of the Free Trade Zone System 27
III. SPILLOVERS OF FDI UNDER THE FTZ SYSTEM 3.1. Backward Linkages Between Multinationals and Local Firms Policymakers and academics frequently debate the possibility that foreign direct investment (FDI) can constitute a valuable source of productive spillovers for developing countries.11 In the search for such benefits, Costa Rica launched a unilateral process of liberalization over the last two decades, while at the same time encouraging exports of nontraditional products, all of which reduced barriers to FDI appreciably. In addition to be coming economically more open, the country adopted a series of tax incentives (exemptions from import taxes on raw materials, inputs and capital goods, as well as income tax) to attract foreign firms that would produce primarily for export. FDI can generate positive spillovers in production through various mechanisms. The best known takes the form of knowledge spillovers from multinationals to domestic firms in the host country, and this can be produced through various channels. For example, there is worldwide evidence that multinational corporations (MNCs) make significant efforts to train their local workers (Lindsey, 1986), and that multinationals offer more training to their technical and administrative staff and local firms (Chen, 1983; Gershenberg, 1987). As well, there is evidence that MNC employees often leave these firms and move on to domestic firms (spillovers) or to start their own business in the host country (spin-offs). Most of the training that MNC workers receive is paid for, not by the workers, but by the MNCs themselves; it does not constitute knowledge specific to the firm, but can be used by other firms. Therefore, the movement of workers from MNCs to local firms constitutes a positive externality that will lead to higher wages for these workers and/or greater productivity for the firms that employ them, once they leave their jobs with multinationals.12 Something very similar happens when workers increase their knowledge, not through formal labor training, but through job training, learning by doing, or learning by observing.13 Although the economic literature has been unable to confirm, convincingly and for all cases studied, that FDI produces positive spillovers for host countries, there are studies that have
11 The literature on foreign direct investment is vast and has been summarized many times. For recent summaries, see Markusen (1995), Caves (1996), Blömstrom and Kokko (1998). 12 Fosfuri, Motta and Ronde (2001) put this idea in formal terms. In their model, a multinational firm can use a superior technology only after it has trained its local workforce. The FDI-induced spillover of technologies occurs, then, when domestic firms employ these workers. Monetary spillovers occur when the foreign subsidiary pays higher wages to its workers to keep them from leaving.
13 One would expect that knowledge about production processes will spread from one firm to others simply through normal human interaction among people doing similar work in different firms. A more sophisticated kind of explicit or tacit knowledge transfer can take place when there is interaction between multinationals and local firms, for example between multinationals and their local suppliers. In some cases, multinationals cooperate with educational institutions in the host country to design special training programs (World Bank, 1995; Spar, 1998; Larraín, López and Rodríguez-Clare, 2000).
Cost-Benefit Analysis of the Free Trade Zone System 28
identified such benefits.14 For the particular case of Costa Rica, there is virtually no literature on this topic.15 On the premise that encouraging productive linkages between MNCs and local firms is a mechanism for promoting positive spillovers into the rest of the Costa Rican economy, a number of public, private and academic agencies (PROCOMER, CINDE, CICT and CONARE) pooled their efforts, with the economic support of the Inter-American Development Bank (IDB-MIF), in a project to create a unit known as "Costa Rica PROVEE", with a mission to facilitate business between local firms and MNCs, and thereby to help boost local value added and enhance the country's overall competitiveness. The Costa Rica PROVEE program (CRP) works directly with MNCs to identify projects that offer a potential for Costa Rican firms. CRP provides technical advice to domestic firms (primarily SMEs) for improving their productive capacity and their business relationships. CRP also provides analytical studies for selected SMEs that have the experience and expertise needed to produce a product or service demanded by the MNC. After four years of operation, the CRP has produced some encouraging results: linkages have been growing steadily (2001:1; 2002:9; 2003:32; 2004:100 projects, of which 11 were underway in March of that year, and most have been identified as having potential). It is estimated that 74% of the linkages achieved through Costa Rica PROVEE relate to the production of goods required by MNCs in their productive processes, while the remainder are services. These linkages come on top of others that have already appeared in a parallel way in the country, either because MNCs have their own programs to develop Costa Rican suppliers (e.g. Baxter and Intel), or because domestic firms have lined up sales of their products or services to MNC firms established primarily in the FTZs. Taking into account the previous arguments about the potential importance of productive linkages between MNCs and Costa Rican firms, this chapter addresses several objectives: (i) to determine the principal characteristics of the firms that supply inputs and services to multinationals in the FTZs; (ii) to identify the main features characterizing the relationship between supplier firms and MNCs; (iii) to analyze the impact of productive linkages between such firms on the total productivity of supplier firms; and (iv) to identify the existence of knowledge spillovers deriving from those linkages. In pursuit of these objectives, we first had to identify those firms that were producing some good or service for multinational companies operating in Costa Rica under the FTZ: i.e., to identify clearly the firms supplying local inputs and services to multinational firms in the country.16 Once we had identified this group of supplier firms, we selected a representative sample (58 firms) from 14 In a recent empirical work, Hanson (2001) finds only weak evidence that FDI generates positive spillovers for host countries. In a thorough review of the existing literature, however, Lipsey (2002) comes up with more favorable findings. 15 The most recent empirical studies of this topic, although they are descriptive in nature, are those of Monge (2000), Monge (2001), and Robles and Rodríguez (2003). 16 In all, we were able to identify 143 supplier firms active in Costa Rica, from the records of PROCOMER.
Cost-Benefit Analysis of the Free Trade Zone System 29
which we collected, through a survey, the information needed to determine their characteristics, the type of relationship between suppliers and MNCs, the existence of knowledge spillovers from multinational to local firms, and the relative importance of this transfer for the importance of the supplier firms.17 3.1.1. Characteristics of Local Supplier Firms The population of firms producing inputs and services for MNCs established in Costa Rica under the free trade zones system was estimated at 143.18 We called these firms "local suppliers," and distinguished them from companies devoted to purely commercial activities. By examining the characteristics of these firms through a selective sample representing 58 of them, we found that the great majority (75%) began operations within the last 20 years, i.e. during the period when Costa Rica's economy was opening up. Another characteristic of these enterprises is that all of them (99.3%) belong to the micro, small and medium-sized sector (MSMEs). Moreover, 67.2% of all local supplier firms employ between five and 30 workers, which classes than as small enterprises.19 Nearly all of these MSMEs (96%) are 100% Costa Rican in ownership. 3.1.2. The Relationship Between Local Suppliers and MNCs Since when have local suppliers been selling inputs and services to MNCs? We found that fewer than a quarter of these firms (22.6%) had a relationship with MNCs before the economic opening began in 1984, which means that the great majority made their first business contact with the MNCs during the implementation of the new, outward-oriented development strategy. It would appear, then, that one important impact of MNCs in Costa Rica has been to create a new market for the MSMEs, many of which have never exported directly. In fact, slightly over half (55%) of local suppliers have made no sales abroad during the last five years. In short, sales of inputs and services by local suppliers to MNCs can be considered a form of indirect export, since the MNCs are operating under a free trade system through the FTZs. Producing inputs and services for MNCs represents an intermediate step or a learning curve whereby these local suppliers can subsequently become exporters, to Central America and to third markets.
17 Although the sample contained 58 firms, data collection problems meant that the econometric model discussed in the following sections was confined to 53 firms. 18 We obtained this figure by refining the PROCOMER database on firms supplying multinationals, screening out all those firms of a purely commercial nature, and retaining only those that produced an input or service that they sold to multinational firms. In addition, we used the UNCTAD definition of suppliers: firms that produce inputs or services for MNCs and that are at least 90% domestically owned.
19 In fact, the survey shows that 12.1% of local suppliers are microenterprises (fewer than five employees), 67.2% are small (between 6 and 30 employees), 20% are mid-sized (between 31 and 100 employees), and only 0.7% are big (with more than 100 employees).
Cost-Benefit Analysis of the Free Trade Zone System 30
Of those local suppliers that claimed to be exporting, roughly a third (34.6%) said that their dealings with multinationals in Costa Rica had an important and positive impact on their export performance. This represents a significant finding about the potential impact of MNCs on the performance of MSMEs in Costa Rica. The major export market for these local suppliers would appear to be Central America (96%), and only 13% declared that they were exporting to third countries. The literature has made much of the concern that MNCs can wield great bargaining power in their relationships with local suppliers, especially where the local supplier produces exclusively for the MNC or was even created to sell to the MNC (UNCTAD, 2001). This concern does not appear to be of great relevance in the specific case of Costa Rica, for the following reasons: (i) the great majority of local suppliers (89.7%) were already operating in the country before they established a commercial relationship with MNCs; (ii) only 10.3% of local suppliers say they are not selling to at least two MNCs. In fact, as Table 3.1 shows, half of local suppliers (50%) are selling their products or services to five multinationals or fewer, a quarter (27.6%) have between six and 15 MNC clients, and the remainder (22.4%) deal with more than 18 MNCs; (iii) a significant percentage of local suppliers (37.9%) said it was the MNC that sought them out to supply goods or services; and (iv) the relative importance of sales to MNCs is still low for local suppliers, as can be seen in Table 3.2, fluctuating between 28% of 1999 sales, and 24% for 2003.
Table 3.1. Costa Rica: Relationship between Local Suppliers and MNCs
Source: Author’s calculations based on survey results.
For most local suppliers (70.7%), being a supplier to multinational firms has had a positive impact on their sales performance, and for more than half of these firms (58%) that relationship has led to an improvement in the quality of their products. As a means of investigating the existence of knowledge spillovers from MNCs to local suppliers, we looked at three channels whereby such transfers could take place in Costa Rica. We found that only 27.5% of local suppliers report having received training from MNCs to help sell then inputs and services. All these firms indicated that they were using new know-how acquired from the MNCs to produce goods and services for sale to other Costa Rican firms. This finding is important, for nearly all the local suppliers (93%) said the products they sell to the MNCs are virtually the same as those they sell to other Costa Rican firms. Another mechanism through which knowledge can be transferred from multinationals to local suppliers occurs when these local firms hire qualified personnel (managers, engineers and technicians) who have previously worked for MNCs in Costa Rica. Our study shows that 36.2% of managers, 27.6% of engineers, and 31.0% of technicians working for local suppliers have previously worked in the country's MNCs. These figures are high for a small economy like Costa Rica’s, and would seem to indicate that there is stiff competition for such personnel in the productive sector. This result reinforces the findings on the impact of FDI on the growth of real wages in Costa Rica during the decade 1991-2002, as discussed in Chapter 2. Finally, we asked how many local supplier firms were created by former employees of MNCs in Costa Rica: 27.6% of local suppliers reported that at least one of their owners had previously worked for some MNC in the country. This point is important, in light of international experience: in Bangladesh, for example, textile exports surged after Daewoo (a multinational) established a textile plant in 1979. Of the 130 Bangladeshi workers who were given familiarization training in Daewoo technology in Korea, 115 subsequently left Daewoo to set up their own textile processing plants for export.20 Similarly, in his study of Taiwan, Pack (1997) found evidence that
20 To put this example in perspective, it should be noted that before Daewoo set up its Bangladesh subsidiary, there were only 40 people working in that country in textile processing for export (Rhee, Ross-Larson and Pursell, 1984).
Cost-Benefit Analysis of the Free Trade Zone System 32
managers trained by multinationals typically left those firms to create their own companies, and that this type of labor mobility from multinationals to local firms was important. In light of all these findings, we decided to examine the possible relationship between average productivity in local supplier firms in general, and that prevailing in the production and sale of inputs and services for MNCs, and to investigate whether the knowledge spillovers described above, as identified in Costa Rica specifically, might explain the differences in average productivity for sales by local suppliers. The model used for this analysis, and the results obtained, are discussed in the following section. 3.2. Identifying knowledge spillovers We used a partial equilibrium model to study the relative importance of linkages (and their spillovers) between multinationals established in Costa Rica and local firms. The objective was to answer the following questions: Is there a relationship between average productivity in sales to multinationals and total productivity of the supplier firms? How important are knowledge spillovers in determining the average productivity of sales to multinationals by local suppliers? This chapter estimates a system of simultaneous equations, consisting of two linear equations: one equation for the average productivity of total sales by the local supplier (Ytotal/L), and a second equation for average productivity of the local supplier's sales to multinationals (Ymnc/L). This set of equations can be written in the following manner: Ytotal/L = β0 + β1 Ymnc/L + β2 I + eYtotal/L (1) Ymnc/L = β3 + β4 X + β5 Lmnc + β6 Spo + β7 Ytotal/L + β8 Cap + eYmnc/L (2) where e is the error term added to each equation, and each of the variables is defined as follows: 1. Average total productivity of the supplier firm Ytotal/L = log (value of total sales/total number of workers) 2. Average productivity of sales to multinationals Ymnc/L = log (value of sales to MNCs/total number of workers) 3. Capital investment per worker I = log (amount of capital invested/total number of workers) 4. Exports per worker X. = log (value of exports/total number of workers)
Cost-Benefit Analysis of the Free Trade Zone System 33
5. Percentage of the supplier firm's technicians, engineers and managers who previously worked into multinational in Costa Rica Lmnc = (technicians + engineers + managers)/total number of workers 6. Training (capacitación, “Cap”) provided by MNCs to the supplier firm Cap = dummy that takes the value of 1 if the supplier firm has received training from MNCs in order to sell them products or services, and 0 in the other case. 7. The spin-off effect where the owner of the supplier firm previously worked for MNC in Costa Rica. Spo = dummy that takes the value of 1 if the supplier firm's owner worked previously for an MNC in Costa Rica, and 0 in the other case. With respect to the relationship of the variables 1 and 2 in equation 1, we expect that its sign will be positive, since the supplier firm's total productivity should be influenced positively by the productivity it obtains in producing and selling inputs or services to multinationals (β1 > 0). The reasoning here is that multinationals operating under the free trade zone system are technologically more advanced than the remainder of Costa Rican firms, meaning that if a local firm can sell to a multinational it must have achieved a greater level of efficiency than that prevailing in its other domestic or export sales. A positive coefficient for the relationship between these two variables would thus imply a possibility of a positive spillover (through greater efficiency) to the supplier firm's other clients. The rationale for variable 3 of equation 1 lies in empirical evidence showing that firms tend to be more productive when they have greater investment capacity. Therefore, we expect its coefficient in equation 1 to be positive. Variable 4, export capacity, is very important: the literature shows that the most productive firms tend to be those that export, particularly in the case of developing countries.21 Furthermore, we must expect that, as the economy becomes more open, those firms with greater export capacity will have more knowledge, which will allow them to position themselves within the production line of multinational firms. For this reason, this variable is included in equation 2 and not in equation 1, and its coefficient is expected to be positive. It is important to note that the capital investment and export variables have been divided by the total number of workers, in order to control for firm size.22 To capture the relative importance of knowledge spillovers from multinationals to local suppliers, we incorporated three variables in equation 2, each of which seeks to capture a specific type of spillover. The variable Lmnc tries to capture the relative importance of the knowledge acquired by
21 In fact, in a review of the most recent literature on the performance of exporting and not exporting firms, Tybout (2000) found that firms that export are more efficient than those that do not.
22 According to Clarke and Wallsten (2004), several studies summarized by Biggs (2003) show that small firms in developing countries tend to export less than big firms.
Cost-Benefit Analysis of the Free Trade Zone System 34
the supplier firm's engineers, technicians and managers if they worked previously for multinational firms in Costa Rica. If there is such a transfer, it could have been effected through formal labor training, through job training, through learning by doing, or through learning by observing. Since we know from experience in other countries that multinationals make an effort to train their local suppliers (UNCTAD, 2001), the Cap variable seeks to capture this type of knowledge spillovers for Costa Rica. Finally, we wanted to see whether the fact that the owner of a supplier firm was employed by a MNC has a positive impact on the firm's productivity in selling goods or services to multinationals (the spin-off effect). For this reason, we have included the Spo variable in equation 2, to capture this effect for Costa Rica. Obviously, in light of the rationale for the knowledge spillovers variables described, we expect that their coefficients will have a positive sign. The system of equations was estimated using the three-stage least squares method (3SLS), for several reasons. First, if we were to apply the ordinary least squares method, OLS, separately to each of the structural equations, we would end up with biased and inconsistent estimates, due to the correlation between the error terms in the equations and some of the endogenous variables (simultaneous estimation bias). Second, the order condition showed that the system of equations is overidentified, and so the indirect least squares method (ILS) cannot be used, since it would be impossible to obtain single estimates for the structural parameters.23 Third, a two-stage least squares procedure (2SLS) resolves the simultaneous estimation bias and the identification problem when the equations are overidentified.24 Finally, because one of the structural equations is not exactly identified and the variance-covariance matrix turned out to be non-diagonal, we used a three-stage least squares procedure (3SLS), which is asymptotically more efficient than the 2SLS procedure.25 The database used for running the model comes from a survey conducted in early 2004 of a sample of 53 Costa Rican firms supplying inputs and services to multinationals in the free trade zones, as described in the previous section. The results shown in Table 3.3 indicate that, for Costa Rica, the model identifies satisfactorily the relationship between the backward linkages of multinationals to local firms and the total productivity of local firms, and it identifies the importance of knowledge spillovers from those linkages. In fact, five of the nine parameters turned
23 The order condition was tested using the method of Koutsoyiannis (1977). An equation is over-identified if 9K-M)>(G-1) and it is identified if (K-M) = (G-1), where: G = total number of endogenous variables in the system [2], K = number of variables in the system, and [16] M = number of variables included in each equation [3, 6]. 24 It is important to note that, while the use of data from firms of different sizes is likely to produce problems of heteroskedasticity, we used the Brusch-Pagan test (1979) to determine whether that problem would have to be resolved when estimating the model. Fortunately, the data used in the model estimation did not reject the null hypothesis that errors were homoskedastic. 25 The contemporaneous correlation refers to the correlation between the errors of different equations in a particular point. This is likely to happen when, for example, a variable not explicitly included in the model, such as the state of the economy, produces similar effects on the error terms of the different equations.
Cost-Benefit Analysis of the Free Trade Zone System 35
out to be statistically different from zero, at significance levels of 1% and 5%. That table also indicates that all the parameters show the expected sign. The model provides evidence to support the statement that the impact of backward linkages between multinationals and local firms on the total productivity of local firms is positive. In other words, firms that exhibit greater productivity in producing inputs and services sold to multinationals are precisely those firms that perform best (greatest total productivity). This outcome is reinforced by the opinions expressed by the supplier firms themselves, a majority (58%) of which reported that supplying multinational firms in Costa Rica has had an important impact on the overall quality of the products or services they produce and sell.
Table 3.3. Costa Rica: Impact of Linkages between Multinationals and Local Suppliers on the Productivity of Those Suppliers, 2003 (t statistics).
Independent Variables
Coefficients Standard Error z P>z 95% Confidence Interval Interval
** Statistically different from zero at 5% significance level *** Statistically different from zero at 1% significance level Source: Author’s calculations on the basis of survey data
As was to be expected, those firms with the greatest investment capacity are those that demonstrate the greatest productivity. As well, export experience appears to have a positive influence on a supplier's productivity in producing and selling goods and services for multinationals. In addition to the foregoing outcomes, the model also provides evidence to support the importance of knowledge spillovers from multinationals operating in Costa Rica, although in this case only two types of spillovers were significant. These knowledge spillovers referred to the training that MNCs provide to local supplier firms when they establish a commercial relationship (Cap), and the presence in supplier firms of engineers, technicians and managers who previously worked for multinationals in Costa Rica (Lmnc). We found no significant evidence for attaching
Cost-Benefit Analysis of the Free Trade Zone System 36
importance to the fact that the owners of supplier firms may have worked previously for a MNC, in terms of enhancing the productivity of those firms in their dealings with the MNCs in the free trade zones (spin-off effects). In short, it would appear that technological knowledge spillovers from MNCs to local supplier firms take place through the direct training the MNCs provide, and through the knowledge that supplier firms' employees acquire while working for MNCs in the country. In conclusion, the results of this model support the thesis that Costa Rica should strive steadily to improve the factors that attract FDI to the country, as identified previously by Monge (2000), given the importance of this type of investment for transferring productive skills to Costa Rican firms, which typically are less advanced technologically (Monge et al., 2003). The evidence presented in this paper also provides support for efforts to strengthen linkages between MNCs and local supplier firms, and in particular the Costa Rica PROVEE program sponsored by PROCOMER and CONARE, because it takes advantage of the spillovers from linkages of this kind.
Cost-Benefit Analysis of the Free Trade Zone System 37
IV. COST BENEFIT ANALYSIS OF THE FREE TRADE ZONE SYSTEM We have identified so far a series of positive impacts from the operation of MNCs in Costa Rica, at both the macro and the microeconomic levels. This chapter supplements that analysis with a cost-benefit approach, recognizing that attracting FDI through the free trade zone system has meant a monetary cost to the country, through outlays in particular by the Costa Rican Investment Board (CINDE), for attracting high-tech FDI, and those of PROCOMER for administration of the FTZ system. The objective of this chapter is to estimate the net direct benefit (NDB) of Costa Rica’s free trade zones. The chapter contains three sections. The first identifies the costs and benefits generated by the different companies operating under that system. Next, we define the methodology used to estimate the net benefit, and finally we analyze the main results obtained. 4.1. Identifying Costs and Benefits of the Free Trade Zone System Before discussing the main costs and benefits of the free trade zone system, it is worthwhile clarifying the difference between the concept of private costs and benefits and that of economic or social costs and benefits. The difference lies in the existence of distortions whereby the relative prices used differ from those in a competitive situation, meaning that the opportunity cost or alternative cost will not be adequately reflected. In this case, private prices (also referred to as market prices) will differ from social prices. While private or market costs and benefits are defined as transactions that reduce or increase monetary revenues from a given project, economic costs and benefits reduce or increase the availability of real resources for other economic agents or for the economy as a whole. Estimating the net benefit for the country from the free trade zone system thus requires us to identify the economic costs and benefits, if we are to take into account the overall impact on the availability of resources in the economy. The Costs of the Free Trade Zone System The free trade zone system has generated demand for various resources that could be applied for other productive purposes, and accordingly we identify, as the principal economic costs of this system, the outlays that PROCOMER has incurred in administering the program, and the efforts that CINDE has made to attract foreign direct investment.26 The tax incentives that the government of Costa Rica uses to attract FDI via the FTZ system cannot be considered as a cost, for they consist of customs duty exemptions on imported raw materials and capital goods used by firms operating under the system (the neutrality principle), and
26 While CINDE is not a public agency, the funds it uses were donated by the United States Agency for International Development (USAID), and so they must be considered public funds for purposes of this study, recognizing that the Costa Rican government could have used them for other purposes if it did not believe in the policy of attracting FDI.
Cost-Benefit Analysis of the Free Trade Zone System 38
temporary relief from income tax. These exemptions are granted to foreign firms that set up shop in the free trade zones and that, without such exemptions, might not have come to Costa Rica. When it comes to FDI, it must be remembered that Costa Rica is competing internationally to attract foreign savings, and that many other countries also provide fiscal incentives that imply tax expenditures (Rosales and Arroyo, 2001). The demand for labor and the associated wages and social security contributions, as well as the consumption of such services as electricity and telecommunications and the acquisition of local, privately produced goods and services, are considered net revenues from the system. There is no cost associated with them, since in the absence of the system there would be no such demand and consumption. In other words, the analysis starts from the assumption that the rest of the domestic economy could not generate demand for those resources in the short term. The Benefits of the Free Trade Zone System The principal benefits or revenues that Costa Rica obtains from the free trade zone system consist of the wages paid to Costa Ricans by firms operating under the system, their purchases of local goods and services, the municipal taxes they pay, their contributions to the social security system (social charges), the membership fees paid to PROCOMER to join the system, the interest paid on debts contracted in local currency, and the distribution of profits to Costa Ricans. While there are other possible positive effects of the FTZs for Costa Rica, such as the transfer of technology and knowledge, in particular through productive linkages between local firms and multinationals and the training of human resources by multinationals, these were not included in estimating the net benefit for purposes of this chapter, because they are very difficult to quantify in monetary terms for the years under study. Therefore, the results obtained for net benefits of the system are underestimated, and must be considered as representing the lower limit. 4.2. Methodology for Determining the Net Benefit of FTZs One of the first steps, which was addressed in the previous section, in defining the methodology for a cost-benefit evaluation of the free trade zones is to establish the differentiation between private costs and benefits and economic costs and benefits. Thus, in order to estimate the net benefit properly we must rectify the discrepancies between the private and economic prices of certain transactions. In these cases we will have to use shadow prices in order to reflect their opportunity cost to the country. The other important adjustment has to do with the need to express all revenue and cost flows in a single unit of account or measurement, so that they will be mutually comparable (Little and Mirrlees, 1977). We therefore decided to measure values in terms of "border colones" instead of "domestic colones". In order to convert values expressed in domestic colones into costs and
Cost-Benefit Analysis of the Free Trade Zone System 39
revenues in border colones, we used the ratio of the shadow exchange rate to the official exchange rate.27 Bearing in mind the previous points, the net benefit of the FTZs is derived by taking the revenues generated by firms under the system and subtracting from them the economic costs that the country incurs through that system, including administration by PROCOMER and spending by CINDE on efforts to attract FDI. The methodology can be expressed by the following general equation:
BNDt = [INEt] - GPRt - GCIt where: BND [English NDB] = net direct benefit of the system for the country. INE = net economic revenue from the system GPR = PROCOMER expenses in administering the system GDI = CINDE spending on FDI promotion The balance of the system's economic revenues and costs can be expressed as follows:
INEt = [ LtWt + VBtP
Bt + VS
tPSt + TSS
t + TPt + TM
t + Ct + Ut + Dt ] x [ FECt]
where Lt = Employment level Wt = Average net wage VB
t = Volume of locally purchased goods P
Bt = Price of locally purchased goods
VSt = Volume of locally purchased services
PSt = Price of locally purchased services
TSSt = Social security tax or contribution
Tpt = Payroll or wage tax
Tmt = Municipal taxes
Ct = Membership fee for the FTZ program Ut = Profits distributed to national residents Dt = Payment of debts in local currency FEC = Standard conversion factor[SCF in English] As noted earlier, employment and the associated wages and social security contributions as well as consumption of services such as electricity and telecommunications and the acquisition of
27 The World Bank uses the concept of border colones in evaluating projects, which is why we selected that method for this study. However, the choice of method does not create any differences in the internal rate of return for the project evaluated.
Cost-Benefit Analysis of the Free Trade Zone System 40
privately produced local goods and services are treated as net revenues or income, on the assumption that the domestic economy could not in the short-term generate demand for those productive resources. There is evidence to support this assumption. First, while employment in local industry rose between 1990 and 2002 at an average annual rate of 0.7%, and for the domestic economy as a whole at 3.6%, the employment growth rate in the FTZs was 14.4%. Moreover, the workers employed in the FTZs, particularly since the second half of the 1990s, have higher levels of training and specialization than the national average, and the wages that multinationals pay those workers are on average 20% higher than those offered by domestic firms: alternative employment opportunities for those workers are limited. With respect to local purchases, the survey results discussed in Chapter 3 show that most firms supplying goods and services to the free zones are SMEs, and the majority of them do not export, which suggests that without the FTZs these firms would have trouble supplying those goods and services. Moreover, since many of those firms are suppliers both to the FTZs and to the domestic or international markets, and there is no evidence to suggest market substitution, the disappearance of the FTZ-based MNCs would pose a major economic cost to local suppliers.28 The supply of goods and services to foreign companies operating in the FTZs must also be viewed in the context of the domestic economy, which has been growing much less rapidly than the FTZs. While value added in the FTZs is rising at an average annual rate of 31.4%, the domestic industry sector, which is the one most closely comparable to FTZ activities, is growing at 2.3%. One of the revenue items included in the foregoing equation is the municipal taxes that FTZ firms pay. In the estimation, we included data only for the municipality of Belén, because in the other cantons firms operating under the program are not liable to such taxation.29 There is no counterpart for this item on the right-hand side of the equation, on the assumption that, in the absence of the three firms located in the Belén free zone, and in particular Intel, local firms would not have generated such revenues over a similar period of time. The FTZ membership fee also appears only on the left-hand side of the equation. It has no counterpart on the right-hand side, because it is intrinsically associated with the existence of the program. Therefore, without the program, they would be no such revenue, and so there is no associated opportunity cost. Two other items appear in the equation: debt service in local currency and distribution of profits or dividends to national residents. The first item is treated as a net benefit in itself, recognizing
28 In looking at local purchases of goods, we considered only that portion produced by domestic firms, estimated at 70% of the total. For those goods we estimated their value added, using domestic industrial value added as the benchmark. For sales of public services, we used value added for the electricity, water and telecommunications sectors, while in the case of subcontracting the benchmark was value added in the construction industry. 29 The Municipality of Esparza taxes firms in the free zone, but detailed information was not available. In any case, the fact that Intel is located in Belén means that that canton's municipal revenues account for the majority of municipal taxes paid by FTZ firms.
Cost-Benefit Analysis of the Free Trade Zone System 41
that while it represents transfers from one economic agent to another, the country gains international monetary reserves in the process, because free zone firms must sell foreign currency to cover their financial obligations, and this represents an export of credit. Nevertheless, we have not added a counterpart on the right-hand side of the equation, because those transactions represent only the transfer of purchasing power, at no real cost. When it comes to the distribution of profits and dividends, the situation is similar. These represent net revenue: the country gains foreign exchange, at no real cost to the overall economy, assuming that those gains would not have been generated by local firms. Finally, all revenues and expenses are adjusted by what we call the standard conversion factor (SCF), in order to express them in "border colones." This factor, defined as the gap between border prices and domestic prices as a result of market distortions, is calculated as the reciprocal of the shadow exchange rate factor (the ratio of the shadow exchange rate to the official exchange rate).30 All revenue and expenditure flows are expressed in 2002 US dollars, deflating the figures by the Implicit Price Index or GDP deflator for the United States. 4.3. Main Findings Starting with the revenues and costs identified above, this section discusses the main outcomes from applying the proposed methodology. The net direct benefit produced by FTZ firms for the Costa Rican economy as a whole was estimated for a six-year period (1997-2002), because statistics for earlier periods were not available in digital format, or they were incomplete and therefore rejected because they would have introduced biases into the sectoral estimations. The calculations focused on active firms under the program, meaning foreign firms engaged in processing goods or providing international services, according to information supplied by PROCOMER. This set of firms is directly related to the FDI promotion efforts of CINDE, and reflects the nature and the principal objective of the free trade zone program. In evaluating the program's costs and benefits, we take the present value of future net revenue flows, using the discount factor of 12% conventionally applied by the World Bank for its social evaluation of projects.31
30 For more detail on the SCF, see Corrales, Céspedes and Rodrigo V. (1990), and for an estimate of the shadow exchange rate, see Monge and Corrales (1988).
31 Use of Net Present Value (NPV) is widely recommended in the literature as a better project evaluation tool than the Internal Rate of Return (IRT), and we have therefore used the NPV in this study to demonstrate FTZ benefits.
Cost-Benefit Analysis of the Free Trade Zone System 42
Total Net Direct Benefit Based on the foregoing considerations, FTZs produced a net direct benefit (NDB), expressed as its Net Present Value (NPV) of US$727.2 million in 2002 US dollars. This means that the FTZ program has been socially profitable for the country, because the NPV is clearly positive. If we distribute this figure among the average number of active FTZ firms over the six-year period, the NDB generated by each firm is around US$8.1 million. Another way of looking at these data is to relate the NDB to the average number of workers in the FTZ system. We find that each job generated by FTZ firms during the period has represented a net benefit for Costa Rican of US$36,085, in real terms. The wages generated by FTZ firms account for nearly 60% of these benefits. There is also an important contribution (about 19%) represented by social security contributions and payroll taxes. Local purchases account for 17%, while the remaining 4% represents primarily the program membership fee, municipal taxes, and interest on local-currency debt. We found that the ratio of the average local-industry wage to the FTZ wage averaged 0.8 over the period.32 The economic return from the FTZ program can also be appreciated by comparing the present value of its net revenue flows with the amount that the country has invested in administering the program through PROCOMER, and in attracting foreign firms through CINDE's efforts (Table 4.1).
Table 4.1. Costa Rica: FTZ Administration and FDI Promotion Costs (figures in millions of US dollars of 2002)
32 We calculated the wage differential by comparing the average wage paid by the domestic industrial sector, according to the household survey of the National Statistics and Census Institute (INEC), with the average wage paid by companies under the program. To do so, we divided the total payrolls, net of labor charges, by the number of employees. We took industry as the reference point, because most FTZ firms belong to that sector, with the exception of service firms, in which case the comparison benchmark is the average wage paid by the domestic private services sector.
Cost-Benefit Analysis of the Free Trade Zone System 43
We estimated the relationship of NDB to PROCOMER and CINDE expenses using the figures from Table 4.1, converted to present values at a discount rate of 12%, obtaining a ratio of 69: 1. Net Direct Benefit of High-tech Multinationals One purpose of the study was to evaluate the various policies for attracting FDI that the country has pursued over the last two decades. Accordingly, we estimated NDB for various groups of companies and sectors. In the first place, we calculated NDB for firms classified by PROCOMER as high-tech multinationals (HTM). We also made estimates for five different sectors covering electronics, medical devices, textiles, agroindustry, and services. The results for high-tech multinationals support the thrust of the country's recent policy of attempting to attract foreign investments into activities that make more intensive use of skilled labor. The NDB for HTMs amounts to US$297.8 million while for other multinationals it is US$429.4 million. Nevertheless, the firms classified as HTMs represent only about one-third (37%) of all the firms evaluated. Consequently, average NDB per firm amounts to US$10.6 million for HTMs, and to US$7.0 million for other firms. The greater benefit associated with HTMs is also found in NDB per job, which amounts to nearly US$40,000 compared with US$34,000 per job in other firms.
Table 4.2. Costa Rica: Net Direct Benefit, Total and by Degree of Technology of Firms (figures in millions of US dollars of 2002)
Total Firms HTMs Non-HTMs Total NDB 727.2 297.8 429.4 NDB per Firm 8.1 10.6 7.0 NDB per Worker 0.036 0.04 0.034 NDB/Investment* 69.0 90.9 59.1 Wage Differential 0.80 0.74 0.85
*Ratio of NDB to domestic expenditure on program administration and FDI promotion
As can be seen in Table 4.2, the greater benefits from HTMs are reflected in the wage differential. The ratio of wages in local industry to those paid by these firms in the FTZs averages 0.74 over the six-year period. The arrival of Intel in fact had a major positive impact on average HTM wages. For the remaining firms, the average wage differential is 0.85. The following figures reveal the wage differential not only with respect to local industry but also with respect to wages paid in the private sector as a whole, and the national minimum wage. Here again, the HTM differential over other FTZ firms can be appreciated.
Cost-Benefit Analysis of the Free Trade Zone System 44
Graph 4.1. Costa Rica: Average HTM Wage Graph 4.2. Costa Rica: Average non-HTM Wage
0 50 100 150 200 250 300 350 400
Free Trade Zone
Industrial Sector
Private Sector
Minimum Wage
In Dollars0 100 200 300 400 500
Free Trade Zone
Industrial Sector
Private Sector
Minimum Wage
In Dollars
Source: Authors’ calculations based on PROCOMER figures.
Net Direct Benefit by Sector Another interesting finding from the study relates to NDB by sector. In light of Costa Rican experience over the last two decades, and the sectoral strategy that CINDE has pursued for attracting FDI in recent years, we selected the electronics, medical devices, textiles, agroindustry and services sectors as being of particular interest. We first examined the sector comprising the companies classified by PROCOMER as electronics firms. Net benefit associated with this group is US$280 million, nearly 40% of total NDB, and the highest of all the sectors analyzed (Table 4.3). Distributing this value among firms active in the sector during the period, we find that Costa Ricans received a net average benefit of US$11.4 million from each electronics firm operating in the country. This sector and the services sector show the greatest benefits per firm. Although total NDB for the services sector is well below that for the electronics sector, amounting to only US$52.4 million (versus US$280 million), the average per firm in the services sector ranks this sector second in terms of benefit to the country (US$8.1 million). The other sectors show an NDB per firm similar to that for services, of around US $7 million, although in absolute amounts the textiles sector, which accounts for about 36% of all firms surveyed, reports an NDB of US $237 million, while the medical devices sector accounts for only 12%. In the latter case, the results must be treated with caution because of quality problems in the data that we had to use. Nevertheless, the wage differential for this sector exceeds that for textiles and agroindustry, while the services sector is similar to electronics in this regard. Another way of looking at the economic return from these groups of firms is to compare their NDB with the country's investment in administering the FTZ program and attracting FDI. Here, the best record is that of the electronic and services sectors, where the ratio was greater than 70:1.
Cost-Benefit Analysis of the Free Trade Zone System 45
Table 4.3. Costa Rica: Net Direct Benefit by Sector (in millions of US dollars of 2002)
Electronics Medical Devices Textiles Agroindustry Services
*Ratio of NDB to domestic expenditure on program administration and FDI promotion
In the services sector, net annual benefits have shown a rising trend in recent years, whereas in the electronics sector, the performance was more stable across the six years. These results are heavily influenced by what happened with the wage differential. For electronics firms, the average ratio for the period as whole is around 0.71: the differential was accentuated with the arrival of Intel, but then gradually approached parity in recent years. In the case of services, the average for the period is 0.74. In recent years, the differential has tended to widen, coinciding clearly with the arrival of Procter & Gamble. In the textiles sector, NDB tended to decline over the period, as a number of firms left the country, and the wage differential narrowed.
Cost-Benefit Analysis of the Free Trade Zone System 47
V. SOCIAL IMPACTS OF FDI: CARTAGO AND THE CANTON OF BELEN Using the case study methodology, this chapter examines the potential social impact of firms in the free trade zones of Cartago and Belén. These two locales were selected for the following reasons: Cartago is the site of the first “metropolitan industrial park” to be established in a free trade zone, and most firms there are engaged in labor-intensive, low-skill operations, while in Belén, the free trade zone and its firms are of more recent origin, and most of them are engaged in production of higher technological content. In contrast to Cartago, Belén's free trade zone is not an industrial park. The firms operating there under the FTZ system do so outside the concept of an industrial park: they currently include Componentes Intel de Costa Rica, Firestone de Centroamerica, and Trimpot Electronica. The Cartago Free Zone Industrial Park (PIZFC), the first of its kind in the Central Valley, was created in 1985, under concession to a private firm. That park emerged after unsuccessful experiences with two projects of this type in the provinces of Limon and Puntarenas. The park currently generates around 20% of all FTZ jobs in the country, with average employment of 342 workers per firm. By contrast, the three firms located in Belén generate around 9% of total employment, with an average of 957 workers per firm.
Table 5.1. Indicators for Firms in the Free Zones of Belén and Cartago (figures in US dollars of 2002)
Indicators Belén PIZF Cartago Number of Firms 3 17 Number of Employees 2,872 5,818 Average Jobs per Firm 957 342 Average Wage 732 371 Purchases of Local Goods and Services (millions) 14.3 14.2 Subcontracting (Millions) 4.9 0.3 Other Local Spending (Millions) 15.2 3.7 Municipal Taxes (Millions) 0.5 0.0 Program Membership Fees (Millions) 0.24 0.16
Source: Author’s calculations using PROCOMER data.
We based this study on the results from nine interviews with key individuals in each of the communities. The topics addressed included employment and wages generated by MNCs, productive linkages to local firms, the environmental impact, and the social responsibility of MNCs.
Cost-Benefit Analysis of the Free Trade Zone System 48
Impact on Employment and Wages Persons interviewed in Belén are or have been involved in different areas of community development, such as development associations, primary and secondary education, social and environmental planning and development, community activism, and tax management. We also contacted people working with companies providing services to the FTZs. In the case of Belén, all the persons interviewed were familiar with one or other of the firms operating in the free zone. Many of them had had contact with Intel, in particular, either through its community outreach programs or in the course of joint projects. Moreover, more than half had a relative or friend working in that company. Yet respondents disagreed with the percentage of Belemitas33 working in the company: they said the true figure was lower, and that there was in fact a large floating population, with some 20,000 people coming in to work every day, despite the fact that Belén itself could supply more workers. In the case of Cartago, the situation is different. We found that 94% of workers in that province's free trade zones live in the same city (Monge, 2000). Another finding had to do with the way the labor benefits offered by FTZ firms are viewed. Five of the seven Belemitas who responded to this question felt that the wages offered were more attractive, while four also mentioned better training and working conditions. In the case of PIZFC, respondents were more favorably impressed with the in-house medical services, transportation and meal facilities than with the wages offered. While the average wage for the last three years paid by companies located in Belén exceeded $700, in Cartago it was below $400, and close to the average domestic industrial wage. This pattern is consistent with the fact that most of the firms in the Vieja Metropoli (Cartago was the colonial capital) are engaged in labor-intensive, low-skilled production. In fact, only 7% of PIZFC employees fell into the technical and professional categories in 2000. The proposition that the wage differential is wider in high-tech firms seems to be supported by about half of the Belemitas interviewed, who felt that FTZ firms had helped to "pull up" average wages among national and foreign firms alike operating in the canton. A similar result was obtained for PIZFC (Monge, 2000). There is also a positive view of FTZ firms when it comes to gender issues: most persons interviewed felt that these firms promote the hiring of women, reflecting both the type of work offered and the openness of those firms to employing women. A similarly favorable impact can be seen in Cartago, where more than half of the employees are women: in fact, this percentage is likely higher than that in Belén, since more firms in Cartago are engaged in textiles and assembly work.
33 Citizens of Belén.
Cost-Benefit Analysis of the Free Trade Zone System 49
Productive Linkages On this point, most Belemitas interviewed believed that FTZ companies have benefited local firms through their purchases of goods and services and through training and awareness campaigns on environmental and product quality issues; they had a high opinion of the benefits generated through the purchase of services and the spreading of sound environmental practices. Eight of the persons interviewed said that local firms have benefited from the free zones through new business opportunities, but that such integration is considered low. Monge's results (2000) from Cartago indicate the same concern. In terms of subcontracting, integration with the community is minimal: only 4% of subcontracting services are supplied by firms in the province, the rest being outsourced to other places. The situation with respect to local purchases of raw materials and inputs is similar. If we look at the impact that these firms are having beyond the community itself, the results from Belén and Cartago are different. Table 5.1 shows that there is more integration with firms located in Belén than with those located in the PIZFC. While Belén firms report average local purchases of $4.8 million, the PIZFC figure is only $900,000. This gap is even greater when it comes to subcontracting. Nevertheless, these data must be interpreted with caution, for they do not tell us much about the quality of integration (transfer of technology and knowledge), an issue that was discussed in some detail in Chapter 3. Environmental Impact Generally speaking, most of the Belemitas interviewed felt that FTZ firms have some impact on the environment. The balance of opinion as to a positive effect versus a negative effect is unfavorable with respect to air pollution (- 4) and noise pollution (- 2). Air pollution is associated in particular with the activities of one firm in the zone, while noise nuisances are associated with the increase in heavy truck and rail freight traffic. Nevertheless, when these impacts are compared with those generated by other firms in the canton, the results change significantly. Six of the eight respondents on this point said that FTZ firms produce less air pollution than other firms operating in Belén, while the two remaining respondents considered the impacts equal. With respect to noise pollution, three believed it was less, while four considered it similar, and only one felt that MNCs were creating greater noise pollution. When it comes to water pollution and solid wastes, opinions are quite favorable to the firms located in the free trade zones. In the first case (Belén), five respondents felt that this problem was less severe in the FTZ than it is with other firms in the canton. Two saw it as similar, and only one as greater. In Cartago, six said it was less, and two the same.
Cost-Benefit Analysis of the Free Trade Zone System 50
Respondents believe that the favorable performance of FTZ firms has to do with stricter regulations and better environmental policies. In fact, all felt that the FTZ firms are setting a good example for local firms located in the two cantons. Finally, it is interesting that respondents viewed Intel as the firm most actively committed to protecting the environment, citing its record in reforestation campaigns and sending out speakers to the schools. As a footnote, we may report that while the high-tension cables are seen as a blemish on the canton's scenery, concerns over their health effects have subsided, and opinions of Intel are now favorable. In Monge's study (2000), community leaders in Cartago also had some concerns about the environmental impact of the PIZFC: 47% of those interviewed felt there has been some negative impact. They referred in particular to more solid wastes, vehicle traffic, and road wear. Social Responsibility When asked about the transfer of knowledge through training, none of the Belemitas knew of any former FTZ employees who had started up their own business after working for an MNC. Yet all of them felt that these firms have transferred technology to the community through their donations of computers to local schools, accompanied by infrastructure and training for teachers. Moreover, with support from some of these firms, the community is now pressing ahead with the BELENTEC Foundation project that seeks to bring the canton into the digital economy. In all these efforts, Componentes Intel has played an outstanding role. It has sponsored four community outreach programs for community education, environmental awareness, technological awareness, and improving living standards. PIZFC firms have a lower community profile in terms of technology transfer, since most of their activities involve conventional processes. Nevertheless, a significant percentage (71%) of these firms provide training of some kind to their personnel, even though most of the work is not highly skilled. Another point addressed was the impact that firms have had on local infrastructure development. Here, opinion was more positive in Belén, where most respondents believed that the Canton has benefited in this area. They specifically mentioned the highway overpass that Intel built, and the benefit it has represented for local residents in terms of an alternative exit route. They also mentioned that Firestone has built more than 1 km of sidewalks. Other benefits cited include street sewers, improved facilities for schools and social institutions, and the indirect effect of the municipal taxes that these firms pay. On the issue of taxes, respondents in Belén had quite a favorable opinion of the impact of these firms. Although most of them could not cite any exact figures for taxes paid to the municipality,
Cost-Benefit Analysis of the Free Trade Zone System 51
some felt that they could be greater, in light of exemptions from other types of tax (the impuesto territorial).34 According to the Financial and Administrative Director of the Municipality, taxes paid by the MNCs go to education, infrastructure, civic works, social programs, culture and sports, as well as helping to defray municipal administration expenses. With the PIZFC the situation is different, since companies there do not pay municipal taxes, and the FTZ membership fee is lower than it is at Belén (see Table 5.1). In conclusion, the majority of opinions expressed by local stakeholders both in Belén and in Cartago on the operation of the free trade zones are in agreement that multinational firms have meant benefits to their community. In general, people take a favorable view of these firms. They believe that creating new work opportunities is one of the main benefits to local residents in both cantons.
34 Statistics show that the annual taxes paid by FTZ companies in recent years accounted for between 15% and 20% of the municipal budget. It is important to note that only Belén and Esparza collect taxes from firms in the free trade zones.
Cost-Benefit Analysis of the Free Trade Zone System 53
VI. FINAL CONSIDERATIONS AND POLICY RECOMMENDATIONS Our study of the costs and benefits of free trade zones in Costa Rica yielded the following findings:
1. Slightly less than half of the FDI flow to Costa Rica over the last decade (1990s) came in under the FTZ incentives program. The actual number of companies operating in the free zones rose from 56 in 1990 to more than 200 in 2002. 2. The composition of the FTZ-associated FDI has been changing over the past decade, as more companies have been attracted into high-tech fields, and especially into sectors such as microprocessors, call centers, and medical accessories. 3. Firms sheltered within the FTZs have increased their contribution to national output: that contribution rose from 0.5% at the beginning of the 1990s to 8% of GDP in 2003. 4. The firms sheltered by the FTZs typically export to third markets, and their contribution to Costa Rica's external sales has also increased significantly over the last decade, from 6.5% in 1990 to 53.7% in 2003. 5. The operation of multinational corporations (MNCs) has produced positive balances on the trade account and on the current account of the balance of payments over the last 10 years and five years, respectively. 6. MNCs associated with the FTZs have increased employment opportunities in Costa Rica, especially for skilled workers. The labor force employed by these MNCs has grown significantly since the beginning of the 1990s, from 7000 workers in 1990 to 35,000 in 2002. This means that the relative weight of this sector in overall industrial employment in Costa Rica stood at 16% in 2002. 7. The elasticity of real wages with respect to FDI in Costa Rica is positive (0.093). In other words, for every ten percent (10%) increase in the stock of inward FDI in Costa Rica, workers in this country have seen their real wages rise by about one percent (1%). 8. On the basis of this wage elasticity with respect to FDI, it was calculated that approximately 17% of real wage growth in Costa Rica during the period 1990-2002 could be attributed to the growth in the demand for labor by foreign firms established in the country. In monetary terms, this contribution of FDI to real wage growth in Costa Rica is equivalent to additional income for the working class of US$836 million. 9. Considering that slightly less than half of FDI in Costa Rica is covered by the FTZs (45%), we may say that the increase in the demand for labor by MNCs covered by this system has promoted the growth of real wages to the tune of roughly US$376.2 million, during the period
Cost-Benefit Analysis of the Free Trade Zone System 54
1991-2002. That is, an increase of US$25.2 per worker per year in this economy, a important contribution for Costa Rican workers. 10. In examining the productive linkages between MNC firms and locally based suppliers of inputs and services, we identified 143 firms that are currently producing and selling inputs and services to MNCs in Costa Rica. Most of those firms have had a relationship of several years' standing with the MNCs. 11. Nearly all local suppliers (99.3%) belong to the sector of micro, small and medium-sized firms (MSMEs). That is 12.1% of local suppliers are microenterprises (fewer than five employees), 67.2% are small (between 6 and 30 employees), 20% are mid-sized (between 31 and 100 employees). 12. In terms of the relationship between local suppliers and MNCs, we found that the majority (77.4%) of those suppliers began operations with MNCs during the time when the economy was being opened, i.e. beginning in the mid-1980s, when Costa Rica changed its development model from one of import substitution to an outward-oriented growth strategy. 13. The MNCs have constituted a new market for the MSMEs of Costa Rica, the majority of which (55%) do not export directly. This has allowed those firms to become indirect exporters. 14. The relationship between the local suppliers and the MNCs has had a major impact on the export performance of those local suppliers. 15. We found that the great majority of local suppliers (89.7%) were already operating in the country long before they established their business relationship with the MNCs, and that only 10.3% of these firms do not sell their products or services to at least two MNCs. 16. For the great majority of local suppliers (70.7%), being a supplier to multinational corporations has had a positive impact on their sales performance, and for more than half of these firms (58%) that relationship has led to a significant improvement in the quality of their products. 17. With respect to the existence of "knowledge spillovers" from MNCs to local suppliers, we found that only 27.5% of local suppliers report having received training from the MNCs. All of those firms indicated that they used the new knowledge acquired from the MNCs to produce goods and services that they then sold to other Costa Rican firms. 18. When it comes to the hiring of highly skilled personnel (managers, engineers and technicians), the study shows that 36.2% of managers, 27.6% of engineers, and 31.0% of technicians working for local suppliers had worked previously in MNCs in this country. Those figures are high for a small economy like Costa Rica’s, and would seem to indicate sharp competition in the productive sector for human resources of this kind. This outcome
Cost-Benefit Analysis of the Free Trade Zone System 55
reinforces the findings about the impact of FDI on the growth of real wages in Costa Rica during the decade 1991-2002. 19. 27.6% of local suppliers reported that one of their owners had previously worked for MNCs in this country. This finding is significant when viewed in light of international experience, which offers a wealth of such examples. 20. In examining the possible backward linkages between multinational firms and local firms, in terms of the latter firms’ total productivity, we found evidence that the impact is both positive and significant. We also found evidence showing the importance of knowledge spillovers from the multinationals operating in Costa Rica, including the training that MNCs provide to local suppliers and the fact that engineers, technicians and administrators who once worked for MNCs in Costa Rica are now working for local suppliers. All of these findings, together with the previous comments, provide support for the efforts that the Costa Rican authorities, the private sector and the academic world have been making for the establishment and successful operation of the Costa Rica PROVEE program. 21. The cost-benefit analysis on the operations of MNCs that were active in the free trade zones between 1997 and 2002 produced the following results:
• The net direct benefit (NDB) of FTZs amounts to US$727.2 million for the year
2002. This figure is equal to an average NDB per firm of approximately US$8.1 million, during the period under study. Moreover, in general terms, we may say that the investment that the country has made to attract foreign direct investment and to administer this system has been more than compensated by the direct benefits flowing from the operation of MNCs covered by the FTZs.
• The NDB derives in large part (more than 60%) from the wage differential between
the free trade zones and the rest of the country. There is also an important impact (around 19%) from that differential impact in terms of payments into the social security system and income tax revenues. The contribution of local purchases by MNCs is 17%, and the rest of the NDB comes primarily from the fees that the MNCs pay to PROCOMER for membership in the system, municipal taxes, and interest on debts contracted in local currency.
• The ratio between NDB and the expenses incurred by CINDE and PROCOMER
to attract FDI and to administer the FTZs, respectively, was estimated at 69:1.
• Dividing the resulting NDB among the high-tech multinationals (HTM) and non-high tech multinationals (non-HTMs), we find that the NDB of the former amounts on average to US$10.6 million, while for other firms the average NDB is US$7.0 million. This result confirms the policy that the country has followed in recent years to attract foreign investment into high-tech activities, which make more intensive use of skilled labor.
Cost-Benefit Analysis of the Free Trade Zone System 56
• In analyzing NDB according to the sector in which the FTZ firms are active, we
found evidence that allows us to rank them as follows, by order of importance: in the electronics sector, each firm has generated a NDB of US$11.4 million. In the medical devices sector, the average NDB per firm is US$6.7 million; in the services sector, the NDB is US$8.1 million; for the textile and agro industry firms, the average NDB amounts to US$7.5 million and US$7.4 million, respectively.
22. We interviewed local leaders in the cantons of Belén and Cartago about the social impact of MNCs covered by the FTZs, and found that most of these people viewed those effects as positive. In particular, they pointed to greater employment opportunities and higher wages, as well as the generation of productive linkages with local businesses, new knowledge that can be applied in environmental protection, and the social responsibility shown by the firms.
All of the results discussed in this study would seem to support the policy that Costa Rica has followed for attracting FDI through the Free Trade Zones Program. We therefore recommend a redoubling of efforts to attract foreign investment, by improving the investment climate and the foreign and domestic determinants of investment in the country, and that programs for creating linkages between local firms and MNCs (i.e. Costa Rica-PROVEE) be reinforced as a mechanism for transferring expertise from the latter to the former. To have attempted to identify the major obstacles to attracting FDI to the country would have exceeded the scope of this work, but that task, as well as the work of defining a strategy for attracting investment, should continue to be national priority, given the positive impact that FDI has on the Costa Rican economy.
Cost-Benefit Analysis of the Free Trade Zone System 57
ANNEX
Estimating Wage Elasticity with Respect to FDI in Costa Rica To estimate the effects of foreign investment flows on wages in host countries, Gopinath and Chen (2003) draw on the method used by Kohli (1991) and Harrigan (1997) to model imports and exports at the aggregate level. They start by maximizing the production function (gross national product), given prices (p) and factor endowments (v), where investment is treated as consisting of two types: domestic investment and foreign investment. With this specification, and applying first-order conditions, the authors obtain general equilibrium functions for supply y(p,v) and for factor returns w(p,v). To derive the function w(p,v) empirically, the authors begin with a translog specification of GNP and with the restrictions of linear homogeneity in both prices and factor endowment, and symmetry.35 By differentiating this translog function for wages, the authors obtain the function of the share of labor compensation (wages) within total output of the economy (GNP) as follows:
(1) Lv
vpGln
),(ln∂
∂ = = LS β L ∑
=
+M
i 1β Li ln vi + ∑
=
+N
j 1γ jL ln pj
where SL is the wage share of GNP. Having estimated this equation, the authors derive the cross-elasticity of wages with respect to the stock of FDI using the procedure described by Takayama (1985) and Kohli (1978), in the following manner:
35 See equations (7), (8), (9) and (10) in the Gopinath and Chen paper (2003, p. 289).
Cost-Benefit Analysis of the Free Trade Zone System 58
where Lv
G∂∂
= wL is returns to labor (wages), σ LK* = L
K
K
L
wv
vw *
*∂∂
is the elasticity of wages with
respect to the stock of foreign investment (FDI), and SK* is the share of foreign capital in GDP
PNB.36
To estimate wage elasticity with respect to FDI in Costa Rica, taking equation 2, we obtained the information summarized in Table A.1 on the share of payments (returns) to labor and to foreign capital (or FDI) within GNP, and averages for the period 1991-2002.37
Table A.1. Costa Rica: Share of Labor and FDI Remuneration in Gross National Product (figures in percentages)
Source: Prepared on the basis of data from the Central Bank of Costa Rica.38
By using equation 2 with a value for *LKβ of 0.063, estimated by Gopinath and Chen (2003), and using averages for the shares of labor and foreign capital remuneration within Costa Rica's GNP, shown in Table A.1 above, we find that wage elasticity with respect to the stock of FDI for Costa Rica is 0.093, a value that falls within the range of elasticities (0.050 - 0.226) estimated by Gopinath and Chen in their sample of 11 developing countries. In other words, for each ten percent (10%) increase in the stock of FDI in Costa Rica, real wages in this country increase by about one percent (1%).
36 The equation used in this paper to estimate wage elasticity with respect to the FDI differs from that in the Gopinath & Chen paper (Op.cit) because of a publishing error in transcribing this formula in the Journal of International Trade and Economic Development 12:3 285-309. We are grateful to Professors Gopinath and Chen for giving us the correct equation. 37 For a detailed description of the data the authors used, see Gopinath and Chen (Op. Cit., pp. 290-295). 38 Note: The BCCR now uses the term “national income” to denote GDP.
Cost-Benefit Analysis of the Free Trade Zone System 59
References Academia de Centroamérica. (1997). Costa Rica: Una Economía en Recesión. Informe sobre la
Economía en 1996. San José: Academia de Centroamérica. Blömstrom, M. and A. Kokko. (1998). “Multinational Corporation and Spillovers.” Journal of
Economic Surveys 12: 247-77. Bolin, R. (1999). “Why Economic Processing Zones Are Necessary.” Journal of the Flagstaff
Institute 23 (1). Brecher, R. and R. Feenstra. (1983). “International Trade and Capital Mobility Between
Diversified Economics.” Journal of International Economics 14: 321-39. Brusch, T.S. and A. Pagan. (1979). “A Simple Test for Heteroskedasticity and Random
Coefficient Variation.” Econometrica 47:1287-94. Caves, R. (1996). Multinational Enterprises and Economic Analysis. London: Cambridge University
Press. Chen, E.K.Y. (1983). Multinational Corporations, Technology and Employment. London:
Macmillan. Clarke, G. and Scott Wallsten. (2004). Has the Internet Increased Trade? Evidence from Industrial
and Developing Countries. Working Paper #3215. World Bank. Corrales Q., Jorge, C. Oswald and Rodrigo Vega. (1990). Evaluación Económica del Programa de
Inversiones y Exportaciones. San José: PIE-CINDE. Corrales, Jorge and Ricardo Monge. (1990). “Política Comercial Reciente y Subsidios a la
Exportación en Costa Rica. In Políticas Económicas en Costa Rica, Claudio González Vega and Edna Camacho Mejía (eds). Volume II. San José: Academia de Centroamérica and Ohio State University.
De Ferranti, David, et al. (2002). Closing the Gap in Education and Technology. Advance
Conference Edition. Washington, D.C.: World Bank Latin American and Caribbean Studies.
Dixit, A. and V. Norman. (1980). Theory of International Trade. Cambridge: Cambridge
University Press. Foreign Investment Advisory Service (FIAS). (1999). A Review of the Costa Rican Investment
Cost-Benefit Analysis of the Free Trade Zone System 60
Fosfuri, A., M. Motta and T. Ronde. (2001). “Foreign Direct Investment and Spillovers Through
Workers’ Mobility.” Journal of International Economics 53: 205-22. Gershenberg, I. (1987). “The Training and Spread of Managerial Know-How: A Comparative
Analysis of Multinational and Other Firms in Kenya.” World Development 15: 91-939. Gopinath, M. and Weiyan Chen. (2003). “Foreign Direct Investment and Wages: A Cross-
Country Analysis.” The Journal of International Trade & Economic Development 12 (3): 285-309. Oregon State University.
Hanson, Gordon. (2001). Should Countries Promote Foreign Direct Investment? G-24 Discussion
Paper Series No.9. UNCTAD. Harrigan, J. (1997). “Technology, Factor Supplies, and International Specialization: Estimating
the Neoclassical Model.” American Economic Review 87: 475-94. Jenkins, M. et al. (2001). “Export Processing Zones in Central America”. In Economic
Development in Central America, Felipe Larraín, ed. Cambridge, MA: Harvard University Press.
Jones, R. and Scheinkman J. (1977). “The Relevance of the Two-Sector Production Model in
Theory.” Journal of Political Economy 85: 909-35. Kohli, U. (1978). “A Gross National Product Function and Derived Demand for Imports and
Supply of Exports.” Canadian Journal of Economics 11: 167-82. ______. (1991). Technology, Duality and International Trade. Ann Arbor: University of Michigan
Press. Koutsoyiannis, A. (1977). Theory of Econometrics. London: Macmillan. Larraín, Felipe, Luis López and Andrés Rodríguez. (2001). “Intel: A Case Study of Foreign Direct
Investment in Central America”. In Economic Development in Central America, Felipe Larraín, ed. Cambridge, MA: Harvard University Press.
Lindsey, C.W. (1986). “Transfer of Technology to the ASEAN region by US Transnational
Corporations.” ASEAN Economic Bulletin 3: 225-47. Lipsey. R.E. (2002). “Home and Host Country Effects of FDI.” Cambridge, MA: NBER Working
Paper No. 8299. Little, I.M.D. and J.A. Mirrless. (1977). Project Appraisal and Planning for Development Countries.
London: Heinemann Educational Books.
Cost-Benefit Analysis of the Free Trade Zone System 61
Markusen, J. (1995). “The Boundaries of Multinational Enterprises and the Theory of International Trade.” Journal of Economic Perspectives 9: 169-89.
Monge, Alexander. (2001). Exports and Foreign Investment in Costa Rica and El Salvador During the
1990’s. Chicago: Northwestern University; Washington, D.C.: World Bank. Monge, Ricardo. (2000). Inversión Extranjera Directa y Desarrollo: El caso del Parque Industrial
Zona Franca de Cartago. San José: CINDE-PROCOMER. Monge, Ricardo and Eduardo Lizano. (1997). Apertura Económica e Industrialización en Costa
Rica. San José: Academia de Centroamérica and Friedrich Ebert Stiftung. Monge, Ricardo and Jorge Corrales. (1988). Políticas de Protección de Incentivos a la Manufactura,
Agroindustria y Algunos Sectores Agrícolas en Costa Rica. San José: Econofín. Monge, Ricardo, et al. (2003). I&D, Innovación y Transferencia de Tecnología en el Sector
Productivo Costarricense Más Orientado Hacia la Economía Basada en el Conocimiento. San José: IDB/CAATEC/CONICIT.
Pack, H. (2001). “The Role of Foreign Technology Acquisition in Taiwanese Growth.” Industrial
and Corporate Change 10: 713-34. Rhee, Yung Whee. (1986). A Framework for Export Policy and Administration: Lessons from East
Asian Experience. Washington, D.C.: World Bank, Industry and Finance Series. Rhee, Yung Whee, Bruce Ross-Larson and Gary Pursell (1984). Korea´s Competitive Edge:
Managing the Entry into the World Markets. Baltimore: Johns Hopkins University Press. Robles, Edgar and Andrés Rodríguez. (2002). Inversión nacional y extranjera en Centroamérica,
¿Cómo fomentarla en el marco de la OMC?. San José: Academia de Centroamérica y ASIES. Proyecto “Centroamérica en la Economía Mundial del siglo XXI.”
Rodríguez, Andrés et al. (2002). Análisis del Crecimiento Económico en Costa Rica: 1950-2000.
Paper written for the IDB. Rosales, Julio and M. Arroyo. (2001). Benchmarking de Incentivos a la Inversión Extranjera Directa:
Costa Rica y Principales Competidores. San José: CINDE-PROCOMER. Rosales, Julio and V. Gibson. (2001). Condiciones del Mercado Laboral para los Sectores de Alta
Tecnología en Costa Rica: sector electrónico, eléctrico y dispositivos médicos. San José: CINDE-AZOFRAS-PROCOMER.
Spar, Deborah. (1998). “Attracting High Technology Investment: Intel’s Costa Rican Plant.”
Foreign Investment Advisory Service Occasional Paper 11. Washington, D.C.: World Bank.
Cost-Benefit Analysis of the Free Trade Zone System 62
Takayama, A. (1985). Mathematical Economics. Cambridge, MA: Cambridge University Press. Tybout, James. (2001). “Plant- and Firm- Level Evidence on ‘New’ Trade Theories”. Cambridge,
MA: NBER Working Paper 8418. UNCTAD. (1996). “Incentives and Foreign Direct Investment”. Geneva: UNCTAD, Current
Studies, Series A, No 30. ______ . (2000). Enhancing the Competitiveness of SMEs through Linkages. Geneva: UNCTAD. Wong, K. (1995). International Trade in Goods and Factor Mobility. Cambridge: MIT Press. World Bank. (1995). The World Bank Development Report 1995: Workers in an Integrating World.
Washington, D.C.: Oxford University Press.
The Organization of American States The Organization of American States (OAS) is the world's oldest regional organization, dating back to the First International Conference of American States, held in Washington, D.C., from October 1889 to April 1890. The establishment of the International Union of American Republics was approved at that meeting on April 14, 1890. The OAS Charter was signed in Bogotá in 1948 and entered into force in December 1951. Subsequently, the Charter was amended by the Protocol of Buenos Aires, signed in 1967, which entered into force in February 1970; by the Protocol of Cartagena de Indias, signed in 1985, which entered into force in November 1988; by the Protocol of Managua, signed in 1993, which entered into force in January 29, 1996; and by the Protocol of Washington, signed in 1992, which entered into force on September 25, 1997. The OAS currently has 35 Member States. In addition, the Organization has granted Permanent Observer status to 57 States, as well as to the Holy See and the European Union. The basic purposes of the OAS are as follows: to strengthen peace and security in the Hemisphere; to promote and consolidate representative democracy, with due respect for the principle of non-intervention; to prevent possible causes of difficulties and to ensure the pacific settlement of disputes that may arise among the Member States; to provide for common action on the part of those States in the event of aggression; to seek the solution of political, juridical and economic problems that may arise among them; to promote, by cooperative action, their economic, social and cultural development, and to achieve an effective limitation of conventional weapons that will make it possible to devote the largest amount of resources to the economic and social development of the Member States. MEMBER STATES: Antigua and Barbuda, Argentina, The Bahamas (Commonwealth of), Barbados, Belize, Bolivia, Brazil, Canada, Chile, Colombia, Costa Rica, Cuba, Dominica (Commonwealth of), Dominican Republic, Ecuador, El Salvador, Grenada, Guatemala, Guyana, Haiti, Honduras, Jamaica, Mexico, Nicaragua, Panama, Paraguay, Peru, St. Kitts and Nevis, Saint Lucia, Saint Vincent and the Grenadines, Suriname, Trinidad and Tobago, United States, Uruguay and Venezuela. PERMANENT OBSERVERS: Algeria, Angola, Armenia, Austria, Azerbaijan, Belgium, Bosnia and Herzegovina, Bulgaria, China, Croatia, Cyprus, Czech Republic, Denmark, Egypt, Equatorial Guinea, Estonia, European Union, Finland, France, Georgia, Germany, Ghana, Greece, Holy See, Hungary, India, Ireland, Israel, Italy, Japan, Kazakhstan, Korea, Latvia, Lebanon, Luxembourg, Morocco, Netherlands, Nigeria, Norway, Pakistan, Philippines, Poland, Portugal, Qatar, Romania, Russian Federation, Saudi Arabia, Serbia and Montenegro, Slovakia, Slovenia, Spain, Sri Lanka, Sweden, Switzerland, Thailand, Tunisia, Turkey, Ukraine, The United Kingdom of Great Britain and Northern Ireland, and Yemen.
Organization of American States Office for Trade, Growth and Competitiveness