To cite this document: Garcia-Esteves, Javier and Ludwig, Wolfgang and Kerhervé, Philippe and Probst, Jean-Luc and Lespinas, Franck ( 2007) Predicting the impact of land use on the major element and nutrient fluxes in coastal Mediterranean rivers: The case of the Teˆt River (Southern France). Applied Geochemistry, 22 (1). pp. 230-248. OATAO is an open access repository that collects the work of Toulouse researchers and makes it freely available over the web where possible. This is an author-deposited version published in: http://oatao.univ-toulouse.fr/ Eprints ID : 2524 Any correspondence concerning this service should be sent to the repository administrator: [email protected]
Transcript
To cite this document: Garcia-Esteves, Javier and Ludwig, Wolfgang and Kerhervé, Philippe and Probst, Jean-Luc and Lespinas, Franck ( 2007) Predicting the impact of land use on the major element and nutrient fluxes in coastal Mediterranean rivers: The case of the Teˆt River (Southern France). Applied Geochemistry, 22 (1). pp. 230-248.
OATAO is an open access repository that collects the work of Toulouse researchers and makes it freely available over the web where possible.
This is an author-deposited version published in: http://oatao.univ-toulouse.fr/ Eprints ID: 2524
Any correspondence concerning this service should be sent to the repository administrator: [email protected]
doi:10.1016/j.apgeochem.2006.09.013
Predicting the impact of land use on the major elementand nutrient fluxes in coastal Mediterranean rivers: The case
of the Tet River (Southern France)
Javier Garcia-Esteves a, Wolfgang Ludwig a,*, Philippe Kerherve a,Jean-Luc Probst b,1, Franck Lespinas a
a Cefrem – Centre de Formation et de Recherche sur l’Environnement Marin (UMR 5110 - CNRS/Universite de Perpignan),
Universite de Perpignan Via Domitia, 52, avenue Paul Alduy, 66860 Perpignan cedex, Franceb Laboratoire des Mecanismes de Tranfert en Geologie, UMR 5563 – CNRS/Universite Paul Sabatier, 14 avenue Edouard Belin,
31400 Toulouse, France
Abstract
This study presents a detailed discrimination between the natural and anthropogenic sources of dissolved major ele-ments in the Tet River, a typical small coastal river in the south of France. The main objectives were to quantify the mate-rials that were released by human activities in the basin, and to determine the specific element inputs for the major land useforms. The dissolved material fluxes were estimated by weekly monitoring over a hydrological year (2000–2001) along themajor water gauging stations, and the flux relationships were examined in the context of anthropogenic and natural basincharacteristics as determined by a Geographical Information System (GIS). Intensive agricultural land use in the form offruit tree cultures and vineyards has a strong control on the dissolved element fluxes in the river. Area specific elementreleases for these cultures are greatest for SO4, with an estimated average of about 430 ± 18 keq km�2 a�1. This is P11times the natural SO4 release by rock weathering. Also for K, NO3, PO4 and Mg, the specific releases were P6 timesthe natural weathering rates (respectively about 44, 60, 4 and 265 keq km�2 a�1). Waste-waters are the other major sourceof anthropogenic elements in the river. They have an important role for the fluxes of inorganic P and N, but they are alsoa considerable source of Cl and Na to the river. For example, the average annual release of Cl is around 150 moles/inhabitant in the rural basin parts. Further downstream, however, where population density strongly increases, industrialeffluents can enhance this value (>300 moles/inhabitant). The waste-waters contribute more than 70% of the dissolvedinorganic N export to the sea, although their contribution to the average DOC export is almost negligible (3%).
important role in the study of chemical weatheringrates (Meybeck, 2003). As geochemists becameaware of the close coupling between the chemicalweathering of rocks and the atmospheric CO2 con-tent, and hence global climate, many studies havefocussed on the global controls of chemical weather-ing rates, and the evaluation of major element fluxesin world rivers remains still a common approach forthis purpose (e.g. Probst et al., 1994; AmiotteSuchet and Probst, 1996; Gaillardet et al., 1997,1999; Millot et al., 2003; Mortatti and Probst,2003).
Major elements are released to surface watersfrom various sources, and using them as proxiesfor weathering rates requires first of all the identifi-cation of their different origins. Also human activi-ties can strongly modify the abundance of majorelements in natural waters. At present, for nutrientfluxes, e.g. the fluxes of dissolved inorganic N, sev-eral modelling approaches exist that allow calculat-ing the nutrient export by a given catchment as afunction of anthropogenic parameters, amongwhich population density or fertilizer spreads arethe most important (e.g. Seitzinger and Kroeze,1998; Smith et al., 2003; Harrison et al., 2005). Thisis because in populated areas, nutrient levels arealmost exclusively controlled by human activities,and natural levels can only be found in pristinewatersheds. For other compounds, however, suchas Cl, SO4 and/or Na, such approaches are missingand the distinction between natural and pollutionlevels remains difficult.
The purpose of this study is to establish adetailed quantitative assessment of the differentsources that contribute to the dissolved loads inthe Tet River, to identify the materials that arereleased by human activities, and to examinewhether they can be related to land use practicesor other anthropogenic activities in the basin. Theapproach is built on mass budget calculations fromdata of a high frequency sampling during one com-plete hydrological year along the major gauging sta-tions of the river, together with a GIS-baseddetermination of the basin characteristics. Due toits moderate basin size, the river can be easily sam-pled within 1 day from its uppermost headwatersdown to its mouth, which allows good data compa-rability between the different stations. Anotheradvantage is that the major material sources canbe clearly identified. In its upper course, populationdensity is very low and the river chemistry is almostexclusively controlled by natural processes. In the
middle part, agriculture leaves its fingerprints inthe water chemistry, whereas the lowest part isstrongly impacted by urban wastewater releases.
2. Data and methods
2.1. Sampling and water fluxes
The Tet River is a typical small Mediterraneanriver that drains the eastern part of the French Pyre-nees in a WSW-ENE direction. Its basin area isabout 1400 km2 and the river length is about120 km. The uppermost basin parts reach up to ele-vations of >2500 m and are regularly snow-coveredduring winter. From there, the river descends on arather steep gradient down to sea level, passing rap-idly through various climate and vegetation zonesbefore entering the sea in the SW part of the Gulfof Lions.
The river was sampled weekly between Septem-ber 2000 and September 2001, and monthly betweenOctober 2001 and May 2002 at its major watergauging stations. This was done manually frombridges in the central part of the river. High fre-quency sampling (hourly) during one major floodat the downstream stations and seasonal samplingof the major tributaries (at least one sample per sea-son) completed the survey. Fig. 1a shows the loca-tions of the sampling stations at the main riverand Table 1 lists the corresponding hydroclimaticcharacteristics in the corresponding basin parts.
The sampling stations St1–St4 are situated in themountainous part of the basin, whereas stationsSt5–St7 lie in the much flatter alluvial plain. The lastwater gauging station corresponds to St5 in thetown of Perpignan, just a few meters above the con-fluence of its last tributary (the Basse tributary),which is gauged separately. The combination ofboth records determines the total water flux of theriver. Two additional sampling stations (St6 andSt7) downstream of St5 were introduced in orderto catch the wastewater inputs from Perpignan(St6), and from a smaller wastewater station furtherdownstream (Sainte-Marie, St7). In the 1970s, a res-ervoir was constructed between St3 and St4 forflood control (Vinca reservoir: 24.6 Mm3). It ismaintained at very low levels during late autumnand early winter, when the risk of flash-floods ismaximal, and allowed to be filled during springand summer in order to sustain irrigation in thebasin. There is also a reservoir upstream St1 (Bouil-louse reservoir: 17.5 Mm3) for hydroelectric power
Fig. 1. Morphology, location of the sampling stations (both map A), and lithology (map B) in the basin of the Tet River (after USGS(2000) and Salvayre (1974)). The capital letters in B denote Cambrian (C), Ordovician (O), Devonian (D), Cretaceous (C1, C2), Pliocene(P), and Quaternary (Q) ages. Note that the Devonian limestone is dolomitic.
generation. As the water flow of the Tet River is lowat St1, its impact on the material transport in theriver is much less important compared to the Vincareservoir.
Water flow is complex because of anthropogenicwater extraction at many places along the rivercourse. Irrigation channels can be found almosteverywhere along the basin. This means that theaverage discharge values that are recorded at thegauging stations (Table 1) do not allow a conserva-tive budgeting of the surface water flow. Major irri-gation channels start from the Vinca reservoir and
from the main river course downstream and extractwater for agricultural and urban water use. As aconsequence, the average water flow at St5 is oftenlower than at St4, although tributaries bring addi-tional water to the river between both stations. Alsoupstream of the reservoir, irrigation channels existand the water can bypass the gauging stations atseveral places.
For the above reason, we also include in Table 1an estimation of the potential water flux at eachgauging station that corresponds to the water dis-charge if no water extraction occurred. These values
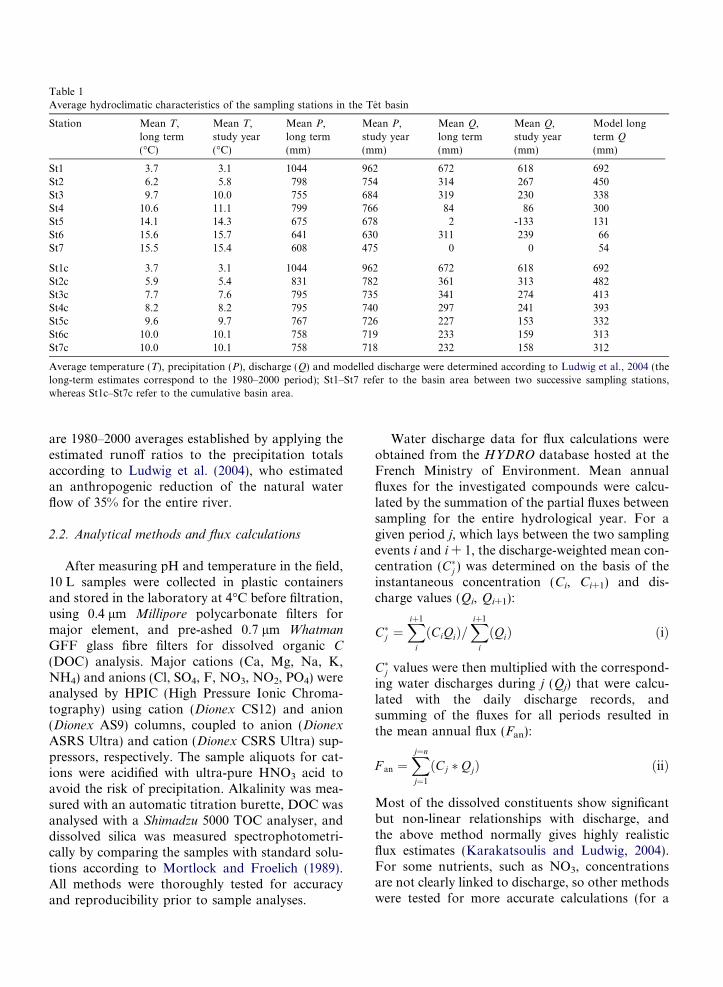
Table 1Average hydroclimatic characteristics of the sampling stations in the Tet basin
Average temperature (T), precipitation (P), discharge (Q) and modelled discharge were determined according to Ludwig et al., 2004 (thelong-term estimates correspond to the 1980–2000 period); St1–St7 refer to the basin area between two successive sampling stations,whereas St1c–St7c refer to the cumulative basin area.
are 1980–2000 averages established by applying theestimated runoff ratios to the precipitation totalsaccording to Ludwig et al. (2004), who estimatedan anthropogenic reduction of the natural waterflow of 35% for the entire river.
2.2. Analytical methods and flux calculations
After measuring pH and temperature in the field,10 L samples were collected in plastic containersand stored in the laboratory at 4�C before filtration,using 0.4 lm Millipore polycarbonate filters formajor element, and pre-ashed 0.7 lm Whatman
GFF glass fibre filters for dissolved organic C
(DOC) analysis. Major cations (Ca, Mg, Na, K,NH4) and anions (Cl, SO4, F, NO3, NO2, PO4) wereanalysed by HPIC (High Pressure Ionic Chroma-tography) using cation (Dionex CS12) and anion(Dionex AS9) columns, coupled to anion (Dionex
ASRS Ultra) and cation (Dionex CSRS Ultra) sup-pressors, respectively. The sample aliquots for cat-ions were acidified with ultra-pure HNO3 acid toavoid the risk of precipitation. Alkalinity was mea-sured with an automatic titration burette, DOC wasanalysed with a Shimadzu 5000 TOC analyser, anddissolved silica was measured spectrophotometri-cally by comparing the samples with standard solu-tions according to Mortlock and Froelich (1989).All methods were thoroughly tested for accuracyand reproducibility prior to sample analyses.
Water discharge data for flux calculations wereobtained from the HYDRO database hosted at theFrench Ministry of Environment. Mean annualfluxes for the investigated compounds were calcu-lated by the summation of the partial fluxes betweensampling for the entire hydrological year. For agiven period j, which lays between the two samplingevents i and i + 1, the discharge-weighted mean con-centration (C�j ) was determined on the basis of theinstantaneous concentration (Ci, Ci+1) and dis-charge values (Qi, Qi+1):
C�j ¼Xiþ1
i
ðCiQiÞ=Xiþ1
i
ðQiÞ ðiÞ
C�j values were then multiplied with the correspond-ing water discharges during j (Qj) that were calcu-lated with the daily discharge records, andsumming of the fluxes for all periods resulted inthe mean annual flux (Fan):
F an ¼Xj¼n
j¼1
ðCj � QjÞ ðiiÞ
Most of the dissolved constituents show significantbut non-linear relationships with discharge, andthe above method normally gives highly realisticflux estimates (Karakatsoulis and Ludwig, 2004).For some nutrients, such as NO3, concentrationsare not clearly linked to discharge, so other methodswere tested for more accurate calculations (for a
presentation of different methods, see for exampleMoatar and Meybeck, 2005). However, in mostcases, the resulting mean annual fluxes were notmuch different from the ones obtained by the abovemethod, and therefore it was decided to apply it uni-formly to all dissolved compounds. The relativelyhigh sampling frequency means that for nutrientsalso, the fluxes determined should be close to reality(±10%).
2.3. Quantification of non-weathering sources
In the absence of evaporite outcrops in the catch-ment, Cl in rivers can be entirely attributed to non-weathering sources (Meybeck, 1983, 1986). Fourmajor non-weathering sources that supply Cl andother dissolved elements to the river were identified:atmospheric deposits (rain), road salting, urbanwastewaters and diffuse agricultural sources (mainlyfertilizer use). Once the chemical composition ofthese sources is known, and the respective parts ofthe riverine Cl from each of the mentioned sourcescan be determined, one can then correct the rivercomposition from its non-weathering contributionaccording to:
X i;c ¼ X i � ðClq;jRi;jÞ ðiiiÞXi and Xi,c are, respectively, the average concentra-tion of a given element i in the river before and afterthe correction, Clq,j is the average Cl concentrationin the river that comes from the non-weathering
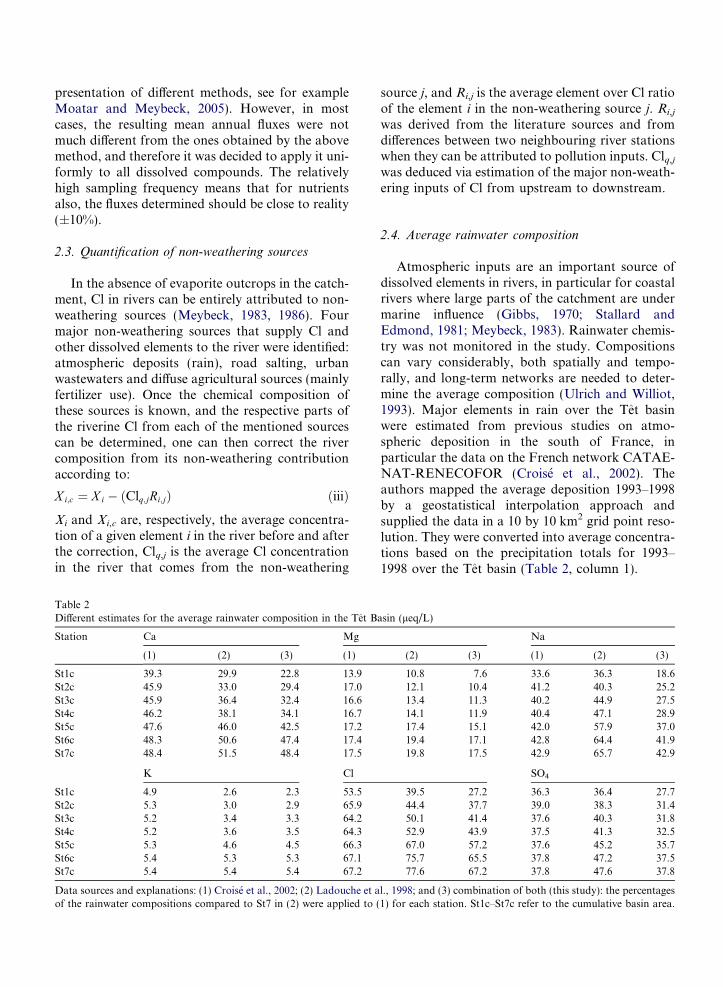
Table 2Different estimates for the average rainwater composition in the Tet B
Data sources and explanations: (1) Croise et al., 2002; (2) Ladouche et aof the rainwater compositions compared to St7 in (2) were applied to (
source j, and Ri,j is the average element over Cl ratioof the element i in the non-weathering source j. Ri,j
was derived from the literature sources and fromdifferences between two neighbouring river stationswhen they can be attributed to pollution inputs. Clq,j
was deduced via estimation of the major non-weath-ering inputs of Cl from upstream to downstream.
2.4. Average rainwater composition
Atmospheric inputs are an important source ofdissolved elements in rivers, in particular for coastalrivers where large parts of the catchment are undermarine influence (Gibbs, 1970; Stallard andEdmond, 1981; Meybeck, 1983). Rainwater chemis-try was not monitored in the study. Compositionscan vary considerably, both spatially and tempo-rally, and long-term networks are needed to deter-mine the average composition (Ulrich and Williot,1993). Major elements in rain over the Tet basinwere estimated from previous studies on atmo-spheric deposition in the south of France, inparticular the data on the French network CATAE-NAT-RENECOFOR (Croise et al., 2002). Theauthors mapped the average deposition 1993–1998by a geostatistical interpolation approach andsupplied the data in a 10 by 10 km2 grid point reso-lution. They were converted into average concentra-tions based on the precipitation totals for 1993–1998 over the Tet basin (Table 2, column 1).
l., 1998; and (3) combination of both (this study): the percentages1) for each station. St1c–St7c refer to the cumulative basin area.
Ca
0.0
2.0
4.0
6.0
8.0
10.0
12.0
Mg
0.0
0.5
1.0
1.5
2.0
2.5
3.0
Na
0.0
0.5
1.0
1.5
2.0
2.5K
0.0
0.1
0.2
0.3
0.4
0.5
0.6
0.7
0.0
0.5
1.0
1.5
2.0
2.5
3.0 SO4
0.1 1.0 10 100 10000.0
0.1
0.2
0.3
0.4
0.5
0.6 NO3
0.1 1.0 10 100 1000
Runoff [m3/s] Runoff [m3/s]
X /
Cl [
eq/e
q]X
/ C
l [eq
/eq]
X /
Cl [
eq/e
q]
Fig. 2. Evolution of the element over Cl ratios in the Tet River at St5 during floods in comparison with the average rainwater ratios ofCroise et al. (2002) (CATAENAT-RENECOFOR, solid line) and of Ladouche et al. (1998) (dashed line).
These data were combined with a second estima-tion of the average rainwater composition based onthe measurements of the rainwater chemistry in theHerault basin (Ladouche et al., 1998; Petelet, 1998).The Herault River is situated about 200 km NE ofthe Tet River and, as the latter, under the stronginfluence of Mediterranean air masses. The rain-water chemistry rapidly changes in the hinterlandsof the Herault basin, and highly significant relation-ships exist between the average concentrations andthe elevation of the rain gauge stations for almostall elements (Petelet, 1998). Assuming that theserelationships hold for the Tet basin too, they wereapplied to the digital elevation model (see below)in order to derive an alternative rainwater chemistrydata set (Table 2, column 2).
Both data sets are generally in good agreementfor the entire Tet basin (St7), except for Na, whichis higher in the Herault data. Validation of thesedata for the current study was done indirectly bycomparing the respective Ri ratios with the elementover Cl ratios in the Tet River during flash-floods,
when most of the river water is rain-derived.Although the Ri ratios are very different during nor-mal hydrological conditions for most conservativeelements (Na, Ca, Mg, SO4), they tend towardsthe respective rainwater ratios during floods(Fig. 2). The fit for Na is best with the CATAENATdata and it was concluded that they give the mostreliable values for the entire basin. However,because of the higher spatial sampling resolution,it was taken that the upstream to downstream vari-ability is better represented in the Herault study,and both data sets were combined to derive the bestestimate for average rainwater composition in theTet basin (Table 2, column 3).
3. Results
3.1. Land use and general basin characteristics
For a comparison of the major element fluxeswith the general basin characteristics in the corre-sponding catchments, a Geographical Information
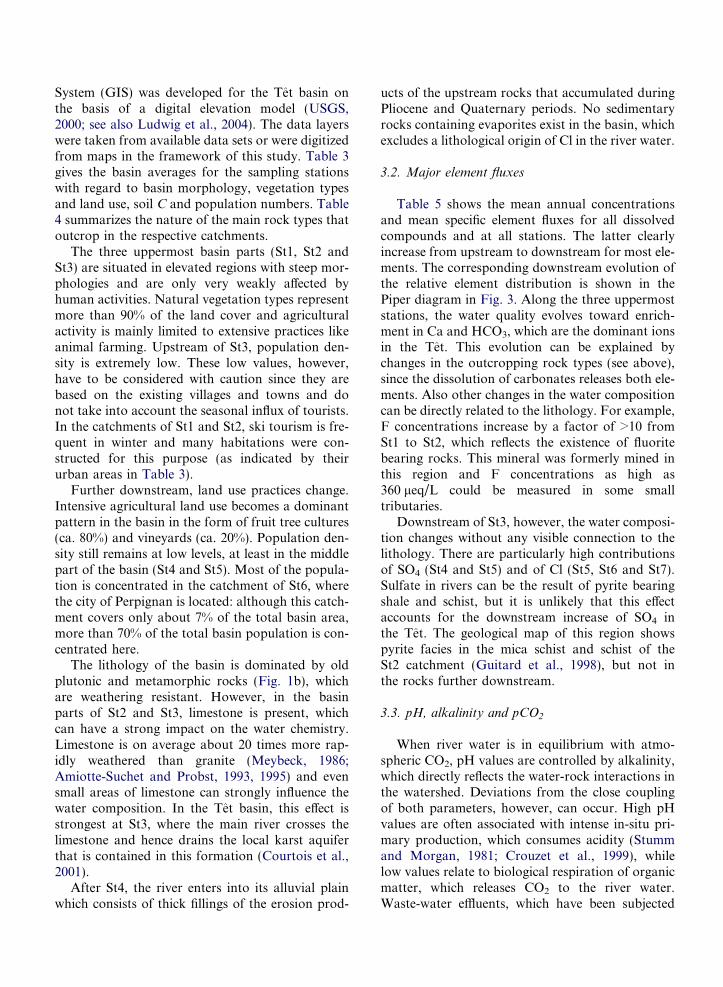
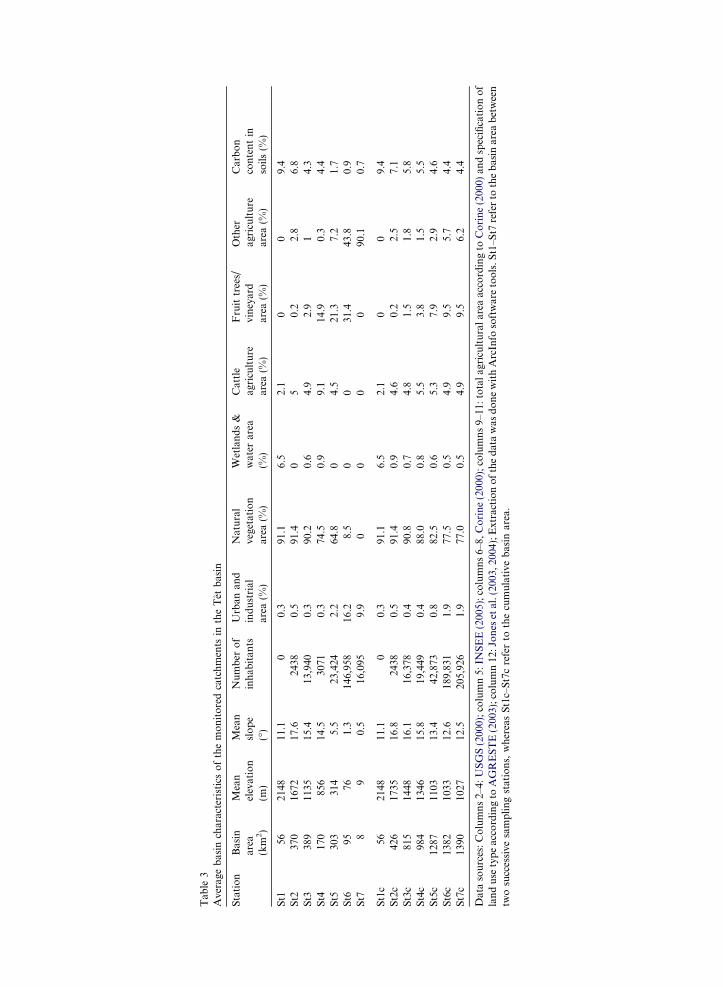
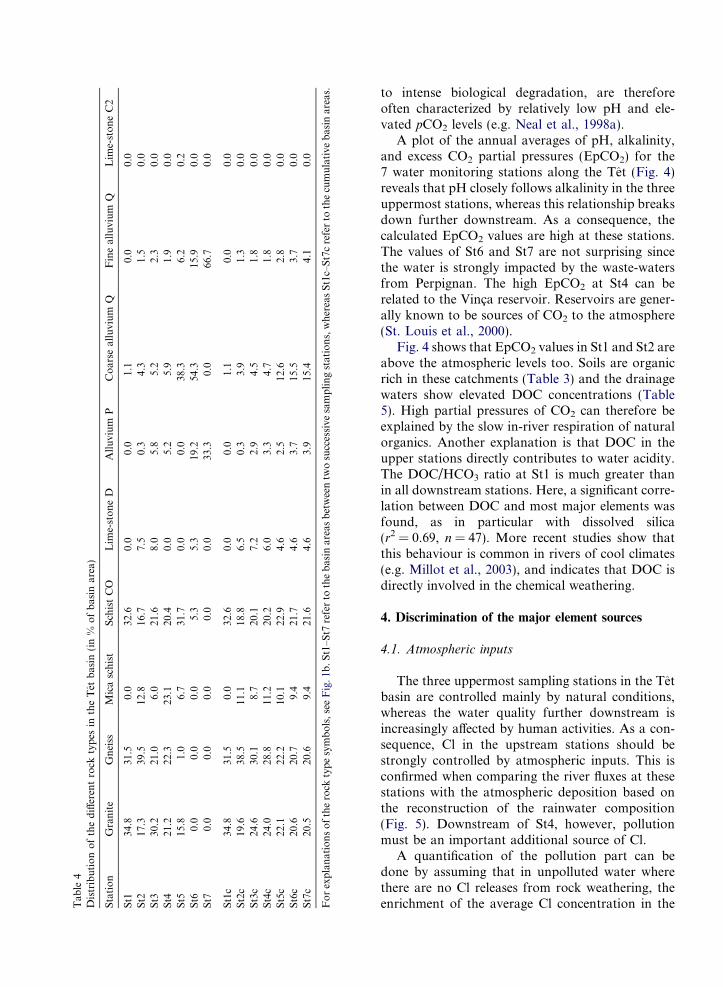
System (GIS) was developed for the Tet basin onthe basis of a digital elevation model (USGS,2000; see also Ludwig et al., 2004). The data layerswere taken from available data sets or were digitizedfrom maps in the framework of this study. Table 3gives the basin averages for the sampling stationswith regard to basin morphology, vegetation typesand land use, soil C and population numbers. Table4 summarizes the nature of the main rock types thatoutcrop in the respective catchments.
The three uppermost basin parts (St1, St2 andSt3) are situated in elevated regions with steep mor-phologies and are only very weakly affected byhuman activities. Natural vegetation types representmore than 90% of the land cover and agriculturalactivity is mainly limited to extensive practices likeanimal farming. Upstream of St3, population den-sity is extremely low. These low values, however,have to be considered with caution since they arebased on the existing villages and towns and donot take into account the seasonal influx of tourists.In the catchments of St1 and St2, ski tourism is fre-quent in winter and many habitations were con-structed for this purpose (as indicated by theirurban areas in Table 3).
Further downstream, land use practices change.Intensive agricultural land use becomes a dominantpattern in the basin in the form of fruit tree cultures(ca. 80%) and vineyards (ca. 20%). Population den-sity still remains at low levels, at least in the middlepart of the basin (St4 and St5). Most of the popula-tion is concentrated in the catchment of St6, wherethe city of Perpignan is located: although this catch-ment covers only about 7% of the total basin area,more than 70% of the total basin population is con-centrated here.
The lithology of the basin is dominated by oldplutonic and metamorphic rocks (Fig. 1b), whichare weathering resistant. However, in the basinparts of St2 and St3, limestone is present, whichcan have a strong impact on the water chemistry.Limestone is on average about 20 times more rap-idly weathered than granite (Meybeck, 1986;Amiotte-Suchet and Probst, 1993, 1995) and evensmall areas of limestone can strongly influence thewater composition. In the Tet basin, this effect isstrongest at St3, where the main river crosses thelimestone and hence drains the local karst aquiferthat is contained in this formation (Courtois et al.,2001).
After St4, the river enters into its alluvial plainwhich consists of thick fillings of the erosion prod-
ucts of the upstream rocks that accumulated duringPliocene and Quaternary periods. No sedimentaryrocks containing evaporites exist in the basin, whichexcludes a lithological origin of Cl in the river water.
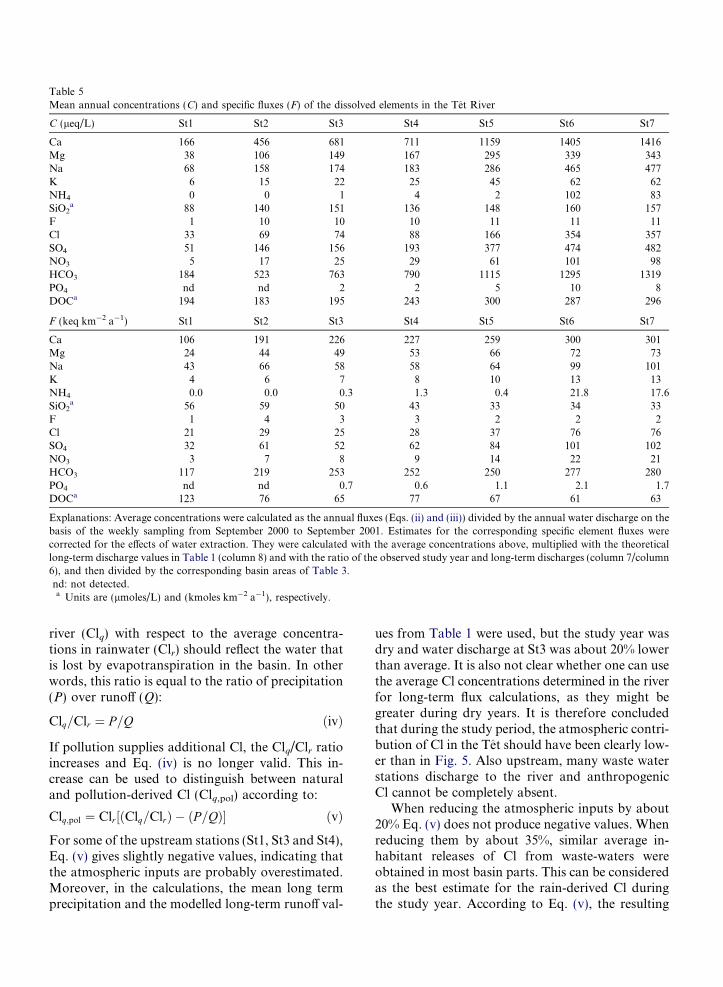
3.2. Major element fluxes
Table 5 shows the mean annual concentrationsand mean specific element fluxes for all dissolvedcompounds and at all stations. The latter clearlyincrease from upstream to downstream for most ele-ments. The corresponding downstream evolution ofthe relative element distribution is shown in thePiper diagram in Fig. 3. Along the three uppermoststations, the water quality evolves toward enrich-ment in Ca and HCO3, which are the dominant ionsin the Tet. This evolution can be explained bychanges in the outcropping rock types (see above),since the dissolution of carbonates releases both ele-ments. Also other changes in the water compositioncan be directly related to the lithology. For example,F concentrations increase by a factor of >10 fromSt1 to St2, which reflects the existence of fluoritebearing rocks. This mineral was formerly mined inthis region and F concentrations as high as360 leq/L could be measured in some smalltributaries.
Downstream of St3, however, the water composi-tion changes without any visible connection to thelithology. There are particularly high contributionsof SO4 (St4 and St5) and of Cl (St5, St6 and St7).Sulfate in rivers can be the result of pyrite bearingshale and schist, but it is unlikely that this effectaccounts for the downstream increase of SO4 inthe Tet. The geological map of this region showspyrite facies in the mica schist and schist of theSt2 catchment (Guitard et al., 1998), but not inthe rocks further downstream.
3.3. pH, alkalinity and pCO2
When river water is in equilibrium with atmo-spheric CO2, pH values are controlled by alkalinity,which directly reflects the water-rock interactions inthe watershed. Deviations from the close couplingof both parameters, however, can occur. High pHvalues are often associated with intense in-situ pri-mary production, which consumes acidity (Stummand Morgan, 1981; Crouzet et al., 1999), whilelow values relate to biological respiration of organicmatter, which releases CO2 to the river water.Waste-water effluents, which have been subjected
Tab
le3
Ave
rage
bas
inch
arac
teri
stic
so
fth
em
on
ito
red
catc
hm
ents
inth
eT
etb
asin
Sta
tio
nB
asin
area
(km
2)
Mea
nel
evat
ion
(m)
Mea
nsl
op
e(�
)
Nu
mb
ero
fin
hab
itan
tsU
rban
and
ind
ust
rial
area
(%)
Nat
ura
lve
geta
tio
nar
ea(%
)
Wet
lan
ds
&w
ater
area
(%)
Cat
tle
agri
cult
ure
area
(%)
Fru
ittr
ees/
vin
eyar
dar
ea(%
)
Oth
erag
ricu
ltu
rear
ea(%
)
Car
bo
nco
nte
nt
inso
ils
(%)
St1
5621
4811
.10
0.3
91.1
6.5
2.1
00
9.4
St2
370
1672
17.6
2438
0.5
91.4
05
0.2
2.8
6.8
St3
389
1135
15.4
13,9
400.
390
.20.
64.
92.
91
4.3
St4
170
856
14.5
3071
0.3
74.5
0.9
9.1
14.9
0.3
4.4
St5
303
314
5.5
23,4
242.
264
.80
4.5
21.3
7.2
1.7
St6
9576
1.3
146,
958
16.2
8.5
00
31.4
43.8
0.9
St7
89
0.5
16,0
959.
90
00
090
.10.
7
St1
c56
2148
11.1
00.
391
.16.
52.
10
09.
4S
t2c
426
1735
16.8
2438
0.5
91.4
0.9
4.6
0.2
2.5
7.1
St3
c81
514
4816
.116
,378
0.4
90.8
0.7
4.8
1.5
1.8
5.8
St4
c98
413
4615
.819
,449
0.4
88.0
0.8
5.5
3.8
1.5
5.5
St5
c12
8711
0313
.442
,873
0.8
82.5
0.6
5.3
7.9
2.9
4.6
St6
c13
8210
3312
.618
9,83
11.
977
.50.
54.
99.
55.
74.
4S
t7c
1390
1027
12.5
205,
926
1.9
77.0
0.5
4.9
9.5
6.2
4.4
Dat
aso
urc
es:
Co
lum
ns
2–4:
US
GS
(200
0);
colu
mn
5:IN
SE
E(2
005)
;co
lum
ns
6–8,
Co
rin
e(2
000)
;co
lum
ns
9–11
:to
tal
agri
cult
ura
lar
eaac
cord
ing
toC
ori
ne
(200
0)an
dsp
ecifi
cati
on
of
lan
du
sety
pe
acco
rdin
gto
AG
RE
ST
E(2
003)
;co
lum
n12
:Jo
nes
etal
.(20
03,2
004)
;Ext
ract
ion
of
the
dat
aw
asd
on
ew
ith
Arc
Info
soft
war
eto
ols
.S
t1–S
t7re
fer
toth
eb
asin
area
bet
wee
ntw
osu
cces
sive
sam
pli
ng
stat
ion
s,w
her
eas
St1
c–S
t7c
refe
rto
the
cum
ula
tive
bas
inar
ea.
Tab
le4
Dis
trib
uti
on
of
the
diff
eren
tro
ckty
pes
inth
eT
etb
asin
(in
%o
fb
asin
area
)
Sta
tio
nG
ran
ite
Gn
eiss
Mic
asc
his
tS
chis
tC
OL
ime-
sto
ne
DA
llu
viu
mP
Co
arse
allu
viu
mQ
Fin
eal
luvi
um
QL
ime-
sto
ne
C2
St1
34.8
31.5
0.0
32.6
0.0
0.0
1.1
0.0
0.0
St2
17.3
39.5
12.8
16.7
7.5
0.3
4.3
1.5
0.0
St3
30.2
21.0
6.0
21.6
8.0
5.8
5.2
2.3
0.0
St4
21.2
22.3
23.1
20.4
0.0
5.2
5.9
1.9
0.0
St5
15.8
1.0
6.7
31.7
0.0
0.0
38.3
6.2
0.2
St6
0.0
0.0
0.0
5.3
5.3
19.2
54.3
15.9
0.0
St7
0.0
0.0
0.0
0.0
0.0
33.3
0.0
66.7
0.0
St1
c34
.831
.50.
032
.60.
00.
01.
10.
00.
0S
t2c
19.6
38.5
11.1
18.8
6.5
0.3
3.9
1.3
0.0
St3
c24
.630
.18.
720
.17.
22.
94.
51.
80.
0S
t4c
24.0
28.8
11.2
20.2
6.0
3.3
4.7
1.8
0.0
St5
c22
.122
.210
.122
.94.
62.
512
.62.
80.
0S
t6c
20.6
20.7
9.4
21.7
4.6
3.7
15.5
3.7
0.0
St7
c20
.520
.69.
421
.64.
63.
915
.44.
10.
0
Fo
rex
pla
nat
ion
so
fth
ero
ckty
pe
sym
bo
ls,
see
Fig
.1b
.S
t1–S
t7re
fer
toth
eb
asin
area
sb
etw
een
two
succ
essi
vesa
mp
lin
gst
atio
ns,
wh
erea
sS
t1c–
St7
cre
fer
toth
ecu
mu
lati
veb
asin
area
s.
to intense biological degradation, are thereforeoften characterized by relatively low pH and ele-vated pCO2 levels (e.g. Neal et al., 1998a).
A plot of the annual averages of pH, alkalinity,and excess CO2 partial pressures (EpCO2) for the7 water monitoring stations along the Tet (Fig. 4)reveals that pH closely follows alkalinity in the threeuppermost stations, whereas this relationship breaksdown further downstream. As a consequence, thecalculated EpCO2 values are high at these stations.The values of St6 and St7 are not surprising sincethe water is strongly impacted by the waste-watersfrom Perpignan. The high EpCO2 at St4 can berelated to the Vinca reservoir. Reservoirs are gener-ally known to be sources of CO2 to the atmosphere(St. Louis et al., 2000).
Fig. 4 shows that EpCO2 values in St1 and St2 areabove the atmospheric levels too. Soils are organicrich in these catchments (Table 3) and the drainagewaters show elevated DOC concentrations (Table5). High partial pressures of CO2 can therefore beexplained by the slow in-river respiration of naturalorganics. Another explanation is that DOC in theupper stations directly contributes to water acidity.The DOC/HCO3 ratio at St1 is much greater thanin all downstream stations. Here, a significant corre-lation between DOC and most major elements wasfound, as in particular with dissolved silica(r2 = 0.69, n = 47). More recent studies show thatthis behaviour is common in rivers of cool climates(e.g. Millot et al., 2003), and indicates that DOC isdirectly involved in the chemical weathering.
4. Discrimination of the major element sources
4.1. Atmospheric inputs
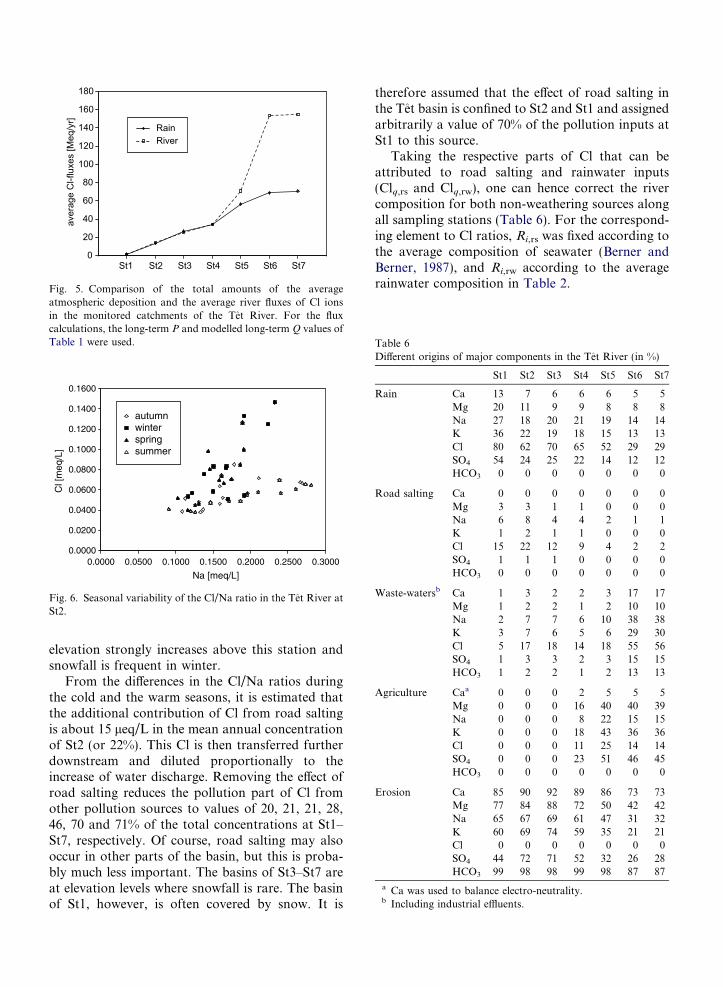
The three uppermost sampling stations in the Tetbasin are controlled mainly by natural conditions,whereas the water quality further downstream isincreasingly affected by human activities. As a con-sequence, Cl in the upstream stations should bestrongly controlled by atmospheric inputs. This isconfirmed when comparing the river fluxes at thesestations with the atmospheric deposition based onthe reconstruction of the rainwater composition(Fig. 5). Downstream of St4, however, pollutionmust be an important additional source of Cl.
A quantification of the pollution part can bedone by assuming that in unpolluted water wherethere are no Cl releases from rock weathering, theenrichment of the average Cl concentration in the
Table 5Mean annual concentrations (C) and specific fluxes (F) of the dissolved elements in the Tet River
Explanations: Average concentrations were calculated as the annual fluxes (Eqs. (ii) and (iii)) divided by the annual water discharge on thebasis of the weekly sampling from September 2000 to September 2001. Estimates for the corresponding specific element fluxes werecorrected for the effects of water extraction. They were calculated with the average concentrations above, multiplied with the theoreticallong-term discharge values in Table 1 (column 8) and with the ratio of the observed study year and long-term discharges (column 7/column6), and then divided by the corresponding basin areas of Table 3.nd: not detected.a Units are (lmoles/L) and (kmoles km�2 a�1), respectively.
river (Clq) with respect to the average concentra-tions in rainwater (Clr) should reflect the water thatis lost by evapotranspiration in the basin. In otherwords, this ratio is equal to the ratio of precipitation(P) over runoff (Q):
Clq=Clr ¼ P=Q ðivÞ
If pollution supplies additional Cl, the Clq/Clr ratioincreases and Eq. (iv) is no longer valid. This in-crease can be used to distinguish between naturaland pollution-derived Cl (Clq,pol) according to:
Clq;pol ¼ Clr½ðClq=ClrÞ � ðP=QÞ� ðvÞFor some of the upstream stations (St1, St3 and St4),Eq. (v) gives slightly negative values, indicating thatthe atmospheric inputs are probably overestimated.Moreover, in the calculations, the mean long termprecipitation and the modelled long-term runoff val-
ues from Table 1 were used, but the study year wasdry and water discharge at St3 was about 20% lowerthan average. It is also not clear whether one can usethe average Cl concentrations determined in the riverfor long-term flux calculations, as they might begreater during dry years. It is therefore concludedthat during the study period, the atmospheric contri-bution of Cl in the Tet should have been clearly low-er than in Fig. 5. Also upstream, many waste waterstations discharge to the river and anthropogenicCl cannot be completely absent.
When reducing the atmospheric inputs by about20% Eq. (v) does not produce negative values. Whenreducing them by about 35%, similar average in-habitant releases of Cl from waste-waters wereobtained in most basin parts. This can be consideredas the best estimate for the rain-derived Cl duringthe study year. According to Eq. (v), the resulting
Mg
SO4
+ Cl Ca + Mg
Na+ K HCO3 SO4
ClCa
St1
St2
St3
St4
St5
St6
St7
Fig. 3. Distribution of the average water composition (in leq/L) at the seven sampling stations in the Piper-Diagram. Arrows point to100% poles for the indicated elements.
0
200
400
600
800
1000
1200
1400
6.50
6.70
6.90
7.10
7.30
7.50
7.70
7.90
8.10
8.30
8.50
0.00
1.00
2.00
3.00
4.00
5.00
6.00
7.00
8.00
9.00
10.00
pH
HCO3
EpCO2
St1 St4St3St2 St5 St6 St7
pH
HC
O3 [
μmo
les/
L]
Ep
CO
2
Fig. 4. Mean values of field pH, alkalinity and excess partial pressure of CO2 (EpCO2) along the seven sampling stations of the Tet River.EpCO2 was calculated according to Eq. (3c) of Neal et al. (1998b) and includes the correction of the atmospheric reference pCO2 as afunction of station altitude (Eq. (A-1a) of Neal et al. (1998b)). Averages of pH and EpCO2 were respectively determined as the meanannual fluxes of H+ and CO2 in the river, divided by the annual discharge (Eqs. (i) and (ii) of this study).
estimates for the pollution part of Cl in the Tet arethen 20, 38, 30, 34, 48, 71 and 71% for the stationsSt1–St7, respectively.
4.2. Road salting
It was unexpected to find a greater share of Clpollution in St2 than in St3 and St4, although pop-
ulation density is very low in this basin part (Table2). Chloride is only weakly correlated with Na atSt2, in contrast with all other stations. This can beattributed to an important contribution of roadsalting to the Cl transport in the river. Cl/Na ratiosare much greater in winter and spring, when theyare frequently >0.6, compared to summer andautumn, when they are mostly <0.3 (Fig. 6). Basin
RainRiver
St1 St2 St3 St4 St5 St6 St7
aver
age
Cl-f
luxe
s [M
eq/y
r]
0
20
40
60
80
100
120
140
160
180
Fig. 5. Comparison of the total amounts of the averageatmospheric deposition and the average river fluxes of Cl ionsin the monitored catchments of the Tet River. For the fluxcalculations, the long-term P and modelled long-term Q values ofTable 1 were used.
0.0000
0.0200
0.0400
0.0600
0.0800
0.1000
0.1200
0.1400
0.1600
0.0000 0.0500 0.1000 0.1500 0.2000 0.2500 0.3000
Na [meq/L]
Cl [
meq
/L]
autumnwinterspringsummer
Fig. 6. Seasonal variability of the Cl/Na ratio in the Tet River atSt2.
Table 6Different origins of major components in the Tet River (in %)
a Ca was used to balance electro-neutrality.b Including industrial effluents.
elevation strongly increases above this station andsnowfall is frequent in winter.
From the differences in the Cl/Na ratios duringthe cold and the warm seasons, it is estimated thatthe additional contribution of Cl from road saltingis about 15 leq/L in the mean annual concentrationof St2 (or 22%). This Cl is then transferred furtherdownstream and diluted proportionally to theincrease of water discharge. Removing the effect ofroad salting reduces the pollution part of Cl fromother pollution sources to values of 20, 21, 21, 28,46, 70 and 71% of the total concentrations at St1–St7, respectively. Of course, road salting may alsooccur in other parts of the basin, but this is proba-bly much less important. The basins of St3–St7 areat elevation levels where snowfall is rare. The basinof St1, however, is often covered by snow. It is
therefore assumed that the effect of road salting inthe Tet basin is confined to St2 and St1 and assignedarbitrarily a value of 70% of the pollution inputs atSt1 to this source.
Taking the respective parts of Cl that can beattributed to road salting and rainwater inputs(Clq,rs and Clq,rw), one can hence correct the rivercomposition for both non-weathering sources alongall sampling stations (Table 6). For the correspond-ing element to Cl ratios, Ri,rs was fixed according tothe average composition of seawater (Berner andBerner, 1987), and Ri,rw according to the averagerainwater composition in Table 2.
4.3. Average waste-water composition
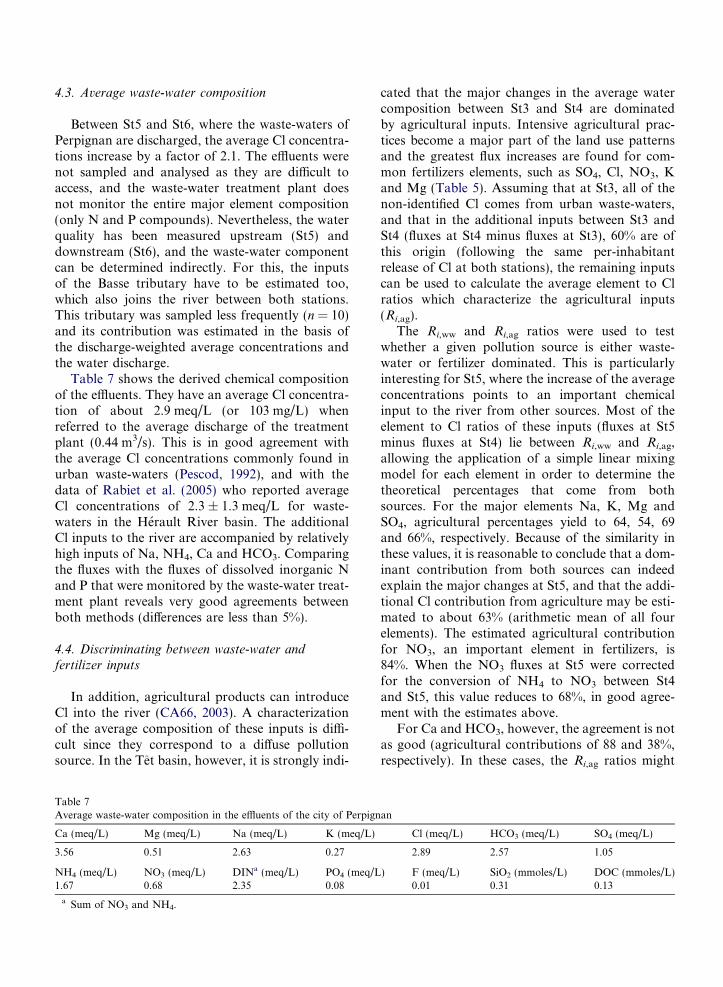
Between St5 and St6, where the waste-waters ofPerpignan are discharged, the average Cl concentra-tions increase by a factor of 2.1. The effluents werenot sampled and analysed as they are difficult toaccess, and the waste-water treatment plant doesnot monitor the entire major element composition(only N and P compounds). Nevertheless, the waterquality has been measured upstream (St5) anddownstream (St6), and the waste-water componentcan be determined indirectly. For this, the inputsof the Basse tributary have to be estimated too,which also joins the river between both stations.This tributary was sampled less frequently (n = 10)and its contribution was estimated in the basis ofthe discharge-weighted average concentrations andthe water discharge.
Table 7 shows the derived chemical compositionof the effluents. They have an average Cl concentra-tion of about 2.9 meq/L (or 103 mg/L) whenreferred to the average discharge of the treatmentplant (0.44 m3/s). This is in good agreement withthe average Cl concentrations commonly found inurban waste-waters (Pescod, 1992), and with thedata of Rabiet et al. (2005) who reported averageCl concentrations of 2.3 ± 1.3 meq/L for waste-waters in the Herault River basin. The additionalCl inputs to the river are accompanied by relativelyhigh inputs of Na, NH4, Ca and HCO3. Comparingthe fluxes with the fluxes of dissolved inorganic Nand P that were monitored by the waste-water treat-ment plant reveals very good agreements betweenboth methods (differences are less than 5%).
4.4. Discriminating between waste-water andfertilizer inputs
In addition, agricultural products can introduceCl into the river (CA66, 2003). A characterizationof the average composition of these inputs is diffi-cult since they correspond to a diffuse pollutionsource. In the Tet basin, however, it is strongly indi-
Table 7Average waste-water composition in the effluents of the city of Perpign
cated that the major changes in the average watercomposition between St3 and St4 are dominatedby agricultural inputs. Intensive agricultural prac-tices become a major part of the land use patternsand the greatest flux increases are found for com-mon fertilizers elements, such as SO4, Cl, NO3, Kand Mg (Table 5). Assuming that at St3, all of thenon-identified Cl comes from urban waste-waters,and that in the additional inputs between St3 andSt4 (fluxes at St4 minus fluxes at St3), 60% are ofthis origin (following the same per-inhabitantrelease of Cl at both stations), the remaining inputscan be used to calculate the average element to Clratios which characterize the agricultural inputs(Ri,ag).
The Ri,ww and Ri,ag ratios were used to testwhether a given pollution source is either waste-water or fertilizer dominated. This is particularlyinteresting for St5, where the increase of the averageconcentrations points to an important chemicalinput to the river from other sources. Most of theelement to Cl ratios of these inputs (fluxes at St5minus fluxes at St4) lie between Ri,ww and Ri,ag,allowing the application of a simple linear mixingmodel for each element in order to determine thetheoretical percentages that come from bothsources. For the major elements Na, K, Mg andSO4, agricultural percentages yield to 64, 54, 69and 66%, respectively. Because of the similarity inthese values, it is reasonable to conclude that a dom-inant contribution from both sources can indeedexplain the major changes at St5, and that the addi-tional Cl contribution from agriculture may be esti-mated to about 63% (arithmetic mean of all fourelements). The estimated agricultural contributionfor NO3, an important element in fertilizers, is84%. When the NO3 fluxes at St5 were correctedfor the conversion of NH4 to NO3 between St4and St5, this value reduces to 68%, in good agree-ment with the estimates above.
For Ca and HCO3, however, the agreement is notas good (agricultural contributions of 88 and 38%,respectively). In these cases, the Ri,ag ratios might
an
Cl (meq/L) HCO3 (meq/L) SO4 (meq/L)
2.89 2.57 1.05
) F (meq/L) SiO2 (mmoles/L) DOC (mmoles/L)0.01 0.31 0.13
0.0000
0.0500
0.1000
0.1500
0.2000
0.2500
09 11 01 03 05 07 09 11 01 03
SiO
2 (m
mol
/L)
St3-weeklySt4-weekly
St3-monthlySt4-monthly
Month in years 2000-2002
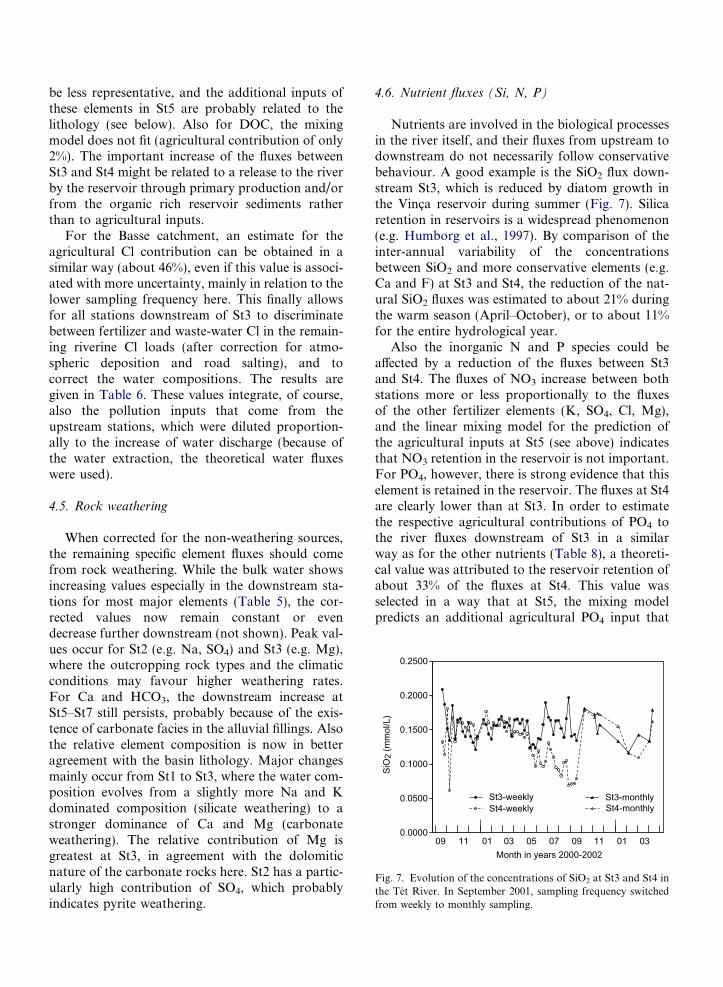
Fig. 7. Evolution of the concentrations of SiO2 at St3 and St4 inthe Tet River. In September 2001, sampling frequency switchedfrom weekly to monthly sampling.
be less representative, and the additional inputs ofthese elements in St5 are probably related to thelithology (see below). Also for DOC, the mixingmodel does not fit (agricultural contribution of only2%). The important increase of the fluxes betweenSt3 and St4 might be related to a release to the riverby the reservoir through primary production and/orfrom the organic rich reservoir sediments ratherthan to agricultural inputs.
For the Basse catchment, an estimate for theagricultural Cl contribution can be obtained in asimilar way (about 46%), even if this value is associ-ated with more uncertainty, mainly in relation to thelower sampling frequency here. This finally allowsfor all stations downstream of St3 to discriminatebetween fertilizer and waste-water Cl in the remain-ing riverine Cl loads (after correction for atmo-spheric deposition and road salting), and tocorrect the water compositions. The results aregiven in Table 6. These values integrate, of course,also the pollution inputs that come from theupstream stations, which were diluted proportion-ally to the increase of water discharge (because ofthe water extraction, the theoretical water fluxeswere used).
4.5. Rock weathering
When corrected for the non-weathering sources,the remaining specific element fluxes should comefrom rock weathering. While the bulk water showsincreasing values especially in the downstream sta-tions for most major elements (Table 5), the cor-rected values now remain constant or evendecrease further downstream (not shown). Peak val-ues occur for St2 (e.g. Na, SO4) and St3 (e.g. Mg),where the outcropping rock types and the climaticconditions may favour higher weathering rates.For Ca and HCO3, the downstream increase atSt5–St7 still persists, probably because of the exis-tence of carbonate facies in the alluvial fillings. Alsothe relative element composition is now in betteragreement with the basin lithology. Major changesmainly occur from St1 to St3, where the water com-position evolves from a slightly more Na and Kdominated composition (silicate weathering) to astronger dominance of Ca and Mg (carbonateweathering). The relative contribution of Mg isgreatest at St3, in agreement with the dolomiticnature of the carbonate rocks here. St2 has a partic-ularly high contribution of SO4, which probablyindicates pyrite weathering.
4.6. Nutrient fluxes (Si, N, P)
Nutrients are involved in the biological processesin the river itself, and their fluxes from upstream todownstream do not necessarily follow conservativebehaviour. A good example is the SiO2 flux down-stream St3, which is reduced by diatom growth inthe Vinca reservoir during summer (Fig. 7). Silicaretention in reservoirs is a widespread phenomenon(e.g. Humborg et al., 1997). By comparison of theinter-annual variability of the concentrationsbetween SiO2 and more conservative elements (e.g.Ca and F) at St3 and St4, the reduction of the nat-ural SiO2 fluxes was estimated to about 21% duringthe warm season (April–October), or to about 11%for the entire hydrological year.
Also the inorganic N and P species could beaffected by a reduction of the fluxes between St3and St4. The fluxes of NO3 increase between bothstations more or less proportionally to the fluxesof the other fertilizer elements (K, SO4, Cl, Mg),and the linear mixing model for the prediction ofthe agricultural inputs at St5 (see above) indicatesthat NO3 retention in the reservoir is not important.For PO4, however, there is strong evidence that thiselement is retained in the reservoir. The fluxes at St4are clearly lower than at St3. In order to estimatethe respective agricultural contributions of PO4 tothe river fluxes downstream of St3 in a similarway as for the other nutrients (Table 8), a theoreti-cal value was attributed to the reservoir retention ofabout 33% of the fluxes at St4. This value wasselected in a way that at St5, the mixing modelpredicts an additional agricultural PO4 input that
Table 8Different origins of nutrients and dissolved organic C in the TetRiver (in %)
nd : not detected.a Including industrial effluents.
0
1
2
3
4
5
6
7
8
9
0.10 1.00 10.0 100 1000
St5St6St7
Water discharge (m3/s)
DO
C (
mg/
L)
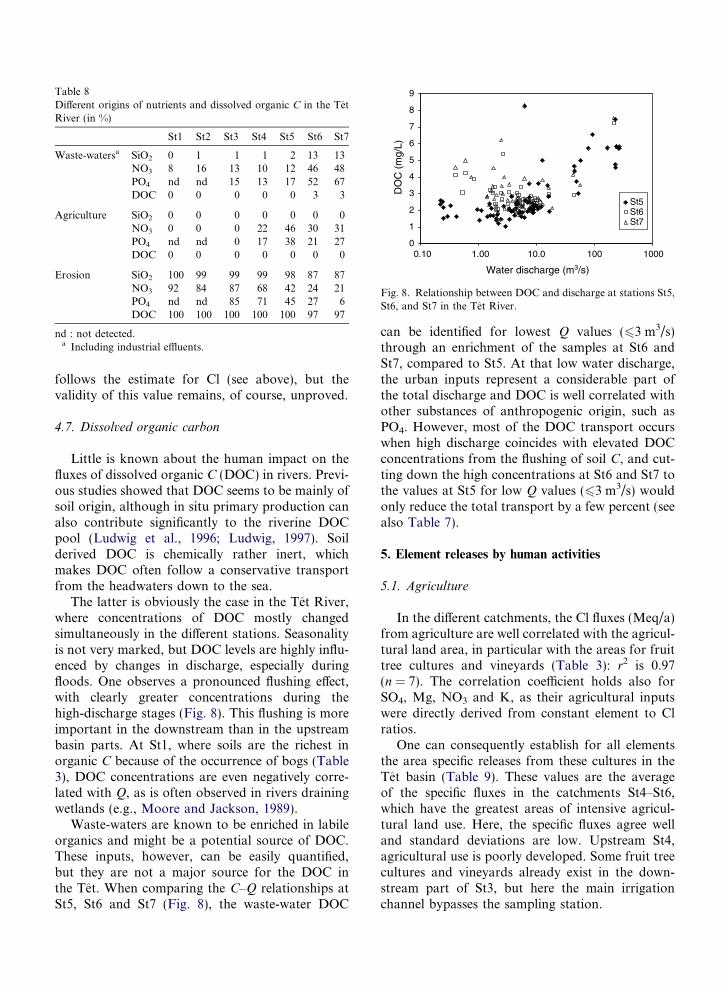
Fig. 8. Relationship between DOC and discharge at stations St5,St6, and St7 in the Tet River.
follows the estimate for Cl (see above), but thevalidity of this value remains, of course, unproved.
4.7. Dissolved organic carbon
Little is known about the human impact on thefluxes of dissolved organic C (DOC) in rivers. Previ-ous studies showed that DOC seems to be mainly ofsoil origin, although in situ primary production canalso contribute significantly to the riverine DOCpool (Ludwig et al., 1996; Ludwig, 1997). Soilderived DOC is chemically rather inert, whichmakes DOC often follow a conservative transportfrom the headwaters down to the sea.
The latter is obviously the case in the Tet River,where concentrations of DOC mostly changedsimultaneously in the different stations. Seasonalityis not very marked, but DOC levels are highly influ-enced by changes in discharge, especially duringfloods. One observes a pronounced flushing effect,with clearly greater concentrations during thehigh-discharge stages (Fig. 8). This flushing is moreimportant in the downstream than in the upstreambasin parts. At St1, where soils are the richest inorganic C because of the occurrence of bogs (Table3), DOC concentrations are even negatively corre-lated with Q, as is often observed in rivers drainingwetlands (e.g., Moore and Jackson, 1989).
Waste-waters are known to be enriched in labileorganics and might be a potential source of DOC.These inputs, however, can be easily quantified,but they are not a major source for the DOC inthe Tet. When comparing the C–Q relationships atSt5, St6 and St7 (Fig. 8), the waste-water DOC
can be identified for lowest Q values (63 m3/s)through an enrichment of the samples at St6 andSt7, compared to St5. At that low water discharge,the urban inputs represent a considerable part ofthe total discharge and DOC is well correlated withother substances of anthropogenic origin, such asPO4. However, most of the DOC transport occurswhen high discharge coincides with elevated DOCconcentrations from the flushing of soil C, and cut-ting down the high concentrations at St6 and St7 tothe values at St5 for low Q values (63 m3/s) wouldonly reduce the total transport by a few percent (seealso Table 7).
5. Element releases by human activities
5.1. Agriculture
In the different catchments, the Cl fluxes (Meq/a)from agriculture are well correlated with the agricul-tural land area, in particular with the areas for fruittree cultures and vineyards (Table 3): r2 is 0.97(n = 7). The correlation coefficient holds also forSO4, Mg, NO3 and K, as their agricultural inputswere directly derived from constant element to Clratios.
One can consequently establish for all elementsthe area specific releases from these cultures in theTet basin (Table 9). These values are the averageof the specific fluxes in the catchments St4–St6,which have the greatest areas of intensive agricul-tural land use. Here, the specific fluxes agree welland standard deviations are low. Upstream St4,agricultural use is poorly developed. Some fruit treecultures and vineyards already exist in the down-stream part of St3, but here the main irrigationchannel bypasses the sampling station.
Table 9Specific element releases by agriculture in the Tet basin
Flux SO4
(keq km�2 a�1)Flux K(keq km�2 a�1)
Flux Mg(keq km�2 a�1)
Flux NO3
(keq km�2 a�1)Flux PO4
(keq km�2 a�1)Flux Cl(keq km�2 a�1)
Agriculturea 430 44 265 60 4.3 95Standard
deviation18 2 11 3 0.2 4
Erosionb 37 5 44 7 0.6 –
a Average of St4–St6 when only considering vineyards and fruit tree cultures.b Average fluxes at St3 from Table 5, corrected for non-weathering sources (Tables 6 and 8).
Table 9 shows that the element release from agri-cultural lands is greatest for SO4. The specific inputsto the Tet River are more than 11 times greater thanthe specific weathering fluxes. Sulfate is an abun-dant anion in fertilizers (Vitoria et al., 2004;CA66, 2003). However, vineyards are frequentlytreated with fungicides (CuSO4), which might be adominant source for this element too (Van der Weij-den and Pacheco, 2006). Also for K and NO3, thereleases from agricultural terrains are clearly moreelevated than the natural fluxes (about 8–9 timesthe average weathering rates). For NO3, the specificfluxes from soil erosion (bulk fluxes minus anthro-pogenic fluxes) are rather constant along all sta-tions, varying only between 7–9 kmoles km�2 a�1,except for St1 where this value is 3 kmoleskm�2 a�1. The corresponding average concentra-tions stretch from 0.07 to 0.34 mg N/L. Such lowconcentrations are normally found in Europeanrivers that are only weakly affected by human activ-ities (Crouzet et al., 1999), but the values are stillgreater than the ones commonly attributed to pris-tine rivers (e.g. 0.05–0.20 mg N/L by Meybeck andHelmer (1989)). Also the moderate agriculturalactivity in the upstream basin may release someadditional NO3 to the river. For PO4, the concentra-tions in the upper two stations were mostly belowthe detection limit and the flux estimates might beless accurate than for the other elements.
5.2. Waste-waters
Waste-waters are the major source for Cl in theTet River close to its mouth. Also for Na, theyare a dominant source, more important than theamount of Na that is mobilized by weathering(Table 6). The average annual inhabitant releaseof Cl for the entire river is 311 moles/inhabitant,which is relatively high compared to what has beenfound elsewhere. For example, Verbanck et al.(1989) reported 237 moles/inhabitant for the Cl
inputs from the city of Brussels, Thibert (1994) of177 moles/inhabitant for the city of Paris, and Cailleet al. (1973) of 231 moles/inhabitant for the city ofMontreal.
In the individual basin parts, however, consider-able differences can be found, indicating that thereare also Cl inputs from industrial pollution. Thegreatest flux of about 368 moles Cl/inhabitant isobtained for the St6 catchment, which correspondsto the drainage basin of the Basse tributary, wherethe waste-waters of Perpignan come in. But it is alsohere where the industrial zones are concentrated inthe Tet basin (Table 3). Notice that the specific Clflux in the Basse is about four times greater thanthe specific Cl fluxes in the Tet at St5, and 1.7 timesgreater than the fluxes at St6, after the river hasreceived the waste-waters of Perpignan. In the lat-ter, the inhabitant release of Cl is still elevated(276 moles/inhabitant) and some of the industrialpollution also joins the river via the waste-waterplant.
Further upstream, the specific Cl inputs perinhabitant are clearly lower. The values in the catch-ments St3, St4 and St5 are 141, 161 and 201 molesCl/inhabitant, respectively. As industry is verypoorly developed upstream of St4, a value of150 moles Cl/inhabitant might be representativefor the rural populations that live in the major partsof the Tet basin. In the catchment of St2, however,the theoretical per-inhabitant inputs of Cl are about3.5–5 times greater than in St3–St5. This, of course,has to be taken with caution. As mentioned above,the population densities in Table 3 might bestrongly underestimated because of tourism. Onthe other hand, the rainwater inputs may be under-estimated, since it is very difficult to estimate theaverage rainwater composition in the basin parts>1500 m. It is also possible that some additionalsources of Cl at St2 were overlooked, in particularthe hydrothermal springs that exist in this basinpart.
6. Conclusions
The approach was based on a high frequencysampling from the headwaters to the river mouth,which has not often been done in previous studies.This gives highly reliable budgets and allows adetailed tracking of the different material sourcesin the basin. At the basin outlet, only thefluxes of DOC, SiO2, HCO3 and Ca can be confi-dently attributed to chemical weathering (97, 87,87 and 73% of the bulk fluxes), while atmosphericdeposition is mainly important for Cl (29%) and,to a lesser extent, also for Na (14%). For mostother elements, anthropogenic sources have astrong control on the element fluxes. SO4, Mg,K, NO3 and PO4 are strongly influenced byinputs from agriculture (45, 39, 36, 31 and 27%),and PO4, Cl, NO3 and Na are largely controlledby urban waste-water effluents (67, 56, 48 and38%).
The impact of waste-waters on the water chem-istry in the Tet is naturally greatest close to itsmouth where the effluents of the agglomerationof Perpignan are discharged into the river. Buthere, also industrial pollution sources cancontribute to the material fluxes. Furtherupstream, where industrial activity is poorly devel-oped, the data might be more representative forthe average Cl release from house-holds, indicat-ing that this value is close to 150 moles/inhabi-tant. It is interesting to compare this value withthe annual food consumption of NaCl in WesternEurope and North America, which has been esti-mated to range between 30 and 120 moles/inhabi-tant, with an average of 60 moles/inhabitant(WHO, 1979).
The area specific element releases from intensiveagricultural land use, on the other hand, are ratherconstant in the basin and may also hold for otherrivers with similar land use patterns. For SO4, how-ever, the specific inputs are, compared to the naturalweathering rates, greater than for the other fertilizerelements NO3, K, PO4 and Mg. Sulphate can origi-nate from the use of fungicides on vineyards, whichmay explain this. Unfortunately, the monitoringapproach does not allow distinguishing betweenthe element inputs from the fruit tree cultures andthe vineyards in the basin. The latter, which are awidespread land use pattern along the French Med-iterranean coast, may be particularly important asanthropogenic sources of SO4 in many of the coastalrivers.
Acknowledgements
This study was undertaken as part of the long-term environmental observation program Ormeand has been financially supported by the CNRSin the framework of the French Zone-Atelier net-work. We are especially grateful to L. Croise forsupplying us the CATAENAT-RENECOFOR datafor our department, to the Communaute d’Agglome-
ration Tet-Mediterranee – Pole de Gestion des Eaux,
Service des Eaux usees (CDATM) for the data onthe waste-water purification plant at Perpignan, toMarc Van Liedekerke (ISPRA, Italy) for the OC-
TOP data set (organic carbon in topsoils) and toN. Jacquottet from the DDAF66 or supplying us adigital form of the AGRESTE land use map in thePO department. C.H. van der Weijden and an anon-ymous reviewer are acknowledged for their valuablecomments on the submitted manuscript and M.Abdullah and J. Hartmann for discussion and com-ments on an earlier version of it. Finally, we alsothank J.L. Blasi and all other permanent and non-permanent Cefrem members for regular assistanceduring field work.
References
AGRESTE, 2003. Recensement Agricole 2000. Principaux resul-tats. Extrait departemental Pyrenees-Orientales. AgresteLanguedoc-Roussillon, janvier 2003 (can be ordered at:www.agreste.agriculture.gouv.fr).
Amiotte-Suchet, P., Probst, J.L., 1993. Flux de CO2 consommepar alteration chimique continentale: influence du drainage etde la lithologie. C. R. Acad. Sci. Paris 317, 615–622.
Amiotte-Suchet, P., Probst, J.L., 1995. A global model forpresent day atmospheric/soil CO2 consumption by chemicalerosion of continental rocks (GEM-CO2). Tellus 47B, 273–280.
Amiotte Suchet, P., Probst, J.L., 1996. Origines du carboneinorganique dissous dans les eaux de la Garonne: Variationssaisonnieres et interannuelles. Sci. Geol. Bull. 49, 101–126.
Berner, E.K., Berner, R.A., 1987. The Global Water Cycle:Geochemistry and Environment. Prentice-Hall, EnglewoodCliffs, NJ.
CA66, 2003. Base de donnees des engrais et amendements desPyrenees-Orientales. Unite Agronomie/Environnement,Chambre d’Agriculture, Perpignan.
Caille, A., Campell, P., Meybeck, M., Sasseville, J.L., 1973.Etude du fleuve St.-Laurent: Effluents urbains de l’agglome-ration de Montreal. Rapport interne, INRS-Eau, Quebec.
Courtois, N., Le Strat, P., Marchal, J.P., 2001. Synthesehydrogeologique de la vallee de la Tet (Pyrenees-Orientales).Rapport BRGM/RP-51321-FR, BRGM Montpellier.
Corine, 2000. Corine Land Cover (CLC90), 100 m version 12/2000. Data set downloaded from the European EnvironmentAgency in 2005 (available at: http://www.eea.eu.int/).
Croise, L., Ulrich, E., Duplat, P., Jaquet, O., 2002. RENECO-FOR – Deux approches independantes pour l’estimation et lacartographie des depots atmospheriques totaux hors couvertforestier sur le territoire francais. Office National des Forets,Departement Recherche et Developpement (ISBN 2-84207-258-8).
Gaillardet, J., Dupre, B., Allegre, C.J., Negrel, P., 1997. Chemicaland physical denudation in the Amazon River Basin. Chem.Geol. 142, 141–173.
Gaillardet, J., Dupre, B., Louvat, P., Allegre, C.J., 1999. Globalsilicate weathering and CO2 consumption rates deduced fromthe chemistry of large rivers. Chem. Geol. 159, 3–30.
Gibbs, R.J., 1970. Water chemistry of the Amazon River.Geochim. Cosmochim. Acta 36, 1061–1066.
Guitard, G., Laumonier, B., Autran, A., Bandet, Y., Berger,G.M., 1998. Note explicative de la feuille de Prades au 1/50000eme (carte geologique no 1095). BRGM, Orleans.
Harrison, J.A., Seitzinger, S.P., Bouwman, A.F., Caraco, N.F.,Beusen, A.H.W., Vorosmarty, C.J., 2005. Dissolved inorganicphosphorus export to the coastal zone: results from a spatiallyexplicit, global model. Global Biogeochem. Cycles 19,GB4S03, doi:10.1029/2004GB002357.
Humborg, C., Ittekkot, V., Cociasu, A., von Bodungen, B., 1997.Effect of Danube River dam on Black Sea biogeochemistryand ecosystem structure. Nature 386, 385–388.
INSEE, 2005. Recensement de la population 1999. Data can bedownloaded at: www.recensement.insee.fr.
Jones, R.J.A., Hiederer, R., Rusco, E., Loveland, P.J., Mon-tanarella, L., 2003. Topsoil organic carbon in Europe. Proc.4th European Congress on Regional Geoscientific Cartogra-phy and Information Systems, 17–20 June 2003, Bologna,Emilia Romagna, Direzione Generale Ambiente e Difesa delSuolo e della Costa, Servizio Geologoco, Sismico e dei Suoli,pp. 249–251.
Jones, R.J.A., Hiederer, R., Rusco, E., Loveland, P.J., Mon-tanarella, L., 2004. The map of organic carbon in topsoils inEurope, Version 1.2, September 2003: Explanation of SpecialPublication Ispra 2004 No.72 (S.P.I.04.72). European SoilBureau Research Report No.17, EUR 21209 EN, 26pp. and 1map in ISO B1 format. Office for Official Publications of theEuropean Communities, Luxembourg (can be ordered at:http://eusoils.jrc.it/ESDB_Archive/octop/octop_data.html).
Ladouche, B., Aquilina, L., Cubizoles, J., Negrel, P., 1998.Rainfall chemistry in the south of France (Herault, 1996-1997). In: Mineralogical Magazine, 8th Annual V.M. Gold-schmidt Conference, 30 August to 03 September 1998,Toulouse, France, 26a, II, pp. 842–843.
Ludwig, W., 1997. Continental erosion and river transport oforganic carbon to the world’s oceans. Mem. Scie. Geol.Strasbourg 98.
Ludwig, W., Probst, J.L., Kempe, S., 1996. Predicting the oceanicinput of organic carbon by continental erosion. GlobalBiogeochem. Cycles 10, 23–41.
Ludwig, W., Serrat, P., Cesmat, L., Garcia-Esteves, J., 2004.Evaluating the impact of the recent temperature increase onthe hydrology of the Tet River (Southern France). J. Hydrol.289, 204–221.
Meybeck, M., 1983. Atmospheric inputs and river transport ofdissolved substances. In: Dissolved Loads of Rivers andSurface Water Quantity/Quality Relationships, IAHS publ.141, pp. 173–192.
Meybeck, M., 1986. Composition chimique des ruisseaux nonpollues de France. Sci. Geol. Bull. Strasbourg 39, 3–77.
Meybeck, M., 2003. Global occurrence of major elements inrivers. In: Drever, J.I. (Ed.), Treatise on Geochemistry,Surface and Ground Water, Weathering, and Soils, vol. 5.Elsevier, Amsterdam, pp. 207–223.
Meybeck, M., Helmer, R., 1989. The quality of rivers: frompristine stage to global pollution. Palaeogeog. Palaeoclim.Palaeoecol. 75, 283–309.
Millot, R., Gaillardet, J., Dupre, B., Allegre, C., 2003. Northernlatitude chemical weathering rates: clues from the MackenzieRiver basin, Canada. Geochim. Cosmochim. Acta 7, 1305–1329.
Moatar, F., Meybeck, M., 2005. Compared performances ofdifferent algorithms for estimating annual nutrient loadsdischarged by the eutrophic River Loire. Hydrol. Proc. 19,429–444.
Moore, T.R., Jackson, R.J., 1989. Dynamics of dissolved organiccarbon in forested and disturbed catchments, Westland, NewZealand. 2. Larry River. Water Resour. Res. 25, 1331–1339.
Mortatti, J., Probst, J.L., 2003. Silicate rock weathering andatmospheric/soil CO2 uptake in the Amazon basin estimatedfrom river water geochemistry: seasonal and spatial varia-tions. Chem. Geol. 197, 177–196.
Mortlock, R.A., Froelich, P.N., 1989. A simple method for therapid determination of biogenic opal in pelagic marinesediments. Deep-Sea Res. 36, 1415–1426.
Neal, C., House, W.A., Down, K., 1998b. An assessment ofexcess carbon dioxide partial pressures in natural watersbased on pH and alkalinity measurements. Sci. Total Envi-ron. 210/211, 173–185.
Neal, C., House, W.A., Jarvie, H.P., Eartherall, A., 1998a. Thesignificance of dissolved carbon dioxide in major lowlandrivers entering the North Sea. Sci. Total Environ. 210/211,187–203.
Pescod, M.B., 1992. Wastewater treatment and use in agriculture.FAO irrigation and drainage paper 47, FAO Rome(www.fao.org/docrep/T0551E/t0551e00.htm#Contents).
Petelet, E., 1998. Application de la geochimie a l’etude desmouvements d’eaux a moyenne et petite echelle : les bassinsversants de l’Herault et de la Peyne (S. France). Utilisationdes elements majeurs, traces et des isotopes du Sr et du Pb.These de doctorat, Univ. Montpellier II.
Probst, J.L., Mortatti, J., Tardy, Y., 1994. Carbon river fluxesand global weathering CO2 consumption in the Congo andAmazon river basins. Appl. Geochem. 9, 1–13.
Rabiet, M., Brissaud, F., Seidel, J.L., Pistre, S., Elbaz-Poulichet,F., 2005. Deciphering the presence of wastewater in amedium-sized Mediterranean catchment using a multitracerapproach. Appl. Geochem. 20, 1587–1596.
Salvayre, H., 1974. Carte geologique des Pyrenees-Orientales(carte geologique simplifiee a l’usage des eleves du 1er et2eme cycle et des amateurs de Geologie). Editions Ophrys,Paris.
Seitzinger, S.P., Kroeze, C., 1998. Global distribution of nitrousoxide production and N inputs in freshwater and coastalmarine ecosystems. Global Biogeochem. Cycles 12, 93–113.
Smith, S.V., Swaney, D.P., Talaue-Mcmanus, L., Bartley, J.D.,Sandhei, P.T., McLaughlin, C.J., Dupra, V.C., Crossland,C.J., Buddemeier, R.W., Maxwell, B.A., Wulff, F., 2003.Humans, hydrology, and the distribution of inorganic,nutrient loading to the ocean. Bioscience 53, 235–245.
Stallard, R.F., Edmond, J.M., 1981. Geochemistry of theAmazon: I. Precipitation chemistry and the marine contribu-tion to the dissolved load at the time of peak discharge. J.Geophys. Res. 86, 9844–9858.
St. Louis, V., Kelly, C.A., Duchemin, E., Rudd, J.W.M.,Rosenberg, D.M., 2000. Reservoir surfaces as sources ofgreenhouse gases to the atmosphere: A Global Estimate.Bioscience 50, 766–775.
Stumm, W., Morgan, J.J., 1981. Aquatic Chemistry, second ed.John Wiley and Sons.
Thibert, S., 1994. Exportations naturelles et anthropiques desions majeurs et des elements nutritifs dans le bassin de laSeine. These de doctorat, Univ. Paris VI.
Ulrich, E., Williot, B., 1993. Les depots atmospheriques enFrance de 1850–1990. Office National des Forets, Depart-ement Recherche et Developpement (ISBN 2904 384 48-0).
U.S.G.S., 2000. GTOPO30 – A global 30 Arc-Second Elevationdata set. Developed at the U.S. Geological survey EROSData Centre. Downloaded at: http://edcdaac.usgs.gov/gtopo30/gtopo30.html.
Van der Weijden, C.H., Pacheco, F.A.L., 2006. Hydrogeochem-istry in the Vouga River basin (central Portugal): pollutionand chemical weathering. Appl. Geochem. 21, 580–613.
Verbanck, M., Vanderborght, J.P., Wollast, R., 1989. Major ioncontent of urban wastewater: assessment of per capitaloading. Res. J. Water Poll. Control Federation 61, 1722–1728.
Vitoria, L., Otero, N., Soler, A., Canals, A., 2004. FertilizerCharacterization: Isotopic Data (N, S, O, C, and Sr).Environ. Sci. Technol. 38, 3254–3262.
WHO, 1979. Sodium, chlorides and conductivity in drinkingwater. EURO Reports and Studies No 2, Regional Office forEurope, Copenhaguen.