26
Globalization and the Polish Economy:
Stylized Facts and CGE Model Simulations
Michał Gradzewicz, Jan Hagemejer, Zbigniew Żółkiewski
National Bank of Poland*
Abstract
The aim of the paper is to quantitatively assess the impact of globalization on the economy of Poland in the medium term. Four channels of impact of globalization are distinguished: (i) trade openness, (ii) productivity improvement, (iii) labour migrations, (iv) liberalization of the services sector. First, we discuss stylized facts on adjustment of the Polish economy to globalization. Then we will present and discuss model-based simulations. As a modelling tool we use a computable general equilibrium model with multiple industries, labour markets, households and imperfect competition features.
Our results show positive and quite significant effects of globalization on the performance of the Polish economy. The strongest positive impact comes from productivity acceleration. Liberalization of services has also a considerable positive impact on GDP and especially on employment. The sizeable expected migrations result in negative effects of globalization by decreasing growth potential and causing upward pressure on wages. At the sectoral level, globalization is in particular beneficial to some exporting sectors and skilled segments of the labour market.
JEL classification: C68 F15 F22
keywords: globalization, computable general equilibrium, labour migrations, trade liberalization
* The views presented in this paper are those of the authors and not the institution they represent. Corresponding author: [email protected]
1. Introduction
Over the last decades, global processes have gained significance as the factor important for
the growth of Poland ‘s economy. It was in fact the coincidence of two major developments. First,
what is now called ‘globalization’ in the economic literature, should be more precisely named
‘acceleration of globalization’ since, as pointed out and analysed, eg. in Denis et al. (2006) it is the last
1 – 2 decades that have witnessed speeding up of the already ongoing ‘secular globalization’ process.
Second, Poland broke off communist system and started market reforms, leading among others to
rapid opening of the economy in 1989 and subsequent years, ie. the time when globalization
processes were gaining momentum. Then with further strengthening of market economy
mechanism, progressing integration with the European Union and finally accession to the EU in
2004, the economy of Poland has become subject to global economy impact as other medium-
income countries of the region. Global factors’ influence on Poland’s economy manifests itself by all
the channels usually mentioned in the literature such as: trade and capital flows, liberalization leading
to increasing foreign competition, absorption of innovations from technologically advanced
countries, intensive outward but also inward labour migrations, growing weight of global factors in
shaping domestic inflation. While the impact of particular global processes on the Polish economy
have been analyzed and quantified (eg. benefits of Poland’s accession to EU – Centrum Europejskie
Natolin 2003; Hagemejer and Michalek 2007); cost and benefits of accession to Euro area – NBP
2004; Orłowski 2003; impact of globalization on inflation – Allard 2006), there has been scarce, if
any, research aimed at quantitative assessment of how globalization, understood as variety of
interconnected processes, affects Poland’s economy1. The aim and novelty of this paper lies in a
quantitative assessment of the impact of key globalization processes on Poland’s economy in the
long run, using comprehensive methodological framework of a general equilibrium model.
The paper is organized as follows. In section 2 we review some related literature and discuss
some stylized facts on how globalization affects economy of Poland. In section 3 the authors define
the simulations experiments and discuss their results. Section 4 finalizes the paper with conclusions.
2. Review of literature and stylized facts on globalization for Poland
2.1. Review of literature
1 The comprehensive discussion on globalization, with special emphasis on global imbalances and implications for monetary policy, may be found in Rybinski 2006 (in Polish only).
Given the fact that globalization is one of the most popular words in contemporary
economic publications, the review of even most important contributions would be beyond the scope
of this paper. We will refer shortly to works being themselves the reviews or to those that are
relevant directly to our research. For instance, we found the paper of Denis et. al. 2006 as important
reference for our work, since this publication gives not only overview of views on globalization and
its impact on economies of the European Union (EU15) countries in the past but also offers a
quantitative assessment of potential future effects of global processes on growth of the EU15 in the
long-run. These authors adopt a standard notion of globalization, manifesting itself in increasing
importance of trade and capital flows, international R&D flows and migrations for domestic
economies (see section 3.2). Then, using relevant indicators they assess the impact of globalization
on the EU15 economy in the past (since 1820). They further present a model-based 2 quantitative
estimate of potential future macro benefits and costs of globalization for the EU in the long run
(1990 – 2050). As the main conclusions on the past importance of globalization for EU15 the
authors highlight:
− the increase in EU15 living standards by about 20% over the period of 1950-2002 thanks to EU’s
growing integration into the world’s economy (trade openness effect),
− importance of international TFP spillovers (eg., productivity growth in Europe over the period
1950-2000 would be about 30% lower without openness, even without link between capital
accumulation and TFP)
− the post-1990 acceleration in the globalization has been marked with the following new features:
(i) further expansion in both trade and capital market integration, (ii) an ICT induced acceleration
in the global relocation of production processes (iii) a worldwide income and technological
convergence process, being driven mainly by the shift from planned to market economies and by
the relative abundance of human capital in those countries.
The results of the long-run simulations lead the authors to the following main conclusions:
− globalization is expected to bring substantial welfare gains to EU citizens in the long-run,
estimated as 8% of GDP per capita,
− real gains from globalization are dynamic in nature and they result from the restructuring and
innovation, induced by the increase in competition and technology spillover effects and skill
transfers.
2 International macro model (QUEST) has been used as simulation tool.
As for other studies on quantitative assessment of globalization, they usually focus on
specific global processes, mosty trade liberalisation. Various trade liberalization processes are
believed to have had a significant effect on the volume in the world GDP – the estimated total effect
of the Urugway round was annual increase in the world GDP growth by 1pp (see e.g. Krugman and
Obstfeld 2005, p. 335). Effects of the current Doha round of the WTO are yet unknown since the
negotiations are still in progress, however, the recent study by Francois, van Meijl and van Tongeren
2005, estimates the static gains to be equal to 0.5% of the world GDP. The estimated world service
trade increase amounts to 12%. Merchandise exports of the developing countries to the EU are
expected to increase by 16%. Global trade in selected goods that was previously heavily protected is
believed to increase considerably, eg. 41% (processed foods), 34% (textiles and clothing) and 16%
(sugar).
There have been several papers estimating the effect of the accession of Poland to the
European Union and the Single Market. A recent one, by Hagemejer and Michalek 2007), estimates
the GDP increase resulting from the removal of non-tariff barriers at the level of 1-1.2% (short-long
run) and the total welfare effect at the level of 0.5-0.7% of GDP.
In the paper by Yusuf 2001, the effects of globalization are discussed from the point of view
of developing countries. The author defines globalization similarly to Denis et al. 2006 paper, ie. as a
combination of the following processes: growth of trade, capital flows, migration, IT and the
diffusion of technology. Author starts with the hypothesis that it is only a a relatively small number
of upper and middle income countries that profit from globalization. Then he takes a policy-oriented
approach to arrive at recommendations on ‘good policies’ that would enable developing countries to
gain pro-growth effects of globalization. The general policy conclusion from the study may be
expressed, following the author, as: to gain pro-growth effects of globalization, developing countries should
combine greater integration with the world economy with simultaneously conducted proper policy measures and
institutional change. As for the latter, author highlights:
• lifting protection measures on trade and capital flows to provide domestic economy with
competition and modernisation,
• investment in the skills of domestic labour force, to increase absorption of technical advance
• regulatory reform to unleash domestic entrepreneurship.
The author finds it important to apply these measures in the comprehensive policy framework
to embrace all the key elements of globalization together.
Poland is a middle-income country that combines the features of both developed and
developing countries. With respect to globalization, Poland may be treated as a developed country
being a member of the EU, considerably integrated as far as trade and capital flows are concerned,
with marginal role of agriculture (but still employing a relatively high share of unskilled labour force),
with relatively well educated labour force. On the other hand, Poland is affected by globalization
processes in a a similar way as the developing countries, for instance with respect to its dependence
of productivity growth on FDI inflow and imports or large emigration. Some stylized facts on impact
of global factor on the Poland’s economy are discussed in the next section.
2.2 Stylized facts on globalization effects in Poland
Progress of globalization manifests itself mainly through increasing opening of the domestic
economy to goods and services, capital and labour flows. Since the beginning of 1990s, the economy
of Poland significantly increased its links with the world economy. For instance, trade openness,
measured by the ratio of exports and imports to GDP increased from 49% in 1991 to 82.9% in 2006.
As for capital inflows, the stock of foreign direct investment in Poland increased from virtually null
in the beginning of 1990s (2.83 bill. USD) to over 92 bill. USD in 2005 (ie. about 31% of GDP).
Inward FDIs have been important not only as a source of financing investment (additional to
domestic savings), but also the powerful engine of productivity increase. With low intensity of
domestic innovation and R&D activities3, the inflow of foreign capital and imports of machinery and
equipment have been major sources behind productivity growth in Poland. The impact of FDIs,
imports, and other global economy spillovers on TFP growth in Poland is documented in Kolasa
and Żółkiewski 2004, Kolasa 2005, Piatkowski and Van Ark 2005, Clarke 2003. FDIs contribute a lot
to the increasing openness of the Polish economy, both through the setting up export potential and
increasing propensity to imports. According to IKCHZ (2006), in 2006 enterprises with foreign
capital were responsible of 66% of total Polish exports vs. 57% in 2004. Since a large number of
exporters use imported subcomponents in their activity, more than 86% of importers are exporters
at the same time (NBP, 2007).
Globalization processes, and in particular accession to European Union in 2004, affected
considerably the labour market in Poland. Due to wage differentials but also a large pool of
3 Expenditures on R&D amounted to 0.57% of GDP in 2005 that is one of the lowest records in EU25. However, it is even lower than in 1995 (0.63% of GDP).

unemployed4, migrations accelerated after May 1, 2004 to the level important for both labour market
in Poland and countries receiving our émigrés (mainly Great Britain and Ireland). There are different
estimates of the actual size and duration of outward migrations since accession. If we take as the
most reliable (probably rather conservative) estimate of the Centre for Migrations Research of
Universtity of Warsaw (Okólski 2006) we arrive at 3% of labour force, that is a already substantial
size. Moreover, double of that may still emigrate. This large leakage of labour force already affects
domestic labour market, especially that migrants are relatively better educated than the population on
average5 (Kaczmarczyk 2006). This is one of the major reasons of increasing shortages of skilled
workers as perceived by enterprises. For instance, according to the National Bank of Poland survey
of enterprises, as of first quarter of 2007, firms reported the shortage of skilled labour as the second
major barrier to growth while this barrier was perceived among the least important only a year
earlier6. Another phenomenon observed at the labour market in Poland that may be hypothetically
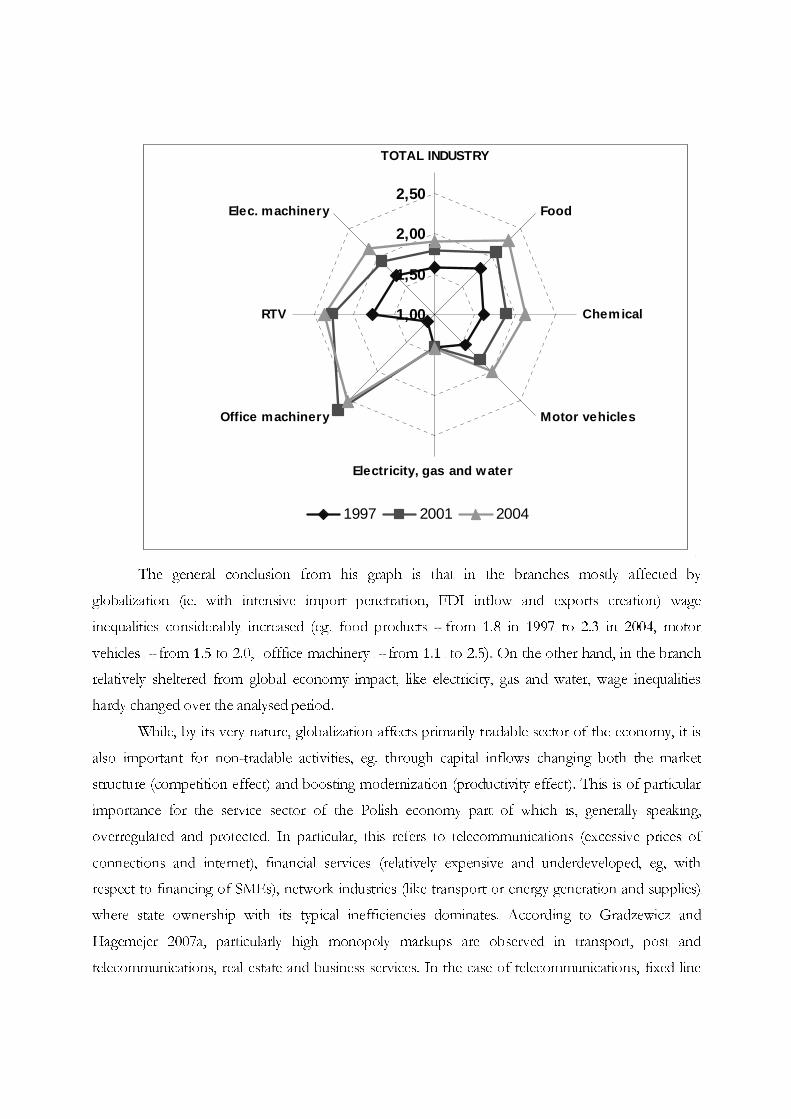
attributed to globalization is increasing wage inequalities been skilled and unskilled workers. Figure 1
illustrates how the ratio of skilled to unskilled wage changed in some branches over the period 1997
– 2004.
Figure 1 Skilled to unskilled wage ratio, 1997 - 2004
4 Unemployment rate is still relatively high in Poland (about 13% by the end of 2006) even if it has been decreasing fast over the last quarters (almost 17% by the end of 2005). 5 However, this author clearly states that there is no ground for declaring “exodus” of highly skilled specialists or “brain drain” as sometimes proclaimed in public discussion. 6 It was a barrier for 10.7% of the firms surveyed as of the first quarter of 2007 while only 1.8% reported this problem in the first quarter of 2006.
1,00
1,50
2,00
2,50
TOTAL INDUSTRY
Food
Chemical
Motor vehicles
Electricity, gas and water
Office machinery
RTV
Elec. machinery
1997 2001 2004
The general conclusion from his graph is that in the branches mostly affected by
globalization (ie. with intensive import penetration, FDI inflow and exports creation) wage
inequalities considerably increased (eg. food products - from 1.8 in 1997 to 2.3 in 2004, motor
vehicles - from 1.5 to 2.0, offfice machinery - from 1.1 to 2.5). On the other hand, in the branch
relatively sheltered from global economy impact, like electricity, gas and water, wage inequalities
hardy changed over the analysed period.
While, by its very nature, globalization affects primarily tradable sector of the economy, it is
also important for non-tradable activities, eg. through capital inflows changing both the market
structure (competition effect) and boosting modernization (productivity effect). This is of particular
importance for the service sector of the Polish economy part of which is, generally speaking,
overregulated and protected. In particular, this refers to telecommunications (excessive prices of
connections and internet), financial services (relatively expensive and underdeveloped, eg, with
respect to financing of SMEs), network industries (like transport or energy generation and supplies)
where state ownership with its typical inefficiencies dominates. According to Gradzewicz and
Hagemejer 2007a, particularly high monopoly markups are observed in transport, post and
telecommunications, real estate and business services. In the case of telecommunications, fixed line
telecom market is highly monopolized – in 2005 the incumbent operator, Polish Telecom, had a 85
percent market share. The mobile segment is operated by an oligopoly of three firms. According to
the UKE 2006 (telecom regulator) report, the costs of total monthly usage for an average retail
customer of fixed line telephony were the 6th highest in the enlarged EU in 2005. Similarly, mobile
phones were the 2nd most expensive among selected 13 EU countries. High monopoly markups lead
to inefficient level of service provision – e.g. Poland had the 2nd lowest rate of broadband internet
penetration7 in the EU-25 in 2005 .
3. Simulations of effects of globalization on Poland’s economy
3.1. Modeling approach
The impact of the globalization on the behaviour of the Polish economy is analyzed using the
Computable General Equilibrium model (see Appendix for a short description, for model details also
see Gradzewicz, Griffin, Żółkiewski, 2006). Since the simulated globalization shocks (to be defined
below) are expected to have long-run consequences, the authors decided to assess only long-term
impact of globalization. Starting from the basic comparative static version of the model, the long-
run has been modelled by introduction, in a simplified way, of long-run changes of capital supply.
The following two step procedure has been used to calculate the long run response of the economy
to the globalization shocks, taking into account capital accumulation. First, effects of globalization
have been calculated subject to fixed capital stock constraint. In the second step (period), the
investment dynamics from the first step was used to calculate the resulting long run response of
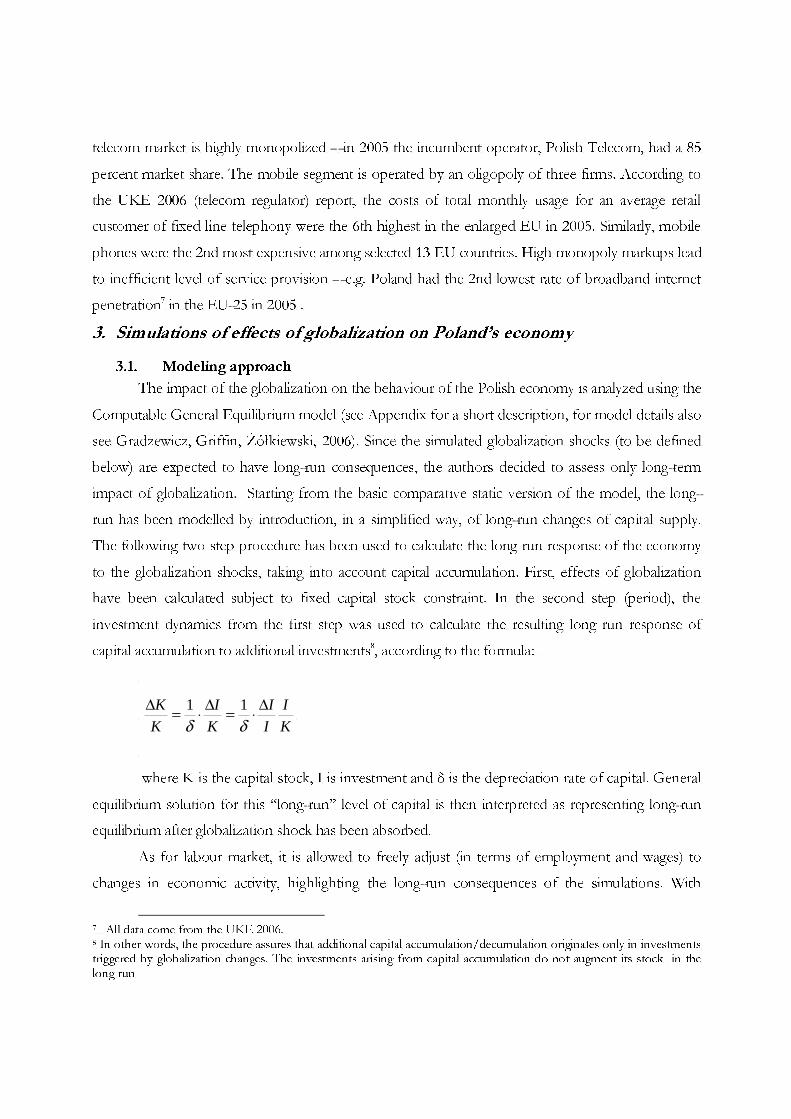
capital accumulation to additional investments8, according to the formula:
K
I
I
I
K
I
K
K ∆⋅=∆⋅=∆δδ11
where K is the capital stock, I is investment and δ is the depreciation rate of capital. General
equilibrium solution for this “long-run” level of capital is then interpreted as representing long-run
equilibrium after globalization shock has been absorbed.
As for labour market, it is allowed to freely adjust (in terms of employment and wages) to
changes in economic activity, highlighting the long-run consequences of the simulations. With
7 All data come from the UKE 2006. 8 In other words, the procedure assures that additional capital accumulation/decumulation originates only in investments triggered by globalization changes. The investments arising from capital accumulation do not augment its stock in the long run
respect to the product market, the model has imperfect competition features. According to the
findings of Gradzewicz and Hagemejer (2007b), who investigate monopolistic markups and
economies of scale, Polish economy exhibits significant deviations from perfect competition.
Following the empirical evidence, authors assumed that in case of most industries, companies are
operating under Bertrand oligopoly with scale economies stemming from fixed costs of production.
Additionally, authors introduced firm-level product differentiation, which is based on Dixit-Stiglitz
1977 love-for-variety formulation. Initial markups and the number of firms in the model are
calibrated using results of Gradzewicz and Hagemejer 2007a.
3.2. Assumptions of the globalization simulations
In our simulations, we distinguish four channels of globalization’s impact on the Poland’s
economy:
− Trade liberalization,
− Productivity shock,
− Migrations of labour
− Liberalization of services
Merchandise trade liberalization is assumed to have a direct effect on prices of imported
goods. Liberalization of trade with the EU involves removal of only non-tariff barriers (except
agriculture), because most of the tariffs for manufactured goods are effectively zero since 2000. For
non-EU imports, the scope of liberalization due to both completing of the Urugway Round and
future commitments in the Doha Round of the WTO is higher. Therefore it is assumed that prices
of imports from the EU go down by 2.5 percent, while prices of imports from the rest of the world
fall9 by 10 percent. It is also assumed that due to liberalization of EU imports from the rest of the
world prices of goods imported from to Poland the EU fall by 1 percent.
In our simulations we assume that an increased foreign direct investment inflow combined
with a surge in imports increase the total factor productivity. The overall TFP change in the
economy increases by 1 percent, however, the exact size of change in a given sector is proportional
to the relation of FDI inflow to the sector’s production.
Opening of most of the EU-15 labour markets to workers from new member states (entering
the EU in mid-2004) triggered an intense outflow of labour force from Poland (especially into the
9 For instance, the price of the basket of goods mostly affected by globalization (mostly, clothes, shoes, electronics and computer equipment) fall over 2006 by about 7% (over 2005 – 2006, by about 12%).

United Kingdom), mainly due to substantial wage differentials. The size of the migration from
Poland is estimated between 0.5-0.6 million workers (Okólski 2006), which constitutes over 3% of
labour force. This phenomenon is apparent especially among skilled people, which allow the authors
to assume that globalization triggers a 2% decrease of in the number of people with tertiary and
secondary education. Part of the income earned abroad by migrating workers is transferred back to
the home country. Such remittances amount to roughly 12 bilion PLN (about 1.2% of GDP)
according to official balance of payment statistics (official private foreign transfer statistics report a 3
bilion PLN inflow in the 1st quarter of the 2006 alone). It is assumed that these transfers affect only
households where members are assumed to migrate (employees and self-employed). The transferred
amounts are distributed among different types of households according to their proportion in the
number of people migrating.
Liberalization of trade in services is in many cases different from merchandise trade
liberalization. It entails the establishment of service providing enterprises in the host country that
directly compete with incumbent firms. Globalization is therefore assumed to cause an inflow of
firms into the service sectors (where entry was previously barred) that drives the profits to zero.
Profits are calibrated in such a way, that it requires a 20 percent increase in the number of firms for
the economy to reach this long run equilibrium. In other words, when entry barriers are removed,
20% more firms have to enter the market in order to reach the zero-profit equilibrium.
3.3. Results of simulations
3.3.1. Trade liberalization
Trade liberalization is expected to have a downward effect on prices of imported goods.
Manufactured imports from the rest of the world will experience deeper price reduction than imports
from the EU, since the former is believed to be still subject to more trade barriers (both tariffs and
non-tariff barriers). At the same time, globalization is expected to lower the price level of
manufactured goods in the EU.
The drop in import prices directly affects consumption of imported goods, both final and
intermediate. The total increase in imports is 3.7% (macroeconomic results for all simulations are
given in Table 11). Also total exports increase (by 1.9%) since lower costs of production, due to less
expensive imported intermediate inputs, makes exporters more competitive. With a domestic
demand increase by about 1.5% (consumption by 1.4% and investment by 1.6% - see table 11) trade
liberalization results in an rise of GDP by 0.6% and 0.2% in employment.
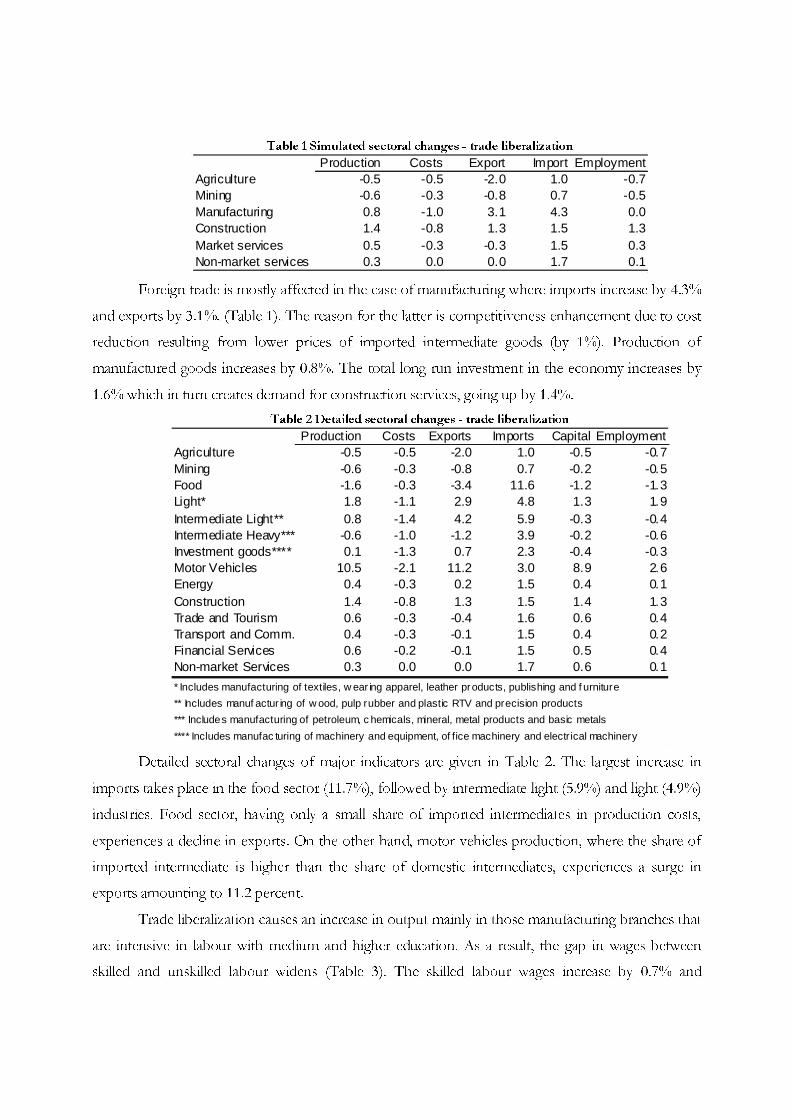
Table 1 Simulated sectoral changes - trade liberalization
Production Costs Export Import EmploymentAgriculture -0.5 -0.5 -2.0 1.0 -0.7Mining -0.6 -0.3 -0.8 0.7 -0.5Manufacturing 0.8 -1.0 3.1 4.3 0.0Construction 1.4 -0.8 1.3 1.5 1.3Market services 0.5 -0.3 -0.3 1.5 0.3Non-market services 0.3 0.0 0.0 1.7 0.1
Foreign trade is mostly affected in the case of manufacturing where imports increase by 4.3%
and exports by 3.1%. (Table 1). The reason for the latter is competitiveness enhancement due to cost
reduction resulting from lower prices of imported intermediate goods (by 1%). Production of
manufactured goods increases by 0.8%. The total long run investment in the economy increases by
1.6% which in turn creates demand for construction services, going up by 1.4%.
Table 2 Detailed sectoral changes - trade liberalization
Product ion Costs Exports Imports Capital EmploymentAgriculture -0.5 -0.5 -2.0 1.0 -0.5 -0.7Mining -0.6 -0.3 -0.8 0.7 -0.2 -0.5Food -1.6 -0.3 -3.4 11.6 -1.2 -1.3Light* 1.8 -1.1 2.9 4.8 1.3 1.9Intermediate Light** 0.8 -1.4 4.2 5.9 -0.3 -0.4Intermediate Heavy*** -0.6 -1.0 -1.2 3.9 -0.2 -0.6Investment goods**** 0.1 -1.3 0.7 2.3 -0.4 -0.3Motor Vehicles 10.5 -2.1 11.2 3.0 8.9 2.6Energy 0.4 -0.3 0.2 1.5 0.4 0.1Construction 1.4 -0.8 1.3 1.5 1.4 1.3Trade and Tourism 0.6 -0.3 -0.4 1.6 0.6 0.4Transport and Comm. 0.4 -0.3 -0.1 1.5 0.4 0.2Financial Services 0.6 -0.2 -0.1 1.5 0.5 0.4Non-market Services 0.3 0.0 0.0 1.7 0.6 0.1
* Includes manufacturing of textiles, w ear ing apparel, leather products, publishing and f urniture
** Includes manuf actur ing of w ood, pulp rubber and plastic RTV and precision products
*** Includes manufacturing of petroleum, c hemicals, mineral, metal products and basic metals
**** Includes manufac turing of machinery and equipment, of fice machinery and electr ical machinery
Detailed sectoral changes of major indicators are given in Table 2. The largest increase in
imports takes place in the food sector (11.7%), followed by intermediate light (5.9%) and light (4.9%)
industries. Food sector, having only a small share of imported intermediates in production costs,
experiences a decline in exports. On the other hand, motor vehicles production, where the share of
imported intermediate is higher than the share of domestic intermediates, experiences a surge in
exports amounting to 11.2 percent.
Trade liberalization causes an increase in output mainly in those manufacturing branches that
are intensive in labour with medium and higher education. As a result, the gap in wages between
skilled and unskilled labour widens (Table 3). The skilled labour wages increase by 0.7% and

unskilled labour wages increase by only 0.4%. At the same time employment of skilled labour
increases by 0.2-0.3% (high and medium education respectively), while employment of unskilled
labour drops by 0.2%. Correspondingly, the participation rate of skilled labour force goes up by 0.14-
0.20% and that of unskilled labour drops by 0.14%. The total effect on unemployment is -0.03 pp.
Table 3 Labour market - trade liberalization
High Medium BasicEmployment 0.2 0.3 -0.2 0.2Wages 0.7 0.7 0.4 0.7Part icipation 0.1 0.2 -0.1 0.2
TotalEducation
Trade liberalization shifts also the income position of different groups of households10. All
households benefit from the trade liberalization, as their disposable incomes rise, but this growth is
more pronounced in non-poor households (4.5% in nominal terms) than in poor ones (3.2%). This
shift is mainly due to the differences in wages and employment of different labour types. Poorer
households supply mainly less-educated labour, which meets lower demand and is paid less than
better educated labour.
3.3.2. Productivity increase
In reaction to an increase of productivity of labour and capital by an average of 1% (resulting
from increased FDI inflow and increased imports of technologically advanced goods from EU),
GDP is higher by 3.4% in the long run. Considerable increase of GDP is, in part, a consequence of
additional capital accumulation (capital is by 3.4% higher in the long-run), which results from the
larger investment. Expansion of the economy and an increase of output shift the labour demand
curve – in consequence employment level is higher by 1%. Increased labour demand, combined with
an increase of labour productivity boosts wages, which are 3.3% higher in the long-run. Relative
abundance of capital pushes its price down by 0.35%. Increased income from labour and renting
capital to production activities results in a growth of disposable income of households and an 3%
increase of consumption. Increased wages and overall positive development of the labour market
induces inactive people to enter the market, which results in an increase of the participation rate.
However, this effect is reduced to some extent by an adverse income effect, being a consequence of
higher wealth.
10 Although there are ten types of households in our model, we will focus here only on poor (two first percentile groups) versus non-poor households.
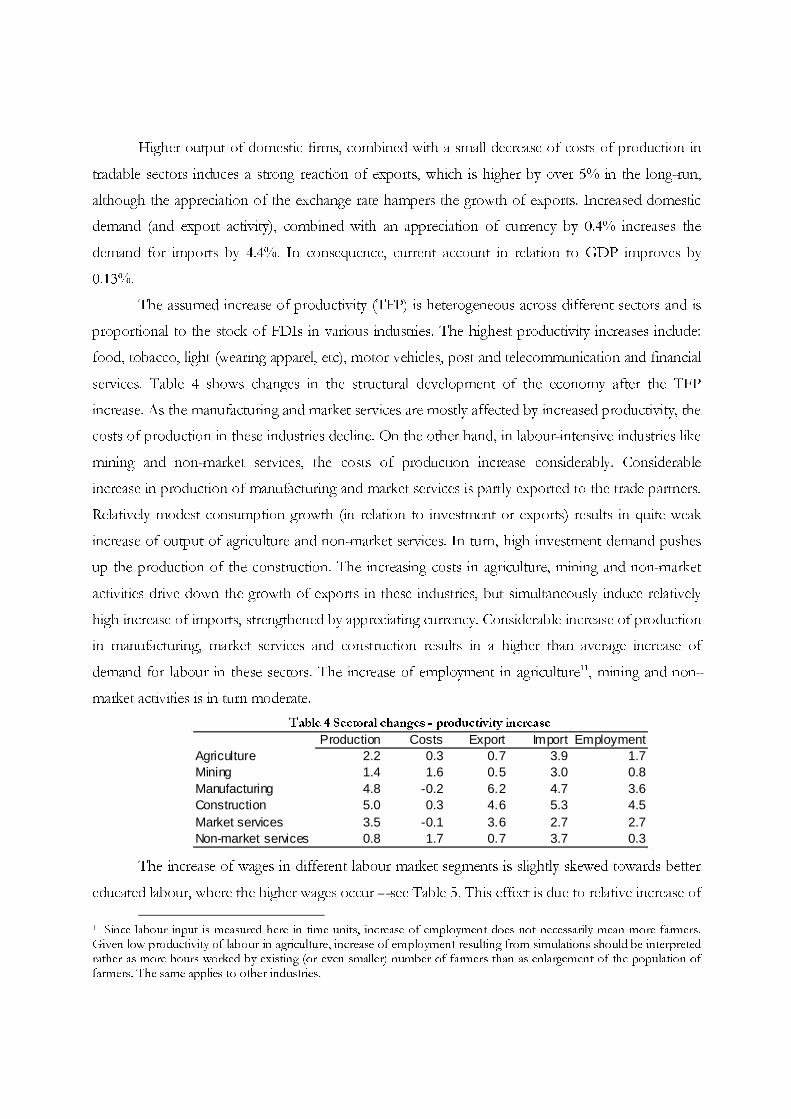
Higher output of domestic firms, combined with a small decrease of costs of production in
tradable sectors induces a strong reaction of exports, which is higher by over 5% in the long-run,
although the appreciation of the exchange rate hampers the growth of exports. Increased domestic
demand (and export activity), combined with an appreciation of currency by 0.4% increases the
demand for imports by 4.4%. In consequence, current account in relation to GDP improves by
0.13%.
The assumed increase of productivity (TFP) is heterogeneous across different sectors and is
proportional to the stock of FDIs in various industries. The highest productivity increases include:
food, tobacco, light (wearing apparel, etc), motor vehicles, post and telecommunication and financial
services. Table 4 shows changes in the structural development of the economy after the TFP
increase. As the manufacturing and market services are mostly affected by increased productivity, the
costs of production in these industries decline. On the other hand, in labour-intensive industries like
mining and non-market services, the costs of production increase considerably. Considerable
increase in production of manufacturing and market services is partly exported to the trade partners.
Relatively modest consumption growth (in relation to investment or exports) results in quite weak
increase of output of agriculture and non-market services. In turn, high investment demand pushes
up the production of the construction. The increasing costs in agriculture, mining and non-market
activities drive down the growth of exports in these industries, but simultaneously induce relatively
high increase of imports, strengthened by appreciating currency. Considerable increase of production
in manufacturing, market services and construction results in a higher than average increase of
demand for labour in these sectors. The increase of employment in agriculture11, mining and non-
market activities is in turn moderate.
Table 4 Sectoral changes - productivity increase
Production Costs Export Import EmploymentAgriculture 2.2 0.3 0.7 3.9 1.7Mining 1.4 1.6 0.5 3.0 0.8Manufacturing 4.8 -0.2 6.2 4.7 3.6Construction 5.0 0.3 4.6 5.3 4.5Market services 3.5 -0.1 3.6 2.7 2.7Non-market services 0.8 1.7 0.7 3.7 0.3
The increase of wages in different labour market segments is slightly skewed towards better
educated labour, where the higher wages occur – see Table 5. This effect is due to relative increase of
11 Since labour input is measured here in time units, increase of employment does not necessarily mean more farmers. Given low productivity of labour in agriculture, increase of employment resulting from simulations should be interpreted rather as more hours worked by existing (or even smaller) number of farmers than as enlargement of the population of farmers. The same applies to other industries.
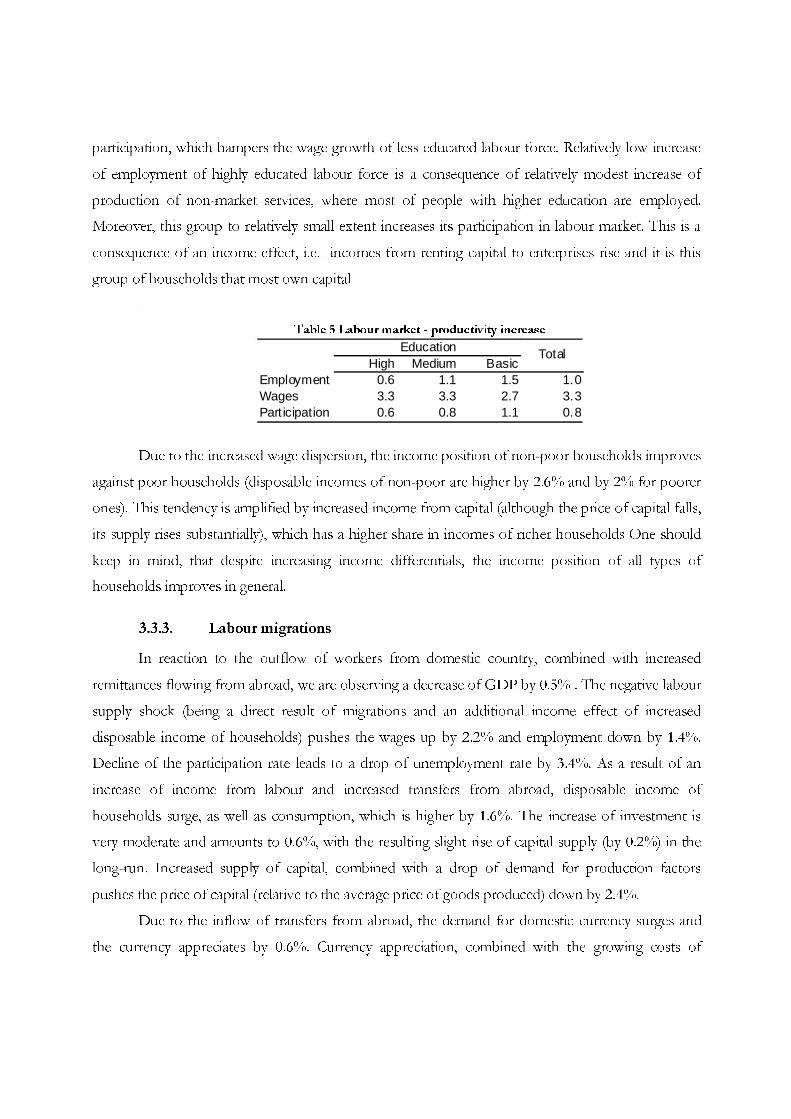
participation, which hampers the wage growth of less educated labour force. Relatively low increase
of employment of highly educated labour force is a consequence of relatively modest increase of
production of non-market services, where most of people with higher education are employed.
Moreover, this group to relatively small extent increases its participation in labour market. This is a
consequence of an income effect, i.e. incomes from renting capital to enterprises rise and it is this
group of households that most own capital
Table 5 Labour market - productivity increase
High Medium BasicEmployment 0.6 1.1 1.5 1.0Wages 3.3 3.3 2.7 3.3Part icipation 0.6 0.8 1.1 0.8
TotalEducation
Due to the increased wage dispersion, the income position of non-poor households improves
against poor households (disposable incomes of non-poor are higher by 2.6% and by 2% for poorer
ones). This tendency is amplified by increased income from capital (although the price of capital falls,
its supply rises substantially), which has a higher share in incomes of richer households One should
keep in mind, that despite increasing income differentials, the income position of all types of
households improves in general.
3.3.3. Labour migrations
In reaction to the outflow of workers from domestic country, combined with increased
remittances flowing from abroad, we are observing a decrease of GDP by 0.5% . The negative labour
supply shock (being a direct result of migrations and an additional income effect of increased
disposable income of households) pushes the wages up by 2.2% and employment down by 1.4%.
Decline of the participation rate leads to a drop of unemployment rate by 3.4%. As a result of an
increase of income from labour and increased transfers from abroad, disposable income of
households surge, as well as consumption, which is higher by 1.6%. The increase of investment is
very moderate and amounts to 0.6%, with the resulting slight rise of capital supply (by 0.2%) in the
long-run. Increased supply of capital, combined with a drop of demand for production factors
pushes the price of capital (relative to the average price of goods produced) down by 2.4%.
Due to the inflow of transfers from abroad, the demand for domestic currency surges and
the currency appreciates by 0.6%. Currency appreciation, combined with the growing costs of
production in tradable sectors lead to a drop of exports by 5.9%. That is to a large extent explanation
for almost no change of imports even if domestic demand increases. As a consequence of drop in
exports and stable imports, the current account to GDP ratio declines by 0.24%.
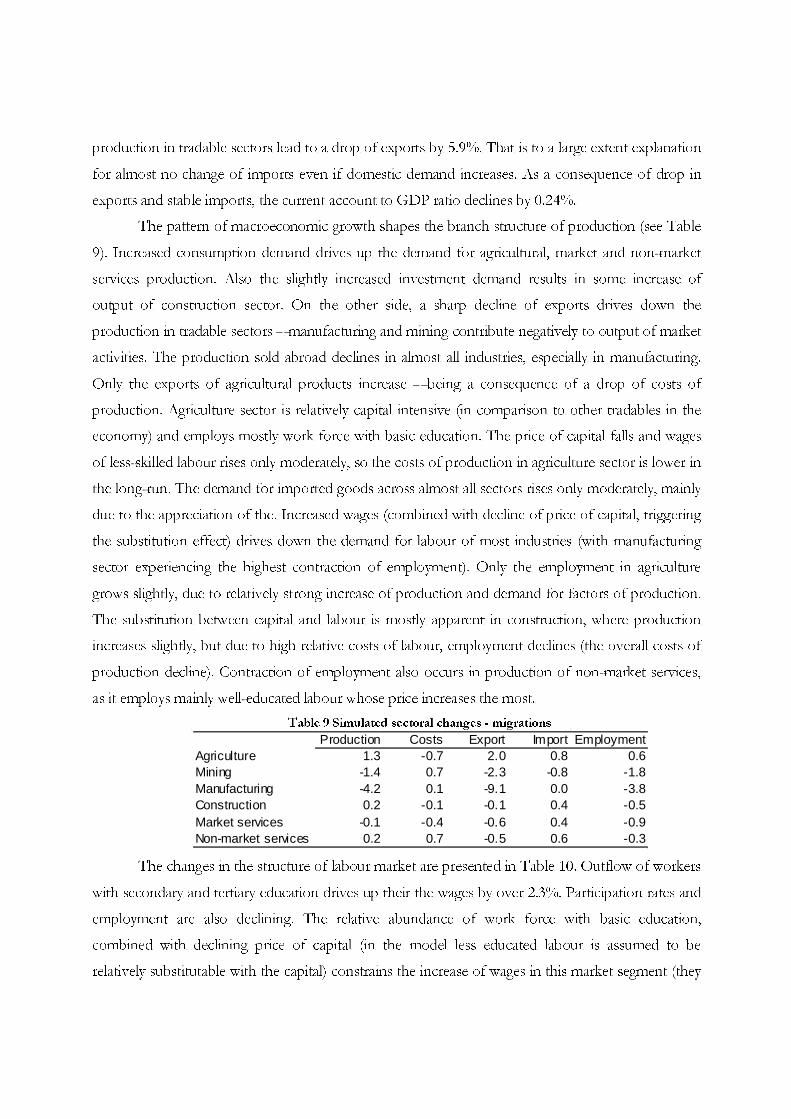
The pattern of macroeconomic growth shapes the branch structure of production (see Table
9). Increased consumption demand drives up the demand for agricultural, market and non-market
services production. Also the slightly increased investment demand results in some increase of
output of construction sector. On the other side, a sharp decline of exports drives down the
production in tradable sectors – manufacturing and mining contribute negatively to output of market
activities. The production sold abroad declines in almost all industries, especially in manufacturing.
Only the exports of agricultural products increase – being a consequence of a drop of costs of
production. Agriculture sector is relatively capital intensive (in comparison to other tradables in the
economy) and employs mostly work force with basic education. The price of capital falls and wages
of less-skilled labour rises only moderately, so the costs of production in agriculture sector is lower in
the long-run. The demand for imported goods across almost all sectors rises only moderately, mainly
due to the appreciation of the. Increased wages (combined with decline of price of capital, triggering
the substitution effect) drives down the demand for labour of most industries (with manufacturing
sector experiencing the highest contraction of employment). Only the employment in agriculture
grows slightly, due to relatively strong increase of production and demand for factors of production.
The substitution between capital and labour is mostly apparent in construction, where production
increases slightly, but due to high relative costs of labour, employment declines (the overall costs of
production decline). Contraction of employment also occurs in production of non-market services,
as it employs mainly well-educated labour whose price increases the most.
Table 9 Simulated sectoral changes - migrations
Production Costs Export Import EmploymentAgriculture 1.3 -0.7 2.0 0.8 0.6Mining -1.4 0.7 -2.3 -0.8 -1.8Manufacturing -4.2 0.1 -9.1 0.0 -3.8Construction 0.2 -0.1 -0.1 0.4 -0.5Market services -0.1 -0.4 -0.6 0.4 -0.9Non-market services 0.2 0.7 -0.5 0.6 -0.3
The changes in the structure of labour market are presented in Table 10. Outflow of workers
with secondary and tertiary education drives up their the wages by over 2.3%. Participation rates and
employment are also declining. The relative abundance of work force with basic education,
combined with declining price of capital (in the model less educated labour is assumed to be
relatively substitutable with the capital) constrains the increase of wages in this market segment (they
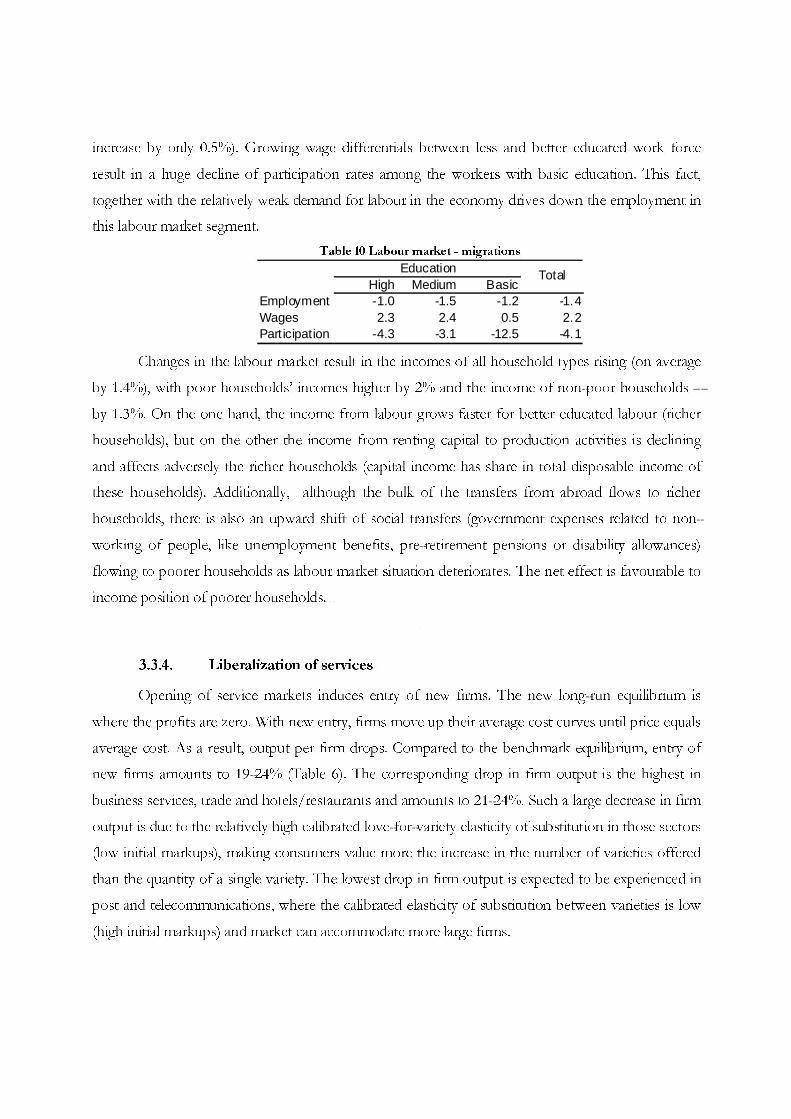
increase by only 0.5%). Growing wage differentials between less and better educated work force
result in a huge decline of participation rates among the workers with basic education. This fact,
together with the relatively weak demand for labour in the economy drives down the employment in
this labour market segment.
Table 10 Labour market - migrations
High Medium BasicEmployment -1.0 -1.5 -1.2 -1.4Wages 2.3 2.4 0.5 2.2Part icipation -4.3 -3.1 -12.5 -4.1
TotalEducation
Changes in the labour market result in the incomes of all household types rising (on average
by 1.4%), with poor households’ incomes higher by 2% and the income of non-poor households –
by 1.3%. On the one hand, the income from labour grows faster for better educated labour (richer
households), but on the other the income from renting capital to production activities is declining
and affects adversely the richer households (capital income has share in total disposable income of
these households). Additionally, although the bulk of the transfers from abroad flows to richer
households, there is also an upward shift of social transfers (government expenses related to non-
working of people, like unemployment benefits, pre-retirement pensions or disability allowances)
flowing to poorer households as labour market situation deteriorates. The net effect is favourable to
income position of poorer households.
3.3.4. Liberalization of services
Opening of service markets induces entry of new firms. The new long-run equilibrium is
where the profits are zero. With new entry, firms move up their average cost curves until price equals
average cost. As a result, output per firm drops. Compared to the benchmark equilibrium, entry of
new firms amounts to 19-24% (Table 6). The corresponding drop in firm output is the highest in
business services, trade and hotels/restaurants and amounts to 21-24%. Such a large decrease in firm
output is due to the relatively high calibrated love-for-variety elasticity of substitution in those sectors
(low initial markups), making consumers value more the increase in the number of varieties offered
than the quantity of a single variety. The lowest drop in firm output is expected to be experienced in
post and telecommunications, where the calibrated elasticity of substitution between varieties is low
(high initial markups) and market can accommodate more large firms.
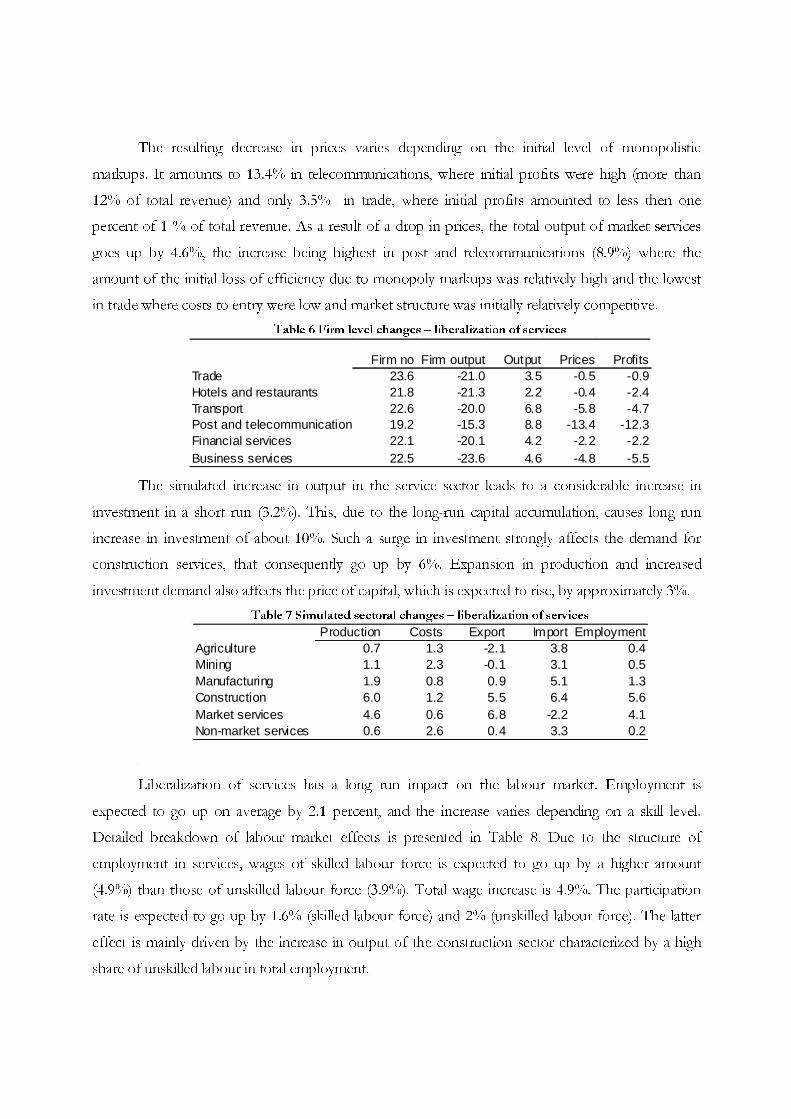
The resulting decrease in prices varies depending on the initial level of monopolistic
markups. It amounts to 13.4% in telecommunications, where initial profits were high (more than
12% of total revenue) and only 3.5% in trade, where initial profits amounted to less then one
percent of 1 % of total revenue. As a result of a drop in prices, the total output of market services
goes up by 4.6%, the increase being highest in post and telecommunications (8.9%) where the
amount of the initial loss of efficiency due to monopoly markups was relatively high and the lowest
in trade where costs to entry were low and market structure was initially relatively competitive.
Table 6 Firm level changes – liberalization of services
Firm no Firm output Output Prices ProfitsTrade 23.6 -21.0 3.5 -0.5 -0.9Hotels and restaurants 21.8 -21.3 2.2 -0.4 -2.4Transport 22.6 -20.0 6.8 -5.8 -4.7Post and telecommunications 19.2 -15.3 8.8 -13.4 -12.3Financial services 22.1 -20.1 4.2 -2.2 -2.2Business services 22.5 -23.6 4.6 -4.8 -5.5
The simulated increase in output in the service sector leads to a considerable increase in
investment in a short run (3.2%). This, due to the long-run capital accumulation, causes long run
increase in investment of about 10%. Such a surge in investment strongly affects the demand for
construction services, that consequently go up by 6%. Expansion in production and increased
investment demand also affects the price of capital, which is expected to rise, by approximately 3%.
Table 7 Simulated sectoral changes – liberalization of services
Production Costs Export Import EmploymentAgriculture 0.7 1.3 -2.1 3.8 0.4Mining 1.1 2.3 -0.1 3.1 0.5Manufacturing 1.9 0.8 0.9 5.1 1.3Construction 6.0 1.2 5.5 6.4 5.6Market services 4.6 0.6 6.8 -2.2 4.1Non-market services 0.6 2.6 0.4 3.3 0.2
Liberalization of services has a long run impact on the labour market. Employment is
expected to go up on average by 2.1 percent, and the increase varies depending on a skill level.
Detailed breakdown of labour market effects is presented in Table 8. Due to the structure of
employment in services, wages of skilled labour force is expected to go up by a higher amount
(4.9%) than those of unskilled labour force (3.9%). Total wage increase is 4.9%. The participation
rate is expected to go up by 1.6% (skilled labour force) and 2% (unskilled labour force). The latter
effect is mainly driven by the increase in output of the construction sector characterized by a high
share of unskilled labour in total employment.
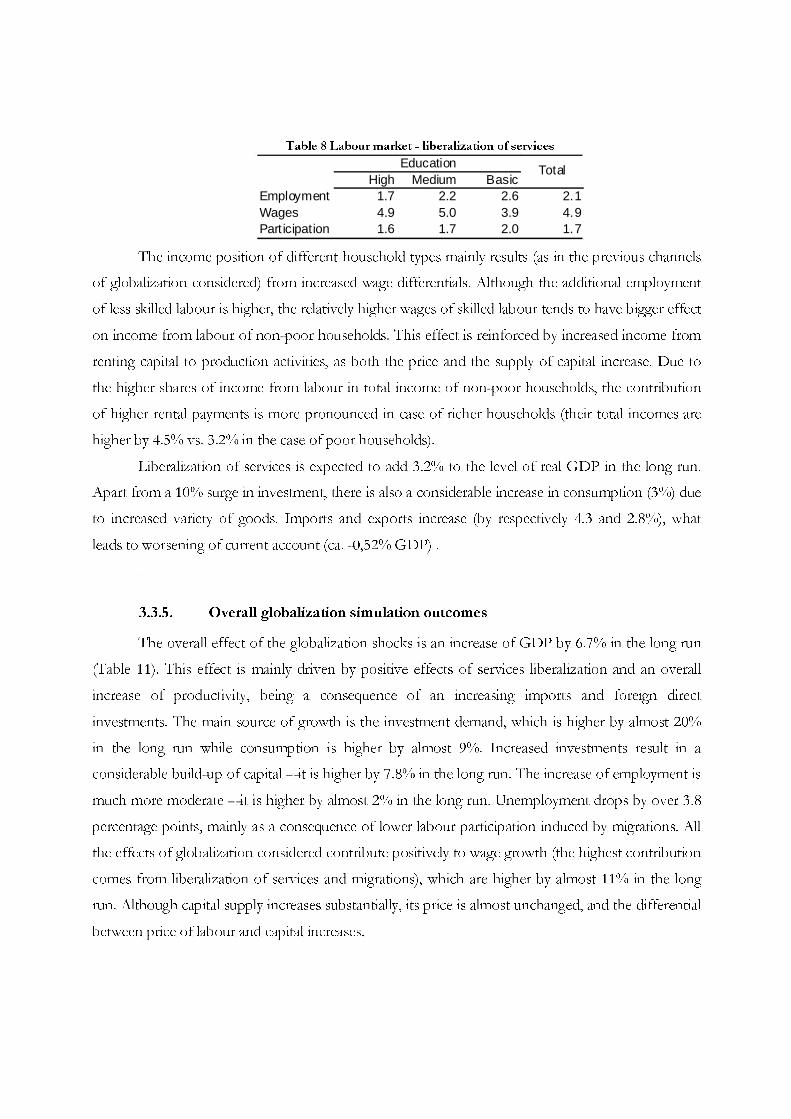
Table 8 Labour market - liberalization of services
High Medium BasicEmployment 1.7 2.2 2.6 2.1Wages 4.9 5.0 3.9 4.9Part icipation 1.6 1.7 2.0 1.7
TotalEducation
The income position of different household types mainly results (as in the previous channels
of globalization considered) from increased wage differentials. Although the additional employment
of less skilled labour is higher, the relatively higher wages of skilled labour tends to have bigger effect
on income from labour of non-poor households. This effect is reinforced by increased income from
renting capital to production activities, as both the price and the supply of capital increase. Due to
the higher shares of income from labour in total income of non-poor households, the contribution
of higher rental payments is more pronounced in case of richer households (their total incomes are
higher by 4.5% vs. 3.2% in the case of poor households).
Liberalization of services is expected to add 3.2% to the level of real GDP in the long run.
Apart from a 10% surge in investment, there is also a considerable increase in consumption (3%) due
to increased variety of goods. Imports and exports increase (by respectively 4.3 and 2.8%), what
leads to worsening of current account (ca. -0,52% GDP) .
3.3.5. Overall globalization simulation outcomes
The overall effect of the globalization shocks is an increase of GDP by 6.7% in the long run
(Table 11). This effect is mainly driven by positive effects of services liberalization and an overall
increase of productivity, being a consequence of an increasing imports and foreign direct
investments. The main source of growth is the investment demand, which is higher by almost 20%
in the long run while consumption is higher by almost 9%. Increased investments result in a
considerable build-up of capital – it is higher by 7.8% in the long run. The increase of employment is
much more moderate – it is higher by almost 2% in the long run. Unemployment drops by over 3.8
percentage points, mainly as a consequence of lower labour participation induced by migrations. All
the effects of globalization considered contribute positively to wage growth (the highest contribution
comes from liberalization of services and migrations), which are higher by almost 11% in the long
run. Although capital supply increases substantially, its price is almost unchanged, and the differential
between price of labour and capital increases.
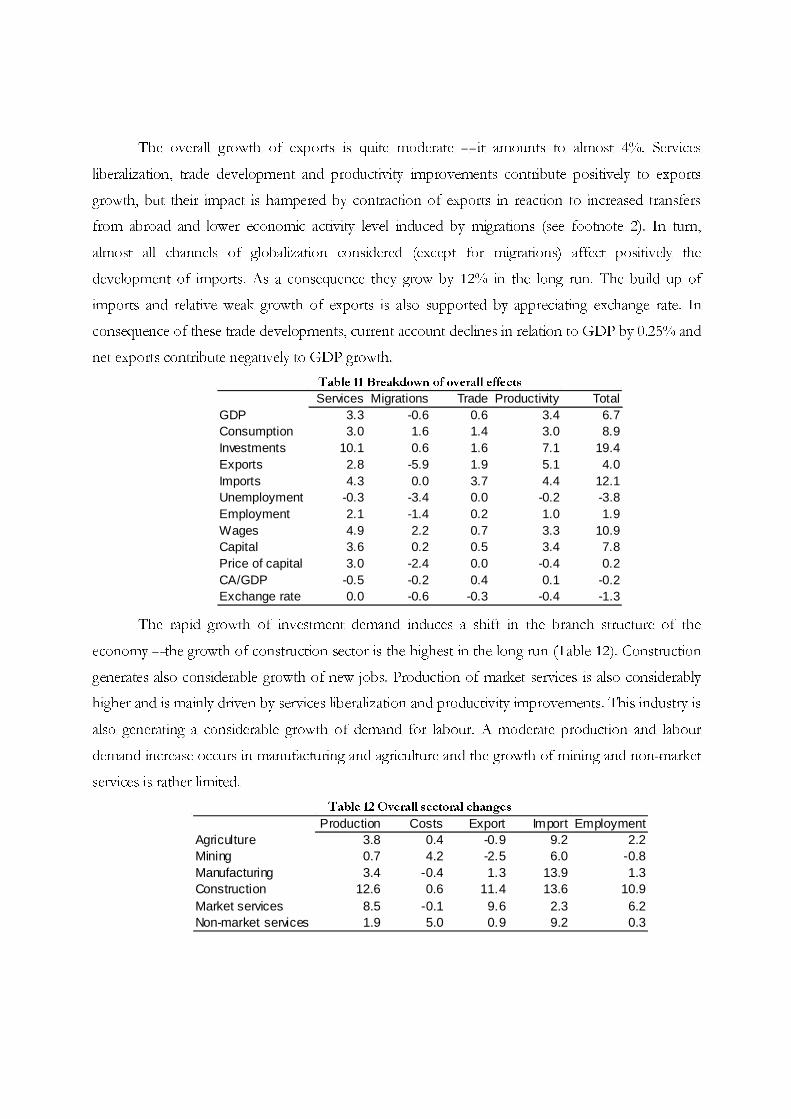
The overall growth of exports is quite moderate – it amounts to almost 4%. Services
liberalization, trade development and productivity improvements contribute positively to exports
growth, but their impact is hampered by contraction of exports in reaction to increased transfers
from abroad and lower economic activity level induced by migrations (see footnote 2). In turn,
almost all channels of globalization considered (except for migrations) affect positively the
development of imports. As a consequence they grow by 12% in the long run. The build up of
imports and relative weak growth of exports is also supported by appreciating exchange rate. In
consequence of these trade developments, current account declines in relation to GDP by 0.25% and
net exports contribute negatively to GDP growth.
Table 11 Breakdown of overall effects
Services Migrations Trade Productivity TotalGDP 3.3 -0.6 0.6 3.4 6.7Consumption 3.0 1.6 1.4 3.0 8.9Investments 10.1 0.6 1.6 7.1 19.4Exports 2.8 -5.9 1.9 5.1 4.0Imports 4.3 0.0 3.7 4.4 12.1Unemployment -0.3 -3.4 0.0 -0.2 -3.8Employment 2.1 -1.4 0.2 1.0 1.9Wages 4.9 2.2 0.7 3.3 10.9Capital 3.6 0.2 0.5 3.4 7.8Price of capital 3.0 -2.4 0.0 -0.4 0.2CA/GDP -0.5 -0.2 0.4 0.1 -0.2Exchange rate 0.0 -0.6 -0.3 -0.4 -1.3
The rapid growth of investment demand induces a shift in the branch structure of the
economy – the growth of construction sector is the highest in the long run (Table 12). Construction
generates also considerable growth of new jobs. Production of market services is also considerably
higher and is mainly driven by services liberalization and productivity improvements. This industry is
also generating a considerable growth of demand for labour. A moderate production and labour
demand increase occurs in manufacturing and agriculture and the growth of mining and non-market
services is rather limited.
Table 12 Overall sectoral changes
Production Costs Export Import EmploymentAgriculture 3.8 0.4 -0.9 9.2 2.2Mining 0.7 4.2 -2.5 6.0 -0.8Manufacturing 3.4 -0.4 1.3 13.9 1.3Construction 12.6 0.6 11.4 13.6 10.9Market services 8.5 -0.1 9.6 2.3 6.2Non-market services 1.9 5.0 0.9 9.2 0.3
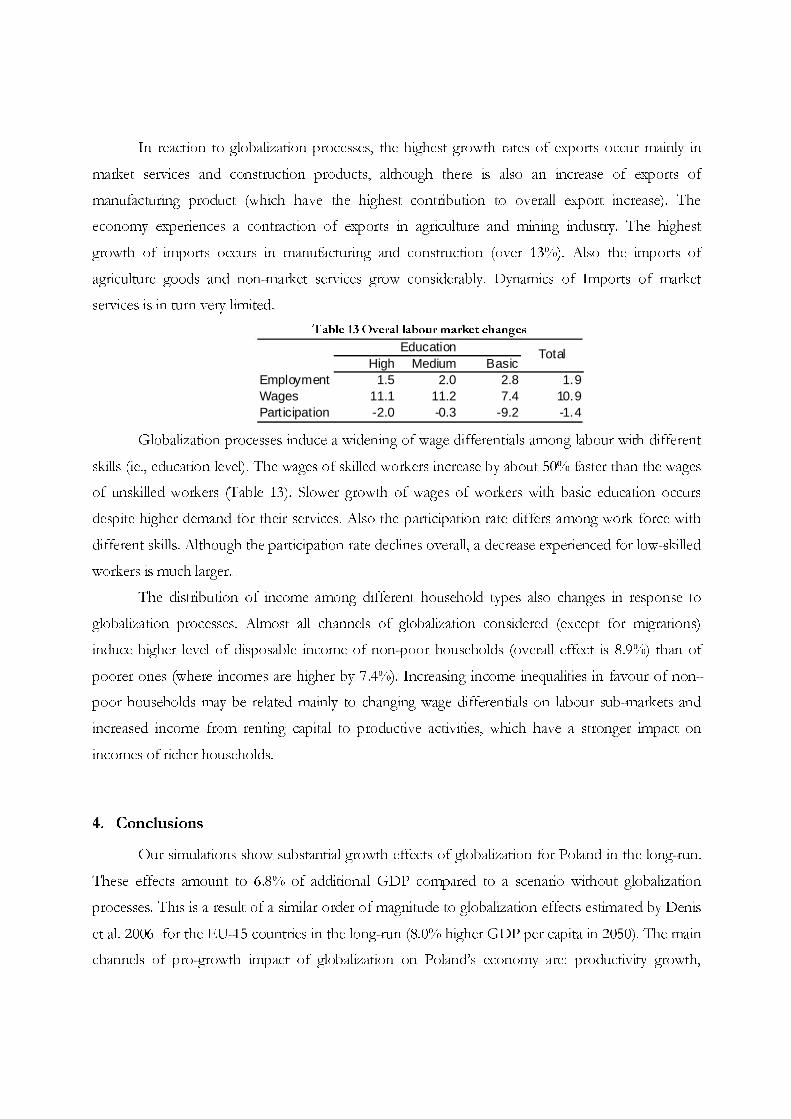
In reaction to globalization processes, the highest growth rates of exports occur mainly in
market services and construction products, although there is also an increase of exports of
manufacturing product (which have the highest contribution to overall export increase). The
economy experiences a contraction of exports in agriculture and mining industry. The highest
growth of imports occurs in manufacturing and construction (over 13%). Also the imports of
agriculture goods and non-market services grow considerably. Dynamics of Imports of market
services is in turn very limited.
Table 13 Overal labour market changes
High Medium BasicEmployment 1.5 2.0 2.8 1.9Wages 11.1 11.2 7.4 10.9Part icipation -2.0 -0.3 -9.2 -1.4
TotalEducation
Globalization processes induce a widening of wage differentials among labour with different
skills (ie., education level). The wages of skilled workers increase by about 50% faster than the wages
of unskilled workers (Table 13). Slower growth of wages of workers with basic education occurs
despite higher demand for their services. Also the participation rate differs among work force with
different skills. Although the participation rate declines overall, a decrease experienced for low-skilled
workers is much larger.
The distribution of income among different household types also changes in response to
globalization processes. Almost all channels of globalization considered (except for migrations)
induce higher level of disposable income of non-poor households (overall effect is 8.9%) than of
poorer ones (where incomes are higher by 7.4%). Increasing income inequalities in favour of non-
poor households may be related mainly to changing wage differentials on labour sub-markets and
increased income from renting capital to productive activities, which have a stronger impact on
incomes of richer households.
4. Conclusions
Our simulations show substantial growth effects of globalization for Poland in the long-run.
These effects amount to 6.8% of additional GDP compared to a scenario without globalization
processes. This is a result of a similar order of magnitude to globalization effects estimated by Denis
et al. 2006 for the EU-15 countries in the long-run (8.0% higher GDP per capita in 2050). The main
channels of pro-growth impact of globalization on Poland’s economy are: productivity growth,
triggered mainly by FDI inflow (3.4% of GDP) and pro-efficiency effects of liberalization of services
sector (3.3% of GDP). Globalization changes growth pattern in favour of investment (19.4% in the
long – run vs. 8.9% in case of consumption) what supports long-run growth. The propensity to
import of domestic agents increases (19.4 % of GDP in the long – run vs. 4.0 for exports) what is
also favourable to long-run growth as imports are an important channel of modernisation in Poland.
Globalization contributes positively to evolution of the labour market by additional growth of both
wages and employment (respectively, 10.9% and 1.9% in the long – run) and it leads to increasing
wage inequalities between high-skilled (11.1% over the base-run) and low-skilled (7.4% over the
base-run). The globalization processes turn out to be favourable to welfare of households (due to
globalization, their disposable income is in the long-run higher by 8.8%). However, together with
increasing wage inequalities globalization slightly deteriorates relative income position of poor
households as compared with the rest (respectively, 8.9% and 7.4% over the base-run). Relative well-
being of non-poor households increased because of increasing wage inequalities and increasing
capital income that is more important source of living for this group of households than for the
poor. As for the latter, the deterioration of their position is to some extent reduced by government
transfers.
If the results on long-run impact of globalization for EU-15, obtained in the above quoted
study of Denis et. al. 2006 were treated as the benchmark for our results, one might be surprised that
we produced the figures smaller than in this study. If pro-growth effects of globalization happen
mainly through FDIs and import channel creating productivity acceleration, one might expect that it
should have stronger impact for relatively poorer (comparing to EU-15) countries like Poland. We
find this hypothesis as plausible and treat our results as the lower bound for the long-run impact of
globalization on Poland’s economy. Our assessment of effects of globalization is rather conservative
since the following channels are not taken into account in our simulations First, we underestimate
trade creation effects of globalization for Poland since exports are modelled in a simplified way: they
are only supply-determined and are explained by relative prices changes only. Second, since our
model does not explain the general price level, we could not take into account the significant impact
(downward pressure) of globalization on inflation12. That results in smaller cost of stabilising
12 Allard 2006 estimates downward impact of globalization on inflation in Poland on ½ to 1 percentage point per year
since the middle of the 1990s.

inflation and in lower interest rates with eventual consequences for, first of all, investment and
potential output growth. Third, one of other prospective channels of impact of globalization on
Poland’s economy is further economic integration with Europe in the form of accession to the euro
area. As assessed by the National Bank of Poland (NBP 2004), the long-run effects of this process
are up to 0.4% additional GDP growth in the long-run. According to the authors of that report, if
this effect occurs the GDP in 2030 would be by 11.8% higher than in no-accession scenario. Taking
all these factors into account, we hypothesize that the prospective effects of globalization may be
larger for Poland that reported in this paper.
Bibliography
Allard, C. (2006), ‘Inflation in Poland: How Much Can Globalization Explain?’, Paper presented at The CEPR/ESI 10th
Annual Conference on 'Globalization and Monetary Policy' 1-2 September 2006, Warsaw (Hosted by the National
Bank of Poland)
Centrum Europejskie Natolin (2003), Korzyści i koszty członkostwa Polski w Unii Europejskiej (Benefits and costs of
Poland’s membership in the European Union), Warsaw.
Clarke, G.R.G. (2003), “The Effect of Entreprise Ownership and Foreign Competition on Internet Diffusion in the
Transition Economies’. International conference on “The ‘New Economy’ and Postsocialist Transition’, TIGER,
April 10-11, Warsaw, Poland. Conference materials.
Denis, C., Mc Morrow, K. and Röger, W. (2006), “Globalization: Trends, Issues and Macro Implications for the EU’,
European Commission, Directorate-General For Economic And Financial Affairs, Economic Papers No 254,
Brussels, Belgium.
Dixit, A. K., Stiglitz, J.E., (1977), Monopolistic competition and optimum product diversity, American Economic
Review, vol. 67, no. 3
Francois, J., van Meijl, H. and van Tongeren, F. (2005), ‘Trade liberalization in the Doha Development Round’,
Economic Policy 20 (42), 349–391.
Gradzewicz, M., Hagemejer, J., (2007a), ‘The impact of competition and business cycle on the behaviour of monopolistic
markups in the Polish economy’, Bank i Kredyt .National Bank of Poland’s Journal on Economics and Finance
2007 (forthcoming)
Gradzewicz, M., Hagemejer, J., (2007b), „Monopolistic markups and returns to scale in the Polish economy. Firm-level
analysis”, Ekonomista (forthcoming)
Gradzewicz, M., Griffin, P., Żółkiewski, Z., (2006), An empirical Recursive-Dynamic General Equilibrium Model of
Poland’s Economy, joint publication of the National Bank of Poland and the World Bank, Warsaw.
Hagemejer, J., Michalek, J., (2007), ‘Normy techniczne i sanitarne w handlu międzynarodowym. Ich znaczenie w
integracji Polski z Unią Europejską’, Warsaw University Publishing (forthcoming)

Hoffmann A.N., (2000), The Gains from Partial Completion of the Single Market,
Weltwirtschaftliches Archiv, 2000 no.4
IKCHZ (2006), “Inwestycje zagraniczne w Polsce. Raport roczny 2006’, Warszawa.
Kaczmarczyk, P. (2006), ‘Highly skilled migration from Poland and other CEE countries – myths and reality’, Center for
International Relations, Reports&Analyses 17/06, Warsaw.
Kolasa, M. (2005), ‘What Drives Productivity Growth in The New EU Member States? The Case of Poland’, Working
Paper Series No. 486, the European Central Bank. Frankfurt
Kolasa, M. and Żółkiewski, Z. (2004), ‘Total Factor Productivity and its determinants in Poland – evidence from
manufacturing industries. The role of ICT’, TIGER Working Paper Series No. 64 Warsaw.
Krugman, P. and M. Obstfeld, (2007), ‘Ekonomia międzynarodowa’, PWN Warszawa.
NBP (2004), “A Report on the Costs and Benefits of Poland’s Adoption of the Euro’, National Bank of Poland, Warsaw
NBP (2007), “Informacja o kondycji sektora przedsiębiorstw ze szczególnym uwzględnieniem stanu koniunktury w I kw.
2007’, Departament Analiz Makroekonomicznych i Strukturalnych NBP, Warszawa.
Okólski, M. (2006), “Costs and benefits of migration for Central European countries’, CMR Working Papers, 7/65,
Orłowski, W. (2004), “Optymalna ścieżka do euro’ (‘Optimal Path to Euro’), Scholar, Warszawa
Orłowski W., Zienkowski L. (1998), “Skala potencjalnej emigracji do Unii Europejskiej: próba prognozy’, in: Korcelli P.
(eds.): “Przemiany ludności jako konsekwencja przystàpienia Polski do Unii Europejskiej’, Komitet
Przestrzennego Zagospodarowania Kraju, p. 55-66.
Piatkowski, M. and van Ark, B., (2005) “ICT and Productivity Growth in Transition Economies: Two-Phase
Convergence and Structural Reforms’, TIGER Working Paper Series No. 72, Warsaw.
Rybinski, K. (2006), ‘Globalizacja w trzech odsłonach’, www.rybinski.eu
UKE (2006), ‘Raport o stanie rynku telekomunikacyjnego w 2005 roku’, http://www.uke.gov.pl
Yusuf, S. (2001), “Globalization and the Challenge for Developing Countries’, DECRG World Bank.
Appendix. Brief description of the CGE model
This annex delivers a brief description of the CGE model, that was used to perform the
simulations presented in the main text. The details of the model one can find in Gradzewicz, Griffin,
Żółkiewski (2006).
The model describes the allocations and flows of funds in the economy populated by
optimising economic agents, subject to their budget constraints. The model assures that the
equilibrium conditions on all markets are met and thus all the quantities and prices are the result of
competitive allocation that supports the general equilibrium in the economy.
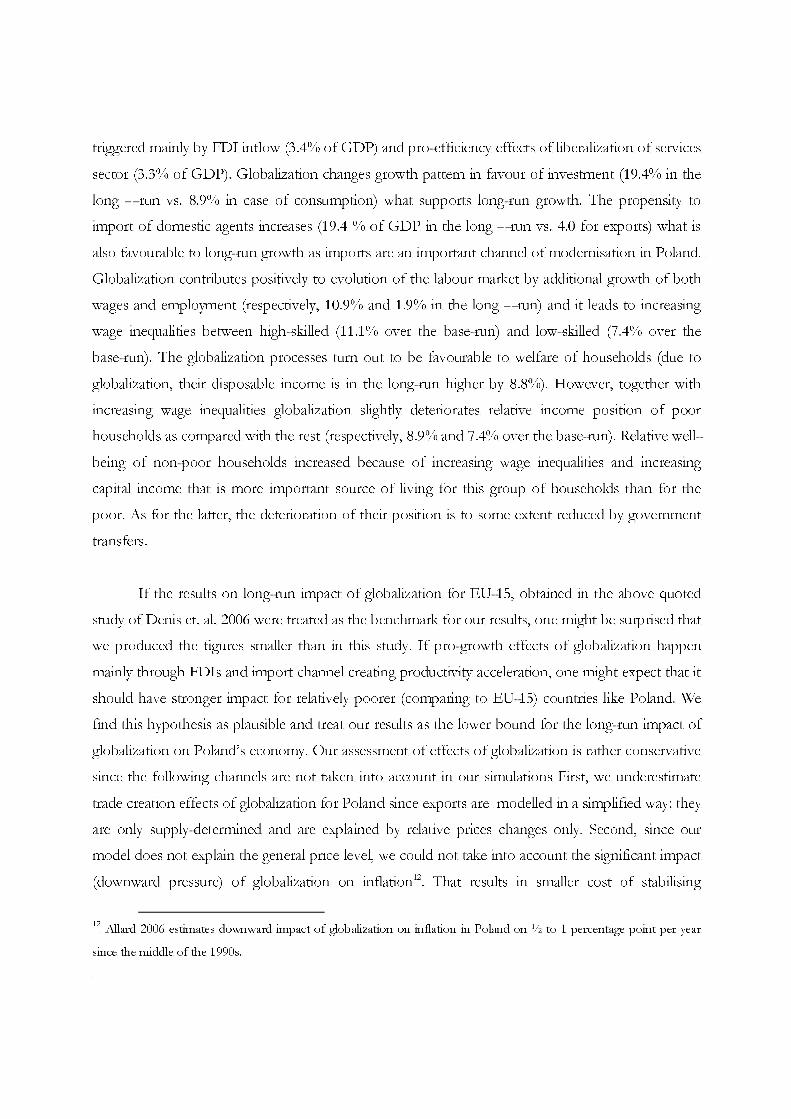
Picture A.1. Production activity scheme
The structure of the model is quite detailed – there are 39 types of producers (and goods that
are traded), that use a bundle of intermediate products and a bundle of primary inputs to transform
them into the tradable product (see picture A.1), subject to the CES technology. Primary inputs
consists of capital good and 3 types of labour (with basic, medium and higher education), supplied by
the households. The demand for factors of production is e result of cost minimization by producers.
The produced goods are sold by enterprises either to domestic or to foreign markets (EU or non-
Gross Output
Primary Inputs
Intermediate Inputs
Goods and Services
Capital and Land
Labour
Export to Non-EU
Export to EU
Domestic Market
Export Market
C
EU) in a way that maximise producers’ profits subject to demand constraints and relative prices that
are given to an individual producer.
Imperfect competition is embedded in the process of gross output formation. It is assumed
that a part of gross output is used to pay the fixed cost of production. The total amount of gross
output forgone is a function of the number of firms operating in a given sector. Firms produce
individual product varieties and each firm has a limited monopoly power stemming from product
differentiation. Demand for an individual variety comes from a standard CES Dixit-Stiglitz
aggregator. Firms are assumed to compete in the Bertrand fashion taking into account the effect of
their actions on the perceived demand. Markups are thus variable and are a function of the CES
elasticity and the number of firms.
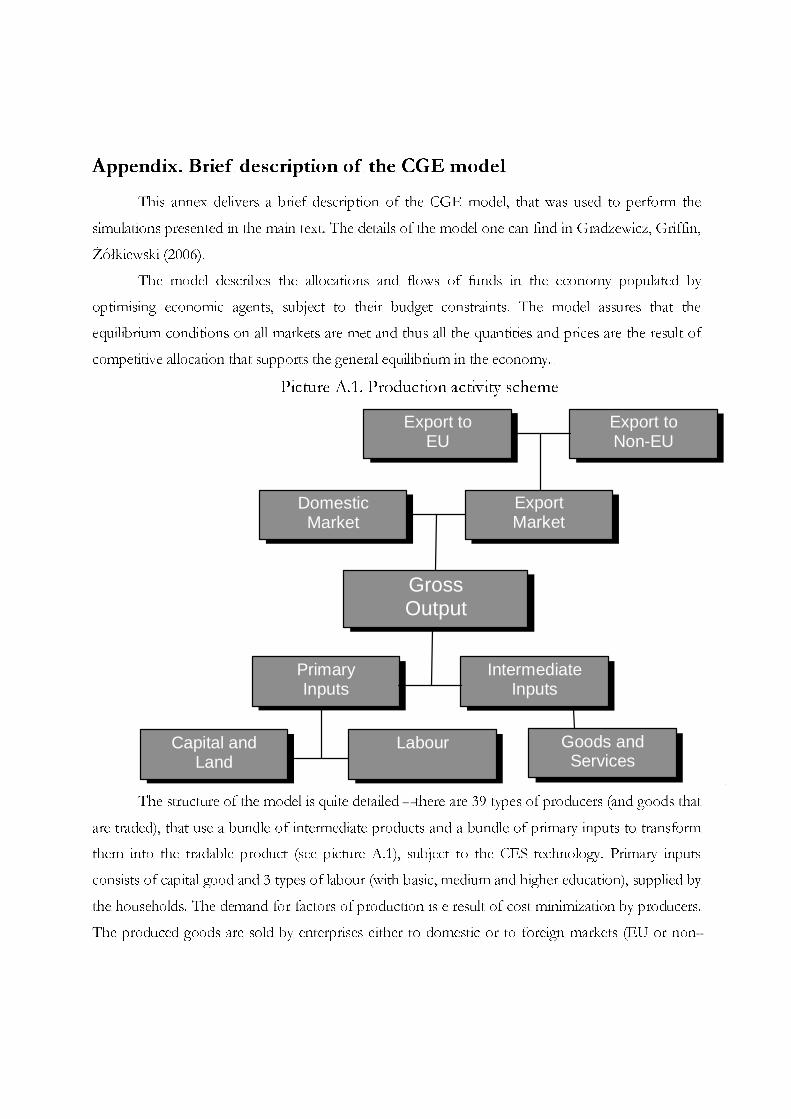
Picture A.2. Households’ decision scheme
There are 10 types of households in the model, divided by socio-economic features
(employees, self-employed, farmers, employers and other) and their income (poor and non-poor).
Households pool their income from renting labour and capital to the producers and net transfers
with other agents in the economy (e.g. social transfers from the government). They spend their
income on consumption of goods and leisure, and the rest is saved. As the model does not describe
the allocation of consumption in time, the households’ propensity to consume (and save) is constant.
The inclusion of leisure in the utility function makes the households’ labour supply endogenous. It is
Disposable income
Savings
Consumption
Leisure consumption
Goods consumption
Labour income
Capital income
Net transfers
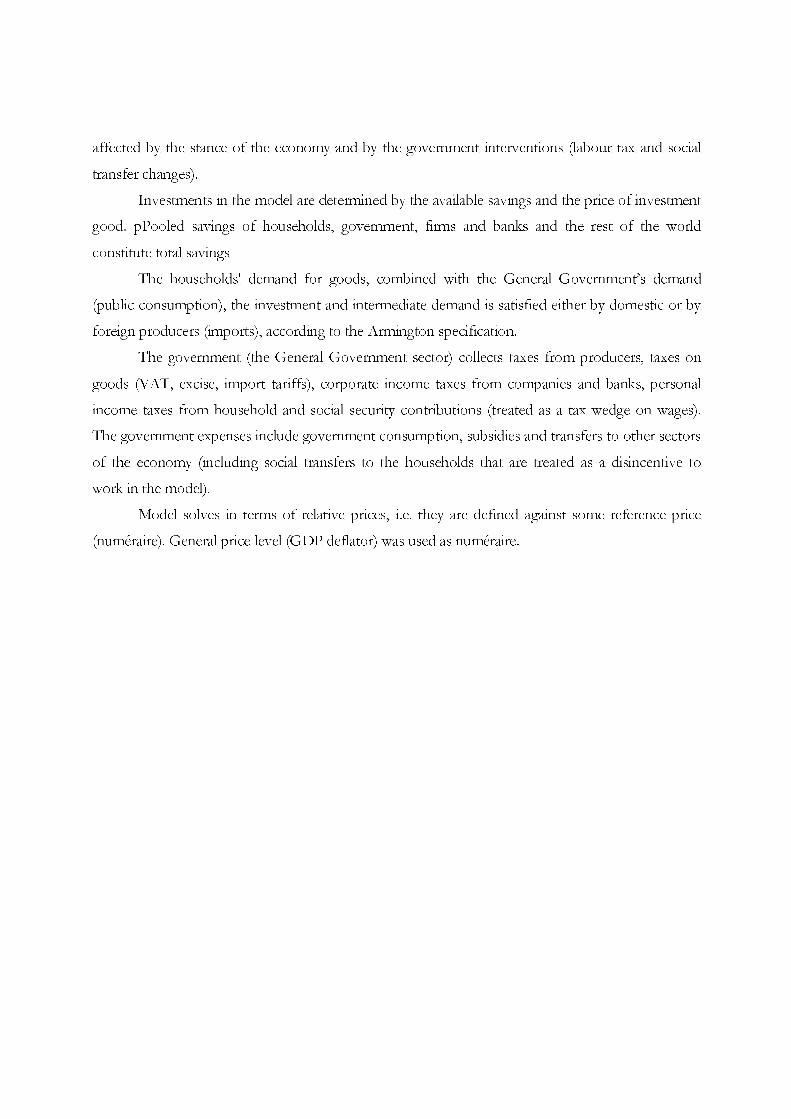
affected by the stance of the economy and by the government interventions (labour tax and social
transfer changes).
Investments in the model are determined by the available savings and the price of investment
good. pPooled savings of households, government, firms and banks and the rest of the world
constitute total savings
The households' demand for goods, combined with the General Government’s demand
(public consumption), the investment and intermediate demand is satisfied either by domestic or by
foreign producers (imports), according to the Armington specification.
The government (the General Government sector) collects taxes from producers, taxes on
goods (VAT, excise, import tariffs), corporate income taxes from companies and banks, personal
income taxes from household and social security contributions (treated as a tax wedge on wages).
The government expenses include government consumption, subsidies and transfers to other sectors
of the economy (including social transfers to the households that are treated as a disincentive to
work in the model).
Model solves in terms of relative prices, i.e. they are defined against some reference price
(numéraire). General price level (GDP deflator) was used as numéraire.


