THURSDAY, JULY 12, 2012 Record Negatives for Supreme Court Driven by GOP Discontent Obama Holds Lead; Romney Trails on Most Issues FOR FURTHER INFORMATION CONTACT: Andrew Kohut President, Pew Research Center Carroll Doherty and Michael Dimock Associate Directors Scott Keeter Director of Survey Research 1615 L St, N.W., Suite 700 Washington, D.C. 20036 Tel (202) 419-4350 Fax (202) 419-4399 www.peoplepress.org
Transcript
THURSDAY, JULY 12, 2012
Record Negatives for Supreme Court Driven by GOP
Discontent
Obama Holds Lead; Romney Trails on Most Issues
FOR FURTHER INFORMATION CONTACT:
Andrew Kohut
President, Pew Research Center
Carroll Doherty and Michael Dimock
Associate Directors
Scott Keeter
Director of Survey Research
1615 L St, N.W., Suite 700
Washington, D.C. 20036
Tel (202) 419-4350
Fax (202) 419-4399
www.peoplepress.org
48 47 45 44
42 45
42
46 43
48 49 50 52
54
49 49 50 50
Oct Nov Dec Jan Feb Mar Apr May Jun Jul
Obama
Romney
64
80
68
57
64
58
52
51
28
16 21
30 25 29
37
0
25
50
75
100
1985
1988
1991
1994
1997
2000
2003
2006
2009
2012
Favorable
Unfavorable
Record Negatives for Supreme Court Driven by GOP Discontent
Obama Holds Lead, Romney Trails on Most Issues
Despite the stagnant economy and broad
dissatisfaction with national conditions,
Barack Obama holds a significant lead over
Mitt Romney. Currently, Obama is favored by a
50% to 43% margin among registered voters
nationwide. Obama has led by at least a slim
margin in every poll this year, and there is no
clear trend in either candidate’s support since
Romney wrapped up the GOP nomination.
The latest national survey by the Pew Research
Center for the People & the Press, conducted
June 28-July 9, 2012 among 2,973 adults,
including 2,373 registered voters, finds that
Romney has not seized the advantage as the
candidate best able to improve the economy. In
fact, he has lost ground on this issue over the
past month.
The Supreme Court’s recent ruling on the 2010
Affordable Care Act appears to have had little
effect on the 2012 race. But the decision has
had a substantial impact on views of the court
itself.
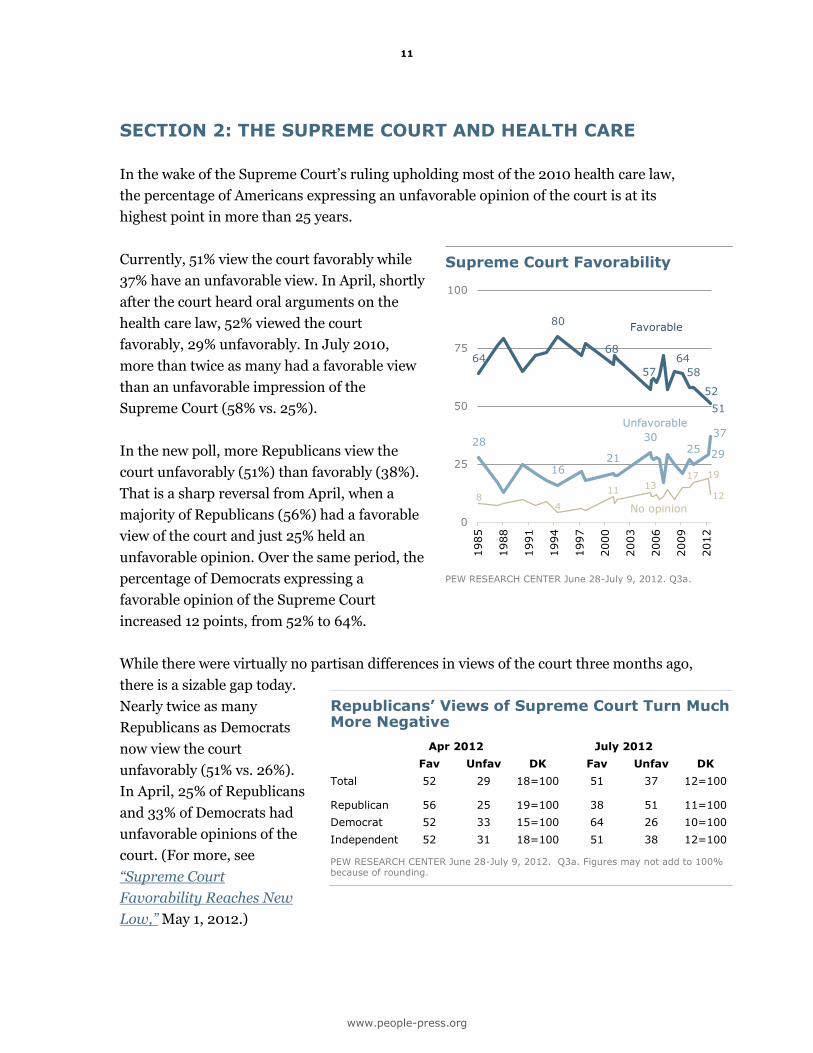
About half of Americans (51%) express a
favorable opinion of the court, while 37% have
an unfavorable view, up eight points since
April and the highest percentage expressing an
unfavorable opinion in a trend dating to 1985.
The more negative view of the court is largely
being driven by Republicans: Three months
ago, Republicans viewed the Supreme Court
Obama Maintains Campaign Lead
PEW RESEARCH CENTER June 28-July 9, 2012. Based on registered voters.
Supreme Court Viewed More Negatively
PEW RESEARCH CENTER June 28-July 9, 2012. Based on general public.
2
www.people-press.org
favorably by a 56% to 25% margin. Today, they view the court unfavorably by a 51% to
38% margin.
The presidential campaign’s dynamics have changed little in recent months, despite the
court’s high-profile health care ruling, a series of subpar job reports and increased
campaign activity on the part of both candidates. Independent voters remain evenly
divided, 46% support Romney while 45% back Obama. Nearly identical majorities of
Democrats (88%) and Republicans (89%) support their party’s candidate. Obama’s lead
arises from the Democratic Party’s continuing advantage in party identification among
registered voters.
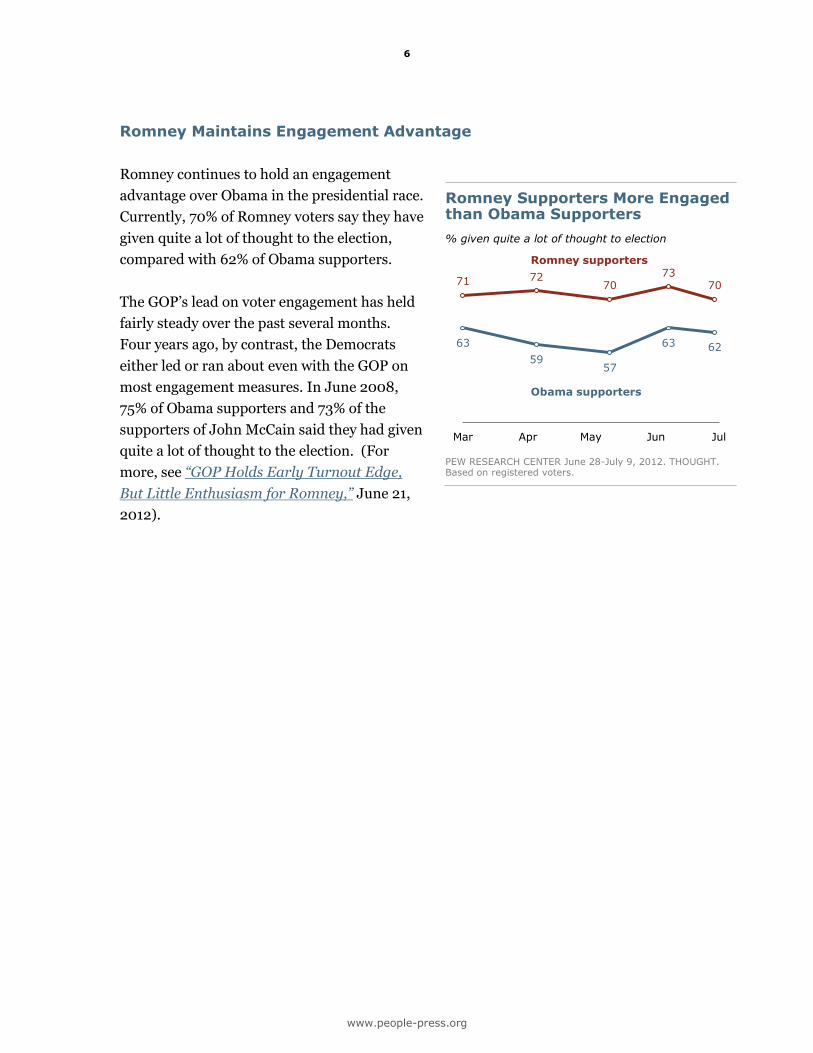
While Romney has nearly uniform support from his base, he continues to struggle in
building enthusiasm. Just 34% of Romney voters support him strongly, compared with
64% of Obama’s backers. Yet this lack of enthusiasm does not mean that Republican
voters are disengaged. Seven-in-ten Romney supporters say they have given quite a lot of
thought to the election, compared with 62% of Obama supporters. This gap has
remained consistent throughout the year.
The electorate remains deeply unhappy with the way things are going in the country.
Just 28% of registered voters say they are satisfied with national conditions, while two-
thirds (67%) are dissatisfied, which is largely unchanged from recent months.
The poor job reports have not gone unnoticed by the public: 51% say they are hearing
mostly bad news about the job situation, and 40% say the overall economic news is
mostly bad. However, these evaluations are no worse than they were a month ago, and
are not having a negative effect on impressions of Obama’s performance. At 50%, his
current job approval rating is actually up slightly from 47% last month and in positive
territory for the first time since March.
3
www.people-press.org
The job situation remains the
number-one issue for voters
in this campaign. Neither
candidate has a clear
advantage on this issue: 46%
say Romney and 42% say
Obama can do a better job
improving the job situation.
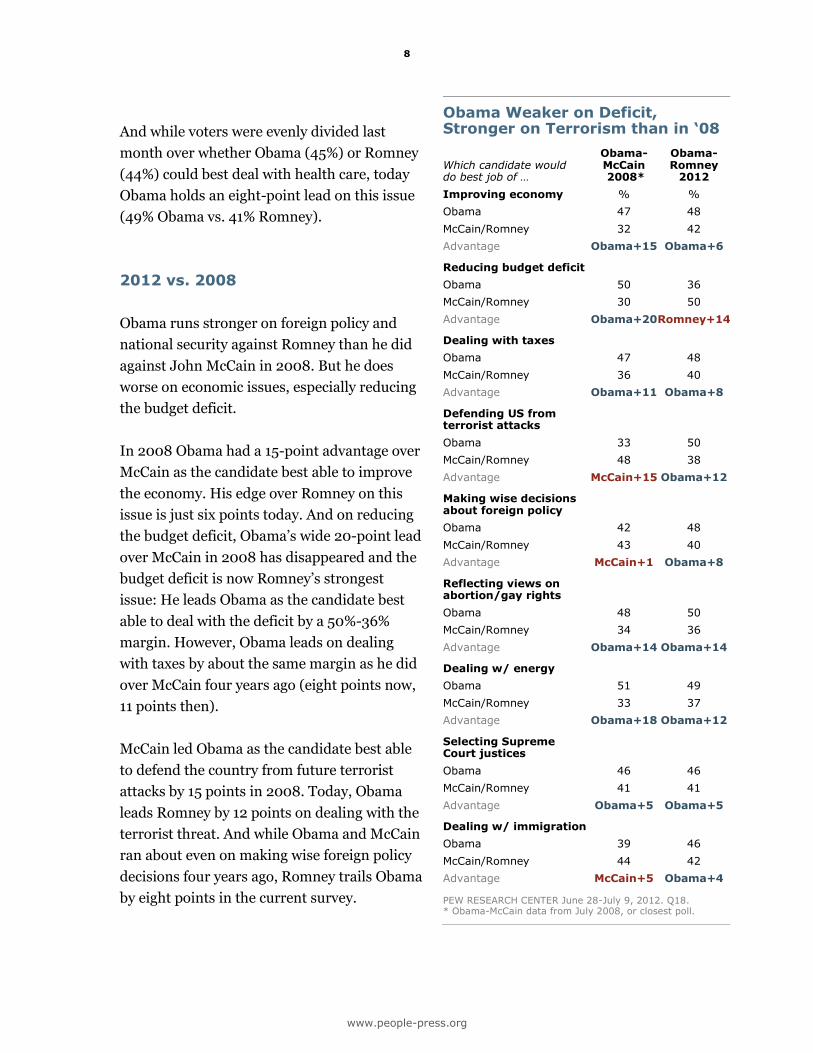
More generally, Mitt Romney
has lost ground over the past
month on the issue of the
economy. The eight-point
advantage he held in June as
the candidate better able to
improve the economy has
now flipped, with 48% saying Obama can better improve economic conditions, while
42% favor Romney.
Of 12 issues tested, Romney is seen as stronger than Obama on only one – reducing the
federal budget deficit – while Obama has the edge on eight. By two-to-one (60%-30%)
Obama is seen as the candidate who would better deal with the problems of poor people.
By a 50% to 36% margin, more voters say Obama better reflects their view on social
issues like abortion and gay rights. Obama also holds 12-point leads as the candidate
better able to defend against terrorist attacks and deal with the nation’s energy
problems.
Other Key Findings
Health Care Remains a Secondary Issue. The proportion of voters saying that
the issue of health care will matter most in their vote has increased very little in the wake
of the court’s decision upholding the 2010 law. Just 22% rate health care as their top
issue, largely unchanged from the 19% who said this last month.
Independents View Both Parties Unfavorably. For the first time in the past
four election cycles, majorities of independent voters view both parties unfavorably: 57%
Obama vs. Romney on the Issues
Who would do best job of …
Obama Romney Adv
% %
Reducing the federal budget deficit 36 50 +14 Romney
Improving the job situation 42 46 +4 Romney
Dealing with immigration 46 42 +4 Obama
Selecting Supreme Court justices 46 41 +5 Obama
Improving economic conditions 48 42 +6 Obama
Dealing with taxes 48 40 +8 Obama
Dealing with health care 49 41 +8 Obama
Making wise decisions on foreign policy 48 40 +8 Obama
Dealing with nation’s energy problems 49 37 +12 Obama
Defending against terrorist attacks 50 38 +12 Obama
Dealing with abortion/gay rights 50 36 +14 Obama
Dealing with problems of poor people 60 30 +30 Obama
PEW RESEARCH CENTER June 28–July 9, 2012. Q18. Based on registered voters.
4
www.people-press.org
of independents have an unfavorable opinion of the Democratic Party, while 62% view
the GOP unfavorably.
Public Sees Better News on Gas Prices. While news about the job situation is
viewed negatively, the public is more upbeat about news about gas prices. Currently, as
many say they are hearing mostly good news about gas prices as mostly bad news (31%
each). In March, fully 85% said news about gas prices was mostly bad; just 2% said it was
mostly good.
5
www.people-press.org
46
45
0
25
50
75
Jan Feb Mar Apr May Jun Jul
Obama
Romney
%
51
44
0
25
50
75
Jan Feb Mar Apr May Jun Jul
Obama
Romney
%
SECTION 1: THE 2012 RACE, ISSUE STRENGTHS, VIEWS OF
THE PARTIES
The general election contest between Obama and Romney has changed little over the
past few months. Currently, 50% of registered voters support Obama or lean more
toward him, while 43% back Romney or lean toward him. In June (June 7-17), Obama
held a slight four-point edge (50% to 46%) and in May, Obama led 49% to 42%.
Similarly, the preferences of key groups of
voters have remained fairly stable.
Independents are evenly divided (46% Obama
vs. 45% Romney), which is little changed from
last month (49% Romney vs. 44% Obama).
Obama continues to hold wide leads among
blacks, Hispanics, women, college graduates
and younger voters. Romney continues to hold
a double-digit lead (currently 54% to 40%)
among whites. As has been the case
throughout this year, Romney’s advantage is
particularly strong among working-class
whites – he leads by a 58% to 35% margin
among whites without a college degree, while
white college graduates are divided (50%
Obama, 47% Romney). (For trends in the race
among selected demographic groups, see
“Presidential Race Among Key Groups”).
Despite a steep increase in campaign
advertising and other campaign activities in
many key battleground states over the past
month, there has been no shift in voter
preferences. Currently, Obama holds a slim
51% to 44% margin among voters in 12 of the
most competitive states. This is identical to the
balance of support in these states in June.
Independents Remain Divided
If the election were today, would you vote for…
PEW RESEARCH CENTER June 28-July 9, 2012. Based on independent registered voters. Q10/Q10a.
No Shift in Battleground States
If the election were today, would you vote for…
PEW RESEARCH CENTER June 28-July 9, 2012. Q10/Q10a. Based on registered voters living in: CO, FL, IA, MI, MO, NV, NH, NC, OH, PA, VA and WI. For full list of Republican and Democratic states, see About the Survey.
Similarly, views of the Supreme Court are more closely associated with opinions about
the 2010 health care law than they were three months ago. Currently, nearly two-thirds
(65%) of those who approve of the law have a favorable opinion of the court, compared
with just 37% of those who disapprove of the law. In April, opinions about the court were
about the same among those who approved and disapproved of the law (52% favorable
and 55% favorable, respectively).
Little Change in Views of Supreme Court’s Ideology
In contrast to overall opinions of the Supreme
Court, perceptions of the court’s ideology have
shown little change. Currently, 41% say the
court is middle of the road ideologically, while
24% view it as conservative and 23% say it is
liberal. That is little changed from July 2010
(39% middle of the road, 23% conservative,
23% liberal).
Republicans are more likely than Democrats to
view the court’s ideology as liberal (36% vs.
12%). But the percentage of Republicans viewing the court as liberal is little changed
from two years ago (34%).
Democrats and independents’ views of the court’s ideology also have changed little.
Currently, 39% of Democrats say the court is middle of the road, while the same
percentage says it is conservative and 12% say it is liberal. Independents’ views mirror
the general public’s, with a plurality (41%) saying it is middle of the road.
Supreme Court: Conservative, Liberal or Middle of the Road?
Supreme Court is…
Total Rep Dem Ind
% % % %
Conservative 24 9 39 21
Middle of the road 41 45 39 41
Liberal 23 36 12 24
Don’t know 12 9 10 13
100 100 100 100
PEW RESEARCH CENTER June 28-July 9, 2012. Q23. Figures may not add to 100% because of rounding.
13
www.people-press.org
Post-Decision Views of Health Care Law
The court’s decision has had
only a modest impact on the
public’s views of the 2010
health care law. Currently,
47% approve of the law while
43% disapprove. In June, the
balance of opinion was
somewhat more negative
than positive (43% approve,
48% disapprove).
Currently, about as many
strongly approve (31%) as
strongly disapprove (33%) of
the health care law. Last
month, there was more
strong disapproval than
strong approval (35% vs.
26%).
Nonetheless, more
Republicans strongly oppose
the law than Democrats
strongly support it. About
seven-in-ten Republicans
(71%) say they strongly
oppose the 2010 health care law, while 58% of Democrats strongly support it. While
independents are divided over the law (46% disapprove vs. 36% disapprove), more
independents strongly disapprove than approve (32% vs. 26%).
Opinions of Health Care Law Little Changed Following Court Decision
2010 2012
Health care law passed by Obama and Congress …
Apr Mar Apr June July
%
% % % %
Approve 40 47 41 43 47
Disapprove 44 45 49 48 43
Don’t know 16 8 10 9 9
100 100 100 100 100
PEW RESEARCH CENTER June 28-July 9, 2012. Q34. Figures may not add to 100% because of rounding.
More Strong GOP Opposition to Health Care Law than Strong Democratic Support
Health care law passed by Obama and Congress …
App- rove Strongly
Dis- approve Strongly DK
% % % % %
Total 47 31 43 33 9=100
Republican 12 6 83 71 6=100
Conservative Rep 7 3 89 80 3=100
Moderate/Liberal Rep 21 12 70 52 9=100
Independent 43 26 46 32 11=100
Democrat 80 58 15 9 6=100
Conserv/Mod Democrat 74 51 20 12 7=100
Liberal Democrat 90 69 8 4 2=100
PEW RESEARCH CENTER June 28-July 9, 2012. Q34, Q35. Figures may not add to 100% because of rounding.
14
www.people-press.org
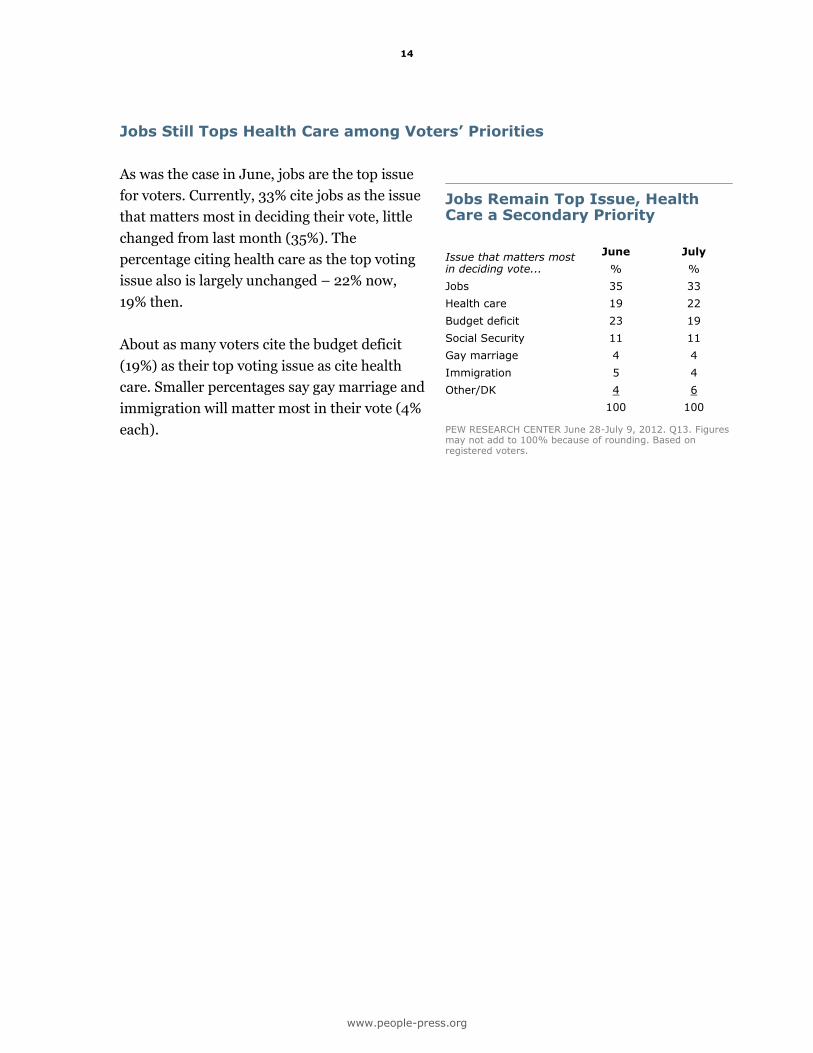
Jobs Still Tops Health Care among Voters’ Priorities
As was the case in June, jobs are the top issue
for voters. Currently, 33% cite jobs as the issue
that matters most in deciding their vote, little
changed from last month (35%). The
percentage citing health care as the top voting
issue also is largely unchanged – 22% now,
19% then.
About as many voters cite the budget deficit
(19%) as their top voting issue as cite health
care. Smaller percentages say gay marriage and
immigration will matter most in their vote (4%
each).
Jobs Remain Top Issue, Health Care a Secondary Priority
Issue that matters most in deciding vote...
June July
% %
Jobs 35 33
Health care 19 22
Budget deficit 23 19
Social Security 11 11
Gay marriage 4 4
Immigration 5 4
Other/DK 4 6
100 100
PEW RESEARCH CENTER June 28-July 9, 2012. Q13. Figures may not add to 100% because of rounding. Based on registered voters.
15
www.people-press.org
1 7
1
11
4
80
24
67
24
40
19
68
30
62
55 Mix of good and bad news
Dec 2008
July 2012
Jan 2011
Aug 2011
Mostly bad news
Mostly good news
Mar 2012
85
48
31
12
31
35
2
19 31
March June July
Mostly bad news
Mostly good news
Mix of good and bad news
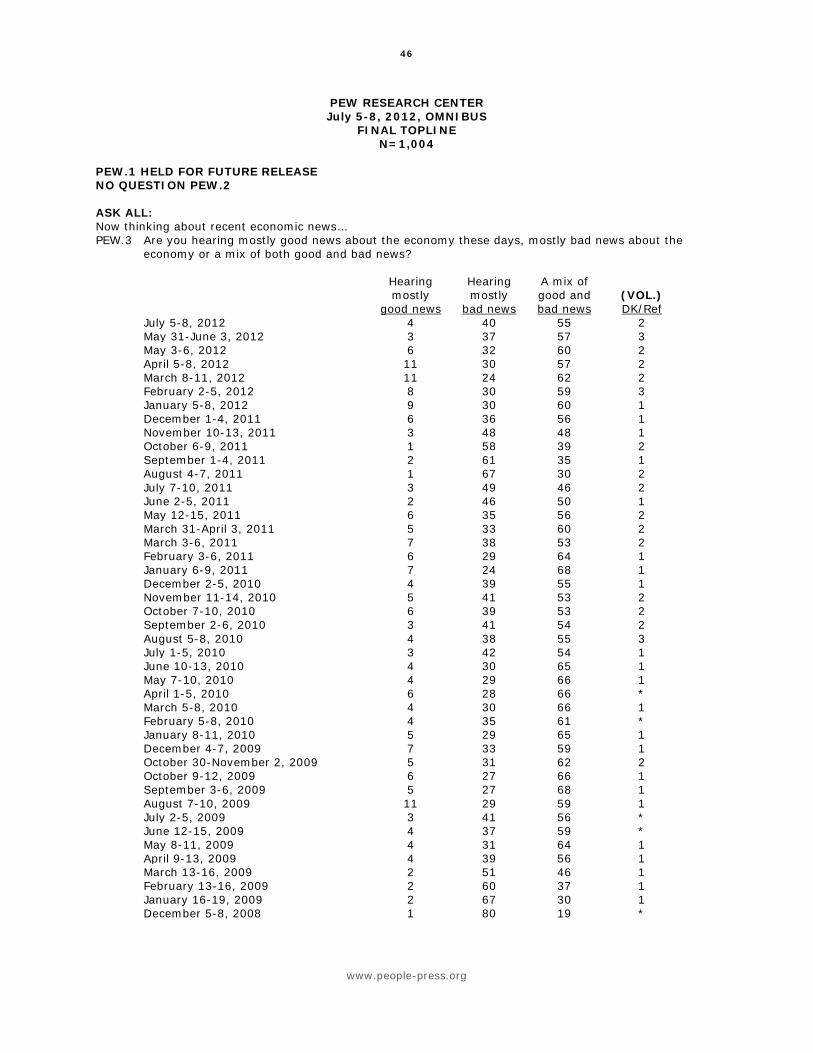
SECTION 3: PERCEPTIONS OF ECONOMIC NEWS
The public’s perceptions of
the tone of news about the
economy have changed little
over the past month, but are
far more negative than they
were earlier this year.
Currently, 55% say they have
been hearing a mix of good
and bad news about the
economy these days, while
40% say the news has been
mostly bad. This is largely
unchanged from a month ago
(57% mixed, 37% mostly
bad). Only small percentages
have said they are hearing
mostly good economic news
(4% now, 3% in June).
The news seemed better earlier in the year. In
March, 62% said economic news was mixed
and just 24% said it was mostly bad. About
one-in-ten (11%) said that economic news was
mostly good.
But things seem far better than last summer
and fall. In August 2011 – shortly after the debt
ceiling standoff in Washington – two-thirds
(67%) said they were hearing mostly bad
economic news.
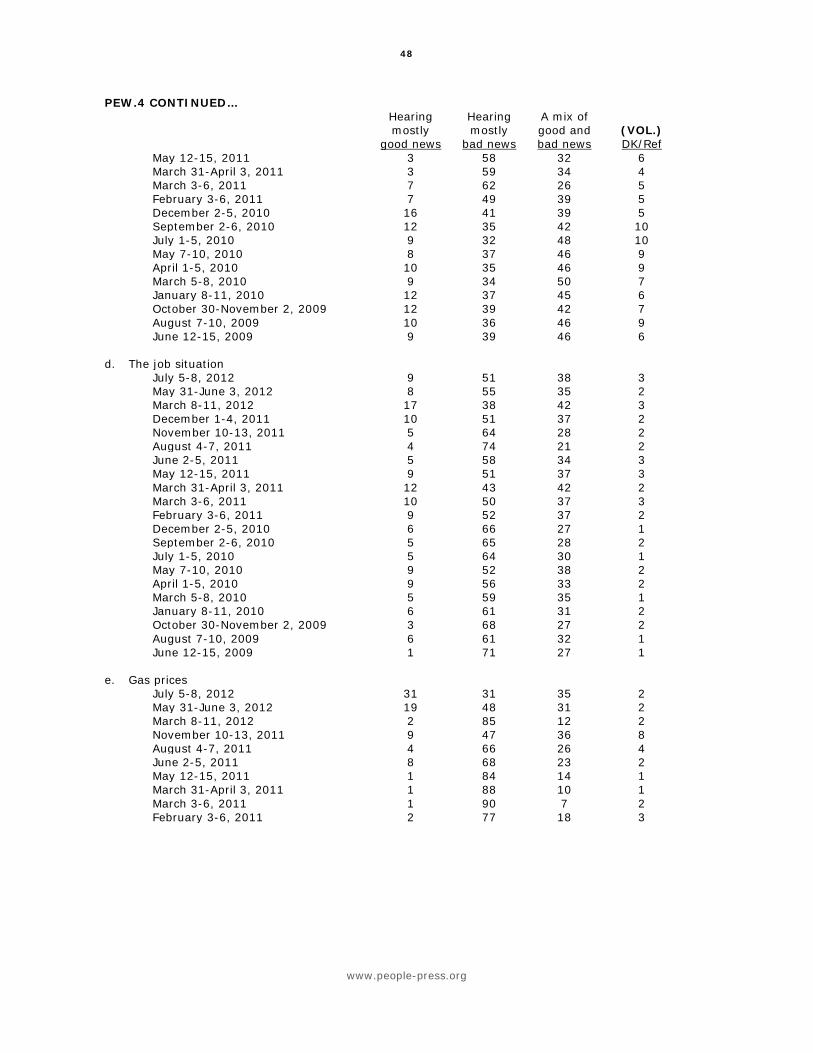
The news about gas prices has shifted
substantially in recent months. As recently as
March, 85% of Americans said they were
hearing mostly bad news about gas prices – the worst of any sector of the economy at the
Four-in-Ten Hearing Mostly Bad Economic News
What are you hearing about the economy these days?
PEW RESEARCH CENTER July 5-8, 2012 Omnibus.
News about Gas Prices Improves
What are you hearing about gas prices?
PEW RESEARCH CENTER July 5-8, 2012 Omnibus.
16
www.people-press.org
time. Today, just 31% say they are hearing mostly bad news while another 31% say the
news about gas prices is mostly good, making it the most positive area of economic news.
By comparison, news about
the job situation is far more
negative. Currently, 51% say
they are hearing mostly bad
news about the job situation,
little changed from June
(55%), but up sharply from
March (38%).
Perceptions of news about
financial markets have
improved since June, but are less positive than earlier this year. Currently, 35% say they
are hearing mostly bad news about financial markets, down from 47% last month but up
slightly from March (29%).
Perceptions of news about real estate values have changed little throughout 2012.
Currently, 39% say they are hearing mostly bad news, 41% are hearing a mix of good and
bad and 14% are hearing mostly good news.
News About Jobs Remains Negative
Mostly
bad Mostly good
Mix of good & bad DK
News about ____ is… % % % %
The job situation 51 9 38 3=100
Prices for food and goods 45 9 40 6=100
Real estate values 39 14 41 7=100
Financial markets 35 6 50 8=100
Gas prices 31 31 35 2=100
PEW RESEARCH CENTER July 5-8, 2012 Omnibus. Figures may not add to 100% because of rounding.
17
www.people-press.org
Partisan Perceptions
As was the case in June, Republicans are far
more likely than Democrats to say they are
hearing mostly bad news about the economy
(54% vs. 27%). Independents largely mirror
the public as a whole: 53% say the news has
been mixed, 42% say it has been mostly bad
and 3% say it has been mostly good.
Looking at individual economic sectors,
Republicans are much more likely than
Democrats to say they are hearing mostly bad
news about the jobs situation. Six-in-ten
Republicans say this (60%), compared with
40% of Democrats. Just more than half of
independents (53%) say this as well.
On the other hand, there are no significant
partisan differences in perceptions of news about gas prices. About three-in-ten
Republicans (30%), Democrats (29%) and independents (31%) say the news they have
been hearing about gas prices has been mostly bad. Similar numbers in each group say
recent news has been mostly good: 34% of Republicans say this, as do 36% of Democrats
and 29% of independents.
More Republicans Hearing Bad News about Jobs, Not Gas Prices
News about the job situation…
Total Rep Dem Ind
% % % %
Mostly bad 51 60 40 53
Mix of good and bad 38 30 46 37
Mostly good 9 8 11 8
Don’t know 3 1 2 2
100 100 100 100
News about gas prices …
Mostly bad 31 30 29 31
Mix of good and bad 35 35 33 39
Mostly good 31 34 36 29
Don’t know 2 1 2 1
100 100 100 100
PEW RESEARCH CENTER July 5-8, 2012 Omnibus. Figures may not add to 100% because of rounding.
18
www.people-press.org
47 46
0
25
50
75
Jan Feb Mar Apr May Jun Jul
Romney
Obama
53
40
0
25
50
75
Jan Feb Mar Apr May Jun Jul
49
45
0
25
50
75
Jan Feb Mar Apr May Jun Jul
61
37
0
25
50
75
Jan Feb Mar Apr May Jun Jul
51
41
0
25
50
75
Jan Feb Mar Apr May Jun Jul
44 48
0
25
50
75
Jan Feb Mar Apr May Jun Jul
91
4
0
25
50
75
100
Jan Feb Mar Apr May Jun Jul
40
54
0
25
50
75
100
Jan Feb Mar Apr May Jun Jul
64
25
0
25
50
75
100
Jan Feb Mar Apr May Jun Jul
PRESIDENTIAL RACE AMONG KEY GROUPS OF REGISTERED VOTERS
GENDER Men Women
AGE
18-29 30-49 50-64
65+
RACE
White non-Hispanic Black non-Hispanic Hispanic
PEW RESEARCH CENTER June 28-July 9, 2012. Hispanics only shown for surveys where N=100 or more.
19
www.people-press.org
48 46
0
25
50
75
Jan Feb Mar Apr May Jun Jul
49
43
0
25
50
75
Jan Feb Mar Apr May Jun Jul
54
40
0
25
50
75
Jan Feb Mar Apr May Jun Jul
Romney
Obama
48 46
0
25
50
75
Jan Feb Mar Apr May Jun Jul
60
33
0
25
50
75
Jan Feb Mar Apr May Jun Jul
49 46
0
25
50
75
Jan Feb Mar Apr May Jun Jul
9
89
0
25
50
75
100
Jan Feb Mar Apr May Jun Jul
88
8 0
25
50
75
100
Jan Feb Mar Apr May Jun Jul
46
45
0
25
50
75
100
Jan Feb Mar Apr May Jun Jul
PRESIDENTIAL RACE AMONG KEY GROUPS OF REGISTERED VOTERS
EDUCATION College grad+ Some college High school or less
INCOME
$75,000+ $30,000-$74,999 <$30,000
PARTY
Republican Democrat Independent
PEW RESEARCH CENTER June 28-July 9, 2012.
20
www.people-press.org
About the Surveys
Most of the analysis in this report is based on telephone interviews conducted June 28-July 9, 2012 among a national sample of 2973 adults, 18 years of age or older, living in all 50 U.S. states and the District of Columbia (1771 respondents were interviewed on a landline telephone, and 1202 were interviewed on a cell phone, including 596 who had no landline telephone). The survey was conducted by interviewers at both Princeton Data Source and Universal Survey under the direction of Princeton Survey Research Associates International. A combination of landline and cell phone random digit dial samples were used; both samples were provided by Survey Sampling International. Interviews were conducted in English and Spanish. Respondents in the landline sample were selected by randomly asking for the youngest adult male or female who is now at home. Interviews in the cell sample were conducted with the person who answered the phone, if that person was an adult 18 years of age or older. For detailed information about our survey methodology, see http://people-press.org/methodology/ The combined landline and cell phone sample are weighted using an iterative technique that matches gender, age, education, race, Hispanic origin and nativity and region to parameters from the March 2011 Census Bureau's Current Population Survey and population density to parameters from the Decennial Census. The sample also is weighted to match current patterns of telephone status and relative usage of landline and cell phones (for those with both), based on extrapolations from the 2011 National Health Interview Survey. The weighting procedure also accounts for the fact that respondents with both landline and cell phones have a greater probability of being included in the combined sample and adjusts for household size within the landline sample. Sampling errors and statistical tests of significance take into account the effect of weighting. The following table shows the sample sizes and the error attributable to sampling that would be expected at the 95% level of confidence for different groups in the survey:
Group Sample Size Plus or minus…
Total 2973 2.1 percentage points
Republicans 774 4.1 percentage points
Democrats 995 3.6 percentage points
Independents 1037 3.5 percentage points
Registered voters 2373 2.3 percentage points
Among registered voters
Republican voters 686 4.4 percentage points
Democratic voters 837 3.9 percentage points
Independent voters 771 4.1 percentage points
Obama supporters 1157 3.4 percentage points
Romney supporters 1058 3.5 percentage points
Some of the analysis in this report is based on telephone interviews conducted July 5-8, 2012 among a national sample of 1,004 adults 18 years of age or older living in the continental United States (601 respondents were interviewed on a landline telephone, and 403 were interviewed on a cell phone, including 189 who had no landline telephone). The survey was conducted by interviewers at Princeton Data Source under the direction of Princeton Survey Research Associates International. A combination of landline and cell phone random digit dial samples
were used; both samples were provided by Survey Sampling International. Interviews were conducted in English. Respondents in the landline sample were selected by randomly asking for the youngest adult male or female who is now at home. Interviews in the cell sample were conducted with the person who answered the phone, if that person was an adult 18 years of age or older. For detailed information about our survey methodology, see: http://people-press.org/methodology/. The combined landline and cell phone sample are weighted using an iterative technique that matches gender, age, education, race, Hispanic origin and region to parameters from the March 2011 Census Bureau's Current Population Survey and population density to parameters from the Decennial Census. The sample also is weighted to match current patterns of telephone status, based on extrapolations from the 2011 National Health Interview Survey. The weighting procedure also accounts for the fact that respondents with both landline and cell phones have a greater probability of being included in the combined sample and adjusts for household size within the landline sample. Sampling errors and statistical tests of significance take into account the effect of weighting. The following table shows the sample sizes and the error attributable to sampling that would be expected at the 95% level of confidence for different groups in the survey:
Group Sample Size Plus or minus …
Total sample 1004 3.6 percentage points
Republicans 252 7.2 percentage points
Democrats 292 6.7 percentage points
Independents 361 6.0 percentage points
Sample sizes and sampling errors for other subgroups are available upon request. In addition to sampling error, one should bear in mind that question wording and practical difficulties in conducting surveys can introduce error or bias into the findings of opinion polls.
Battleground states were identified using ratings for each state from late May to early June from: The Cook Political Report, MSNBC, The New York Times, Real Clear Politics, Karl Rove, CNN, Pollster.com, and the Washington Post. The ratings by these different groups yield 12 battleground states (rated as tossup or lean Republican or Democrat) and 39 safe states, including Washington, D.C. Battleground states are: Colorado, Florida, Iowa, Michigan, Missouri, Nevada, New Hampshire, North Carolina, Ohio, Pennsylvania, Virginia and Wisconsin. Solid or likely Republican states are: Alabama, Alaska, Arizona, Arkansas, Georgia, Idaho, Indiana, Kansas, Kentucky, Louisiana, Mississippi, Montana, Nebraska, North Dakota, Oklahoma, South Carolina, South Dakota, Tennessee, Texas, Utah, West Virginia and Wyoming. Solid or likely Democratic states are: California, Delaware, Washington D.C., Hawaii, Illinois, Maine, Maryland, Massachusetts, Minnesota, New Jersey, New Mexico, New York, Oregon, Rhode Island, Vermont and Washington.
RANDOMIZE Q.1 AND Q.2 ASK ALL: Q.2 Do you approve or disapprove of the way Barack Obama is handling his job as President? [IF DK
ENTER AS DK. IF DEPENDS PROBE ONCE WITH: Overall do you approve or disapprove of the way Barack Obama is handling his job as President? IF STILL DEPENDS ENTER AS DK]
Dis- (VOL.) Approve approve DK/Ref Jun 28-Jul 9, 2012 50 43 7 Jun 7-17, 2012 47 45 8 May 9-Jun 3, 2012 46 42 11 Apr 4-15, 2012 46 45 9 Mar 7-11, 2012 50 41 9 Feb 8-12, 2012 47 43 10 Jan 11-16, 2012 44 48 8 Dec 7-11, 2011 46 43 11 Nov 9-14, 2011 46 46 8 Sep 22-Oct 4, 2011 43 48 9 Aug 17-21, 2011 43 49 7 Jul 20-24, 2011 44 48 8 Jun 15-19, 2011 46 45 8 May 25-30, 2011 52 39 10 May 5-8, 2011 50 39 11 May 2, 2011 56 38 6 Mar 30-Apr 3, 2011 47 45 8 Feb 22-Mar 1, 2011 51 39 10 Feb 2-7, 2011 49 42 9 Jan 5-9, 2011 46 44 10 Dec 1-5, 2010 45 43 13 Nov 4-7, 2010 44 44 12 Oct 13-18, 2010 46 45 9
Dis- (VOL.) Approve approve DK/Ref Aug 25-Sep 6, 2010 47 44 9 Jul 21-Aug 5, 2010 47 41 12 Jun 8-28, 2010 48 41 11 Jun 16-20, 2010 48 43 9 May 6-9, 2010 47 42 11 Apr 21-26, 2010 47 42 11 Apr 8-11, 2010 48 43 9 Mar 10-14, 2010 46 43 12 Feb 3-9, 2010 49 39 12 Jan 6-10, 2010 49 42 10 Dec 9-13, 2009 49 40 11 Oct 28-Nov 8, 2009 51 36 13 Sep 30-Oct 4, 2009 52 36 12 Sep 10-15, 2009 55 33 13 Aug 20-27, 2009 52 37 12 Aug 11-17, 2009 51 37 11 Jul 22-26, 2009 54 34 12 Jun 10-14, 2009 61 30 9 Apr 14-21, 2009 63 26 11 Mar 31-Apr 6, 2009 61 26 13 Mar 9-12, 2009 59 26 15 Feb 4-8, 2009 64 17 19
ASK ALL: Q.3 Would you say your overall opinion of [INSERT ITEM; RANDOMIZE] is very favorable, mostly
favorable, mostly UNfavorable, or very unfavorable? [INTERVIEWERS: PROBE TO DISTINGUISH BETWEEN “NEVER HEARD OF” AND “CAN’T RATE.”] How about [NEXT ITEM]? [IF NECESSARY: Just in general, is your overall opinion of [ITEM] very favorable, mostly favorable, mostly UNfavorable, or very unfavorable?] [INTERVIEWERS: PROBE TO DISTINGUISH BETWEEN “NEVER HEARD OF” AND “CAN’T RATE.”]
(VOL.) (VOL.) ------ Favorable ------ ----- Unfavorable ----- Never Can’t rate/ Total Very Mostly Total Very Mostly heard of Ref a. The Supreme Court Jun 28-Jul 9, 2012 51 10 41 37 14 23 1 11
ASK ALL: THOUGHT How much thought have you given to the coming presidential election . . . Quite a lot or
only a little? BASED ON REGISTERED VOTERS [N=2373]: Quite (VOL.) Only a (VOL.) (VOL.) 2012 Election a lot Some little None DK/Ref Jun 28-Jul 9, 2012 65 3 29 3 * Jun 7-17, 2012 67 1 30 2 1 May 9-Jun 3, 2012 61 2 33 3 1 Apr 4-15, 2012 64 2 30 4 1 Mar 7-11, 2012 66 2 30 1 1 2008 Election November, 2008 81 3 13 2 1 Late October, 2008 81 3 13 2 1 Mid-October, 2008 81 3 13 3 * Early October, 2008 81 2 14 2 1 Late September, 2008 80 3 14 2 1 Mid-September, 2008 78 4 14 3 1 August, 2008 74 6 17 2 1 July, 2008 74 2 20 3 1 June, 2008 72 2 23 2 1 Late May, 2008 75 4 17 3 1 April, 2008 77 7 13 2 1 March, 2008 78 3 15 3 1 Late February, 2008 74 3 19 2 2 2004 Election November, 2004 82 3 12 2 1 Mid-October, 2004 76 5 15 3 1 Early October, 2004 74 4 19 2 1 September, 2004 71 3 22 3 1 August, 2004 69 2 26 2 1
32
www.people-press.org
THOUGHT CONTINUED… Quite (VOL.) Only a (VOL.) (VOL.) a lot Some little None DK/Ref July, 2004 67 2 28 2 1 June, 2004 58 3 36 2 1 May, 2004 59 6 30 4 1 Late March, 2004 60 4 31 4 1 Mid-March, 2004 65 2 31 2 * 2000 Election November, 2000 72 6 19 2 1 Late October, 2000 66 6 24 4 * Mid-October, 2000 67 9 19 4 1 Early October, 2000 60 8 27 4 1 September, 2000 59 8 29 3 1 July, 2000 46 6 45 3 * June, 2000 46 6 43 5 * May, 2000 48 4 42 5 1 April, 2000 45 7 41 7 * 1996 Election November, 1996 67 8 22 3 * October, 1996 65 7 26 1 1 Late September, 1996 61 7 29 2 1 Early September, 1996 56 3 36 4 1 July, 1996 55 3 41 1 * June, 1996 50 5 41 3 1 1992 Election Early October, 1992 77 5 16 1 1 September, 1992 69 3 26 1 1 August, 1992 72 4 23 1 * June, 1992 63 6 29 1 1 1988 Election Gallup: November, 1988 73 8 17 2 0 Gallup: October, 1988 69 9 20 2 0 Gallup: September, 1988 57 18 23 2 0 Gallup: August, 1988 61 10 27 2 0 NO QUESTIONS 4-9 ASK FORM 1 ONLY [N=1466]: REG Which of these statements best describes you? [READ IN ORDER] [INSTRUCTION: IF
RESPONDENT VOLUNTEERS THAT THEY ARE IN NORTH DAKOTA AND DON’T HAVE TO REGISTER, PUNCH 1]
Jun 28-Jul 9 2012 74 Are you ABSOLUTELY CERTAIN that you are registered to vote at your current address 5 Are you PROBABLY registered, but there is a chance your registration has lapsed 20 Are you NOT registered to vote at your current address * Don't know/Refused (VOL.)
33
www.people-press.org
ASK FORM 2 ONLY [N=1507]: REGIST These days, many people are so busy they can't find time to register to vote, or move
around so often they don't get a chance to re-register. Are you NOW registered to vote in your precinct or election district or haven't you been able to register so far? [INSTRUCTION: IF RESPONDENT VOLUNTEERS THAT THEY ARE IN NORTH DAKOTA AND DON’T HAVE TO REGISTER, PUNCH 1 FOR REGIST AND REGICERT]
ASK IF RESPONDENT ANSWERED '1' YES IN REGIST: REGICERT Are you absolutely certain that you are registered to vote, or is there a chance that your
registration has lapsed because you moved or for some other reason? Jun 28-Jul 9 2012 75 Yes, registered 72 Absolutely certain 3 Chance registration has lapsed * Don’t know/Refused (VOL.) 24 No, not registered 1 Don't know/Refused (VOL.) ASK ALL REGISTERED VOTERS (REGICERT=1) OR (REG=1): Q.10 Now, suppose the 2012 presidential election were being held TODAY. If you had to choose between
[READ AND RANDOMIZE: Barack Obama, the Democrat OR Mitt Romney, the Republican] who would you vote for?
ASK IF OTHER OR DK (Q.10=3,9): Q.10a As of TODAY, do you LEAN more to [READ IN SAME ORDER AS Q.10]? ASK REGISTERED VOTERS WHO CHOOSE OBAMA OR ROMNEY IN Q.10: Q.10b Do you support [INSERT LAST NAME OF CANDIDATE CHOSEN IN Q.10] strongly or only
moderately? BASED ON REGISTERED VOTERS [N=2373]: (VOL.) Only Only Other/ Romney Strongly mod DK Obama Strongly mod DK DK/Ref Jun 28-Jul 9, 2012 43 15 28 1 50 32 18 * 6 Jun 7-17, 2012 46 17 27 1 50 30 20 * 5 May 9-Jun 3, 2012 42 49 9 Apr 4-15, 2012 45 49 6 Mar 7-11, 2012 42 54 4 Feb 8-12, 2012 44 52 4 Jan 11-16, 2012 45 50 6 Nov 9-14, 2011 47 49 4 Sep 22-Oct 4, 2011 48 48 4 Only Only Other/ McCain Strongly mod DK Obama Strongly mod DK Nader Barr DK/Ref November, 2008 39 21 18 * 50 35 14 1 1 1 9 Late October, 2008 36 20 15 1 52 39 12 1 3 1 8 Mid-October, 2008 38 21 16 1 52 36 16 * n/a n/a 10 Early October, 2008 40 21 18 1 50 36 14 * n/a n/a 10 Late September, 2008 42 23 19 * 49 33 15 1 n/a n/a 9 Mid-September, 20082
Late March, 2004 11 40 3=54% Mid-March, 2004 11 44 2=57% Late February, 2004 10 43 3=56% Early February, 2004 10 41 2=53% November, 2000 8 44 7=59% Late October, 2000 10 41 4=55% Mid-October, 2000 12 40 5=57% Early October, 2000 11 39 7=57% September, 2000 15 38 6=59% Mid-June, 2000 15 33 6=54% Dole November, 1996 8 54 6=68% October, 1996 11 51 4=66% Late September, 1996 16 44 5=65% Early September, 1996 14 47 5=66% July, 1996 15 40 3=58% Bush Sr. Late October, 1992 11 53 2=66% Early October, 1992 13 46 6=65% September, 1992 12 44 6=62% August, 1992 15 45 4=64% May, 1992 8 40 5=53% ASK IF RESPONDENT DID NOT CHOOSE OBAMA IN Q.10/10a (Q.10=2 OR Q.10a=2,3,9): RANDOMIZE Q.12a AND Q.12b Q.12b Do you think there is a chance that you might vote for Barack Obama in November, or have you
definitely decided not to vote for him? BASED ON REGISTERED VOTERS [N=2373]: Chance might Decided not (VOL.) vote for to vote for DK/Ref Obama Jun 28-Jul 9, 2012 6 41 3=50% Jun 7-17, 2012 6 42 2=50% Apr 4-15, 2012 6 42 3=51% November, 2008 6 38 6=50% Late October, 2008 7 35 6=48% Mid-October, 2008 8 35 5=48% Early October, 2008 7 38 5=50%
3 In June 2004, May 2004, Late March 2004, Mid-March 2004, Mid-June 2000 and July 1996 the head-to-head match-up
was asked both as a three-way and a two-way trial heat. In those surveys, this question followed the two-way trial heat.
Late March, 2004 13 37 3=53% Mid-March, 2004 13 32 3=48% Late February, 2004 13 36 3=52% Early February, 2004 15 33 5=53% Gore November, 2000 8 41 6=55% Late October, 2000 9 44 4=57% Mid-October, 2000 10 40 5=55% Early October, 2000 11 38 7=56% September, 2000 13 35 5=53% June, 2000 14 34 6=54% Clinton November, 1996 6 37 6=49% October, 1996 10 35 4=49% Late September, 1996 11 35 3=49% Early September, 1996 10 34 4=48% July, 1996 8 36 4=48% Late October, 1992 11 43 2=56% Early October, 1992 14 32 6=52% September, 1992 12 28 6=46% August, 1992 14 26 3=43% May, 1992 11 38 6=55%
4 In June 2004, May 2004, Late March 2004, Mid-March 2004, Mid-June 2000 and July 1996 the head-to-head match-up
was asked both as a three-way and a two-way trial heat. In those surveys, this question followed the two-way trial heat.
38
www.people-press.org
ASK ALL: Q.13 Which ONE of the following issues matters most to you in deciding your vote for president this year?
[READ AND RANDOMIZE] BASED ON REGISTERED VOTERS [N=2373]: Jun 28-Jul 9 Jun 7-17 2012 2012 33 Jobs 35 22 Health care 19 19 The budget deficit 23 11 Social Security 11 4 Gay marriage 4 4 Immigration 5 3 Other (VOL.) 2 3 Don’t know/Refused (VOL.) 2 NO QUESTIONS 14-17 ASK ALL REGISTERED VOTERS (REGICERT=1) OR (REG=1): Q.18 Regardless of who you support, which one of the presidential candidates — [RANDOMIZE ORDER
OF CANDIDATES: Mitt Romney or Barack Obama] — do you think would do the best job of [INSERT ITEM; RANDOMIZE; OBSERVE FORM SPLITS]? And who do you think would do the best job of [INSERT NEXT ITEM]? IF RESPONDENT MENTIONS ANYONE OTHER THAN ROMNEY OR OBAMA PROBE ONCE: "If you had to choose between Romney and Obama. . . "?]
5 In 2012 the word “federal” was added to the question.
41
www.people-press.org
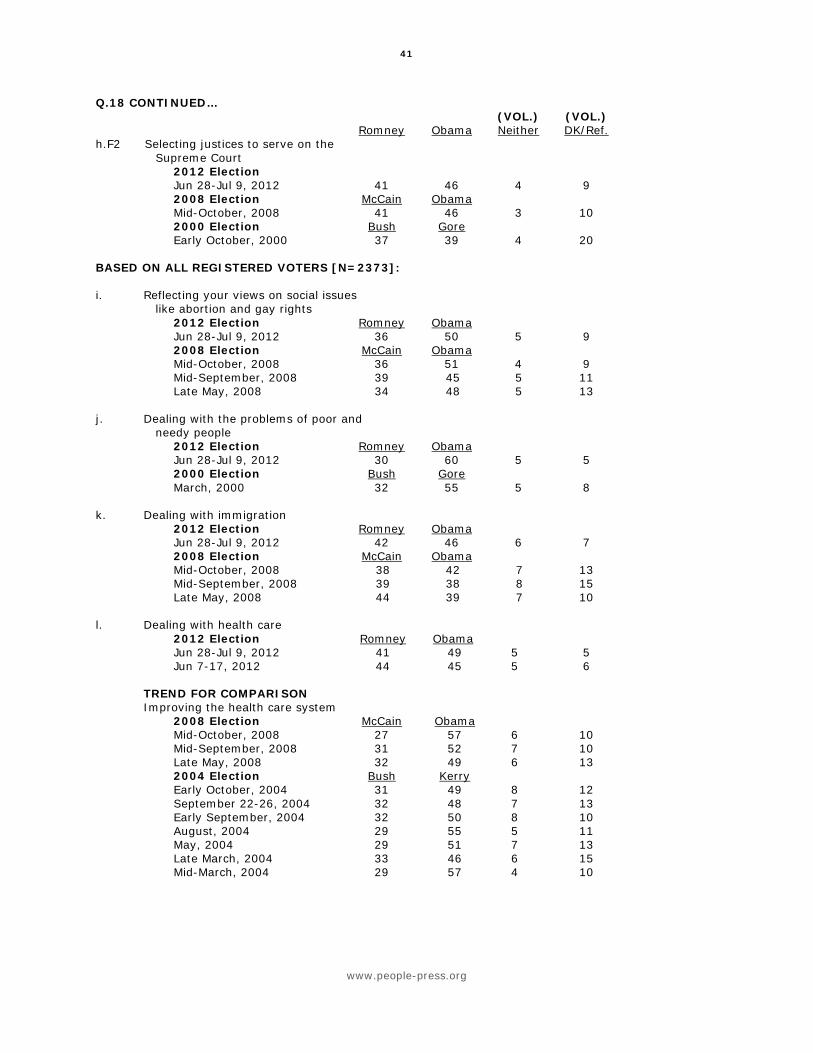
Q.18 CONTINUED… (VOL.) (VOL.) Romney Obama Neither DK/Ref. h.F2 Selecting justices to serve on the
Supreme Court 2012 Election Jun 28-Jul 9, 2012 41 46 4 9 2008 Election McCain Obama Mid-October, 2008 41 46 3 10 2000 Election Bush Gore Early October, 2000 37 39 4 20 BASED ON ALL REGISTERED VOTERS [N=2373]: i. Reflecting your views on social issues like abortion and gay rights 2012 Election Romney Obama Jun 28-Jul 9, 2012 36 50 5 9 2008 Election McCain Obama Mid-October, 2008 36 51 4 9 Mid-September, 2008 39 45 5 11 Late May, 2008 34 48 5 13 j. Dealing with the problems of poor and needy people 2012 Election Romney Obama Jun 28-Jul 9, 2012 30 60 5 5 2000 Election Bush Gore March, 2000 32 55 5 8 k. Dealing with immigration 2012 Election Romney Obama Jun 28-Jul 9, 2012 42 46 6 7 2008 Election McCain Obama Mid-October, 2008 38 42 7 13 Mid-September, 2008 39 38 8 15 Late May, 2008 44 39 7 10 l. Dealing with health care 2012 Election Romney Obama Jun 28-Jul 9, 2012 41 49 5 5 Jun 7-17, 2012 44 45 5 6 TREND FOR COMPARISON Improving the health care system 2008 Election McCain Obama Mid-October, 2008 27 57 6 10 Mid-September, 2008 31 52 7 10 Late May, 2008 32 49 6 13 2004 Election Bush Kerry Early October, 2004 31 49 8 12 September 22-26, 2004 32 48 7 13 Early September, 2004 32 50 8 10 August, 2004 29 55 5 11 May, 2004 29 51 7 13 Late March, 2004 33 46 6 15 Mid-March, 2004 29 57 4 10
42
www.people-press.org
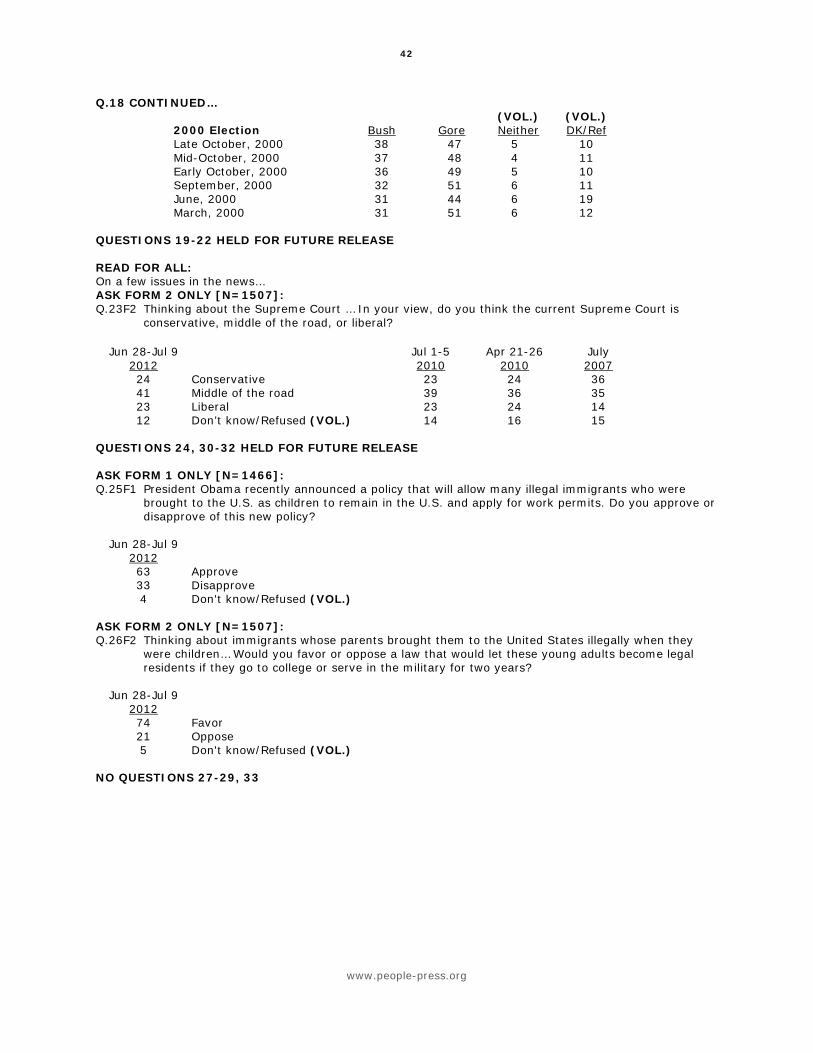
Q.18 CONTINUED… (VOL.) (VOL.) 2000 Election Bush Gore Neither DK/Ref Late October, 2000 38 47 5 10 Mid-October, 2000 37 48 4 11 Early October, 2000 36 49 5 10 September, 2000 32 51 6 11 June, 2000 31 44 6 19 March, 2000 31 51 6 12 QUESTIONS 19-22 HELD FOR FUTURE RELEASE READ FOR ALL: On a few issues in the news… ASK FORM 2 ONLY [N=1507]: Q.23F2 Thinking about the Supreme Court … In your view, do you think the current Supreme Court is
conservative, middle of the road, or liberal? Jun 28-Jul 9 Jul 1-5 Apr 21-26 July 2012 2010 2010 2007 24 Conservative 23 24 36 41 Middle of the road 39 36 35 23 Liberal 23 24 14 12 Don’t know/Refused (VOL.) 14 16 15 QUESTIONS 24, 30-32 HELD FOR FUTURE RELEASE ASK FORM 1 ONLY [N=1466]: Q.25F1 President Obama recently announced a policy that will allow many illegal immigrants who were
brought to the U.S. as children to remain in the U.S. and apply for work permits. Do you approve or disapprove of this new policy?
Jun 28-Jul 9 2012 63 Approve 33 Disapprove 4 Don't know/Refused (VOL.) ASK FORM 2 ONLY [N=1507]: Q.26F2 Thinking about immigrants whose parents brought them to the United States illegally when they
were children… Would you favor or oppose a law that would let these young adults become legal residents if they go to college or serve in the military for two years?
Jun 28-Jul 9 2012 74 Favor 21 Oppose 5 Don't know/Refused (VOL.) NO QUESTIONS 27-29, 33
43
www.people-press.org
ASK ALL: Thinking about the health care debate… Q.34 Do you approve or disapprove of the health care legislation passed by Barack Obama and Congress
in 2010? ASK IF APPROVE OR DISAPPROVE (Q.34=1,2) Q.35 Do you [approve/disapprove] very strongly, or not so strongly? Very Not so (VOL.) Dis- Very Not so (VOL.) (VOL.) Approve strongly strongly DK/Ref approve strongly strongly DK/Ref DK/Ref Jun 28-Jul 9, 2012 47 31 15 1 43 33 10 * 9 Jun 7-17, 2012 43 26 17 1 48 35 13 * 9 Apr 4-15, 2012 41 -- -- -- 49 -- -- -- 10 Mar 7-11, 2012 47 -- -- -- 45 -- -- -- 8 Jan 5-9, 20116
TREND FOR COMPARISON As of right now, do you generally favor or generally oppose the health care bills being discussed in Congress? IF FAVOR OR OPPOSE: Do you (favor/oppose) these health care bills very strongly, or not so strongly? 7
Generally Very Not so (VOL.)Generally- Very Not so (VOL.) (VOL.) favor strongly strongly DK/Ref oppose strongly strongly DK/Ref DK/Ref Mar 11-21, 2010 40 -- -- -- 47 -- -- -- 13 Mar 10-14, 2010 38 -- -- -- 48 -- -- -- 13 Feb 3-9, 2010 38 -- -- -- 50 -- -- -- 12 Jan 6-10, 2010 39 23 14 2 48 36 11 1 13 Dec 9-13, 2009 35 -- -- -- 48 -- -- -- 17 Nov 12-15, 2009 42 -- -- -- 39 -- -- -- 19 Oct 28-Nov 8, 2009 38 -- -- -- 47 -- -- -- 15 Sep 30-Oct 4, 2009 34 20 13 1 47 35 11 1 19 Sep 10-15, 2009 42 29 11 2 44 34 10 * 14 Aug 20-27, 2009 39 25 13 1 46 34 12 1 15 Jul 22-26, 2009 38 -- -- -- 44 -- -- -- 18 NO QUESTIONS 36-39 QUESTIONS 40-97 HELD FOR FUTURE RELEASE
6 In January 2011 the question asked about legislation passed “last year,” and in November 2010 it read “earlier this year.”
In September, August and July the question asked about legislation passed “in March.” In April, the question asked about the legislation passed “last month.”
7 From December 9-13, 2009 and earlier, questions asked about “health care proposals” rather than “health care bills.”
8 In the February 2-7, 2011 survey and before, question read “…do you strongly agree, agree, disagree or strongly
disagree with the Tea Party movement…” In October 2010 and earlier, question was asked only of those who had heard or read a lot or a little about the Tea Party. In May 2010 through October 2010, it was described as: “the Tea Party movement that has been involved in campaigns and protests in the U.S. over the past year.” In March 2010 it was described as ”the Tea Party protests that have taken place in the U.S. over the past year.”
46
www.people-press.org
PEW RESEARCH CENTER July 5-8, 2012, OMNIBUS
FINAL TOPLINE N=1,004
PEW.1 HELD FOR FUTURE RELEASE NO QUESTION PEW.2 ASK ALL: Now thinking about recent economic news… PEW.3 Are you hearing mostly good news about the economy these days, mostly bad news about the
economy or a mix of both good and bad news?
Hearing mostly
good news
Hearing mostly
bad news
A mix of good and bad news
(VOL.) DK/Ref
July 5-8, 2012 4 40 55 2 May 31-June 3, 2012 3 37 57 3 May 3-6, 2012 6 32 60 2 April 5-8, 2012 11 30 57 2 March 8-11, 2012 11 24 62 2 February 2-5, 2012 8 30 59 3 January 5-8, 2012 9 30 60 1 December 1-4, 2011 6 36 56 1 November 10-13, 2011 3 48 48 1 October 6-9, 2011 1 58 39 2 September 1-4, 2011 2 61 35 1 August 4-7, 2011 1 67 30 2 July 7-10, 2011 3 49 46 2 June 2-5, 2011 2 46 50 1 May 12-15, 2011 6 35 56 2 March 31-April 3, 2011 5 33 60 2 March 3-6, 2011 7 38 53 2 February 3-6, 2011 6 29 64 1 January 6-9, 2011 7 24 68 1 December 2-5, 2010 4 39 55 1 November 11-14, 2010 5 41 53 2 October 7-10, 2010 6 39 53 2 September 2-6, 2010 3 41 54 2 August 5-8, 2010 4 38 55 3 July 1-5, 2010 3 42 54 1 June 10-13, 2010 4 30 65 1 May 7-10, 2010 4 29 66 1 April 1-5, 2010 6 28 66 * March 5-8, 2010 4 30 66 1 February 5-8, 2010 4 35 61 * January 8-11, 2010 5 29 65 1 December 4-7, 2009 7 33 59 1 October 30-November 2, 2009 5 31 62 2 October 9-12, 2009 6 27 66 1 September 3-6, 2009 5 27 68 1 August 7-10, 2009 11 29 59 1 July 2-5, 2009 3 41 56 * June 12-15, 2009 4 37 59 * May 8-11, 2009 4 31 64 1 April 9-13, 2009 4 39 56 1 March 13-16, 2009 2 51 46 1 February 13-16, 2009 2 60 37 1 January 16-19, 2009 2 67 30 1 December 5-8, 2008 1 80 19 *
47
www.people-press.org
ASK ALL: PEW.4 Thinking about some specific aspects of the nation’s economy… Please tell me if you are hearing
mostly good news, mostly bad news or a mix of both good and bad news about each of the following. [READ AND RANDOMIZE]
Hearing
mostly good news
Hearing mostly
bad news
A mix of good and bad news
(VOL.) DK/Ref
a. The financial markets July 5-8, 2012 6 35 50 8 May 31-June 3, 2012 5 47 42 6 March 8-11, 2012 15 29 48 8 November 10-13, 2011 4 50 41 5 August 4-7, 2011 2 69 25 4 June 2-5, 2011 5 40 45 9 May 12-15, 2011 11 33 45 11 March 31-April 3, 2011 13 30 51 6 March 3-6, 2011 12 33 47 8 February 3-6, 2011 17 31 46 6 December 2-5, 2010 13 38 44 4 September 2-6, 2010 9 43 40 8 July 1-5, 2010 4 46 44 6 May 7-10, 2010 6 41 49 3 April 1-5, 2010 15 30 50 6 March 5-8, 2010 11 26 59 4 January 8-11, 2010 16 32 47 6 October 30-November 2, 2009 12 33 48 7 August 7-10, 2009 20 31 43 6 June 12-15, 2009 9 43 45 3
b. Real estate values
July 5-8, 2012 14 39 41 7 May 31-June 3, 2012 14 43 36 6 March 8-11, 2012 9 39 42 10 November 10-13, 2011 6 55 32 7 August 4-7, 2011 4 63 27 6 June 2-5, 2011 7 56 28 9 May 12-15, 2011 9 45 35 11 March 31-April 3, 2011 6 48 38 8 March 3-6, 2011 8 46 36 10 February 3-6, 2011 8 51 34 7 December 2-5, 2010 6 62 28 4 September 2-6, 2010 6 57 32 5 July 1-5, 2010 9 49 35 7 May 7-10, 2010 12 41 42 5 April 1-5, 2010 12 44 38 6 March 5-8, 2010 8 45 42 5 January 8-11, 2010 11 43 40 5 October 30-November 2, 2009 13 43 37 6 August 7-10, 2009 11 40 41 7 June 12-15, 2009 11 45 40 3
c. Prices for food and consumer goods
July 5-8, 2012 9 45 40 6 May 31-June 3, 2012 7 46 40 7 March 8-11, 2012 7 50 38 6 November 10-13, 2011 5 52 36 7 August 4-7, 2011 4 62 28 5 June 2-5, 2011 5 58 30 6
48
www.people-press.org
PEW.4 CONTINUED…
Hearing mostly
good news
Hearing mostly
bad news
A mix of good and bad news
(VOL.) DK/Ref
May 12-15, 2011 3 58 32 6 March 31-April 3, 2011 3 59 34 4 March 3-6, 2011 7 62 26 5 February 3-6, 2011 7 49 39 5 December 2-5, 2010 16 41 39 5 September 2-6, 2010 12 35 42 10 July 1-5, 2010 9 32 48 10 May 7-10, 2010 8 37 46 9 April 1-5, 2010 10 35 46 9 March 5-8, 2010 9 34 50 7 January 8-11, 2010 12 37 45 6 October 30-November 2, 2009 12 39 42 7 August 7-10, 2009 10 36 46 9 June 12-15, 2009 9 39 46 6
d. The job situation
July 5-8, 2012 9 51 38 3 May 31-June 3, 2012 8 55 35 2 March 8-11, 2012 17 38 42 3 December 1-4, 2011 10 51 37 2 November 10-13, 2011 5 64 28 2 August 4-7, 2011 4 74 21 2 June 2-5, 2011 5 58 34 3 May 12-15, 2011 9 51 37 3 March 31-April 3, 2011 12 43 42 2 March 3-6, 2011 10 50 37 3 February 3-6, 2011 9 52 37 2 December 2-5, 2010 6 66 27 1 September 2-6, 2010 5 65 28 2 July 1-5, 2010 5 64 30 1 May 7-10, 2010 9 52 38 2 April 1-5, 2010 9 56 33 2 March 5-8, 2010 5 59 35 1 January 8-11, 2010 6 61 31 2 October 30-November 2, 2009 3 68 27 2 August 7-10, 2009 6 61 32 1 June 12-15, 2009 1 71 27 1
e. Gas prices
July 5-8, 2012 31 31 35 2 May 31-June 3, 2012 19 48 31 2 March 8-11, 2012 2 85 12 2 November 10-13, 2011 9 47 36 8 August 4-7, 2011 4 66 26 4 June 2-5, 2011 8 68 23 2 May 12-15, 2011 1 84 14 1 March 31-April 3, 2011 1 88 10 1 March 3-6, 2011 1 90 7 2 February 3-6, 2011 2 77 18 3