16
Issues by the Numbers Obamacare and the changing health care landscape: Current health care trends August 2015
Issues by the NumbersObamacare and the changing health care landscape: Current health care trendsAugust 2015

Contents
Obamacare and the changing health care landscape | 1
Spending growth has slowed but remains high | 1
How the money is spent | 3
Paying for health care | 5
Insurance coverage has expanded | 7
Employer cost for insurance | 8
Looking forward | 8
Appendix | 10
Endnotes | 12
About the author | 13
Issues by the Numbers
ii

WITH the last major legal challenge to the 2010 Patient Protection and Affordable
Care Act (ACA), a.k.a. Obamacare, recently settled by the Supreme Court, now is an appro-priate time to examine current trends in health care. Even though not all of these trends are directly attributable to provisions of the ACA, they will determine the act’s ultimate costs and benefits. In particular, with growth in health care spending slowing and the number of people with access to health insurance rising, the stage is set to see whether the United States can become a more efficient producer and consumer of health care.
Spending growth has slowed but remains high
In 2013, the United States spent $2.9 tril lion on health care.1 This is the world’s highest cost per capita, double the per-capita health care spending of Canada.2 Unfortunately, this high level of spending is not producing superior health outcomes. While life expectancy at birth is over 80 years in most of the industrialized nations in the Organisation for Economic Co-operation and Development, the OECD groups the United States with countries such as Chile and the Czech Republic that have a life
Obamacare and the changing health care landscape
Obamacare and the changing health care landscape: Current health care trends
1

expectancy of under 79 years. And the trend is moving in the wrong direction: In 1970, US life expectancy was one year above the OECD average; it is now more than one year below the average.3
One trend is positive: Growth in US health care spending has slowed over the last few years, ranging from 3.6 percent and 4.1 percent per year from 2009 through 2013, down from an annual average of 6.3 percent from 2004 through 2008 and an annual average of 8.0 per-cent from 1999 through 2003.4 Indeed, since 2009, US health care spending as a percent of gross domestic product (GDP) has held steady
at 17.4 percent, taking a post-recession break from earlier increases (figure 1). However, even with periods of relative stability, health care costs have grown over the last 20 years by 4.0 percent of GDP.
A recent study by researchers at the Centers for Medicare and Medicaid Services (CMS) disaggregates the growth in per-capita health care spending into three components: medical prices, age and sex factors, and a residual growth component that is attributable to use and inten-
sity. As shown in figure 2, even though the overall growth rate stayed fairly steady from 2009 through 2013, the blend of cost drivers changed dramatically. From 2009 through 2011, rising medical prices accounted for most of the total increase, while increased use/inten-sity was the driving factor in 2012 and 2013. In the three-year period from 2009 through 2011, medical prices drove expenditure growth
One trend is positive: Growth in US health care spending has slowed over the last few years.
Graphic: Deloitte University Press | DUPress.com
Source: Centers for Medicare & Medicaid Services, National Health Expenditure Accounts.
0
2
4
6
8
10
12
14
16
18
20
1960
1962
1964
1966
1968
1970
1972
1974
1976
1978
1980
1982
1984
1986
1988
1990
1992
1994
1996
1998
2000
2002
2004
2006
2008
2010
2012
Figure 1. US health expenditures as a percent of GDP, 1960–2013
n Recession years
Percent
Issues by the Numbers
2
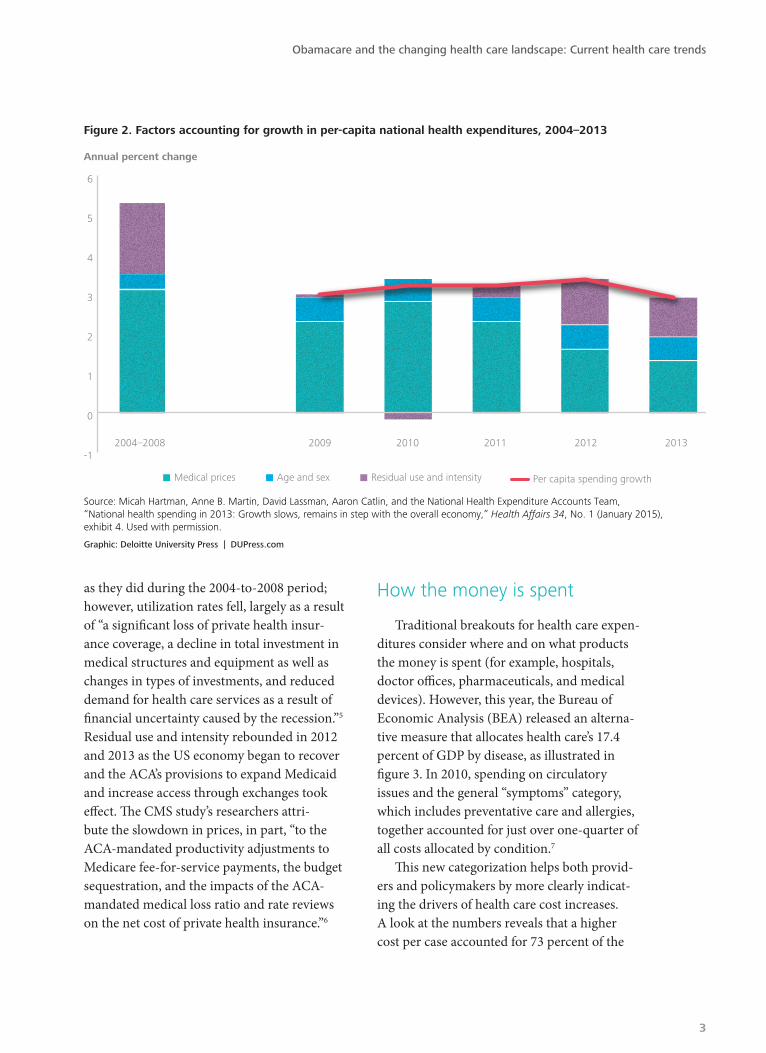
as they did during the 2004-to-2008 period; however, utilization rates fell, largely as a result of “a significant loss of private health insur-ance coverage, a decline in total investment in medical structures and equipment as well as changes in types of investments, and reduced demand for health care services as a result of financial uncertainty caused by the recession.”5 Residual use and intensity rebounded in 2012 and 2013 as the US economy began to recover and the ACA’s provisions to expand Medicaid and increase access through exchanges took effect. The CMS study’s researchers attri-bute the slowdown in prices, in part, “to the ACA-mandated productivity adjustments to Medicare fee-for-service payments, the budget sequestration, and the impacts of the ACA-mandated medical loss ratio and rate reviews on the net cost of private health insurance.”6
How the money is spent
Traditional breakouts for health care expen-ditures consider where and on what products the money is spent (for example, hospitals, doctor offices, pharmaceuticals, and medical devices). However, this year, the Bureau of Economic Analysis (BEA) released an alterna-tive measure that allocates health care’s 17.4 percent of GDP by disease, as illustrated in figure 3. In 2010, spending on circulatory issues and the general “symptoms” category, which includes preventative care and allergies, together accounted for just over one-quarter of all costs allocated by condition.7
This new categorization helps both provid-ers and policymakers by more clearly indicat-ing the drivers of health care cost increases. A look at the numbers reveals that a higher cost per case accounted for 73 percent of the
Graphic: Deloitte University Press | DUPress.com
Source: Micah Hartman, Anne B. Martin, David Lassman, Aaron Catlin, and the National Health Expenditure Accounts Team,“National health spending in 2013: Growth slows, remains in step with the overall economy,” Health Affairs 34, No. 1 (January 2015), exhibit 4. Used with permission.
-1
0
1
2
3
4
5
6
2004–2008 2009 2010 2011 2012 2013
n Medical prices n Age and sex n Residual use and intensity Per capita spending growth
Figure 2. Factors accounting for growth in per-capita national health expenditures, 2004–2013
Annual percent change
Obamacare and the changing health care landscape: Current health care trends
3

Graphic by Deloitte University Press after Bureau of Economic Analysis original | DUPress.com
Source: Bureau of Economic Analysis.
Diseases of the circulatory system
Symptoms; signs; and ill-defined conditions
Diseases of the musculoskeletal systemand connective tissue
Diseases of the respiratory system
Endocrine; nutritional; and metabolic diseasesand immunity disorders
Diseases of the nervous system and sense organs
Neoplasms
Diseases of the genitourinary system
Injury and poisoning
Diseases of the digestive system
Mental illness
Infectious and parasitic diseases
Diseases of the skin and subcutaneous organs
Complications of pregnancy; childbirth; and the puerperium
Other
Medical servicesby provider
Medical products, appliances, and equipment
17.4%
82.8%12.3%
4.9%
Health care
Services bycondition
13.6%
12.0%
9.9%
8.4%7.3%6.9%
6.7%
6.4%
6.4%
5.9%
4.6%
3.4%
2.2%
2.2%
4.1%
Figure 3. A breakout of national health care expenditures
2010 GDP
In 2010, spending on circulatory issues and the general “symptoms” category, which includes preventative care and allergies, together accounted for just over one-quarter of all costs allocated by condition.
Issues by the Numbers
4

per-capita spending growth between 2000 and 2010, with a rise in the number of treated cases contributing 27 percent.8 Thus, differ-ent methodologies notwithstanding, the CMS study and this new BEA satellite account agree that increased intensity—or a higher cost per case—is a major driver of health care cost growth.
Paying for health care
Health care is unique among consumer goods and services in the separation that exists between payers, decision makers, and ultimate beneficiaries. However, this situation is chang-ing, even for insured patients, as more plans now carry higher co-pays and/or deductibles. The Deloitte Center for Health Solutions’ 2015 health care consumer survey shows consumer
engagement trending upward on three sets of measures, supporting individuals’ transforma-tion from “passive patients and purchasers” to “active health care consumers”: partnering with providers in making treatment decisions, tapping online resources for information on treatments and doctors, and using technology to track personal health.9
Even with these shifts, 72 percent of health care costs are covered by insurance—a com-bination of private insurance and Medicare, Medicaid, and other government insurance plans. While most individuals covered by private plans do bear some of the cost of their own care (which can be substantial or even represent the total cost), nationally, the actual out-of-pocket cost directly related to care received is only 12 percent (figure 4).10
Graphic by Deloitte University Press after Centers for Medicare & Medicaid original, http://go.cms.gov/1gC6txN | DUPress.com
*Includes worksite health care, other private revenue, Indian Health Service, workers’ compensation, general assistance, maternal and child health, vocational rehabilitation, Substance Abuse and Mental Health Services Administration, school health, and other federal and state local programs.
**Includes co-payments, deductibles, and any amounts not covered by health insurance.
Note: Sum of pieces may not equal 100% due to rounding.
Source: Centers for Medicare & Medicaid Services, Office of the Actuary, National Health Statistics Group.
Figure 4. The nation’s health dollar ($2.9 trillion), 2013: Where it came from
72.0%
12.0%
8.0%
6.0%3.0%
Health insurance
Out of pocket**
Other third-party payers and programs*
Investment
Government public health activities
33.0%
20.0%
9.0%
7.0%
4.0%
Private health insurance
Medicare
Medicaid federal
Medicaid stateand local
Other federal(VA, DoD, CHIP)
Obamacare and the changing health care landscape: Current health care trends
5

n Out of pocket n Private health insurance n Medicare n Medicaid (Title XIX)
n Other public insurance n Other third-party payers and programs
3.5%
37.1%
25.9%
17.5%
5.8%
10.2%9.4%
45.6%
22.2%
8.5%
4.1% 10.1%
42.5%
47.4%
0.4%6.8%
0.5%
8.1%
43.1%
36.5%
1.4% 3.0%
16.9%
43.5%
27.5%
7.8%
3.3% 0.9%
29.4%
8.1%
22.2%
30.1%
2.9%
7.4%
2.4%
7.9%
Graphic: Deloitte University Press | DUPress.com
Source: Center for Medicare and Medicare, “National health expenditures,” December 2014.
Figure 5. Payment source by type of service
Physician and clinical$586.7 billion
Dental services$111.0 billion
Home health care$79.8 billion
Prescription drug$271.1 billion
Nursing and retirement facilities $155.8 billion
Hospitals$936.9 billion
The payment source varies substantially by type of service, as shown in figure 5. For example, only 3.5 percent of the cost paid to hospitals is “out of pocket,” while the comparable figure for visits to the dentist is 42.5 percent.
Issues by the Numbers
6

Insurance coverage has expanded
The ACA has several provisions aimed at increasing insurance coverage, including the expansion of Medicaid, the establishment of state health care marketplaces, and the provi-sion of subsidies to individuals to help them afford coverage through the marketplaces.
The ACA’s Medicaid expansion provision gives states federal funding to expand their Medicaid programs to cover adults under 65 with income up to 133 percent of the federal poverty level regardless of disability, family status, financial resources, and other factors that eligibility guidelines usually take into account; children age 18 and under in households up to that income level or higher are eligible in all states.11 At present, 29 states plus the District of Columbia have accepted Medicaid expansion, two are still deciding, and 19 have declined.12
The ACA also called for the establishment of state-level health care marketplaces to allow individuals and families the opportunity to purchase health insurance at group rates. States had a choice of setting up their own marketplace or deferring to the federal govern-ment. Currently, 13 states plus the District of Columbia have state-based marketplaces, three have federally supported marketplaces, seven have state partnership marketplaces, and 27 have federally facilitated marketplaces.13 To aid citizens purchasing health care plans from a marketplace, the ACA provides tax credits for those making under 400 percent of the federal poverty level, as well as subsidizing mid-level insurance plans to those making under 250 percent of the federal poverty level. A June 25, 2015 Supreme Court ruling confirmed the
federal government’s authority to offer sub-sidies to those purchasing insurance through federally run marketplaces;14 loss of this feature would have jeopardized the program’s viability.
According to the RAND Corporation, US insurance coverage has increased across all types of insurance since the major provisions of the ACA took effect, with a net total of
16.9 million people becoming newly enrolled between September 2013 and February 2015.15
The RAND study includes a breakdown of type of coverage, including the surprising observa-tion that the largest source of new coverage is traditional employer-sponsored plans. The primary findings include:
• From September 2013 to February 2015, 22.8 million Americans became newly insured and 5.9 million lost coverage, for a net gain of 16.9 million more insured.
• Among those newly gaining coverage, 9.6 million people enrolled in employer-spon-sored health plans, followed by Medicaid (6.5 million), the individual marketplaces (4.1 million), non-marketplace individual plans (1.2 million) and other insurance sources (1.5 million).
• Among the 12.6 million Americans newly enrolled in Medicaid, 6.5 million were previously uninsured and 6.1 million were previously insured.
From September 2013 to February 2015, 22.8 million Americans became newly insured and 5.9 million lost coverage, for a net gain of 16.9 million more insured.
Obamacare and the changing health care landscape: Current health care trends
7
• An estimated 11.2 million Americans are now insured through new state and federal marketplaces created under the ACA, including 4.1 million who are newly covered and 7.1 million people who transi-tioned to marketplace plans from another source of coverage.
• The study also estimates that 125.2 mil-lion Americans—about 80 percent of the non-elderly population that had insur-ance in September 2013—experienced no change in their source of insurance during the period.16
Employer cost for insurance
The ACA’s employer penalties for failure to provide affordable coverage come into effect this year for employers with 100 or more employees and in 2016 for employers with 50 or more employees. Most companies should see little impact, considering that in 2013, 95.7 percent of private-sector employers with 50 or more employees offered health insurance.17 However, the ACA sets out criteria for mini-mum coverage and/or affordability, with penal-ties for failing to meet these criteria, and some employers’ insurance plans fall short.
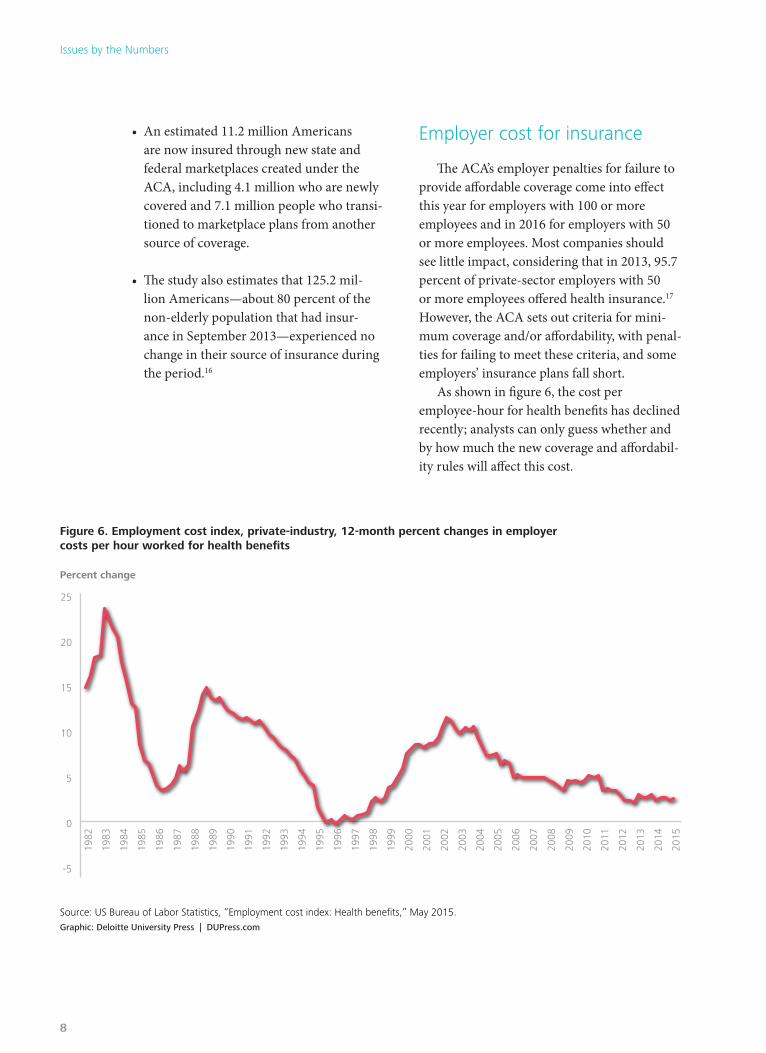
As shown in figure 6, the cost per employee-hour for health benefits has declined recently; analysts can only guess whether and by how much the new coverage and affordabil-ity rules will affect this cost.
Graphic: Deloitte University Press | DUPress.com
Source: US Bureau of Labor Statistics, “Employment cost index: Health benefits,” May 2015.
Figure 6. Employment cost index, private-industry, 12-month percent changes in employer costs per hour worked for health benefits
Percent change
-5
0
5
10
15
20
25
1982
1983
1984
1985
1986
1987
1988
1989
1990
1991
1992
1993
1994
1995
1996
1997
1998
1999
2000
2001
2002
2003
2004
2005
2006
2007
2008
2009
2010
2011
2012
2013
2014
2015
Issues by the Numbers
8
Looking forward
The ACA’s total impact is as yet unclear, as various parts of the legislation that will affect costs and benefits will continue to roll out in the months and years ahead. For example, the ACA provides for a Center for Medicare and Medicaid Innovation (“Innovation Center”), with a $10 billion budget over 10 years. The Innovation Center is tasked with testing inno-vative health care payment and service-deliv-ery models, with the potential to improve the quality of care and reduce Medicare, Medicaid, and Children’s Health Insurance Program (CHIP) expenditures.18 Many of these models emphasize value-based care rather than the traditional fee-for-service. If successful, these new models could provide more effective care at lower prices.19
Remaining parts of the ACA that are still awaiting implementation include:
• An increase in the federal match for CHIP of 23 percent up to a cap of 100 percent (scheduled for October 2015).
• Permission for states to form health care choice compacts allowing insurers to sell policies in any state participating in the compact (scheduled for January 2016).
• The institution of an excise tax on insurers of employer-sponsored health plans with aggregate expenses that exceed $10,200 for individual coverage and $27,500 for family coverage (the “Cadillac tax”; scheduled for January 2018).20
As a mechanism for increasing insurance coverage, the ACA has been largely successful (albeit some argue that a lower-cost system could have been devised). Another important test, however, will be the ACA’s impact on rein-ing in the cost or intensity of use per case—a major driver of rising health care costs—and obviously, we won’t know whether the system is functioning as intended until more informa-tion comes in over the coming months and years. Cost reduction efforts are key, since, according to the Congressional Budget Office (CBO), the cost to fund exchange or mar-ketplace subsidies and Medicare and CHIP expansion ($1.7 trillion) will be significantly higher than the revenue brought in by fines on employers and the uninsured and by excise taxes on high-premium insurance plans ($540 billion) over the next 10 years.21 However, CBO estimates of ACA’s cost cannot include some (potentially sizable) benefits that the legislation aims to generate, such as the CMS Innovation Center, that will not be felt for years but that could result in more effective and efficient spending on health care in the United States.
The ACA’s total impact is as yet unclear, as various parts of the legislation that will affect costs and benefits will continue to roll out in the months and years ahead.
Obamacare and the changing health care landscape: Current health care trends
9

AppendixObamacare and the changing health care landscape (infographic)
View the infographic online at: http://dupress.com/articles/current-trends-in-health-care-new-landscape-obamacare-infographic/
Issues by the Numbers
10

Obamacare and the changing health care landscape: Current health care trends
11

1. Center for Medicare and Medicare, “National health expenditures,” December 2014, www.cms.gov/Research-Statistics-Data-and-Systems/Statistics-Trends-and-Reports/NationalHeal-thExpendData/NationalHealthAccountsHistori-cal.html, accessed July 26, 2015.
2. Organisation for Economic Co-operation and Development, “OECD Health Statistics 2015,” July 7, 2015, http://stats.oecd.org/Index.aspx?DataSetCode=SHA.
3. Organisation for Economic Co-operation and Development, “Health care at a glance, 2013,” www.oecd-ilibrary.org/sites/health_glance-2013-en/01/01/index.html?contentType=&itemId=%2fcontent%2fchapter%2fhealth_glance-2013-5-en&mimeType=text%2fhtml&containerItemId=%2fcontent%2fserial%2f19991312&accessItemIds=, accessed July 10, 2015.
4. Center for Medicare and Medicare, “National health expenditures,” December 2014.
5. Micah Hartman, Anne B. Martin, David Lassman, Aaron Catlin, and the National Health Expenditure Accounts Team, “National health spending in 2013: Growth slows, remains in step with the overall economy,” Health Affairs 34, No. 1 (January 2015), pp. 150–60.
6. Ibid.
7. Abe Dunn, Lindsey Rittmueller, and Bryn Whitmire, “Introducing the new BEA health care satellite account,” Survey of Current Business, January 2015, www.bea.gov/scb/pdf/2015/01%20January/0115_bea_health_care_satellite_account.pdf, accessed July 26, 2015.
8. Ibid.
9. Deloitte Center for Health Care Solutions, 2015 Health Care Consumer Survey, “Con-sumer transformation is not one size fits all,” forthcoming.
10. Centers for Medicare and Medicaid Services, Office of the Actuary, National Health Statistics Group.
11. Health care.gov, “How the Medicaid expansion works,” www.health care.gov/medicaid-chip/medicaid-expansion-and-you/, accessed July 2, 2015.
12. Kaiser Family Foundation, “Status of state action on the Medicaid expansion decision,” http://kff.org/health-reform/state-indicator/state-activity-around-expanding-medicaid-under-the-affordable-care-act/, accessed July 2, 2015.
13. Kaiser Family Foundation, “State health insur-ance marketplace types,” http://kff.org/health-reform/state-indicator/state-health-insurance-marketplace-types/, accessed July 2, 2015.
14. Supreme Court of the United States, No 14-114, King et al. v. Burwell, Secretary of Health and Hu-man Services, et al, decided June 25, 2015, www.supremecourt.gov/opinions/14pdf/14-114_qol1.pdf
15. Katherine Grace Carman, Christine Eibner, and Susan M. Paddock, “Trends in health insurance enrollment, 2013-15,” RAND Corp., Health Affairs 34, No. 6 (June 2015), pp. 1044–48, www.rand.org/pubs/external_publications/EP50692.html, accessed July 26, 2015. These figures are comparable to the US Department of Health and Human Services’ estimate that 16.4 million people became newly insured through the first quarter of 2015; see “Health insurance cover-age and the Affordable Care Act,” May 2015 (data based on analysis of Gallup-Healthways Well-Being Index survey data through March 4, 2015), http://aspe.hhs.gov/health/reports/2015/uninsured_change/ib_uninsured_change.pdf, accessed July 26, 2015.
16. Carman, Eibner, and Paddock, “Trends in health insurance enrollment, 2013–15.”
17. Department of Health and Human Services, Agency for Health care Research and Quality, “Medical expenditure panel survey, table II. A.2,” http://meps.ahrq.gov/mepsweb/data_stats/summ_tables/insr/state/series_2/2013/tiia2.pdf, accessed July 2, 2015.
Endnotes
Issues by the Numbers
12

About the author
Dr. Patricia Buckley +1 571 814 6508 [email protected]
Dr. Patricia Buckley is director of economic policy and analysis at Deloitte Research, Deloitte Services LP.
18. HHS FY2015 Budget in Brief, Center for Medicare & Medicaid Innovation, http://www.hhs.gov/about/budget/fy2015/budget-in-brief/cms/innovation-programs/index.html, accessed July 26, 2015.
19. For more detail about value-based care, see Wendy Gerhardt, Leslie Korenda, Mitch Morris, and Gaurav Vadnerkar, “The road to value-based care,” Deloitte University Press, March 20, 2015, http://dupress.com/articles/value-based-care-market-shift/#sup-0, accessed July 26, 2015.
20. Kaiser Family Foundation, “Health reform implementation timeline,” http://kff.org/interac-tive/implementation-timeline/, accessed July 2, 2015.
21. Congressional Budget Office, “Updated budget projections: 2015 to 2025,” March 2015, www.cbo.gov/sites/default/files/cbofiles/attachments/49973-UpdatedBudgetProjections.pdf, accessed July 26, 2015.
Obamacare and the changing health care landscape: Current health care trends
13

About Deloitte University Press Deloitte University Press publishes original articles, reports and periodicals that provide insights for businesses, the public sector and NGOs. Our goal is to draw upon research and experience from throughout our professional services organization, and that of coauthors in academia and business, to advance the conversation on a broad spectrum of topics of interest to executives and government leaders.
Deloitte University Press is an imprint of Deloitte Development LLC.
About this publication This publication contains general information only, and none of Deloitte Touche Tohmatsu Limited, its member firms, or its and their affiliates are, by means of this publication, rendering accounting, business, financial, investment, legal, tax, or other professional advice or services. This publication is not a substitute for such professional advice or services, nor should it be used as a basis for any decision or action that may affect your finances or your business. Before making any decision or taking any action that may affect your finances or your business, you should consult a qualified professional adviser.
None of Deloitte Touche Tohmatsu Limited, its member firms, or its and their respective affiliates shall be responsible for any loss whatsoever sustained by any person who relies on this publication.
About Deloitte Deloitte refers to one or more of Deloitte Touche Tohmatsu Limited, a UK private company limited by guarantee, and its network of member firms, each of which is a legally separate and independent entity. Please see www.deloitte.com/about for a detailed description of the legal structure of Deloitte Touche Tohmatsu Limited and its member firms. Please see www.deloitte.com/us/about for a detailed description of the legal structure of Deloitte LLP and its subsidiaries. Certain services may not be available to attest clients under the rules and regulations of public accounting.
Copyright © 2015 Deloitte Development LLC. All rights reserved. Member of Deloitte Touche Tohmatsu Limited
Follow @DU_Press
Sign up for Deloitte University Press updates at DUPress.com.


