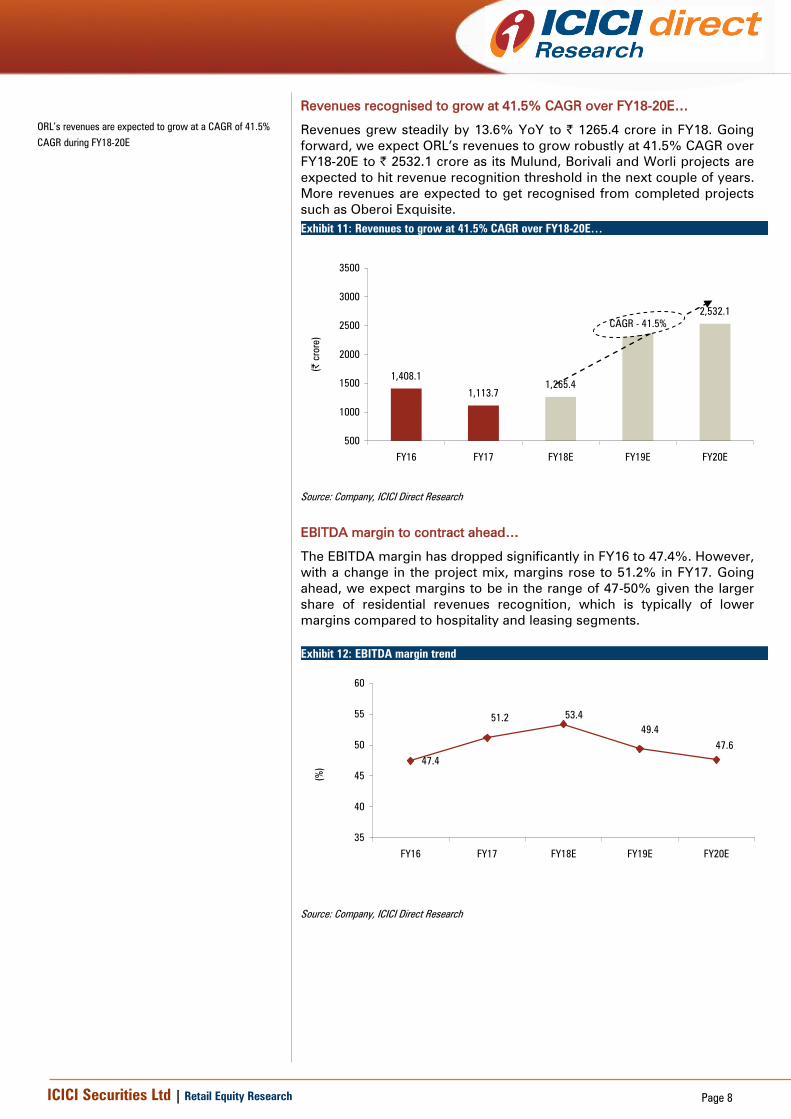
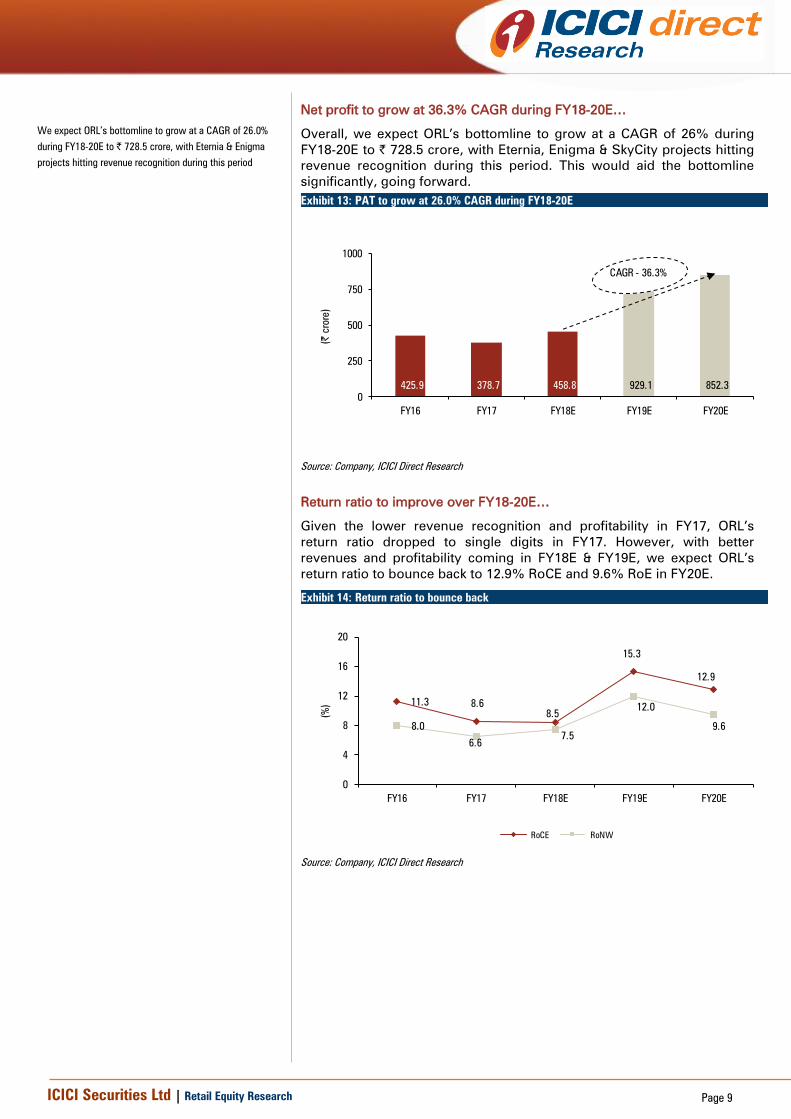
April 26, 2018
ICICI Securities Ltd | Retail Equity Research
Result Update
Healthy launch pipeline ahead…
Oberoi Realty's Q4FY18 sales performance was below our estimate
mainly due to subdued sales in Worli project. On the financials front,
the results were above our estimates on the topline, bottomline front
Oberoi Realty's (ORL) Q4FY18 sales volumes fell 13.6% sequentially
to 1.31 lakh sq ft with sales value of | 263.3 crore. Sales volume was
below our estimates of 1.66 lakh sq ft due to lower-than-expected
sales of 9562 sq ft in Worli project (our expectation: 50000 sq ft)
Revenues grew robustly by 19.1% YoY to | 345.0 crore and were
slightly above our estimate of | 338.3 crore
EBITDA margins expanded 80 bps YoY to 53.1% mainly on account
of a change in the project mix. It was below our expectation of 54.3%
PAT grew 40.4% YoY to | 142.9 crore (our estimate: | 114.4 crore)
primarily due to topline growth and EBITDA margin expansion
The board recommended a dividend of | 2
Sales volumes decline 13.6% QoQ to 1.31 lakh sq ft…
ORL’s sales volumes de-grew 13.6% QoQ to 1.31 lakh sq ft in Q4FY18 due
to the poor performance of the Worli project with sales volumes of 9562
sq ft (our expectation: 50000 sq ft). Overall, in FY18, sales volumes grew
3.9% YoY to 5.9 lakh sq ft. Going forward, the company a has strong
launch pipeline in FY19E, with launches planned at Thane, Exquisite III in
Goregaon and subsequent phases of Borivali, Mulund projects.
Consequently, we expect sales volumes could grow at a healthy pace of
53.8% CAGR from 0.6 msf in FY18 to 1.3 msf in FY20E.
Board passes enabling resolution…
The board has passed an enabling resolution to issue non-convertible
debentures up to | 1500 crore by way of private placement and also issue
equity shares and/or any other securities convertible into equity worth
~| 2000 crore including premium, by way of one or more qualified
institutions placement to qualified institutional buyers. The company
could raise and use these funds, going ahead, in case it sees some good
land acquisition opportunity in the market.
Revenue recognition from new projects to boost bottomline…
The management indicated the timelines for revenue recognition
threshold timelines for different projects. It expects SkyCity to reach
threshold in H1FY19, Eternia in H1FY19E, Enigma in Q2/Q3FY19E.
Consequently, we expect the company to post healthy topline, PAT
growth of 41.5%, 26.0% CAGR to | 2532.1 crore, | 728.5 crore,
respectively, over FY18-20E.
Occupancy to improve in Commerz II in FY19E…
Recently, for Commerz II, the company has leased four more floors worth
0.7 lakh sq ft taking occupancy to ~63-64% (47.4% in Q4FY18). For the
Worli mall (on Glaxo land), work has started. ORL plans to complete it by
2020. The Borivali mall is at the design stage while some excavation work
has started.
Await better entry point; maintain HOLD…
We like the company given the quality of land bank, its healthy balance
sheet and management bandwidth to execute large projects. However,
the sales momentum for ORL has been sluggish. Also, the stock has run
up ~41% in the last one year. Hence, we await a better entry point.
Consequently, we continue to maintain our HOLD recommendation on
the stock with a revised target price of | 550.
Rating matrix
Rating : Hold
Target : | 550
Target Period : 12 months
Potential Upside : -4%
What’s Changed?
Target Changed from | 490 to | 550
EPS FY19E Changed from | 27.7 to | 24.3
EPS FY20E Changed from | 24.0 to | 21.5
Rating Unchanged
Quarterly Performance
| crore Q4FY18 Q4FY17 YoY (%) Q3FY18 QoQ (%)
Revenue 344.9 289.5 19.1 356.2 -3.2
EBITDA 183.3 151.5 21.0 192.6 -4.8
EBITDA (%) 53.1 52.3 83 bps 54.1 -93 bps
PAT 142.9 101.8 40.3 120.2 18.9
Key Financials
| Crore FY17 FY18E FY19E FY20E
Net Sales 1,113.7 1,265.4 2,674.1 2,532.1
EBITDA 569.9 675.3 1,320.6 1,204.8
Net Profit 378.7 458.8 929.1 852.3
EPS (|) 11.2 13.5 27.4 25.1
Valuation summary
(x) FY17 FY18E FY19E FY20E
P/E 51.2 42.3 20.9 22.7
Target P/E 49.3 40.7 20.1 21.9
EV / EBITDA 31.7 27.3 13.0 14.2
P/BV 3.4 3.2 2.8 2.5
RoNW (%) 6.6 7.5 12.0 9.6
RoCE (%) 8.6 8.5 15.3 12.9
Stock data
Particular Amount (| crore)
Market Capitalization 19,387.5
Total Debt 901.6
Cash 1,763.0
EV 18,526.1
52 week H/L (|) 609 / 339
Equity capital 328.2
Face value (|) 10.0
Price performance (%)
Return % 1M 3M 6M 12M
Sunteck Realty 12.2 10.1 23.5 105.8
Oberoi Realty 21.0 4.2 21.7 40.9
Sobha Ltd 16.3 (4.6) 1.3 39.3
Mahindra Lifespace 7.9 (13.3) (3.6) 12.2
BSE Realty 8.1 (10.8) 9.2 21.8
Research Analyst
Deepak Purswani, CFA
Vaibhav Shah
Oberoi Realty (OBEREA) | 571
ICICI Securities Ltd | Retail Equity Research Page 2
Variance analysis [
Q4FY18 Q4FY18E Q4FY17 YoY (Chg %) Q3FY18 QoQ (Chg %) Comments
Income from Operation 344.9 338.3 289.5 19.1 356.2 -3.2 Revenues grew robustly on acount of strong execution
Other Income 7.9 4.2 12.5 -36.9 4.2 89.2
Operating Cost 132.0 129.7 109.8 20.1 137.1 -3.8
Employee cost 15.7 14.1 17.0 -7.7 15.0 4.9
Other expenditure 14.0 10.9 11.3 24.4 11.5 21.4
EBITDA 183.3 183.6 151.5 21.0 192.6 -4.8
EBITDA Margin (%) 53.1 54.3 52.3 83 bps 54.1 -93 bps The EBITDA margin expansion was led by change in project mix
Depreciation 11.8 12.3 12.3 -4.2 12.2 -3.7
Interest 1.9 1.6 1.4 30.6 1.8 4.4
PBT 177.6 173.9 150.2 18.2 182.8 -2.9
Taxes 35.7 60.5 49.2 -27.4 63.5 -43.8
PAT 142.9 114.4 101.8 40.3 120.2 18.9 Robust PAT growth was led by strong topline growth and EBITDA margin
expansion
Key Metrics
Sales Volume (in sq ft) 131,052 166,500 135,396 -3.2 151,763 -13.6 Sales volumes de-growth was on account of poor sales performance at Worli
project
Source: Company, ICICI Direct Research
Change in estimates
FY20E
(| Crore) Actual Old New % Change Old New % Change Comments
Revenue 1265.4 2983.9 2674.1 -10.4 2835.7 2532.1 -10.7 We lower our sales volume assumption due to slower-than-expected
absorption
EBITDA 675.3 1491.2 1320.6 -11.4 1331.0 1204.8 -9.5
EBITDA Margin (%) 53.4 50.0 49.4 -62 bps 46.9 47.6 68 bps
PAT 458.8 940.7 929.1 -1.2 814.0 852.3 4.7
EPS (|) 13.5 27.7 27.4 -1.2 24.0 25.1 4.7
FY18 FY19E
Source: Company, ICICI Direct Research
Assumptions
FY16 FY17 FY18E FY19E FY19E FY20E FY20E Comments
Volume sold in msf New Earlier New Earlier
Goregaon 0.2 0.1 0.2 0.3 0.5 0.3 0.2
Andheri/Borivali 1.1 0.2 0.2 0.3 0.5 0.4 0.6
Worli 0.0 0.2 0.1 0.2 0.2 0.3 0.2
Mulund 0.0 0.1 0.1 0.1 0.3 0.1 0.4
Pune 0.0 0.0 0.0 0.1 0.2 0.2 0.2
Total 1.3 0.6 0.6 1.0 1.6 1.3 1.5 We now factor in persistant weakness in demand
enviromentSource: Company, ICICI Direct Research Source: Company, ICICI Direct Research
ICICI Securities Ltd | Retail Equity Research Page 3
Conference call highlights:
Commerz II update: The company has leased four more floors
with a leasable area of 0.7 lakh sq ft, which will take the
occupancy to ~63-64% (47.5% in Q4FY18)
Esquire project: The company has received full occupational
certificate for Esquire project on April 27, 2018
Thane project: The company is still in the process of acquiring the
Thane land. It is looking to launch the project in September-
October, 2018. Currently, design and planning is going on
Mall update: For both Borivali and Worli malls, site preparation is
going on and the work order has been given
Goregaon project: The company is looking to launch Exquisite
Phase III in Goregaon in September-October 2018. Also,
construction work has been given to L&T while the management
expects the project to be completed over the next three to four
years
Revenue recognition threshold: The company expects SkyCity
and Eternia projects to hit the revenue recognition threshold in
H1FY19E, Enigma in Q2/Q3FY19E
New marketing scheme timelines: The company received a
strong response to the new marketing scheme launched for its
completed projects, Esquire and Exquisite
ICICI Securities Ltd | Retail Equity Research Page 4
Company Analysis
Sales volumes grow robustly…
Oberoi reported a subdued sales performance with sales volumes de-
growing 13.6% QoQ to 1.31 lakh sq ft in Q4FY18 with sales value of
| 263.3 crore. The weak sales performance was mainly on account of
poor sales at the Worli project, which reported sales volumes of 9562 sq
ft. However, on a positive note, the company reported a strong sales
performance at the Borivali project, which recorded sales volumes of
54564 sq ft in Q4FY18. Going forward, ORL would look to launch a project
in Thane and subsequent phases of Borivali and Mulund projects. Also, in
early FY19E, it is planning to launch the third phase of the Goregaon
project Consequently, we expect sales volumes to grow from 0.6 msf in
FY18 to 1.3 msf in FY20E.
Exhibit 1: Sales volume picking up
1.4 1.4
7
1.7
7
1.3
5
0.9
8
1.5
2
1.3
1
1.0
6
1.7
3
0.5
1.0
1.5
2.0
2.5
Q4FY16
Q1FY17
Q2FY17
Q3FY17
Q4FY17
Q1FY18
Q2FY18
Q3FY18
Q4FY18
(la
kh s
q f
t)
Source: Company, ICICI Direct Research
Exhibit 2: Sales volumes to improve from here on…
0.2 0.2 0.1 0.20.3 0.30.0
0.1
0.30.4
0.1
0.2
0.30.1
0.10.1
0.2
0.3
1.0
1.3
0.6 0.6
1.0
1.3
0.2
1.1
0.2
0.0
0.5
1.0
1.5
2.0
FY14 FY15 FY16 FY17 FY18 FY19E FY20E
(m
n s
q f
t)
Goregaon Andheri/Borivali Worli Mulund Pune
Source: Company, ICICI Direct Research
Launches in Borivali, Mulund to adversely impact overall realisation…
ORL’s average realisation has been at a higher level mainly due to the
higher proportion of Oberoi Exquisite and Oberoi Esquire projects.
However, going ahead, with higher proportion of sales volume to be
derived from its Mulund and Borivali projects, we expect average
realisation to come down from current levels.
Exhibit 3: Quarterly average realisation trend
23,556
19,153
22,644
18,303
23,556
22,644
17,233
23,499
19,671
22,644
17,011
23,499
19,671
22,644
17,519
19,153
10,000
15,000
20,000
25,000
30,000
Goregaon
(Exquisite)
Goregaon
(Escquire)
Andheri Overall
(|
per sq ft)
Q1FY18 Q2FY18 Q3FY18 Q4FY18
Source: Company, ICICI Direct Research
Exhibit 4: Annual realisation trend across projects
10,000
15,000
20,000
25,000
30,000
Goregaon
(Exquisite)
Goregaon
(Escquire)
Mulund Borivali Overall
(|
per sq ft)
FY16 FY17 FY18 FY19E FY20E
Source: Company, ICICI Direct Research
ICICI Securities Ltd | Retail Equity Research Page 5
Exhibit 5: Ongoing residential projects operational metrics
Particulars Q4FY18 Q3FY18 Q2FY18 Q1FY18 Q4FY17 Q3FY17
Area Booked (sq ft)
Oberoi Esquire 42248 24432 50051 21106 21106 28016
Oberoi Exquisite 3640 17550 5330 6890 6890 1820
Three Sixty West 9562 47479 15020 45427 45427 28686
Priviera - - - - - -
Prisma 8778 8595 8958 12364 12364 2602
Eternia 6900 6680 21270 13140 13140 6240
Enigma 5360 0 16860 10107 10107 3070
Sky City 54564 47027 55914 26362 26362 35780
Total 131,052 151,763 173,403 135,396 135,396 106,214
Sales Value (| crore)
Oberoi Esquire 206.2 48.1 103.0 38.2 38.2 53.7
Oberoi Exquisite 12.3 41.2 12.8 16.2 16.2 4.4
Three Sixty West 148.2 214.7 76.1 187.8 187.8 131.1
Priviera - - - - - -
Prisma 40.1 15.2 16.1 22.3 22.3 4.5
Eternia 27.8 10.3 32.1 20.7 20.7 9.9
Enigma 27.1 - 25.3 16.9 16.9 5.3
Sky City 84.9 76.9 88.0 43.3 43.3 58.6
Average Realization for the quarter (|/sq ft)
Oberoi Esquire 48,812 19,671 20,583 18,113 18,113 19,153
Oberoi Exquisite 33,874 23,499 23,996 23,556 23,556 24,231
Three Sixty West 155,020 45,222 50,646 41,341 41,341 45,691
Priviera** - - - - - -
Prisma 45,660 17,708 17,962 18,012 18,012 17,333
Eternia 40,319 15,359 15,068 15,769 15,769 15,817
Enigma - - 14,994 16,721 16,721 17,296
Sky City 15,554 16,342 15,740 16,421 16,421 16,383
Project Completion (%)
Oberoi Esquire 93.4 88.3 82.2 71.4 71.4 63.8
Oberoi Exquisite 100 100 100 100 100 100
Three Sixty West * * * * * *
Priviera 100 100 100 100 100 100
Prisma 82.7 74.0 62.0 58.1 58.1 55.8
Eternia * * * * * *
Enigma * * * * * *
Sky City * * * * * *
Inventory as on Date (sq ft)
Oberoi Exquisite 145435 149075 166625 185865 187685 192755
Three Sixty West 1929009 1938571 1986050 1442777 1471463 1488204
Priviera ** 0 0 0 0 2350 2350
Prisma 59739 68517 77112 89248 91850 101612
Eternia# 273910 280810 287490 311880 318120 325020
Enigma# 431139 436499 436499 455434 458504 465541
Sky City# 690619 745183 792210 880021 915801 906383
Source: Company, ICICI Direct Research
Note : * Yet to reach threshold # Basis area opened for booking ** Calculated on carpet area
ICICI Securities Ltd | Retail Equity Research Page 6
Rental, hospitality portfolio – Icing on the cake…
ORL also enjoys a strong leasing and profitable hospitality portfolio
wherein it has Commerz I & II (Commercial Space), Oberoi Mall (Retail
Property) and The Westin Mumbai Garden City (Hospitality).
In the leasing portfolio, ORL has leased out ~0.9 mn sq feet (~94% of the
total available area) in Commerz I and Oberoi Mall. Beside this, the
company has also completed Commerz-II Phase I (0.7 mn sq ft).
Furthermore, Samsung India Electronics has leased ~1.1 lakh sq ft space
in Oberoi Commerz II in Goregaon for ~| 145 per sq ft per month. The
lease is for nine years with 15% rental escalation every three years.
Recently, it concluded a deal to lease out ~0.7 lakh sq ft. Overall, the
lease revenue is expected to grow to | 256 crore in FY20E vs. | 204 crore
in FY18 driven by the incremental leasing in Commerz II phase I.
Exhibit 6: Leasing trend
0.3 0.3 0.3 0.3 0.3 0.3 0.3 0.3
0.5 0.50.5 0.5 0.50.6
0.6
0.5
0.6 0.60.8 0.9 0.8
0.91.0
1.1
1.3 1.3
0.0
0.3
0.6
0.9
1.2
1.5
FY13 FY14 FY15 FY16 FY17 FY18 FY19E FY20E
(m
n s
q f
t)
Commerz I Commerz II Phase I Oberoi Mall
Source: Company, ICICI Direct Research
Exhibit 7: Leasing revenue trend
46 48 47 47 46 45 46 48
669079 87
94 94
100
111
118
119
126135
147 150
173
204
229
256
0
75
150
225
300
FY13 FY14 FY15 FY16 FY17 FY18 FY19E FY20E
(|
crore)
Commerz I Commerz II Phase I Oberoi Mall
Source: Company, ICICI Direct Research
ORL also has The Westin Mumbai Garden City Hotel in Goregaon, which
is part of the mixed development in Oberoi Garden City. It is a five star
hotel with 269 rooms and is managed by the Westin Group. In FY18, it
reported revenue and EBITDA of | 128.7 crore and | 34.5 crore,
respectively. Going ahead, we expect it to post a topline and bottomline
of | 155.1 crore and | 57.4 crore, respectively, in FY20E.
Exhibit 8: Hotel revenue trend
122.8128.0 126.6 128.7
143.1
155.1
0
35
70
105
140
175
FY15 FY16 FY17 FY18 FY19E FY20E
(|
crore)
Source: Company, ICICI Direct Research
Exhibit 9: Westin’s operating profit trend
33.0
41.6
43.6
42.0
50.1
57.4
32.5
26.9
34.5
32.7
35.0
37.0
0.0
15.0
30.0
45.0
60.0
75.0
FY15 FY16 FY17 FY18 FY19E FY20E
(|
crore)
24
27
30
33
36
39
(%
)
EBITDA Margins (RHS)
Source: Company, ICICI Direct Research
ICICI Securities Ltd | Retail Equity Research Page 7
Exhibit 10: Operational trend in Oberoi’s rental and hospitality portfolio
Particulars Q4FY18 Q3FY18 Q2FY18 Q1FY18 Q4FY17
Oberoi Mall (Retail Property)
Operating Revenue (| crore) 29.0 28.0 26.8 26.7 25.7
EBITDA margin (%) 96.5 95.0 73.4 92.7 93.3
Occupancy (%) 99.4 99.4 98.7 99.1 99.7
Realisation (|/sqft/month) 176 170 164 162 155
Commerz I (Commercial Space)
Operating Revenue (| crore) 11.1 11.1 11.1 12.0 12.0
EBITDA margin(%) 109.2 99.0 99.0 99.6 99.5
Occupancy (%) 82.1 82.1 82.1 88.5 88.5
Realisation (|/sqft/month) 142 141 142 142 142
Commerz II Phase I (Commercial Space)
Operating Revenue (| crore) 12.7 11.4 12.6 11.5 8.2
EBITDA margin(%) 84.5 81.5 82.8 84.2 80.4
Occupancy (%) 47.5 44.7 44.7 44.7 29.9
Realisation (|/sqft/month) 123 117 130 119 126
The Westin Mumbai Garden City
(Hospitality)
Operating Revenue (| crore) 34.0 35.4 29.2 30.1 33.9
EBITDA margin(%) 28.2 36.1 31.8 34.5 38.9
Average Room Rate (|) 9093 9401 8209 8030 8532
Occupancy (%) 83.6 80.0 78.0 81.6 85.7
RevPAR (|) 7615 7582 6416 6546 7312
Source: Company, ICICI Direct Research
ICICI Securities Ltd | Retail Equity Research Page 8
Revenues recognised to grow at 41.5% CAGR over FY18-20E…
Revenues grew steadily by 13.6% YoY to | 1265.4 crore in FY18. Going
forward, we expect ORL’s revenues to grow robustly at 41.5% CAGR over
FY18-20E to | 2532.1 crore as its Mulund, Borivali and Worli projects are
expected to hit revenue recognition threshold in the next couple of years.
More revenues are expected to get recognised from completed projects
such as Oberoi Exquisite.
Exhibit 11: Revenues to grow at 41.5% CAGR over FY18-20E…
1,408.1
1,113.7
1,265.4
2,532.12,674.1
500
1000
1500
2000
2500
3000
3500
FY16 FY17 FY18E FY19E FY20E
(|
crore)
CAGR - 41.5%
Source: Company, ICICI Direct Research
EBITDA margin to contract ahead…
The EBITDA margin has dropped significantly in FY16 to 47.4%. However,
with a change in the project mix, margins rose to 51.2% in FY17. Going
ahead, we expect margins to be in the range of 47-50% given the larger
share of residential revenues recognition, which is typically of lower
margins compared to hospitality and leasing segments.
Exhibit 12: EBITDA margin trend
47.4
51.253.4
49.4
47.6
35
40
45
50
55
60
FY16 FY17 FY18E FY19E FY20E
(%
)
Source: Company, ICICI Direct Research
ORL’s revenues are expected to grow at a CAGR of 41.5%
CAGR during FY18-20E
ICICI Securities Ltd | Retail Equity Research Page 9
Net profit to grow at 36.3% CAGR during FY18-20E…
Overall, we expect ORL’s bottomline to grow at a CAGR of 26% during
FY18-20E to | 728.5 crore, with Eternia, Enigma & SkyCity projects hitting
revenue recognition during this period. This would aid the bottomline
significantly, going forward.
Exhibit 13: PAT to grow at 26.0% CAGR during FY18-20E
425.9 378.7 458.8 929.1 852.3
0
250
500
750
1000
FY16 FY17 FY18E FY19E FY20E
(| crore)
CAGR - 36.3%
Source: Company, ICICI Direct Research
Return ratio to improve over FY18-20E…
Given the lower revenue recognition and profitability in FY17, ORL’s
return ratio dropped to single digits in FY17. However, with better
revenues and profitability coming in FY18E & FY19E, we expect ORL’s
return ratio to bounce back to 12.9% RoCE and 9.6% RoE in FY20E.
Exhibit 14: Return ratio to bounce back
11.3 8.6
8.5
15.3
12.9
8.0
6.6 7.5
12.0
9.6
0
4
8
12
16
20
FY16 FY17 FY18E FY19E FY20E
(%
)
RoCE RoNW
Source: Company, ICICI Direct Research
We expect ORL’s bottomline to grow at a CAGR of 26.0%
during FY18-20E to | 728.5 crore, with Eternia & Enigma
projects hitting revenue recognition during this period
ICICI Securities Ltd | Retail Equity Research Page 10
Outlook and Valuation
We like the company given the quality of land bank, its healthy balance
sheet and management bandwidth to execute large projects. However,
the sales momentum for ORL has been sluggish. Also, the stock has run
up ~41% in the last year. Hence, we await a better entry point.
Consequently, we continue to maintain our HOLD recommendation on
the stock with a revised target price of | 550.
Exhibit 15: Valuation
Location Type Status
Saleable Area ( in mn
sq ft) NAV NAV Multiple Value (| cr) |/share
Goregaon 10.1 8,194.2 7,586.8 223.7
Oberoi Mall Retail Completed 0.6 1,444.3 1.0 1,444.3 42.6
Commerz I Commercial Completed 0.4 597.9 1.0 597.9 17.6
Westin Hotel Completed 0.4 1,112.0 1.0 1,112.0 32.8
Exquisite I Residential Ongoing 1.5 259.7 1.0 259.7 7.7
Exquisite II Residential Ongoing 1.5 658.7 1.0 658.7 19.4
Commerz II Phase I Commercial Ongoing 0.7 1,447.9 0.9 1,303.1 38.4
Exquisite III Residential Planned 1.9 1,019.8 1.0 1,019.8 30.1
Commerz II Phase II Commercial Planned 1.7 1,541.9 0.7 1,079.3 31.8
Oberoi International school Social Infrastructure Ongoing 0.3
Education complex Planned 0.9
Hospital Planned 0.4
Andheri/Khar/Borivali 3.1 3,817.7 3,785.8 111.6
Oberoi Maxima Commercial Ongoing 0.3 242.9 0.9 218.6 6.4
Oberoi Prisma Residential Ongoing 0.7 134.6 1.0 134.6 4.0
Oberoi Splendour IT park Commercial Planned 0.1 75.9 0.9 68.3 2.0
Oberoi Splendour school Social Infrastructre Planned 0.4 14.7 1.0 14.7 0.4
Borivali Residential 4.5 3,349.7 1.0 3,349.7 98.8
Worli 3.4 2,525.8 2,154.4 63.5
Oasis Residential Residential Ongoing 2.3 668.7 1.0 668.7 19.7
Oasis Commercial Commercial Ongoing 0.2 244.2 0.8 195.4 5.8
Oasis Mall Retail Ongoing 0.1 111.4 0.8 89.1 2.6
Oasis Hospitality Hospital Ongoing 0.2 191.6 0.8 153.3 4.5
I-Ventures Residential 0.5 1,309.9 0.8 1,047.9 30.9
Thane Residential Planned 10.2 3,490.3 1.0 3,490.3 102.9
Mulund 3.2 1,440.0 1,440.0 42.5
Eternia Residential Ongoing 1.6 678.5 1.0 678.5 20.0
Enigma Residential Ongoing 1.6 761.5 1.0 761.5 22.5
Pune 1.3 127.1 113.7 3.4
Sangam city - Residential Residential Planned 0.8 59.8 1.0 59.8 1.8
Sangam city - Commercial Commercial Planned 0.3 35.8 0.8 28.6 0.8
Sangam city - Retail Retail Planned 0.3 31.6 0.8 25.3 0.7
Net cash/ (Debt) (89.2) 1.0 (89.2) (2.6)
Total 31.4 19,506.0 0.9 18,481.8 545
Rounded off Target price 550
111.9 1.0 111.9 3.3
Source: Company, ICICI Direct Research
Exhibit 16: Valuation
Sales Growth EPS Growth PE EV/EBITDA RoNW RoCE
(| cr) (%) (|) (%) (x) (x) (%) (%)
FY17 1113.7 -20.9 11.2 -11.1 51.2 31.7 6.6 8.6
FY18 1265.4 13.6 13.5 21.2 42.3 27.3 7.5 8.5
FY19E 2674.1 111.3 27.4 102.5 20.9 13.0 12.0 15.3
FY20E 2532.1 -5.3 25.1 -8.3 22.7 14.2 9.6 12.9
Source: Company, ICICI Direct Research
ICICI Securities Ltd | Retail Equity Research Page 11
Recommendation History vs. Consensus
0
150
300
450
600
750
Apr-18Jan-18Oct-17Aug-17May-17Feb-17Nov-16Aug-16May-16Feb-16Nov-15Aug-15May-15Feb-15
(|
)
0.0
20.0
40.0
60.0
80.0
100.0
(%
)
Price Idirect target Consensus Target Mean % Consensus with BUY
Source: Bloomberg, Company, ICICI Direct Research
Key events
Date Event
Jun-15 Oberoi Realty approves raising of | 324 crore through preferential issue of shares to Aranda Investments, an indirect subsidiary of Temasek Holdings
Aug-15 As per media sources, Oberoi Realty to buy Crompton Greaves’ Worli building spread over ~1 acre for over | 200 crore.
Oct-15 Oberoi Realty launches its multi-tower project “Sky City” at Borivali spread across 25 acres consisting of multiple towers of up to 60 storeys each. The project has a
saleable area of ~4.5 million square feet (msf) and the company expects to earn revenues of ~| 6000-7000 crore from the project
Mar-16
The Bombay High Court stays new constructions of either residential/commercial buildings or hotels in Mumbai from March 1, 2016 because the state government
and Brihanmumbai Municipal Corporation (BMC) have failed to comply with the municipal solid waste (MSW) rules at Deonar and Mulund dumping grounds,due to
which Oberoi will be unable to launch projects until the ban is lifted
Mar-16 Rajya Sabha passes the real estate regulation bill paving the way for regulation in the real estate sector. The bill would promote timely execution of projects, ensure
speedy adjudication of disputes and help promote private participation, positive for Oberoi
Apr-16 Swedish furniture retailing giant Ikea in talks with Oberoi Realty to buy a built-to-suit retail space for over | 900 crore in Borivali. As per media reports, if the deal
happens, this will monetise Oberoi's landbank at better prices of ~| 112.5 crore per acre vs. Oberoi's acquisition price of ~| 46.2 crore per acre
May-16 Oberoi allots 59,104 equity Shares of | 10 each to certain option grantee(s) pursuant to exercise by them of options granted to them under Company’s Employee
Stock Option Scheme 2009. The exercise price for options is | 260/ share. Post allotment, share capital has increased to | 339.4 crore.
Aug-16
According to media sources, Oberoi Realty is in talks with US-based investor Morgan Stanley and Singapore’s sovereign fund, GIC, to set up a joint venture (JV) for
developing malls. The venture would have a corpus of | 1,000 crore. Oberoi is expected to hold about 75%. Further, it could also initiate talks with Canada Pension
Plan Investment Board, which has shown an interest in buying in malls
Sep-16 Teva Pharmaceuticals buys ~1.0 lakh sq ft space in Oberoi Commerz II in Goregaon
Mar-17 Samsung India Electronics leases ~1.1 lakh sq ft space in Oberoi Commerz II in Goregaon for ~| 145/ sq ft per month. The lease is for nine years with 15% rental
escalation every three years
Sep-17 Oberoi Realty has acquired GlaxoSmithKline (GSK) Pharmaceuticals’ 60 acre land parcel at Thane for | 555 crore.
Source: Company, ICICI Direct Research
Top 10 Shareholders Shareholding Pattern
Rank Name Latest Filing Date % O/S Position (m) Change (m)
1 Oberoi (Vikas Ranvir) 31-Mar-18 62.7% 212.9 0.0
2 R S Estate Developers Pvt. Ltd. 31-Mar-18 9.8% 33.3 0.0
3 Franklin Templeton Investment Management Ltd. 31-Mar-18 3.1% 10.4 0.0
4 Franklin Advisers, Inc. 31-Mar-18 3.1% 10.4 0.0
5 APG Asset Management 31-Mar-18 1.7% 5.6 0.0
6 OppenheimerFunds, Inc. 31-Mar-18 1.2% 4.2 0.0
7 L&T Investment Management Limited 31-Mar-18 1.2% 4.0 -0.5
8 Wellington Management Company, LLP 31-Mar-18 1.1% 3.9 -0.1
9 BlackRock Investment Management (UK) Ltd. 31-Mar-18 1.0% 3.4 -1.5
10 BlackRock Asset Management North Asia Limited 31-Dec-17 1.0% 3.4 0.2
(in %) Jun-17 Sep-17 Dec-17 Mar-18
Promoter 72.5 72.5 72.5 72.5
FII 25.4 24.9 22.6 22.6
DII 0.6 0.7 2.9 2.9
Others 1.6 1.8 2.0 2.0
Source: Reuters, ICICI Direct Research
Recent Activity
Investor name Value (m) Shares (m) Investor name Value (m) Shares (m)
William Blair Investment Management, LLC 1.7 0.2 BlackRock Investment Management (UK) Ltd. -12.0 -1.5
BlackRock Asset Management North Asia Limited 1.2 0.2 BlackRock Financial Management, Inc. -7.1 -0.9
UTI Asset Management Co. Ltd. 0.8 0.1 L&T Investment Management Limited -3.6 -0.5
GaveKal Capital Limited 0.7 0.1 Wellington International Management Company Pte. Ltd. -1.7 -0.2
Fideuram Asset Management (Ireland) dac 0.3 0.0 DHFL Pramerica Asset Managers Private Limited -1.6 -0.2
Buys Sells
Source: Reuters, ICICI Direct Research
ICICI Securities Ltd | Retail Equity Research Page 12
Financial summary
Profit and loss statement (| Crore)
(Year-end March) FY17 FY18 FY19E FY20E
Net Sales 1,113.7 1,265.4 2,674.1 2,532.1
Other Operating Income 0.0 0.0 0.0 0.0
Total Operating Income 1,113.7 1,265.4 2,674.1 2,532.1
Growth (%) -20.9 13.6 111.3 -5.3
Operating Costs 428.7 467.9 1,225.1 1,192.5
Employee Expenses 64.2 67.2 70.5 74.0
Other Expenses 51.0 55.1 57.9 60.8
Total Operating Expenditure 543.9 590.1 1,353.5 1,327.3
EBITDA 569.9 675.3 1,320.6 1,204.8
Growth (%) -14.6 18.5 95.6 -8.8
Depreciation 49.5 49.1 52.5 53.7
Interest 5.6 6.9 64.0 96.0
Other Income 47.6 26.6 29.2 32.2
PBT 562.4 645.9 1,233.4 1,087.3
Prior Period Adjustments 0.0 0.0 0.0 0.0
Total Tax 186.9 190.7 407.0 358.8
PAT before profit from associates 375.6 455.2 826.4 728.5
Minoriy Interest 0.0 0.0 0.0 0.0
Profit from associates 3.1 3.6 102.7 123.8
PAT 378.7 458.8 929.1 852.3
EPS (|) 11.2 13.5 27.4 25.1
Source: Company, ICICI Direct Research
Cash flow statement (| Crore)
(Year-end March) FY17 FY18E FY19E FY20E
Profit after Tax 378.7 458.8 929.1 852.3
Depreciation 49.5 49.1 52.5 53.7
Interest 71.8 6.9 64.0 96.0
Others -46.2 -26.6 -132.0 -155.9
Net Increase in Current Assets -475.2 -1343.0 42.7 -465.7
Net Increase in Current Liabilities 190.7 672.8 572.7 -99.3
Net cf from operating activities 173.6 -212.2 1,528.9 281.0
(Purchase)/Sale of Fixed Assets -76.3 -27.9 -25.0 -25.0
Others -46.2 -26.6 -132.0 -155.9
Net cf from Investing Activities -438.9 -601.2 4.2 7.2
Inc / (Dec) in Equity Capital 6.0 0.0 0.0 0.0
Inc / (Dec) in Loan Funds -18.0 731.4 0.0 0.0
(Payment) of Dividend & Div. Tax 0.0 -68.8 -139.4 -127.8
Interest paid -52.5 -6.9 -64.0 -96.0
Net cf from Financing Activities 335.6 655.7 -203.4 -223.8
Net Cash flow 39.8 -157.8 1,329.8 64.3
Opening Cash/Cash Equivalent 311.9 351.7 116.7 1,446.5
Closing Cash/ Cash Equivalent 351.7 116.7 1,446.5 1,510.8
Source: Company, ICICI Direct Research
Balance sheet (| Crore)
(Year-end March) FY17 FY18E FY19E FY20E
Equity Capital 339.5 339.5 339.5 339.5
Preference Capital 0.0 0.0 0.0 0.0
Reserve and Surplus 5,386.4 5,752.8 6,542.5 7,266.9
Total Shareholders funds 5,726.0 6,092.3 6,882.0 7,606.5
Total Debt 868.6 1,600.0 1,600.0 1,600.0
Total Liabilities 8,454 10,225 11,587 12,212
Assets
Gross Block 1,042.8 1,067.8 1,092.8 1,117.8
Less Accumulated Depreciation 98.3 91.2 143.7 197.3
Net Block 944.5 976.5 949.1 920.4
Capital WIP 109.5 112.5 112.5 112.5
Total Fixed Assets 1,054.0 1,089.0 1,061.5 1,032.9
Goodwill on consolidation 0.0 0.0 0.0 0.0
Investments 1,824.3 2,424.2 2,424.2 2,424.2
Inventory 3,766.4 4,246.7 4,350.4 4,874.1
Debtors 105.8 181.3 171.7 206.1
Loans and Advances 1,234.0 1,874.9 1,738.1 1,645.9
Cash 351.7 116.7 1,446.5 1,510.8
Other Current Assets 0.0 146.2 146.2 146.2
Total Current Assets 5,457.8 6,565.8 7,853.0 8,383.0
Creditors 1,855.2 2,527.9 3,100.7 3,001.4
Provisions 4.4 4.4 4.4 4.4
Net Current Assets 3,598.2 4,033.5 4,748.0 5,377.3
Deferred Tax Assets 118.1 145.8 145.8 145.8
Total Assets 8,454 10,225 11,484 11,986
Source: Company, ICICI Direct Research
Key ratios
(Year-end March) FY17 FY18E FY19E FY20E
Per share data (|)
EPS 11.2 13.5 27.4 25.1
Cash EPS 12.6 15.0 28.9 26.7
BV 168.6 179.4 202.7 224.0
Operating profit per share 17.4 20.6 40.2 36.7
Cash Per Share 10.4 3.4 42.6 44.5
Operating Ratios (%)
EBITDA Margin 51.2 53.4 49.4 47.6
PBT / Net Sales 50.5 51.0 46.1 42.9
PAT Margin 33.7 36.0 30.9 28.8
Inventory days 1,234 1,225 594 703
Debtor days 35 52 23 30
Creditor days 609 730 424 433
Return Ratios (%)
RoE 6.6 7.5 12.0 9.6
RoCE 8.6 8.5 15.3 12.9
RoIC 12.4 12.8 29.8 24.0
Valuation Ratios (x)
P/E 51.2 42.3 20.9 22.7
EV / EBITDA 31.7 27.3 13.0 14.2
EV / Net Sales 16.2 14.6 6.4 6.7
Market Cap / Sales 17.4 15.3 7.3 7.7
Price to Book Value 3.4 3.2 2.8 2.5
Solvency Ratios (x)
Debt / EBITDA 1.5 2.4 1.2 1.3
Debt / Equity 0.2 0.3 0.2 0.2
Current Ratio 2.7 2.5 2.1 2.3
Quick Ratio 0.7 0.9 0.7 0.7
Source: Company, ICICI Direct Research
ICICI Securities Ltd | Retail Equity Research Page 13
ICICI Direct Research coverage universe (Real Estate)
CMP M Cap
(|) TP(|) Rating (| Cr) FY17E FY18E FY19E FY17E FY18E FY19E FY17E FY18E FY19E FY17E FY18E FY19E FY17E FY18E FY19E
Oberoi Realty (OBEREA) 571 550 Hold 18,740 11.2 13.5 24.3 51.2 42.3 23.5 31.7 27.3 12.9 3.4 3.2 2.9 6.6 7.5 12.2
Mahindra Lifespace (GESCOR) 446 570 Buy 1,822 24.9 13.7 21.5 9.8 28.3 25.4 7.5 40.4 48.9 1.4 1.3 1.2 18.0 5.9 6.0
Sobha (SOBDEV) 539 610 Hold 5,501 16.7 22.7 27.7 33.6 24.8 20.2 18.0 14.2 12.5 2.0 1.9 1.8 6.1 7.8 9.0
Sunteck Realty (SUNRE) 430 440 Buy 5,159 14.8 16.9 22.7 16.7 14.7 10.9 12.3 9.2 6.8 1.9 1.3 1.2 11.6 8.9 10.9
Source: Company, ICICI Direct Research
P/B (x) RoE (%)
Sector / Company
EPS (|) P/E (x) EV/EBITDA (x)
ICICI Securities Ltd | Retail Equity Research Page 14
RATING RATIONALE
ICICI Direct Research endeavours to provide objective opinions and recommendations. ICICI Direct Research
assigns ratings to its stocks according to their notional target price vs. current market price and then
categorises them as Strong Buy, Buy, Hold and Sell. The performance horizon is two years unless specified and
the notional target price is defined as the analysts' valuation for a stock.
Strong Buy: >15%/20% for large caps/midcaps, respectively, with high conviction;
Buy: >10%/15% for large caps/midcaps, respectively;
Hold: Up to +/-10%;
Sell: -10% or more;
Pankaj Pandey Head – Research [email protected]
ICICI Direct Research,
ICICI Securities Limited,
1st Floor, Akruti Trade Centre,
Road No 7, MIDC,
Andheri (East)
Mumbai – 400 093
ICICI Securities Ltd | Retail Equity Research Page 15
ANALYST CERTIFICATION
We /I, Deepak Purswani, CFA MBA (Finance), Vaibhav Shah, MBA (Finance); Research Analysts, authors and the names subscribed to this report, hereby certify that all of the views expressed in this research report accurately reflect our views
about the subject issuer(s) or securities. We also certify that no part of our compensation was, is, or will be directly or indirectly related to the specific recommendation(s) or view(s) in this report.
Terms & conditions and other disclosures:
ICICI Securities Limited (ICICI Securities) is a full-service, integrated investment banking and is, inter alia, engaged in the business of stock brokering and distribution of financial products. ICICI Securities Limited is a Sebi registered Research Analyst
with Sebi Registration Number – INH000000990. ICICI Securities is a wholly-owned subsidiary of ICICI Bank which is India’s largest private sector bank and has its various subsidiaries engaged in businesses of housing finance, asset management,
life insurance, general insurance, venture capital fund management, etc. (“associates”), the details in respect of which are available on www.icicibank.com.
ICICI Securities is one of the leading merchant bankers/ underwriters of securities and participate in virtually all securities trading markets in India. We and our associates might have investment banking and other business relationship with a
significant percentage of companies covered by our Investment Research Department. ICICI Securities generally prohibits its analysts, persons reporting to analysts and their relatives from maintaining a financial interest in the securities or
derivatives of any companies that the analysts cover.
The information and opinions in this report have been prepared by ICICI Securities and are subject to change without any notice. The report and information contained herein is strictly confidential and meant solely for the selected recipient and may
not be altered in any way, transmitted to, copied or distributed, in part or in whole, to any other person or to the media or reproduced in any form, without prior written consent of ICICI Securities. While we would endeavour to update the information
herein on a reasonable basis, ICICI Securities is under no obligation to update or keep the information current. Also, there may be regulatory, compliance or other reasons that may prevent ICICI Securities from doing so. Non-rated securities indicate
that rating on a particular security has been suspended temporarily and such suspension is in compliance with applicable regulations and/or ICICI Securities policies, in circumstances where ICICI Securities might be acting in an advisory capacity to
this company, or in certain other circumstances.
This report is based on information obtained from public sources and sources believed to be reliable, but no independent verification has been made nor is its accuracy or completeness guaranteed. This report and information herein is solely for
informational purpose and shall not be used or considered as an offer document or solicitation of offer to buy or sell or subscribe for securities or other financial
instruments. Though disseminated to all the customers simultaneously, not all customers may receive this report at the same time. ICICI Securities will not treat recipients as customers by virtue of their receiving this report. Nothing in this report
constitutes investment, legal, accounting and tax advice or a representation that any investment or strategy is suitable or appropriate to your specific circumstances. The securities discussed and opinions expressed in this report may not be suitable
for all investors, who must make their own investment decisions, based on their own investment objectives, financial positions and needs of specific recipient. This may not be taken in substitution for the exercise of independent judgment by any
recipient. The recipient should independently evaluate the investment risks. The value and return on investment may vary because of changes in interest rates, foreign exchange rates or any other reason. ICICI Securities accepts no liabilities
whatsoever for any loss or damage of any kind arising out of the use of this report. Past performance is not necessarily a guide to future performance. Investors are advised to see Risk Disclosure Document to understand the risks associated before
investing in the securities markets. Actual results may differ materially from those set forth in projections. Forward-looking statements are not predictions and may be subject to change without notice.
ICICI Securities or its associates might have managed or co-managed public offering of securities for the subject company or might have been mandated by the subject company for any other assignment in the past twelve months.
ICICI Securities or its associates might have received any compensation from the companies mentioned in the report during the period preceding twelve months from the date of this report for services in respect of managing or co-managing public
offerings, corporate finance, investment banking or merchant banking, brokerage services or other advisory service in a merger or specific transaction.
ICICI Securities or its associates might have received any compensation for products or services other than investment banking or merchant banking or brokerage services from the companies mentioned in the report in the past twelve months.
ICICI Securities encourages independence in research report preparation and strives to minimize conflict in preparation of research report. ICICI Securities or its associates or its analysts did not receive any compensation or other benefits from the
companies mentioned in the report or third party in connection with preparation of the research report. Accordingly, neither ICICI Securities nor Research Analysts and their relatives have any material conflict of interest at the time of publication of
this report.
It is confirmed that Deepak Purswani, CFA MBA (Finance), Vaibhav Shah, MBA (Finance); Research Analysts of this report have not received any compensation from the companies mentioned in the report in the preceding twelve months.
Compensation of our Research Analysts is not based on any specific merchant banking, investment banking or brokerage service transactions.
ICICI Securities or its subsidiaries collectively or Research Analysts or their relatives do not own 1% or more of the equity securities of the Company mentioned in the report as of the last day of the month preceding the publication of the research
report.
Since associates of ICICI Securities are engaged in various financial service businesses, they might have financial interests or beneficial ownership in various companies including the subject company/companies mentioned in this report.
It is confirmed that Deepak Purswani, CFA MBA (Finance), Vaibhav Shah, MBA (Finance); Research Analysts do not serve as an officer, director or employee of the companies mentioned in the report.
ICICI Securities may have issued other reports that are inconsistent with and reach different conclusion from the information presented in this report.
Neither the Research Analysts nor ICICI Securities have been engaged in market making activity for the companies mentioned in the report.
We submit that no material disciplinary action has been taken on ICICI Securities by any Regulatory Authority impacting Equity Research Analysis activities.
This report is not directed or intended for distribution to, or use by, any person or entity who is a citizen or resident of or located in any locality, state, country or other jurisdiction, where such distribution, publication, availability or use would be
contrary to law, regulation or which would subject ICICI Securities and affiliates to any registration or licensing requirement within such jurisdiction. The securities
described herein may or may not be eligible for sale in all jurisdictions or to certain category of investors. Persons in whose possession this document may come are required to inform themselves of and to observe such restriction.