Obesity (Adults) Obesity (Adults) •Most recent data (2013): 22% or about 335,700 King County adults age 18+. •Trend over time: 2000-08: rising; 2008-13: flat •Description: Body Mass Index greater than or equal to 30 Obesity (adults) by demographics, King County, 2009-2013 average Obesity (adults), King County, 2009-2013 average Percent Lower CI Upper CI King County (adults age 18+) 22 21 23 AGE 18-24 10 7 12 25-44 21 19 23 45-64 27 25 29 65+ 22 20 24 GENDER Male 23 22 25 Female 21 19 22 RACE/ETHNICITY AIAN 44 32 57 Asian 8 6 10 Black 37 32 44 Hispanic 25 21 30 Multiple 23 17 31 NHPI 30 19 44 White 22 21 24 HOUSEHOLD INCOME <$15,000 27 23 32 $15,000 to $24,999 23 20 27 $25,000 to $34,999 22 19 26 $35,000 to $49,999 28 24 32 $50,000 to $74,999 24 21 27 $75,000+ 19 17 20 REGION East 18 16 20 North 21 17 25 Seattle 17 15 18 South 30 28 32 Comparisons: . Higher than King County rate (yellow) . Lower than King County rate (green) Notes: Source: Behavioral Risk Factor Surveillance System. Prepared by Public Health - Seattle & King County, APDE, 12/2014. CI is 95% Confidence Interval. * Too few cases to protect confidentiality and/or report reliable rates. § Too few cases to meet precision standard, interpret with caution. Persons of Hispanic ethnicity can be of any race and are included in the racial categories.
Transcript
Obesity (Adults)
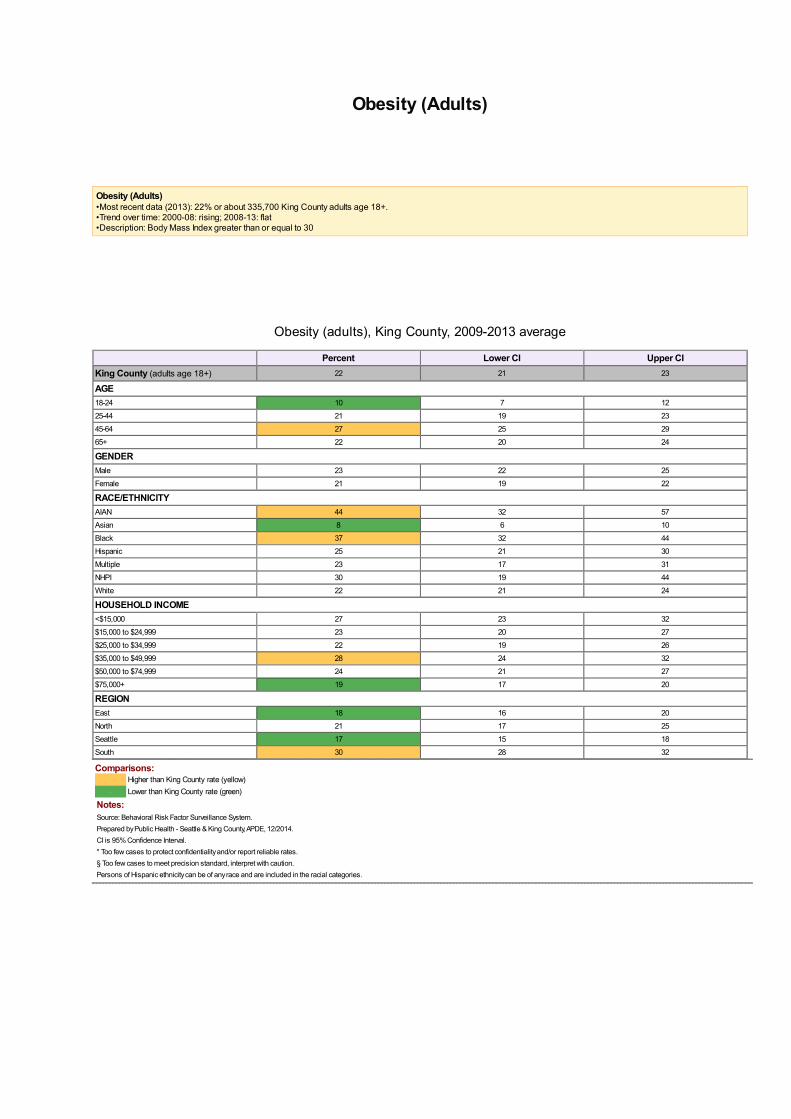
Obesity (Adults)•Most recent data (2013): 22% or about 335,700 King County adults age 18+.•Trend over time: 2000-08: rising; 2008-13: flat•Description: Body Mass Index greater than or equal to 30
Obesity (adults) by demographics, King County, 2009-2013 average
Obesity (adults), King County, 2009-2013 average
Percent Lower CI Upper CIKing County (adults age 18+) 22 21 23
AGE18-24 10 7 12
25-44 21 19 23
45-64 27 25 29
65+ 22 20 24
GENDERMale 23 22 25
Female 21 19 22
RACE/ETHNICITYAIAN 44 32 57
Asian 8 6 10
Black 37 32 44
Hispanic 25 21 30
Multiple 23 17 31
NHPI 30 19 44
White 22 21 24
HOUSEHOLD INCOME<$15,000 27 23 32
$15,000 to $24,999 23 20 27
$25,000 to $34,999 22 19 26
$35,000 to $49,999 28 24 32
$50,000 to $74,999 24 21 27
$75,000+ 19 17 20
REGIONEast 18 16 20
North 21 17 25
Seattle 17 15 18
South 30 28 32
Comparisons:. Higher than King County rate (yellow). Lower than King County rate (green)
Notes:Source: Behavioral Risk Factor Surveillance System.Prepared by Public Health - Seattle & King County, APDE, 12/2014.CI is 95% Confidence Interval.* Too few cases to protect confidentiality and/or report reliable rates.§ Too few cases to meet precision standard, interpret with caution.Persons of Hispanic ethnicity can be of any race and are included in the racial categories.
Obesity (adults) by demographics, King County, 2009-2013 average
Obesity (adults) by comparison areas
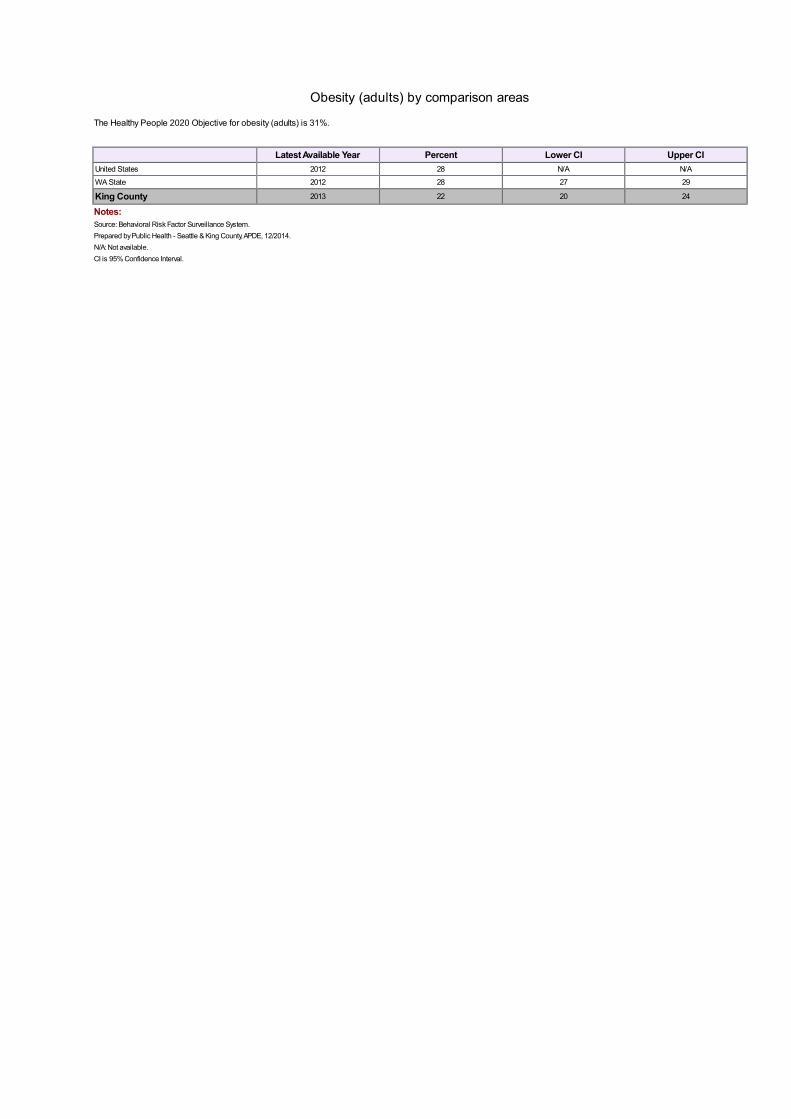
Obesity (adults) by comparison areas
The Healthy People 2020 Objective for obesity (adults) is 31%.
. Latest Available Year Percent Lower CI Upper CIUnited States 2012 28 N/A N/A
WA State 2012 28 27 29
King County 2013 22 20 24
Notes:Source: Behavioral Risk Factor Surveillance System.Prepared by Public Health - Seattle & King County, APDE, 12/2014.N/A: Not available.CI is 95% Confidence Interval.
Obesity (adults) {crlf}by comparison areas
Obesity (adults) by health reporting areas, King County, 2009-2013 average
Obesity (adults) by health reporting areas, King County, 2009-2013 average
Percent Lower CI Upper CIKing County (adults age 18+) 22 21 23
Auburn 34 28 41
..Auburn-North 29 22 37
..Auburn-South 41 30 53
Bear Creek/Carnation/Duvall 23 18 30
Bellevue 14 11 17
..Bellevue-Central 18 10 28
..Bellevue-NE 14 10 21
..Bellevue-South 14 10 19
..Bellevue-West 9 5 14
Black Diamond/Enumclaw/SE County 30 24 37
Bothell/Woodinville 23 16 32
Burien 34 27 42
Covington/Maple Valley 32 25 40
Des Moines/Normandy Park 23 16 30
East Federal Way 43 32 54
Fairwood 20 13 30
Federal Way 30 24 36
..Fed Way-Central/Military Rd 31 23 39
..Fed Way-Dash Point/Woodmont 29 21 39
Issaquah 24 14 37
Kenmore/LFP 22 14 31
Kent 34 29 40
..Kent-East 42 31 53
..Kent-SE 30 24 38
..Kent-West 38 27 50
Kirkland 20 16 25
..Kirkland 20 15 27
..Kirkland North 21 15 28
Mercer Isle/Pt Cities 12 8 19
Newcastle/Four Creeks 22 15 30
North Highline 22 13 35
Redmond 16 11 22
Renton 28 23 33
..Renton-East 18 13 25
..Renton-North 33 22 45
..Renton-South 30 23 39
Sammamish 15 11 20
SeaTac/Tukwila 29 21 37
Seattle 17 15 18
..Ballard 14 10 19
..Beacon/Gtown/S.Park 16 10 24
..Capitol Hill/E.lake 10 7 15
..Central Seattle 17 11 25
..Delridge 28 21 37
..Downtown 15 10 21
..Fremont/Greenlake 9 7 13
..NE Seattle 10 7 13
..North Seattle 22 17 28
..NW Seattle 25 18 33
..QA/Magnolia 18 12 26
..SE Seattle 18 12 26
..West Seattle 21 16 26
Shoreline 17 13 22
Snoqualmie/North Bend/Skykomish 26 19 34
Vashon Island 18 12 27
Comparisons:. Higher than King County rate (yellow). Lower than King County rate (green)
Notes:Source: Behavioral Risk Factor Surveillance System.Prepared by Public Health - Seattle & King County, APDE, 12/2014.CI is 95% Confidence Interval.* Too few cases to protect confidentiality and/or report reliable rates.§ Too few cases to meet precision standard, interpret with caution.Persons of Hispanic ethnicity can be of any race and are included in the racial categories.
Obesity (adults) by health reporting areas, King County, 2009-2013 average
Obesity (adults), King County, 2000-2013, three-year rolling averages
Produced by theAssessment, Policy Development & Evaluation Unit
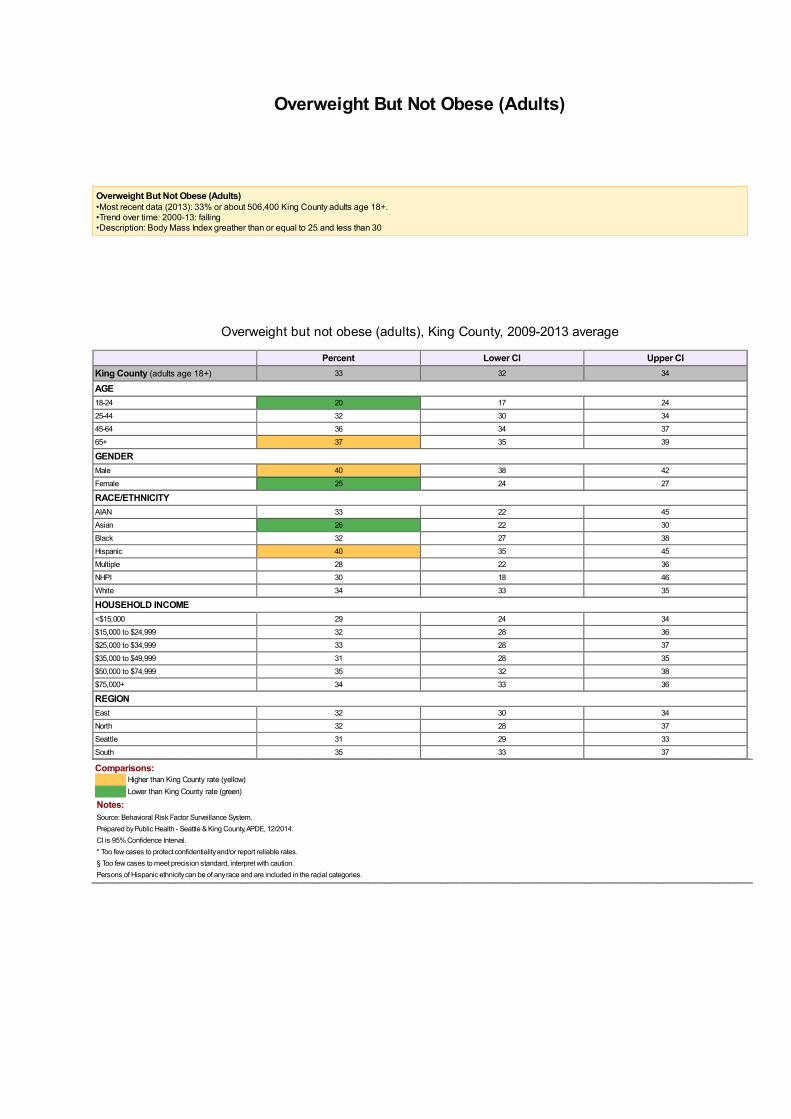
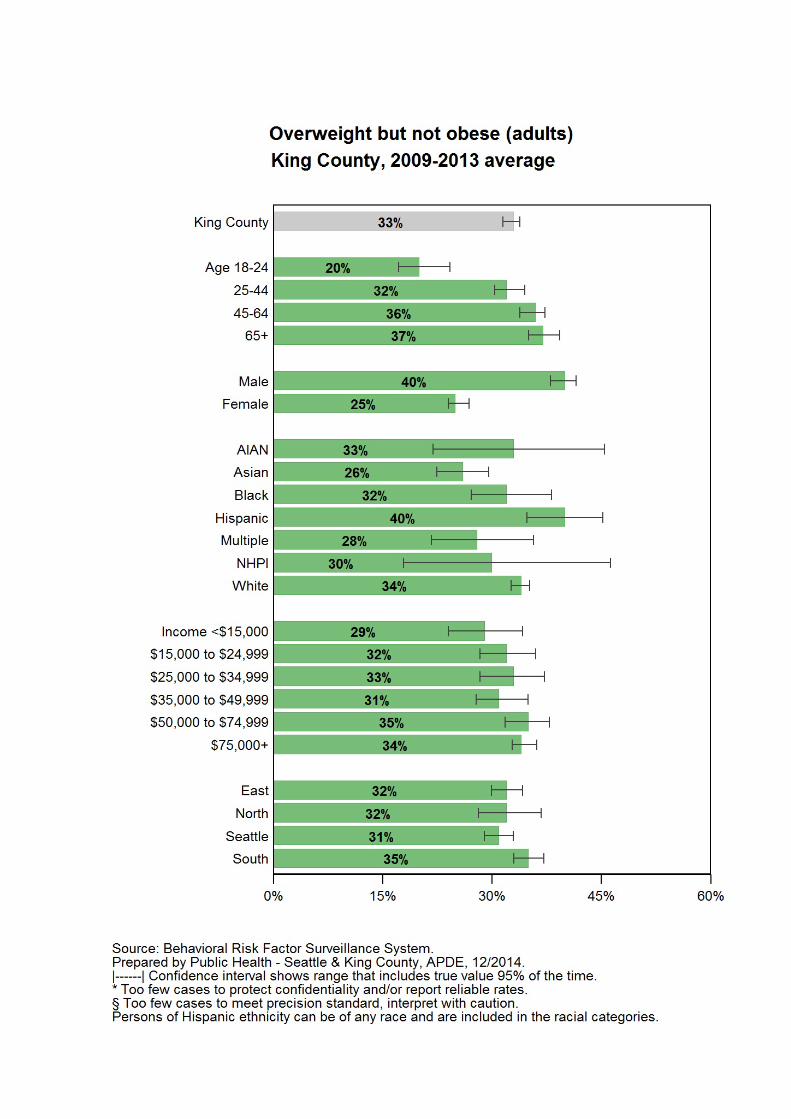
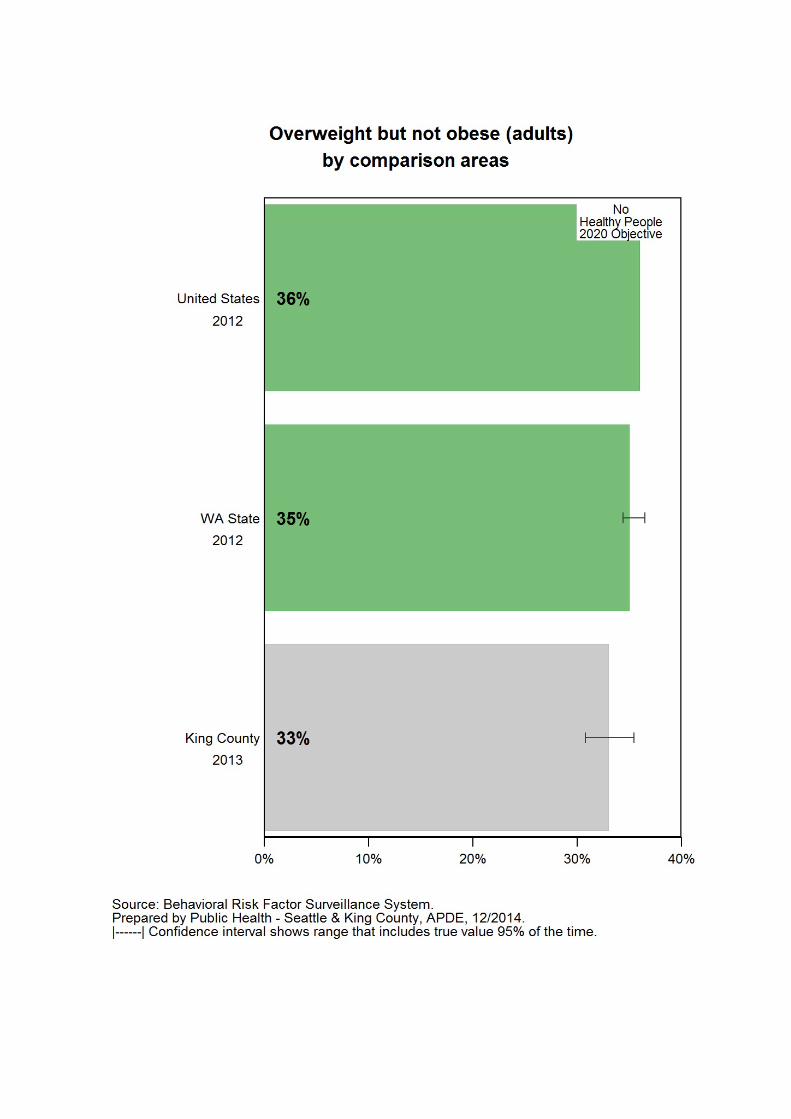
Overweight But Not Obese (Adults)•Most recent data (2013): 33% or about 506,400 King County adults age 18+.•Trend over time: 2000-13: falling•Description: Body Mass Index greather than or equal to 25 and less than 30
Overweight but not obese (adults) by demographics, King County, 2009-2013 average
Overweight but not obese (adults), King County, 2009-2013 average
Percent Lower CI Upper CIKing County (adults age 18+) 33 32 34
AGE18-24 20 17 24
25-44 32 30 34
45-64 36 34 37
65+ 37 35 39
GENDERMale 40 38 42
Female 25 24 27
RACE/ETHNICITYAIAN 33 22 45
Asian 26 22 30
Black 32 27 38
Hispanic 40 35 45
Multiple 28 22 36
NHPI 30 18 46
White 34 33 35
HOUSEHOLD INCOME<$15,000 29 24 34
$15,000 to $24,999 32 28 36
$25,000 to $34,999 33 28 37
$35,000 to $49,999 31 28 35
$50,000 to $74,999 35 32 38
$75,000+ 34 33 36
REGIONEast 32 30 34
North 32 28 37
Seattle 31 29 33
South 35 33 37
Comparisons:. Higher than King County rate (yellow). Lower than King County rate (green)
Notes:Source: Behavioral Risk Factor Surveillance System.Prepared by Public Health - Seattle & King County, APDE, 12/2014.CI is 95% Confidence Interval.* Too few cases to protect confidentiality and/or report reliable rates.§ Too few cases to meet precision standard, interpret with caution.Persons of Hispanic ethnicity can be of any race and are included in the racial categories.
Overweight but not obese (adults) by demographics, King County, 2009-2013 average
Overweight but not obese (adults) by comparison areas
Overweight but not obese (adults) by comparison areas
There is no Healthy People 2020 Objective for overweight but not obese (adults).
. Latest Available Year Percent Lower CI Upper CIUnited States 2012 36 N/A N/A
WA State 2012 35 34 37
King County 2013 33 31 35
Notes:Source: Behavioral Risk Factor Surveillance System.Prepared by Public Health - Seattle & King County, APDE, 12/2014.N/A: Not available.CI is 95% Confidence Interval.
Overweight but not obese (adults) {crlf}by comparison areas
Overweight but not obese (adults) by health reporting areas, King County, 2009-2013 average
Overweight but not obese (adults) by health reporting areas, King County, 2009-2013 average
Percent Lower CI Upper CIKing County (adults age 18+) 33 32 34
Auburn 33 27 40
..Auburn-North 38 29 47
..Auburn-South 27 19 38
Bear Creek/Carnation/Duvall 35 29 41
Bellevue 31 27 35
..Bellevue-Central 34 26 43
..Bellevue-NE 32 26 40
..Bellevue-South 32 24 42
..Bellevue-West 25 18 33
Black Diamond/Enumclaw/SE County 40 32 48
Bothell/Woodinville 28 21 36
Burien 36 28 43
Covington/Maple Valley 37 30 45
Des Moines/Normandy Park 41 32 49
East Federal Way 30 21 41
Fairwood 41 29 53
Federal Way 37 31 43
..Fed Way-Central/Military Rd 35 27 43
..Fed Way-Dash Point/Woodmont 41 31 51
Issaquah 33 24 43
Kenmore/LFP 30 23 39
Kent 30 25 35
..Kent-East 33 24 44
..Kent-SE 30 24 37
..Kent-West 26 17 38
Kirkland 35 30 41
..Kirkland 36 29 43
..Kirkland North 35 28 43
Mercer Isle/Pt Cities 30 24 37
Newcastle/Four Creeks 37 29 47
North Highline 33 18 51
Redmond 30 23 37
Renton 31 26 36
..Renton-East 35 27 44
..Renton-North 23 15 33
..Renton-South 33 27 41
Sammamish 35 29 42
SeaTac/Tukwila 39 30 48
Seattle 31 29 33
..Ballard 28 23 34
..Beacon/Gtown/S.Park 32 23 42
..Capitol Hill/E.lake 36 28 44
..Central Seattle 27 20 35
..Delridge 26 19 35
..Downtown 29 21 38
..Fremont/Greenlake 27 21 33
..NE Seattle 30 25 36
..North Seattle 35 28 42
..NW Seattle 33 26 40
..QA/Magnolia 29 23 35
..SE Seattle 42 33 51
..West Seattle 31 26 37
Shoreline 34 28 41
Snoqualmie/North Bend/Skykomish 25 19 31
Vashon Island 40 30 51
Comparisons:. Higher than King County rate (yellow). Lower than King County rate (green)
Notes:Source: Behavioral Risk Factor Surveillance System.Prepared by Public Health - Seattle & King County, APDE, 12/2014.CI is 95% Confidence Interval.* Too few cases to protect confidentiality and/or report reliable rates.§ Too few cases to meet precision standard, interpret with caution.Persons of Hispanic ethnicity can be of any race and are included in the racial categories.
Overweight but not obese (adults) by health reporting areas, King County, 2009-2013 average
Overweight but not obese (adults), King County, 2000-2013, three-year rolling averages
Produced by theAssessment, Policy Development & Evaluation Unit
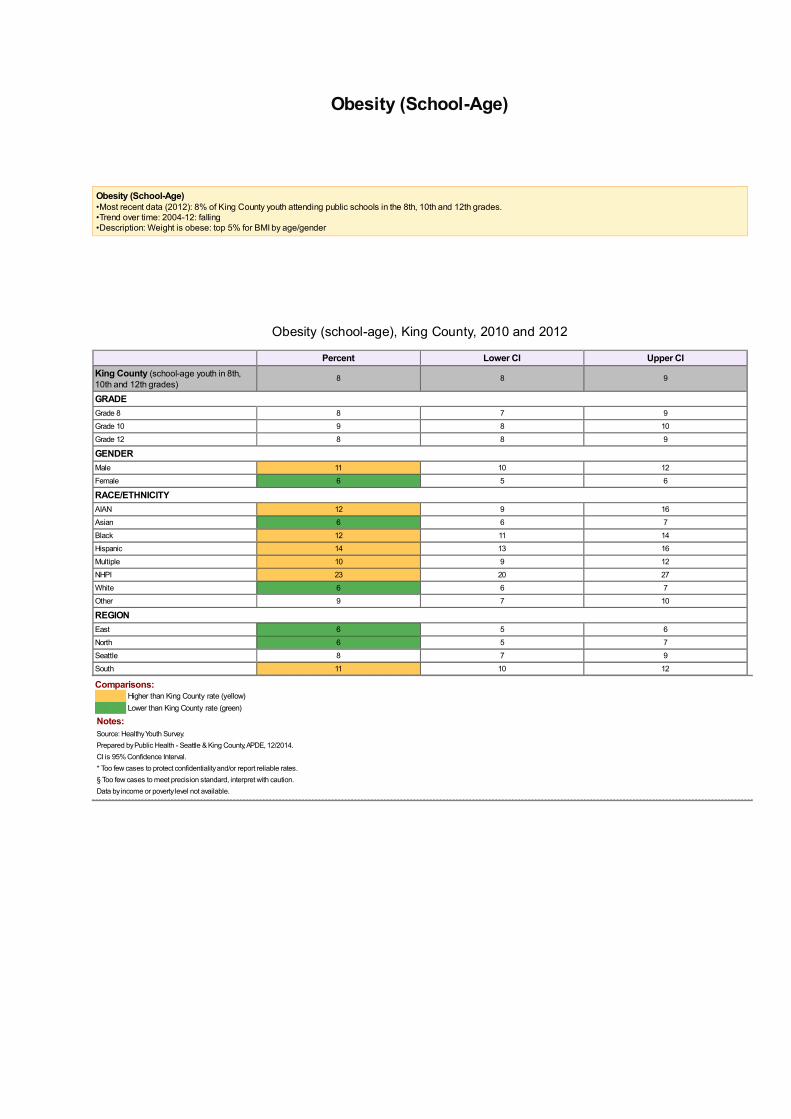
Obesity (School-Age)•Most recent data (2012): 8% of King County youth attending public schools in the 8th, 10th and 12th grades.•Trend over time: 2004-12: falling•Description: Weight is obese: top 5% for BMI by age/gender
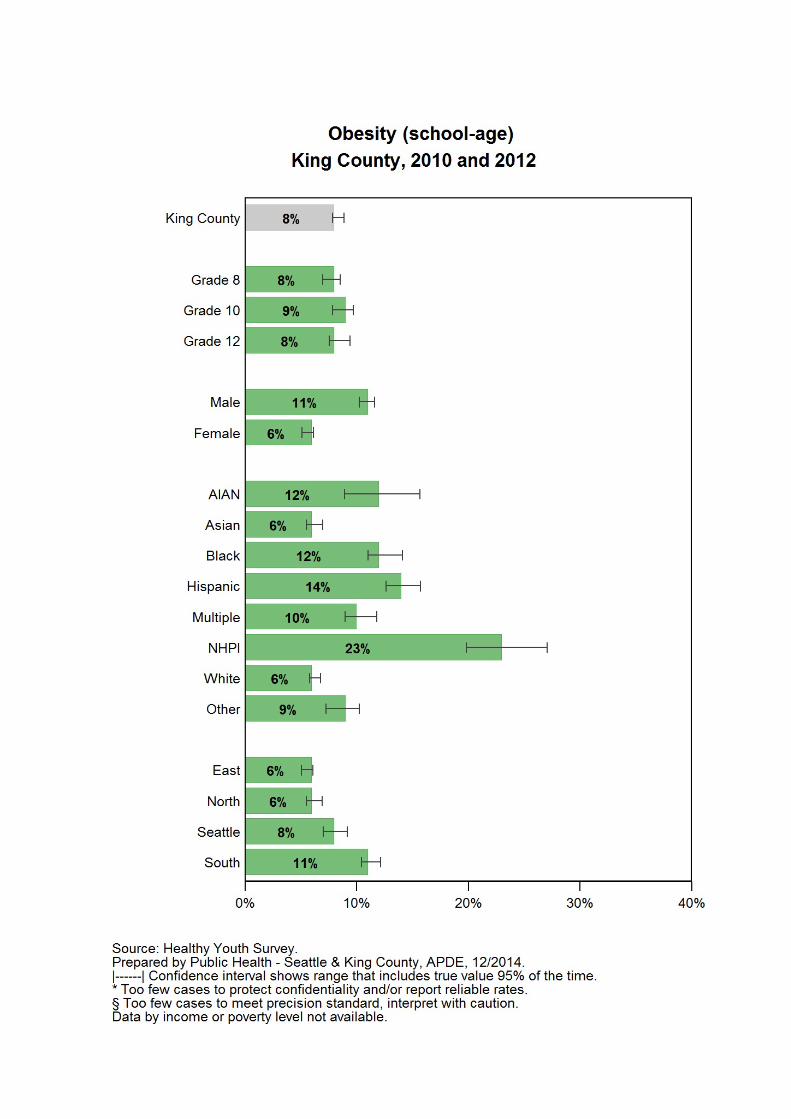
Obesity (school-age) by demographics, King County, 2010 and 2012 average
Obesity (school-age), King County, 2010 and 2012
Percent Lower CI Upper CIKing County (school-age youth in 8th,10th and 12th grades)
8 8 9
GRADEGrade 8 8 7 9
Grade 10 9 8 10
Grade 12 8 8 9
GENDERMale 11 10 12
Female 6 5 6
RACE/ETHNICITYAIAN 12 9 16
Asian 6 6 7
Black 12 11 14
Hispanic 14 13 16
Multiple 10 9 12
NHPI 23 20 27
White 6 6 7
Other 9 7 10
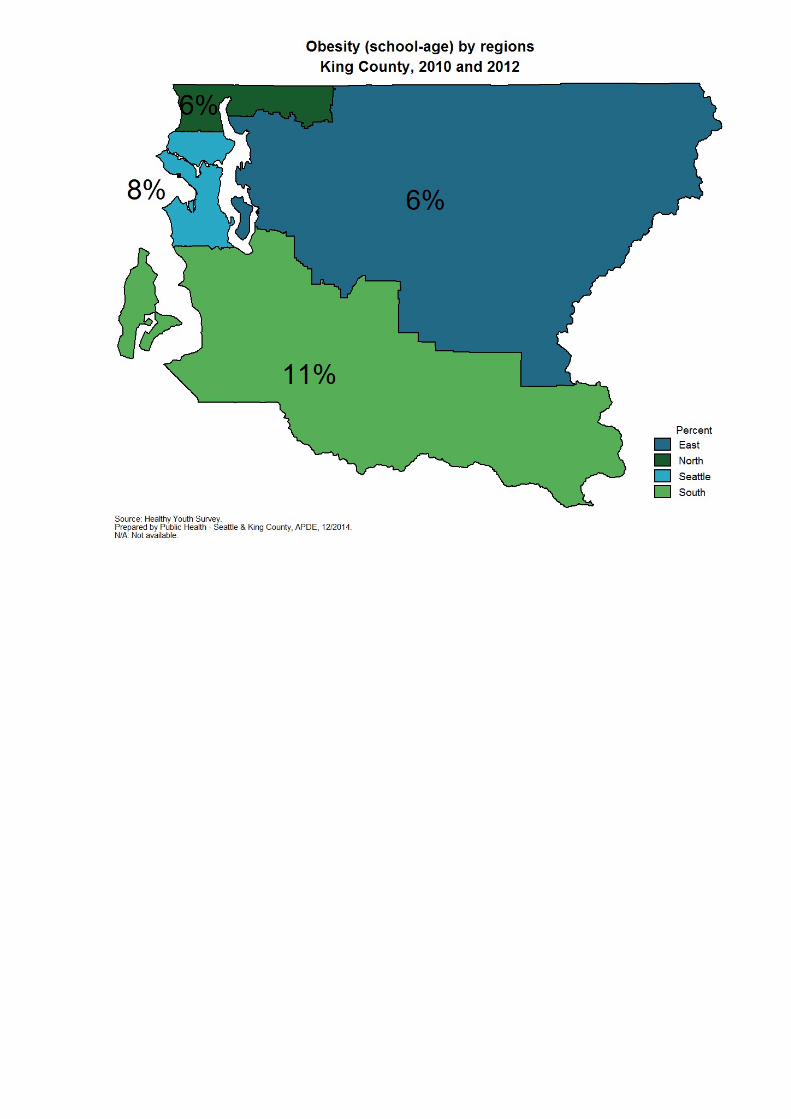
REGIONEast 6 5 6
North 6 5 7
Seattle 8 7 9
South 11 10 12
Comparisons:. Higher than King County rate (yellow). Lower than King County rate (green)
Notes:Source: Healthy Youth Survey.Prepared by Public Health - Seattle & King County, APDE, 12/2014.CI is 95% Confidence Interval.* Too few cases to protect confidentiality and/or report reliable rates.§ Too few cases to meet precision standard, interpret with caution.Data by income or poverty level not available.
Obesity (school-age) by demographics, King County, 2010 and 2012 average
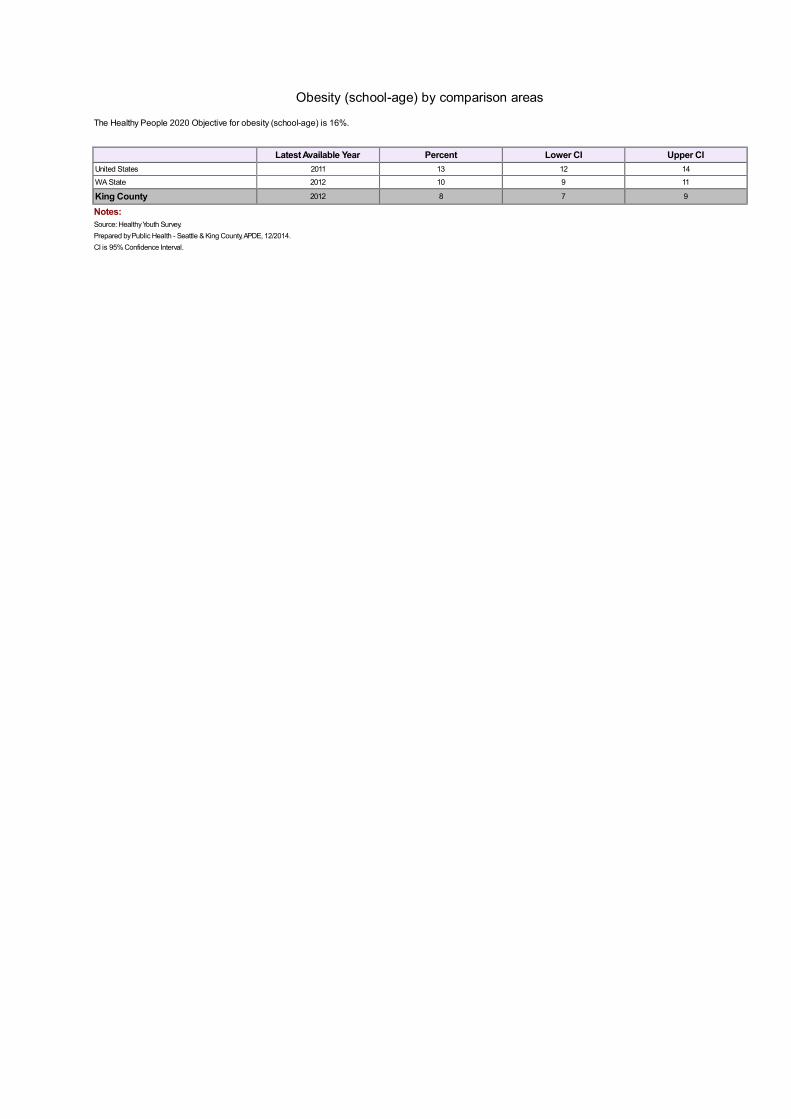
Obesity (school-age) by comparison areas
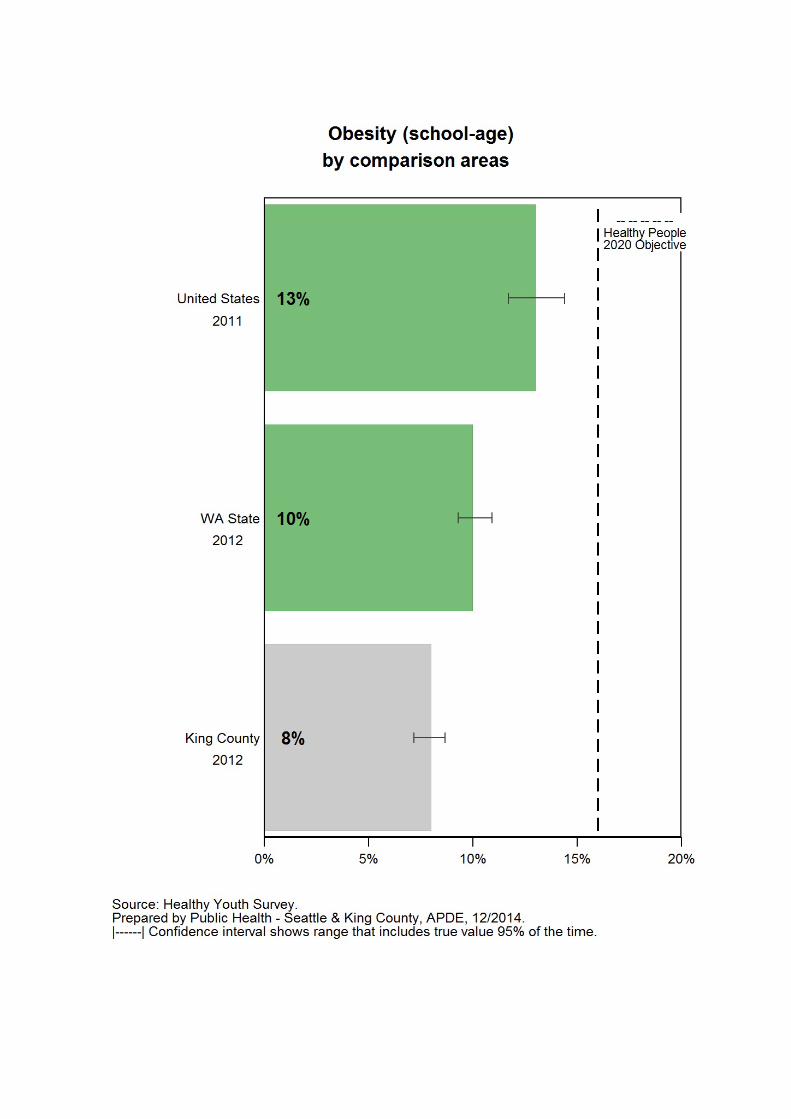
Obesity (school-age) by comparison areas
The Healthy People 2020 Objective for obesity (school-age) is 16%.
. Latest Available Year Percent Lower CI Upper CIUnited States 2011 13 12 14
WA State 2012 10 9 11
King County 2012 8 7 9
Notes:Source: Healthy Youth Survey.Prepared by Public Health - Seattle & King County, APDE, 12/2014.CI is 95% Confidence Interval.
Obesity (school-age) {crlf}by comparison areas
Obesity (school-age) by regions, King County, 2010 and 2012
Obesity (school-age), King County, 2004-2012
Produced by theAssessment, Policy Development & Evaluation Unit
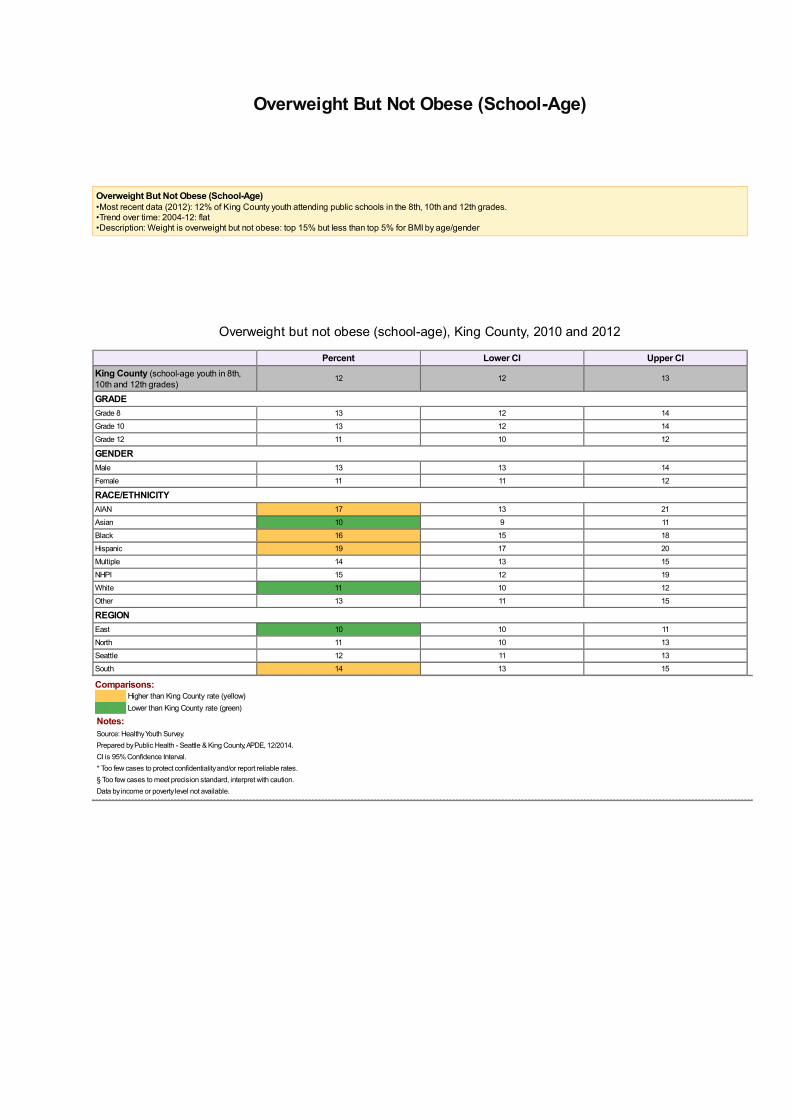
Overweight But Not Obese (School-Age)•Most recent data (2012): 12% of King County youth attending public schools in the 8th, 10th and 12th grades.•Trend over time: 2004-12: flat•Description: Weight is overweight but not obese: top 15% but less than top 5% for BMI by age/gender
Overweight but not obese (school-age) by demographics, King County, 2010 and 2012 average
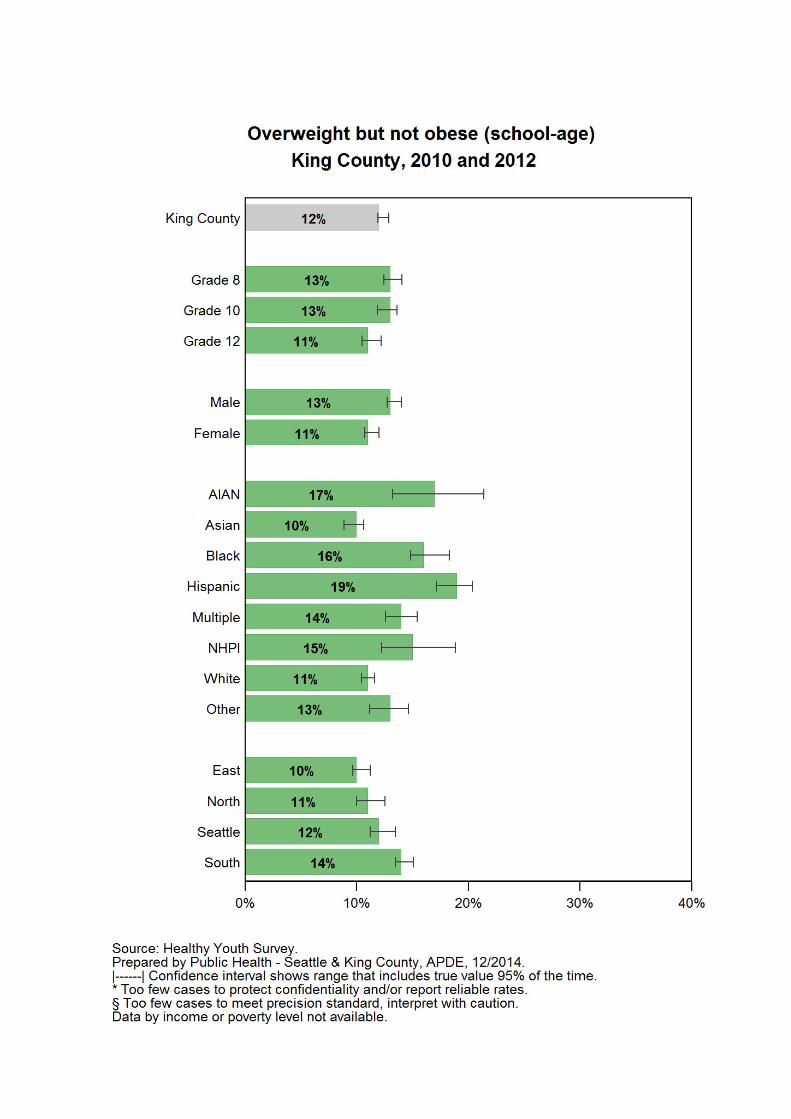
Overweight but not obese (school-age), King County, 2010 and 2012
Percent Lower CI Upper CIKing County (school-age youth in 8th,10th and 12th grades)
12 12 13
GRADEGrade 8 13 12 14
Grade 10 13 12 14
Grade 12 11 10 12
GENDERMale 13 13 14
Female 11 11 12
RACE/ETHNICITYAIAN 17 13 21
Asian 10 9 11
Black 16 15 18
Hispanic 19 17 20
Multiple 14 13 15
NHPI 15 12 19
White 11 10 12
Other 13 11 15
REGIONEast 10 10 11
North 11 10 13
Seattle 12 11 13
South 14 13 15
Comparisons:. Higher than King County rate (yellow). Lower than King County rate (green)
Notes:Source: Healthy Youth Survey.Prepared by Public Health - Seattle & King County, APDE, 12/2014.CI is 95% Confidence Interval.* Too few cases to protect confidentiality and/or report reliable rates.§ Too few cases to meet precision standard, interpret with caution.Data by income or poverty level not available.
Overweight but not obese (school-age) by demographics, King County, 2010 and 2012 average
Overweight but not obese (school-age) by comparison areas
Overweight but not obese (school-age) by comparison areas
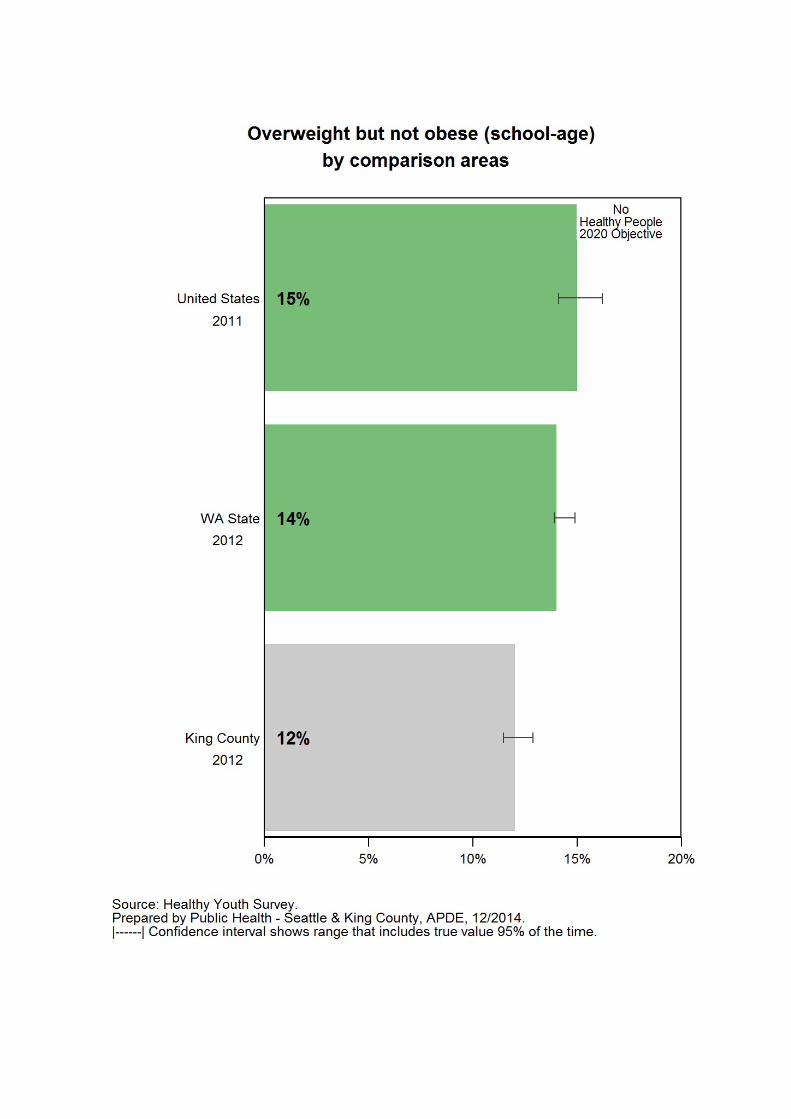
There is no Healthy People 2020 Objective for overweight but not obese (school-age).
. Latest Available Year Percent Lower CI Upper CIUnited States 2011 15 14 16
WA State 2012 14 14 15
King County 2012 12 11 13
Notes:Source: Healthy Youth Survey.Prepared by Public Health - Seattle & King County, APDE, 12/2014.CI is 95% Confidence Interval.
Overweight but not obese (school-age) {crlf}by comparison areas
Overweight but not obese (school-age) by regions, King County, 2010 and 2012
Overweight but not obese (school-age), King County, 2004-2012
Produced by theAssessment, Policy Development & Evaluation Unit
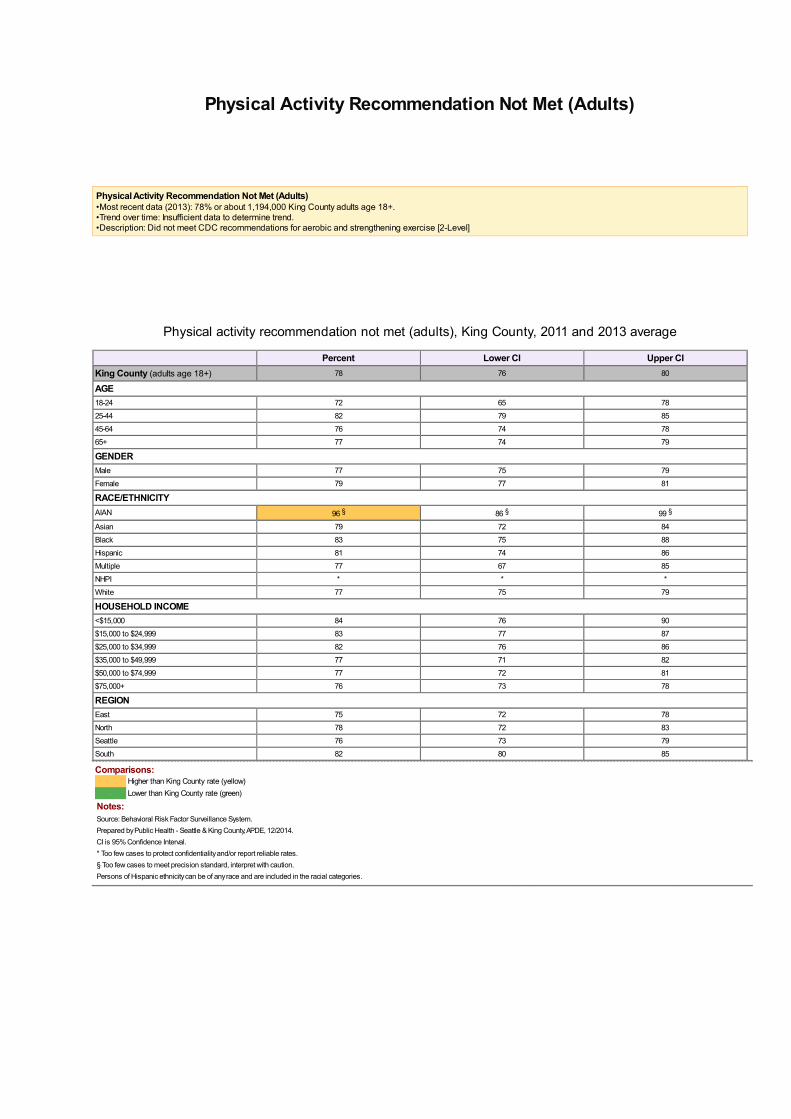
Physical Activity Recommendation Not Met (Adults)•Most recent data (2013): 78% or about 1,194,000 King County adults age 18+.•Trend over time: Insufficient data to determine trend.•Description: Did not meet CDC recommendations for aerobic and strengthening exercise [2-Level]
Physical activity not met (adults) by demographics, King Co., 2011 and 2013 ave.
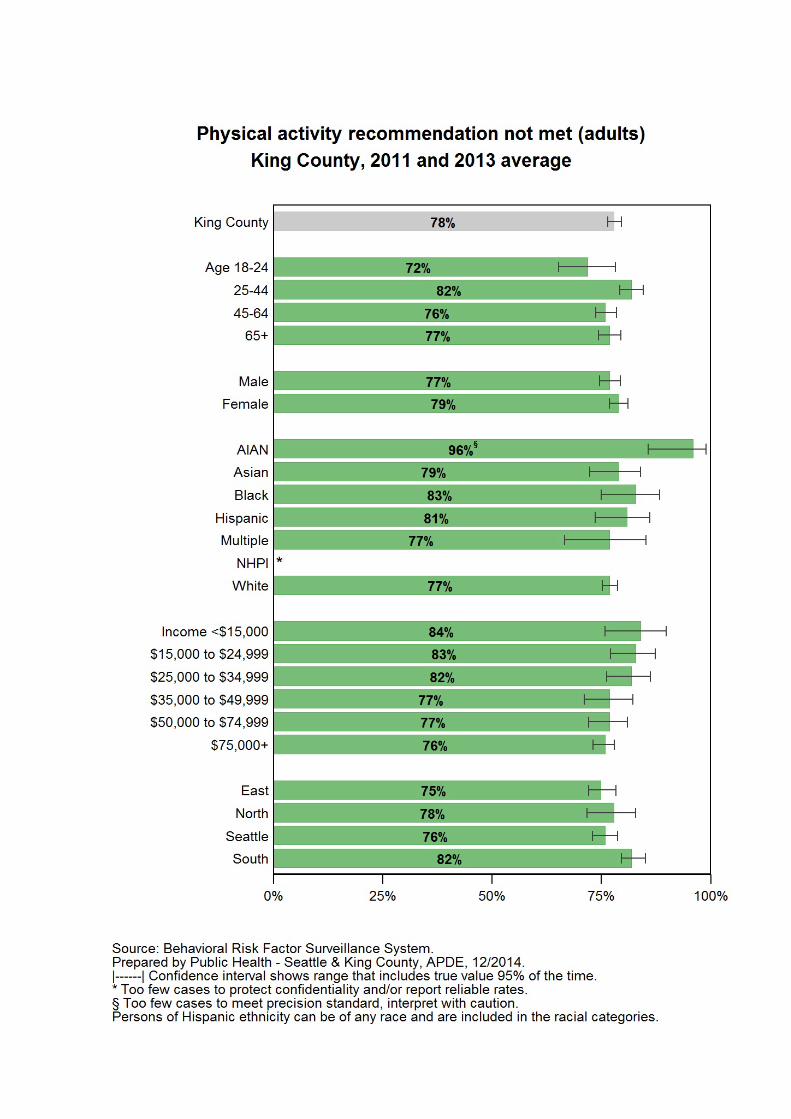
Physical activity recommendation not met (adults), King County, 2011 and 2013 average
Percent Lower CI Upper CIKing County (adults age 18+) 78 76 80
AGE18-24 72 65 78
25-44 82 79 85
45-64 76 74 78
65+ 77 74 79
GENDERMale 77 75 79
Female 79 77 81
RACE/ETHNICITYAIAN 96 § 86 § 99 §
Asian 79 72 84
Black 83 75 88
Hispanic 81 74 86
Multiple 77 67 85
NHPI * * *
White 77 75 79
HOUSEHOLD INCOME<$15,000 84 76 90
$15,000 to $24,999 83 77 87
$25,000 to $34,999 82 76 86
$35,000 to $49,999 77 71 82
$50,000 to $74,999 77 72 81
$75,000+ 76 73 78
REGIONEast 75 72 78
North 78 72 83
Seattle 76 73 79
South 82 80 85
Comparisons:. Higher than King County rate (yellow). Lower than King County rate (green)
Notes:Source: Behavioral Risk Factor Surveillance System.Prepared by Public Health - Seattle & King County, APDE, 12/2014.CI is 95% Confidence Interval.* Too few cases to protect confidentiality and/or report reliable rates.§ Too few cases to meet precision standard, interpret with caution.Persons of Hispanic ethnicity can be of any race and are included in the racial categories.
Physical activity not met (adults) by demographics, King Co., 2011 and 2013 ave.
Physical activity recommendation not met (adults) by comparison areas
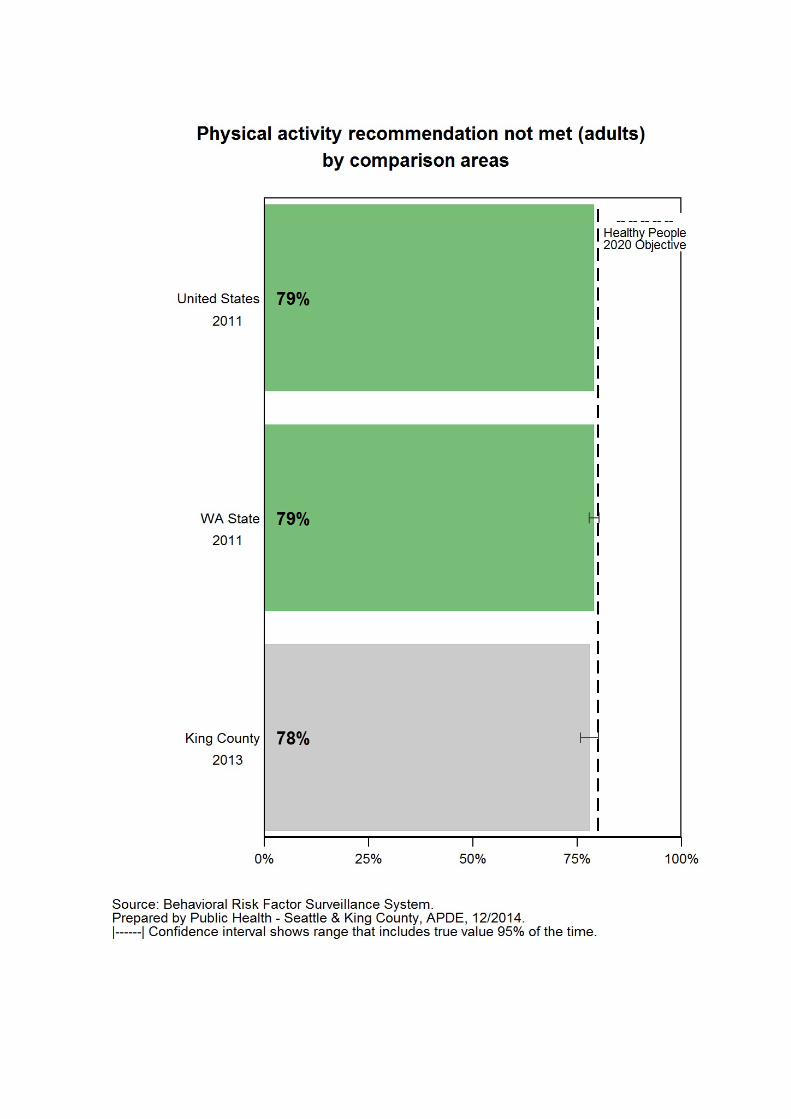
Physical activity recommendation not met (adults) by comparison areas
The Healthy People 2020 Objective for physical activity recommendation not met (adults) is 80%.
. Latest Available Year Percent Lower CI Upper CIUnited States 2011 79 N/A N/A
WA State 2011 79 78 80
King County 2013 78 76 80
Notes:Source: Behavioral Risk Factor Surveillance System.Prepared by Public Health - Seattle & King County, APDE, 12/2014.N/A: Not available.CI is 95% Confidence Interval.
Physical activity recommendation not met (adults) {crlf}by comparison areas
Physical activity recommendation not met (adults) by health reporting areas
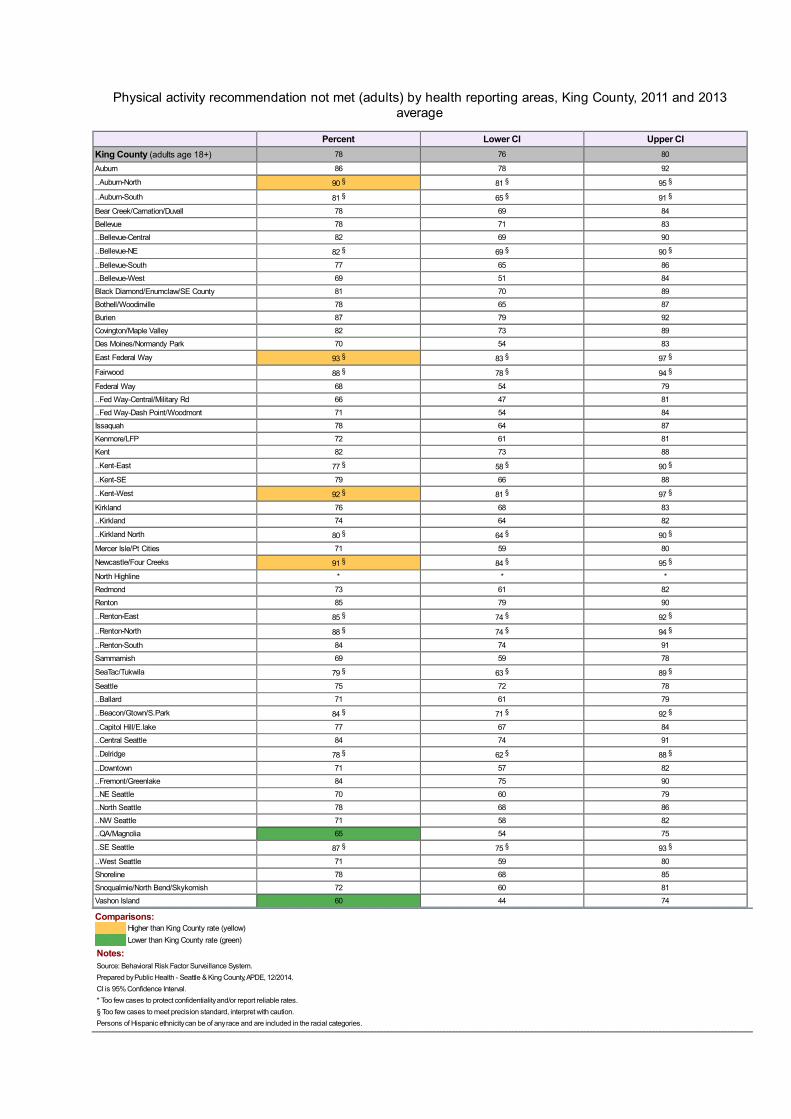
Physical activity recommendation not met (adults) by health reporting areas, King County, 2011 and 2013average
Percent Lower CI Upper CIKing County (adults age 18+) 78 76 80
Auburn 86 78 92
..Auburn-North 90 § 81 § 95 §
..Auburn-South 81 § 65 § 91 §
Bear Creek/Carnation/Duvall 78 69 84
Bellevue 78 71 83
..Bellevue-Central 82 69 90
..Bellevue-NE 82 § 69 § 90 §
..Bellevue-South 77 65 86
..Bellevue-West 69 51 84
Black Diamond/Enumclaw/SE County 81 70 89
Bothell/Woodinville 78 65 87
Burien 87 79 92
Covington/Maple Valley 82 73 89
Des Moines/Normandy Park 70 54 83
East Federal Way 93 § 83 § 97 §
Fairwood 88 § 78 § 94 §
Federal Way 68 54 79
..Fed Way-Central/Military Rd 66 47 81
..Fed Way-Dash Point/Woodmont 71 54 84
Issaquah 78 64 87
Kenmore/LFP 72 61 81
Kent 82 73 88
..Kent-East 77 § 58 § 90 §
..Kent-SE 79 66 88
..Kent-West 92 § 81 § 97 §
Kirkland 76 68 83
..Kirkland 74 64 82
..Kirkland North 80 § 64 § 90 §
Mercer Isle/Pt Cities 71 59 80
Newcastle/Four Creeks 91 § 84 § 95 §
North Highline * * *
Redmond 73 61 82
Renton 85 79 90
..Renton-East 85 § 74 § 92 §
..Renton-North 88 § 74 § 94 §
..Renton-South 84 74 91
Sammamish 69 59 78
SeaTac/Tukwila 79 § 63 § 89 §
Seattle 75 72 78
..Ballard 71 61 79
..Beacon/Gtown/S.Park 84 § 71 § 92 §
..Capitol Hill/E.lake 77 67 84
..Central Seattle 84 74 91
..Delridge 78 § 62 § 88 §
..Downtown 71 57 82
..Fremont/Greenlake 84 75 90
..NE Seattle 70 60 79
..North Seattle 78 68 86
..NW Seattle 71 58 82
..QA/Magnolia 65 54 75
..SE Seattle 87 § 75 § 93 §
..West Seattle 71 59 80
Shoreline 78 68 85
Snoqualmie/North Bend/Skykomish 72 60 81
Vashon Island 60 44 74
Comparisons:. Higher than King County rate (yellow). Lower than King County rate (green)
Notes:Source: Behavioral Risk Factor Surveillance System.Prepared by Public Health - Seattle & King County, APDE, 12/2014.CI is 95% Confidence Interval.* Too few cases to protect confidentiality and/or report reliable rates.§ Too few cases to meet precision standard, interpret with caution.Persons of Hispanic ethnicity can be of any race and are included in the racial categories.
Physical activity recommendation not met (adults) by health reporting areas
Produced by theAssessment, Policy Development & Evaluation Unit
Physical Activity Recommendation Not Met (School-Age)
Physical Activity Recommendation Not Met (School-Age)•Most recent data (2012): 76% of King County youth attending public schools in the 6th, 8th, 10th and 12th grades.•Trend over time: 2006-12: falling•Description: Did not participate in physical activity for 60+ minutes on 7 of the past 7 days
Physical activity not met (school-age) by demographics, King Co., 2010 and 2012 ave.
Physical activity recommendation not met (school-age), King County, 2010 and 2012
Percent Lower CI Upper CIKing County (school-age youth in 6th,8th, 10th and 12th grades)
76 76 77
GRADEGrade 6 72 71 72
Grade 8 74 73 75
Grade 10 81 80 82
Grade 12 83 82 84
GENDERMale 71 70 71
Female 82 82 83
RACE/ETHNICITYAIAN 69 66 72
Asian 82 81 83
Black 73 71 74
Hispanic 79 78 80
Multiple 74 73 76
NHPI 75 72 77
White 76 75 76
Other 73 72 74
REGIONEast 75 74 76
North 78 75 79
Seattle 78 76 79
South 76 75 77
Comparisons:. Higher than King County rate (yellow). Lower than King County rate (green)
Notes:Source: Healthy Youth Survey.Prepared by Public Health - Seattle & King County, APDE, 12/2014.CI is 95% Confidence Interval.* Too few cases to protect confidentiality and/or report reliable rates.§ Too few cases to meet precision standard, interpret with caution.Data by income or poverty level not available.
Physical activity not met (school-age) by demographics, King Co., 2010 and 2012 ave.
Physical activity recommendation not met (school-age) by comparison areas
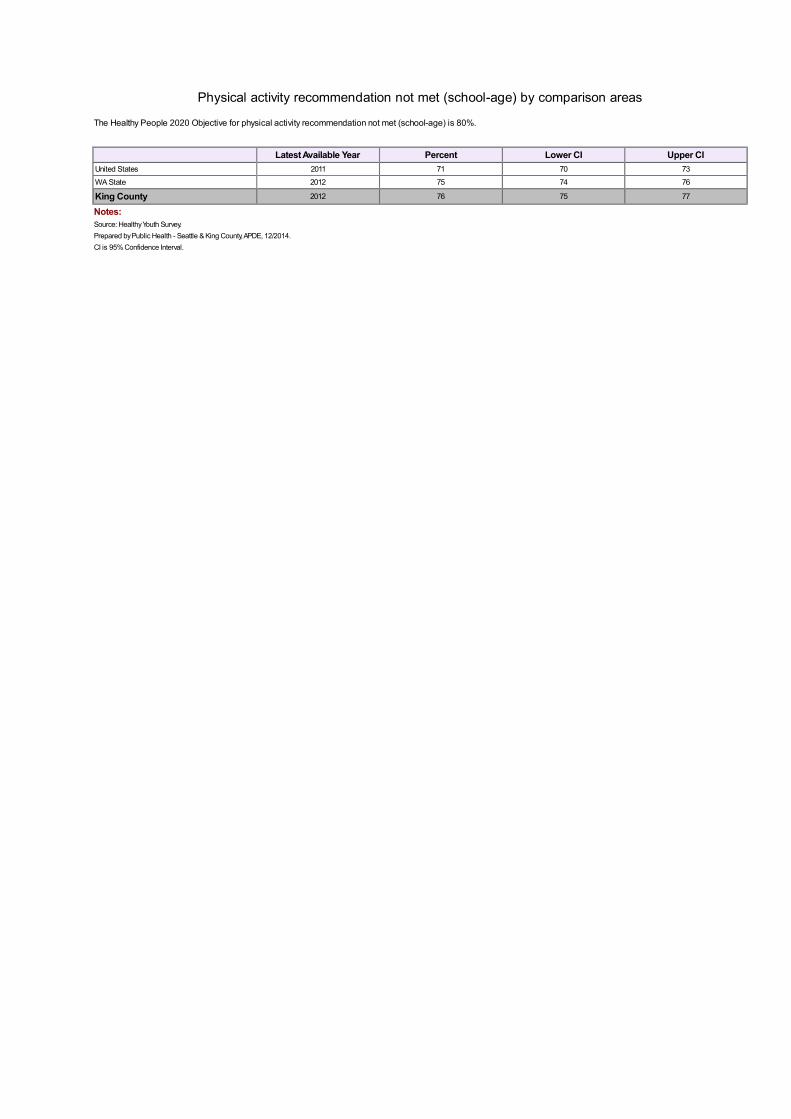
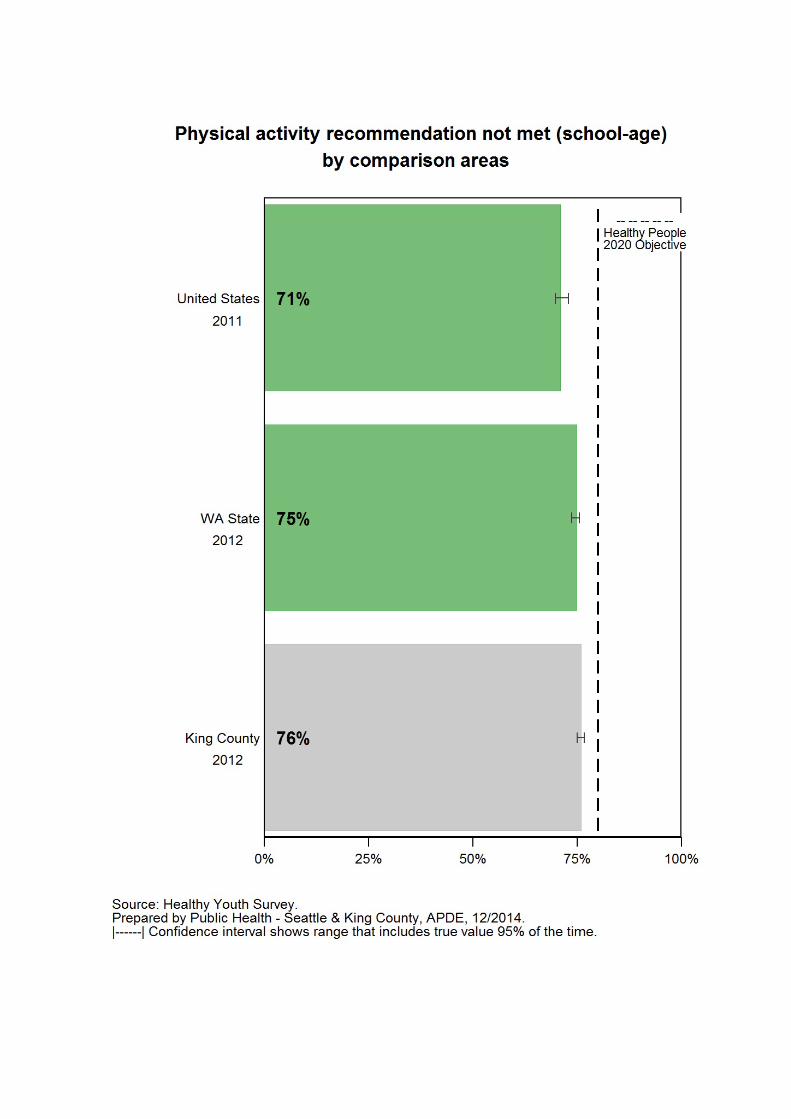
Physical activity recommendation not met (school-age) by comparison areas
The Healthy People 2020 Objective for physical activity recommendation not met (school-age) is 80%.
. Latest Available Year Percent Lower CI Upper CIUnited States 2011 71 70 73
WA State 2012 75 74 76
King County 2012 76 75 77
Notes:Source: Healthy Youth Survey.Prepared by Public Health - Seattle & King County, APDE, 12/2014.CI is 95% Confidence Interval.
Physical activity recommendation not met (school-age) {crlf}by comparison areas
Physical activity recommendation not met (school-age) by regions, King County, 2010 and 2012
Physical activity recommendation not met (school-age), King County, 2004-2012
Produced by theAssessment, Policy Development & Evaluation Unit
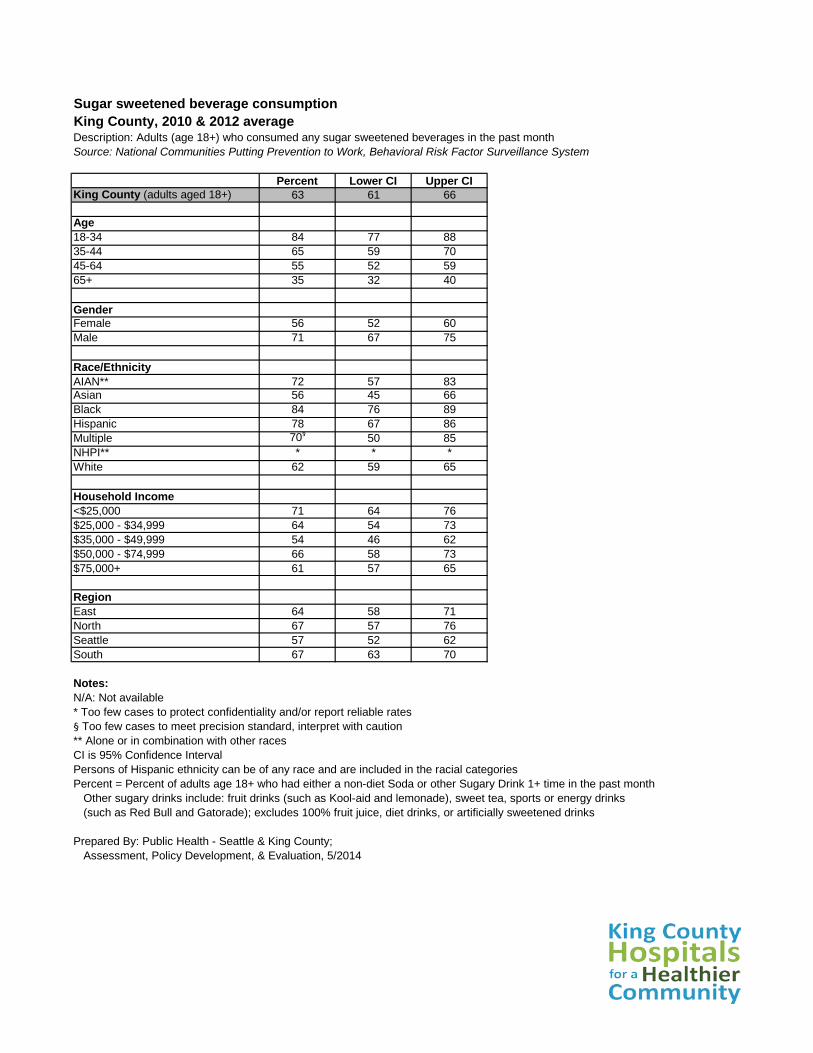
Sugar sweetened beverage consumptionKing County, 2010 & 2012 averageDescription: Adults (age 18+) who consumed any sugar sweetened beverages in the past monthSource: National Communities Putting Prevention to Work, Behavioral Risk Factor Surveillance System
Percent Lower CI Upper CIKing County (adults aged 18+) 63 61 66
Notes:N/A: Not available* Too few cases to protect confidentiality and/or report reliable rates§ Too few cases to meet precision standard, interpret with caution** Alone or in combination with other racesCI is 95% Confidence IntervalPersons of Hispanic ethnicity can be of any race and are included in the racial categoriesPercent = Percent of adults age 18+ who had either a non-diet Soda or other Sugary Drink 1+ time in the past month
Other sugary drinks include: fruit drinks (such as Kool-aid and lemonade), sweet tea, sports or energy drinks(such as Red Bull and Gatorade); excludes 100% fruit juice, diet drinks, or artificially sweetened drinks
Prepared By: Public Health - Seattle & King County; Assessment, Policy Development, & Evaluation, 5/2014
67
57
67
64
61
66
54
64
71
62
*
70§
78
84
56
72
71
56
35
55
65
84
63
0% 25% 50% 75% 100%
South
Seattle
North
East
$75,000+
$50,000 - $74,999
$35,000 - $49,999
$25,000 - $34,999
Income <$25,000
White
NHPI**
Multiple
Hispanic
Black
Asian
AIAN**
Male
Female
65+
45-64
35-44
Age 18-34
King County
Sugar sweetened beverage consumption, King County, 2010 & 2012 average
Source: National Communities Putting Prevention to Work, Behavioral Risk Factor Surveillance System
Prepared by: Public Health Seattle & King County, Assessment, Policy Development, & Evaluation, 1/2015
|-----|: Confidence interval shows range that includes true value 95% of the time
* Too few cases to protect confidentiality and/or report reliable rates
§ Too few cases to meet precision standard, interpret with caution
** Alone or in combination with other races
Daily Soda Consumption (School-Age)
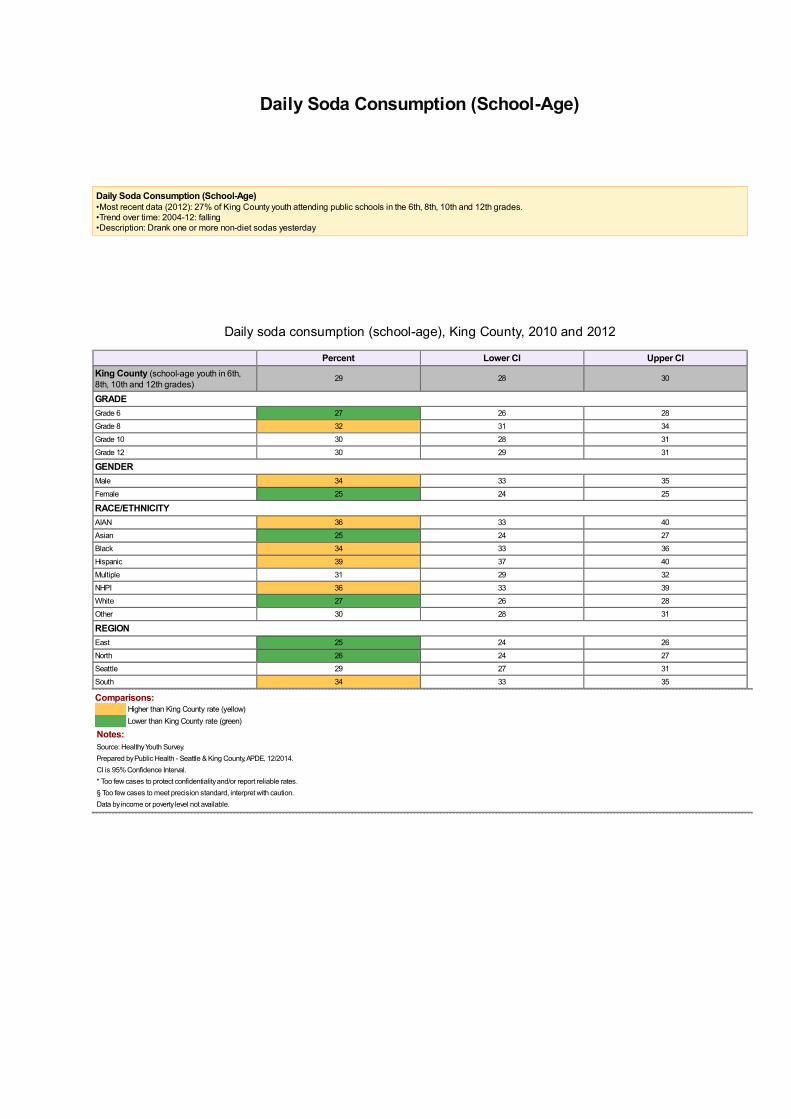
Daily Soda Consumption (School-Age)•Most recent data (2012): 27% of King County youth attending public schools in the 6th, 8th, 10th and 12th grades.•Trend over time: 2004-12: falling•Description: Drank one or more non-diet sodas yesterday
Daily soda consumption (school-age) by demographics, King County, 2010 and 2012 average
Daily soda consumption (school-age), King County, 2010 and 2012
Percent Lower CI Upper CIKing County (school-age youth in 6th,8th, 10th and 12th grades)
29 28 30
GRADEGrade 6 27 26 28
Grade 8 32 31 34
Grade 10 30 28 31
Grade 12 30 29 31
GENDERMale 34 33 35
Female 25 24 25
RACE/ETHNICITYAIAN 36 33 40
Asian 25 24 27
Black 34 33 36
Hispanic 39 37 40
Multiple 31 29 32
NHPI 36 33 39
White 27 26 28
Other 30 28 31
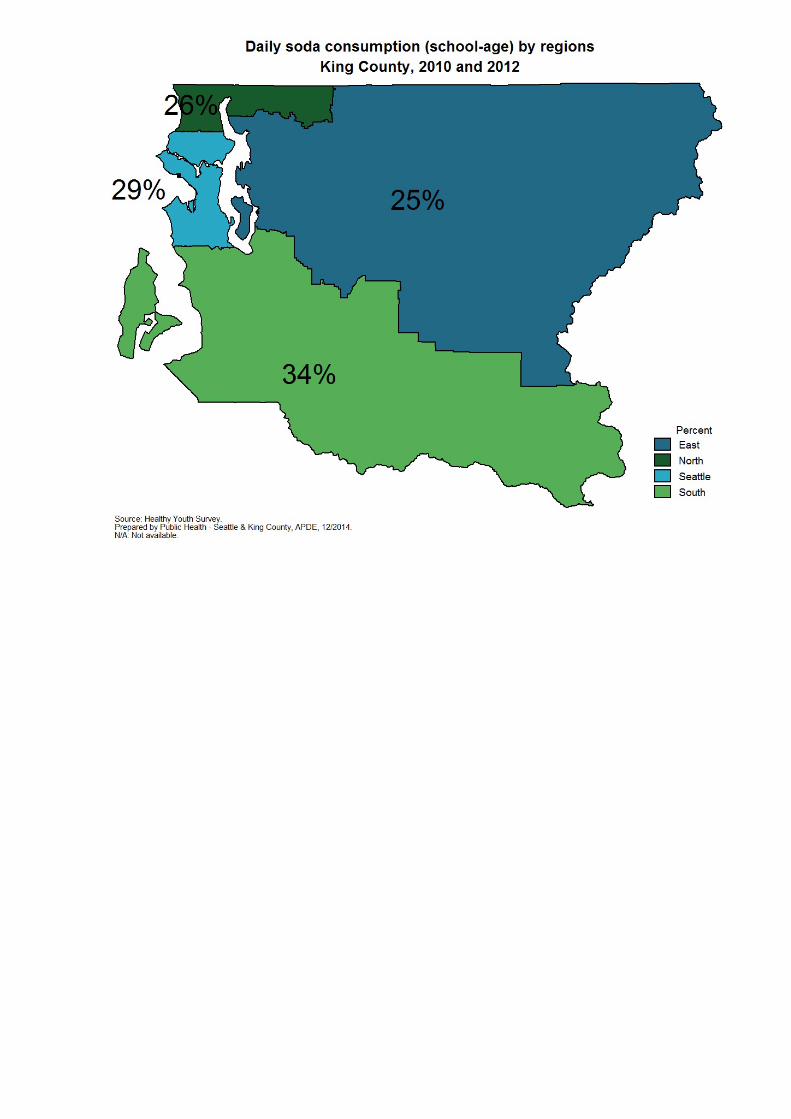
REGIONEast 25 24 26
North 26 24 27
Seattle 29 27 31
South 34 33 35
Comparisons:. Higher than King County rate (yellow). Lower than King County rate (green)
Notes:Source: Healthy Youth Survey.Prepared by Public Health - Seattle & King County, APDE, 12/2014.CI is 95% Confidence Interval.* Too few cases to protect confidentiality and/or report reliable rates.§ Too few cases to meet precision standard, interpret with caution.Data by income or poverty level not available.
Daily soda consumption (school-age) by demographics, King County, 2010 and 2012 average
Daily soda consumption (school-age) by comparison areas
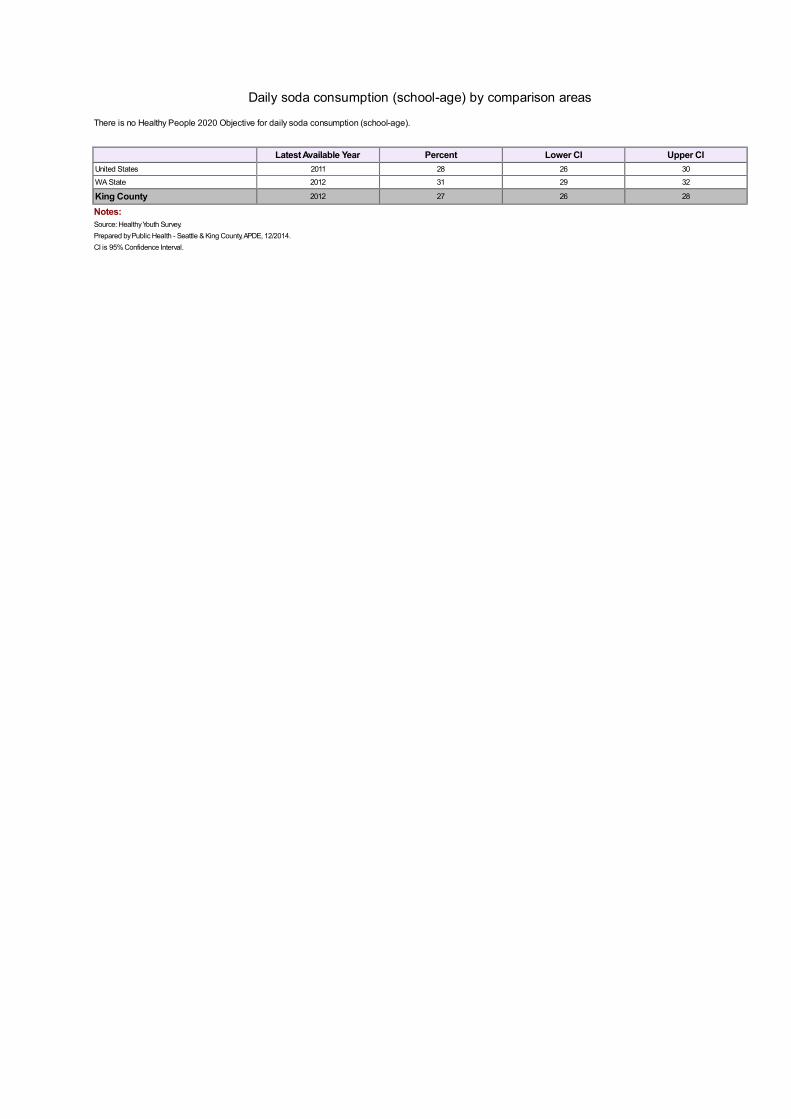
Daily soda consumption (school-age) by comparison areas
There is no Healthy People 2020 Objective for daily soda consumption (school-age).
. Latest Available Year Percent Lower CI Upper CIUnited States 2011 28 26 30
WA State 2012 31 29 32
King County 2012 27 26 28
Notes:Source: Healthy Youth Survey.Prepared by Public Health - Seattle & King County, APDE, 12/2014.CI is 95% Confidence Interval.
Daily soda consumption (school-age) {crlf}by comparison areas
Daily soda consumption (school-age) by regions, King County, 2010 and 2012
Daily soda consumption (school-age), King County, 2004-2012
Produced by theAssessment, Policy Development & Evaluation Unit
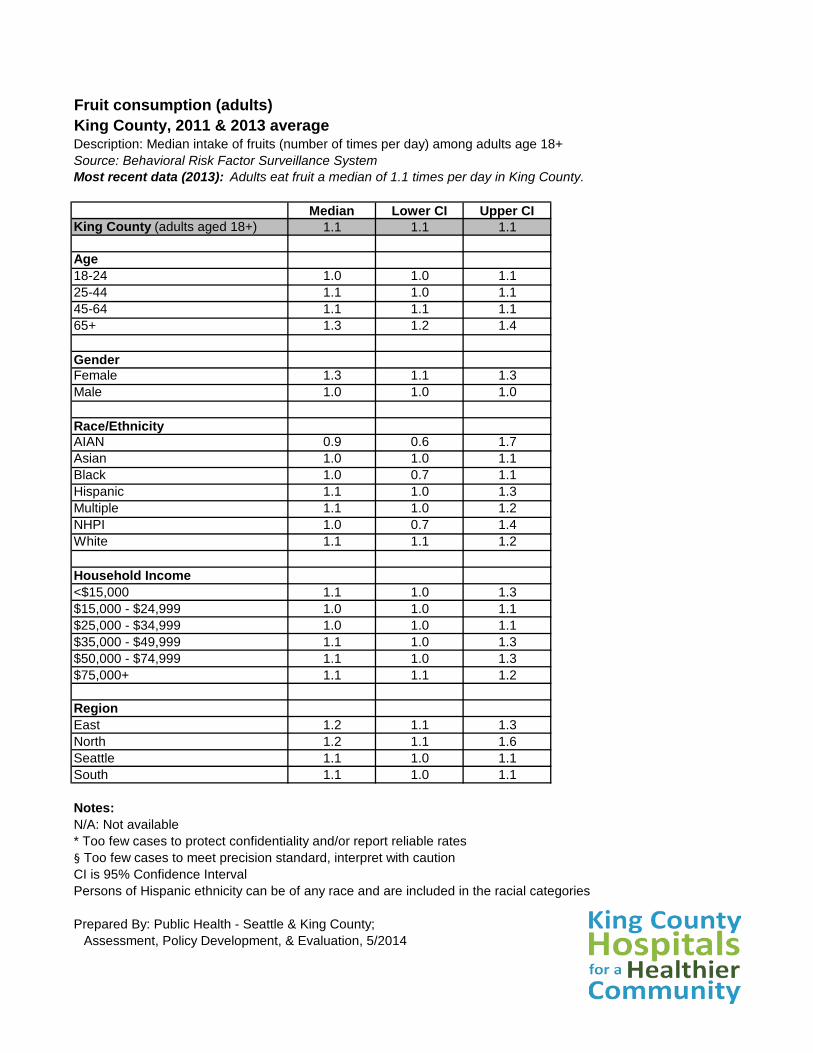
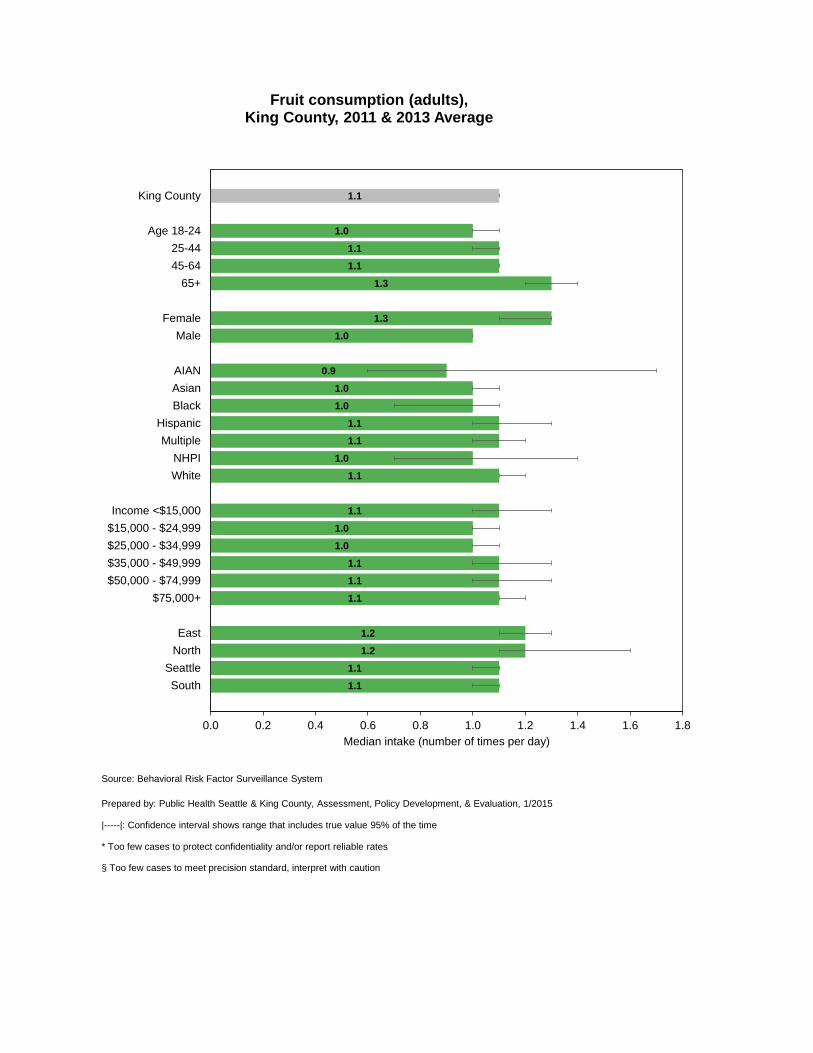
Fruit consumption (adults)King County, 2011 & 2013 averageDescription: Median intake of fruits (number of times per day) among adults age 18+Source: Behavioral Risk Factor Surveillance SystemMost recent data (2013): Adults eat fruit a median of 1.1 times per day in King County.
Median Lower CI Upper CIKing County (adults aged 18+) 1.1 1.1 1.1
Notes:N/A: Not available* Too few cases to protect confidentiality and/or report reliable rates§ Too few cases to meet precision standard, interpret with cautionCI is 95% Confidence IntervalPersons of Hispanic ethnicity can be of any race and are included in the racial categories
Prepared By: Public Health - Seattle & King County; Assessment, Policy Development, & Evaluation, 5/2014
Fruit consumption (adults) by comparison areasSource: Behavioral Risk Factor Surveillance System
There is no Healthy People 2020 Objective for median intake of fruit.Latest
Available Year Median Lower CI Upper CI
United States 2011 1.1 N/A N/AWashington State 2011 1.1 N/A N/AKing County 2013 1.1 1.0 1.1
Notes:N/A: Not availableCI is 95% Confidence IntervalMedian = median intake of fruits (number of times per day) among adults age 18+
Prepared By: Public Health - Seattle & King County; Assessment, Policy Development, & Evaluation, 1/2015
Fruit consumption (adults), King County, 2011 & 2013 Average
Source: Behavioral Risk Factor Surveillance System
Prepared by: Public Health Seattle & King County, Assessment, Policy Development, & Evaluation, 1/2015
|-----|: Confidence interval shows range that includes true value 95% of the time
* Too few cases to protect confidentiality and/or report reliable rates
§ Too few cases to meet precision standard, interpret with caution
1.1
1.1
1.1
0.0 0.5 1.0 1.5 2.0
King County, 2013
Washington State, 2011
United States, 2011
Median intake (number of times per day)
Fruit consumption (adults) by comparison Areas
Source: Behavioral Risk Factor Surveillance System
Prepared by: Public Health Seattle & King County, Assessment, Policy Development, & Evaluation, 1/2015
|-----|: Confidence interval shows range that includes true value 95% of the time
No Healthy People 2020 Objective
Vegetable Consumption (adults)King County, 2011 & 2013 averageDescription: Median intake of vegetables (number of times per day) among adults age 18+Source: Behavioral Risk Factor Surveillance SystemMost recent data (2013): Adults eat vegetables a median of 1.8 times per day in King County.
Median Lower CI Upper CIKing County (adults aged 18+) 1.8 1.8 1.9
Notes:N/A: Not available* Too few cases to protect confidentiality and/or report reliable rates§ Too few cases to meet precision standard, interpret with cautionCI is 95% Confidence IntervalPersons of Hispanic ethnicity can be of any race and are included in the racial categories
Prepared By: Public Health - Seattle & King County; Assessment, Policy Development, & Evaluation, 5/2014
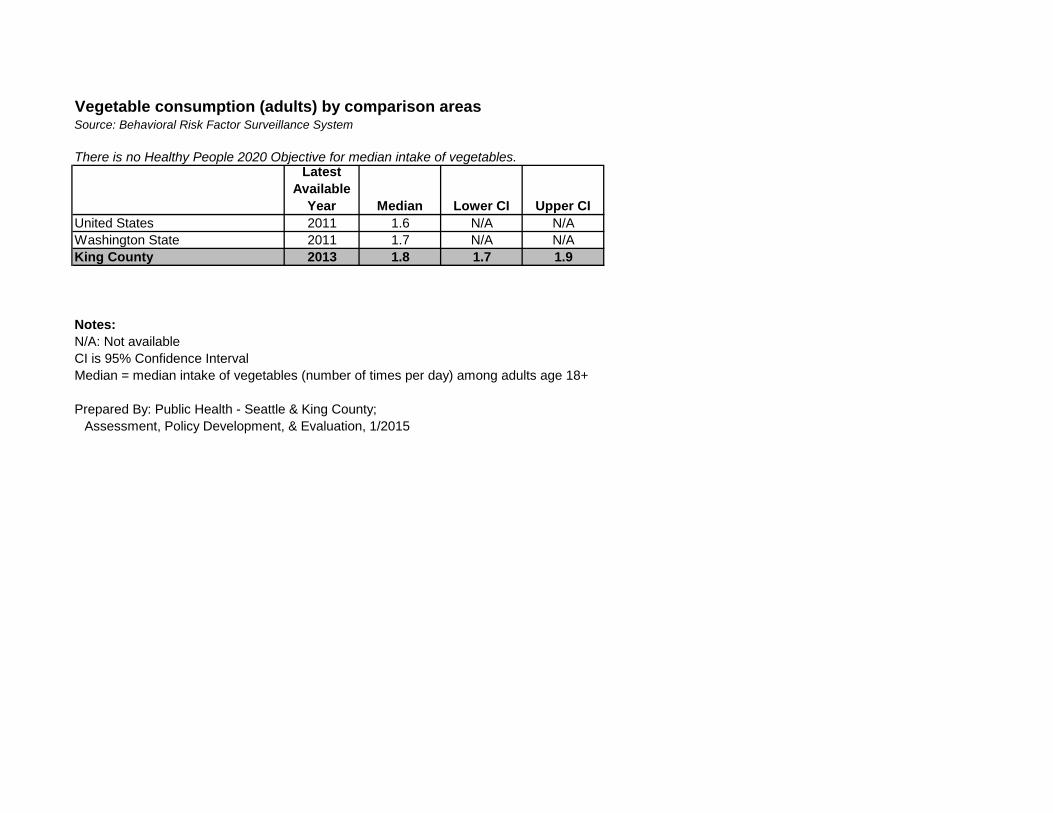
Vegetable consumption (adults) by comparison areasSource: Behavioral Risk Factor Surveillance System
There is no Healthy People 2020 Objective for median intake of vegetables.Latest
Available Year Median Lower CI Upper CI
United States 2011 1.6 N/A N/AWashington State 2011 1.7 N/A N/AKing County 2013 1.8 1.7 1.9
Notes:N/A: Not availableCI is 95% Confidence IntervalMedian = median intake of vegetables (number of times per day) among adults age 18+
Prepared By: Public Health - Seattle & King County; Assessment, Policy Development, & Evaluation, 1/2015
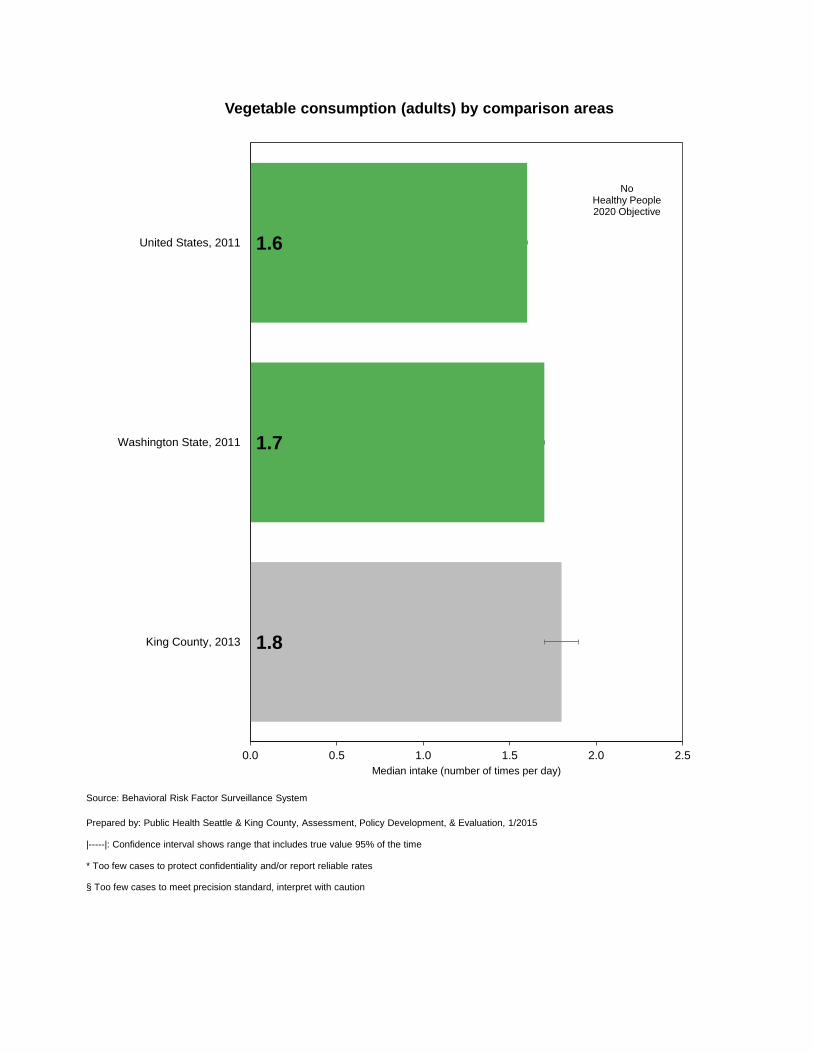
Vegetable consumption (adults), King County, 2011 & 2013 average
Source: Behavioral Risk Factor Surveillance System
Prepared by: Public Health Seattle & King County, Assessment, Policy Development, & Evaluation, 1/2015
|-----|: Confidence interval shows range that includes true value 95% of the time
* Too few cases to protect confidentiality and/or report reliable rates
§ Too few cases to meet precision standard, interpret with caution
1.8
1.7
1.6
0.0 0.5 1.0 1.5 2.0 2.5
King County, 2013
Washington State, 2011
United States, 2011
Median intake (number of times per day)
Vegetable consumption (adults) by comparison areas
No Healthy People 2020 Objective
Source: Behavioral Risk Factor Surveillance System
Prepared by: Public Health Seattle & King County, Assessment, Policy Development, & Evaluation, 1/2015
|-----|: Confidence interval shows range that includes true value 95% of the time
* Too few cases to protect confidentiality and/or report reliable rates
§ Too few cases to meet precision standard, interpret with caution
Cigarette Smoking (Adults)
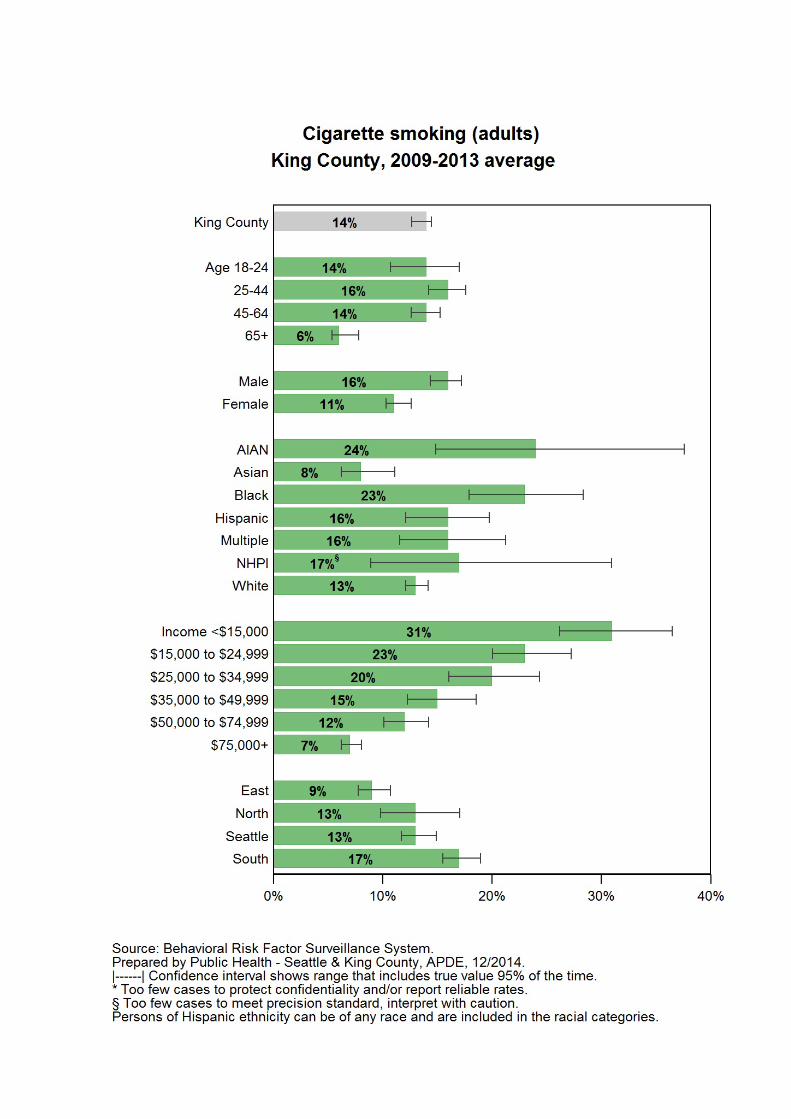
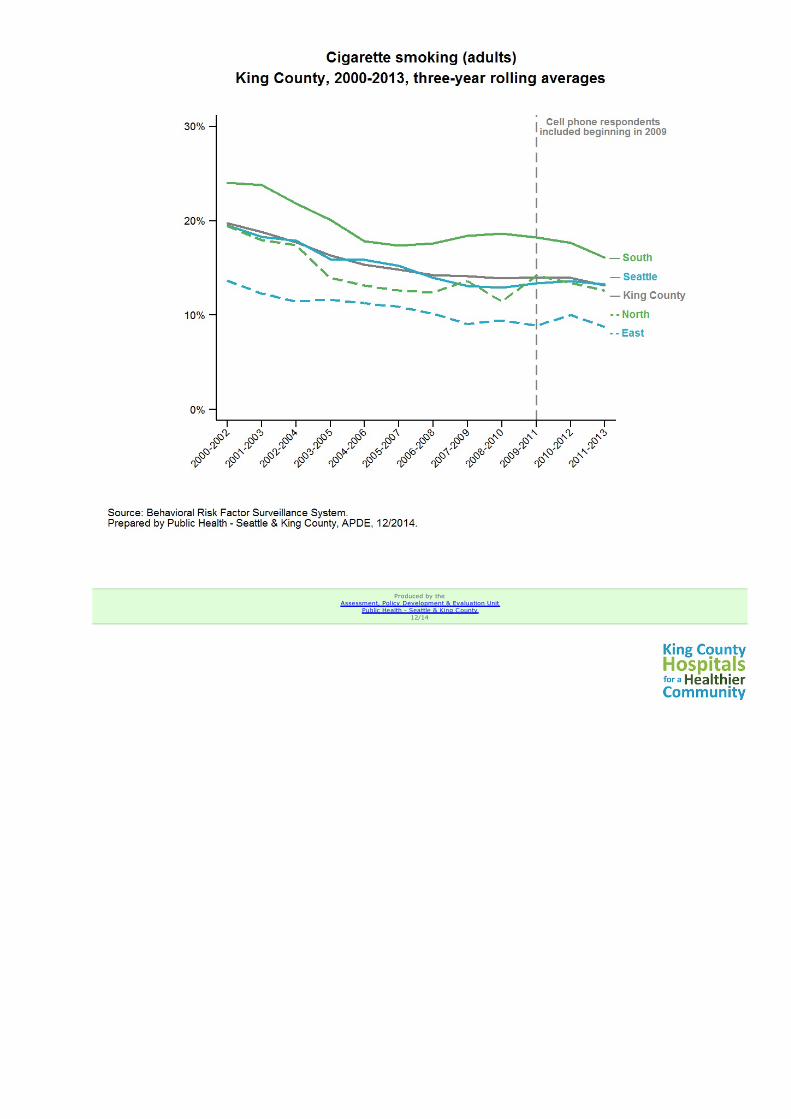
Cigarette Smoking (Adults)•Most recent data (2013): 12% or about 182,500 King County adults age 18+.•Trend over time: 2000-13: falling•Description: Now smoke cigarettes every day or some days
Cigarette smoking (adults) by demographics, King County, 2009-2013 average
Cigarette smoking (adults), King County, 2009-2013 average
Percent Lower CI Upper CIKing County (adults age 18+) 14 13 14
AGE18-24 14 11 17
25-44 16 14 18
45-64 14 13 15
65+ 6 5 8
GENDERMale 16 14 17
Female 11 10 13
RACE/ETHNICITYAIAN 24 15 38
Asian 8 6 11
Black 23 18 28
Hispanic 16 12 20
Multiple 16 12 21
NHPI 17 § 9 § 31 §
White 13 12 14
HOUSEHOLD INCOME<$15,000 31 26 36
$15,000 to $24,999 23 20 27
$25,000 to $34,999 20 16 24
$35,000 to $49,999 15 12 19
$50,000 to $74,999 12 10 14
$75,000+ 7 6 8
REGIONEast 9 8 11
North 13 10 17
Seattle 13 12 15
South 17 16 19
Comparisons:. Higher than King County rate (yellow). Lower than King County rate (green)
Notes:Source: Behavioral Risk Factor Surveillance System.Prepared by Public Health - Seattle & King County, APDE, 12/2014.CI is 95% Confidence Interval.* Too few cases to protect confidentiality and/or report reliable rates.§ Too few cases to meet precision standard, interpret with caution.Persons of Hispanic ethnicity can be of any race and are included in the racial categories.
Cigarette smoking (adults) by demographics, King County, 2009-2013 average
Cigarette smoking (adults) by comparison areas
Cigarette smoking (adults) by comparison areas
The Healthy People 2020 Objective for cigarette smoking (adults) is 12%.
. Latest Available Year Percent Lower CI Upper CIUnited States 2012 20 N/A N/A
WA State 2012 17 16 18
King County 2013 12 10 14
Notes:Source: Behavioral Risk Factor Surveillance System.Prepared by Public Health - Seattle & King County, APDE, 12/2014.N/A: Not available.CI is 95% Confidence Interval.
Cigarette smoking (adults) {crlf}by comparison areas
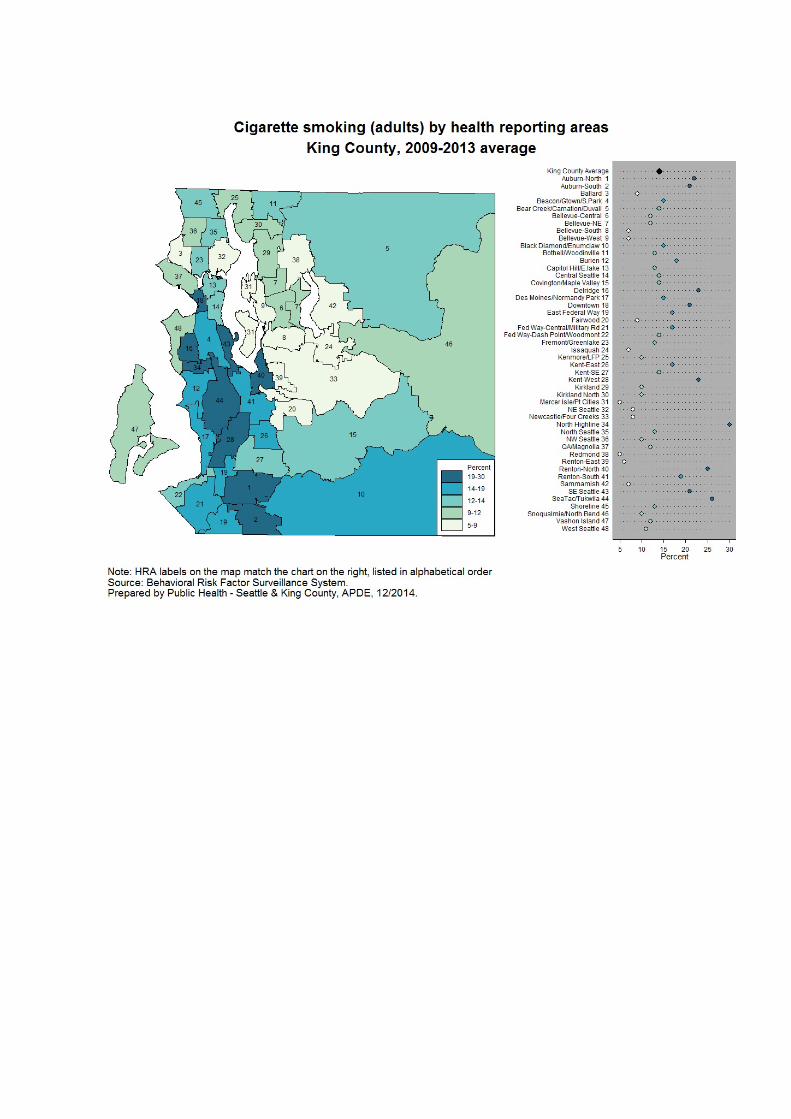
Cigarette smoking (adults) by health reporting areas, King County, 2009-2013 average
Cigarette smoking (adults) by health reporting areas, King County, 2009-2013 average
Percent Lower CI Upper CIKing County (adults age 18+) 14 13 14
Auburn 22 16 29
..Auburn-North 22 14 34
..Auburn-South 21 13 31
Bear Creek/Carnation/Duvall 14 9 21
Bellevue 9 7 12
..Bellevue-Central 12 7 19
..Bellevue-NE 12 7 19
..Bellevue-South 7 4 12
..Bellevue-West 7 § 3 § 13 §
Black Diamond/Enumclaw/SE County 15 10 21
Bothell/Woodinville 13 7 22
Burien 18 13 25
Covington/Maple Valley 14 10 21
Des Moines/Normandy Park 15 10 24
East Federal Way 17 11 25
Fairwood 9 § 5 § 17 §
Federal Way 16 12 21
..Fed Way-Central/Military Rd 17 12 23
..Fed Way-Dash Point/Woodmont 14 9 23
Issaquah 7 § 4 § 13 §
Kenmore/LFP 10 6 17
Kent 17 13 22
..Kent-East 17 10 26
..Kent-SE 14 10 21
..Kent-West 23 14 36
Kirkland 10 7 15
..Kirkland 10 6 17
..Kirkland North 10 6 16
Mercer Isle/Pt Cities 5 § 3 § 10 §
Newcastle/Four Creeks 8 5 13
North Highline 30 16 47
Redmond 5 3 9
Renton 18 13 23
..Renton-East 6 § 3 § 13 §
..Renton-North 25 15 39
..Renton-South 19 13 27
Sammamish 7 5 11
SeaTac/Tukwila 26 18 35
Seattle 13 12 15
..Ballard 9 5 15
..Beacon/Gtown/S.Park 15 9 24
..Capitol Hill/E.lake 13 8 20
..Central Seattle 14 9 21
..Delridge 23 15 34
..Downtown 21 14 29
..Fremont/Greenlake 13 8 21
..NE Seattle 8 5 13
..North Seattle 13 9 19
..NW Seattle 10 6 14
..QA/Magnolia 12 8 18
..SE Seattle 21 14 30
..West Seattle 11 7 16
Shoreline 13 9 18
Snoqualmie/North Bend/Skykomish 10 6 16
Vashon Island 12 § 6 § 23 §
Comparisons:. Higher than King County rate (yellow). Lower than King County rate (green)
Notes:Source: Behavioral Risk Factor Surveillance System.Prepared by Public Health - Seattle & King County, APDE, 12/2014.CI is 95% Confidence Interval.* Too few cases to protect confidentiality and/or report reliable rates.§ Too few cases to meet precision standard, interpret with caution.Persons of Hispanic ethnicity can be of any race and are included in the racial categories.
Cigarette smoking (adults) by health reporting areas, King County, 2009-2013 average
Cigarette smoking (adults), King County, 2000-2013, three-year rolling averages
Produced by theAssessment, Policy Development & Evaluation Unit
Cigarette Smoking (School-Age)•Most recent data (2012): 8% of King County youth attending public schools in the 8th, 10th and 12th grades.•Trend over time: 2004-12: falling•Description: Smoked cigarettes on one or more of the past 30 days
Cigarette smoking (school-age) by demographics, King County, 2010 and 2012 average
Cigarette smoking (school-age), King County, 2010 and 2012
Percent Lower CI Upper CIKing County (school-age youth in 8th,10th and 12th grades)
9 8 9
GRADEGrade 8 4 4 4
Grade 10 8 8 9
Grade 12 14 13 15
GENDERMale 10 9 11
Female 7 7 8
RACE/ETHNICITYAIAN 17 15 20
Asian 5 4 5
Black 10 8 11
Hispanic 10 9 11
Multiple 9 9 10
NHPI 14 12 16
White 9 8 10
Other 8 7 9
REGIONEast 8 7 9
North 9 7 11
Seattle 10 8 11
South 9 8 10
Comparisons:. Higher than King County rate (yellow). Lower than King County rate (green)
Notes:Source: Healthy Youth Survey.Prepared by Public Health - Seattle & King County, APDE, 12/2014.CI is 95% Confidence Interval.* Too few cases to protect confidentiality and/or report reliable rates.§ Too few cases to meet precision standard, interpret with caution.Data by income or poverty level not available.
Cigarette smoking (school-age) by demographics, King County, 2010 and 2012 average
Cigarette smoking (school-age) by comparison areas
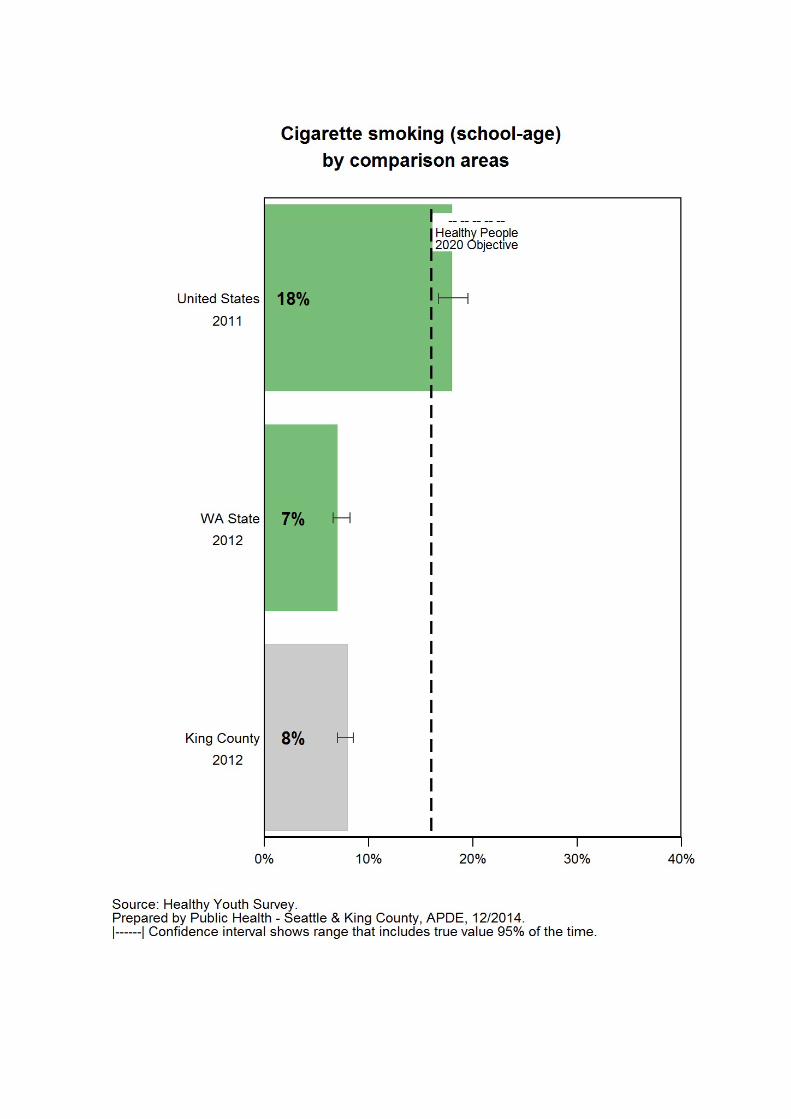
Cigarette smoking (school-age) by comparison areas
The Healthy People 2020 Objective for cigarette smoking (school-age) is 16%.
. Latest Available Year Percent Lower CI Upper CIUnited States 2011 18 17 20
WA State 2012 7 7 8
King County 2012 8 7 9
Notes:Source: Healthy Youth Survey.Prepared by Public Health - Seattle & King County, APDE, 12/2014.CI is 95% Confidence Interval.
Cigarette smoking (school-age) {crlf}by comparison areas
Cigarette smoking (school-age) by regions, King County, 2010 and 2012
Cigarette smoking (school-age), King County, 2004-2012
Produced by theAssessment, Policy Development & Evaluation Unit