+ All Categories
Home > Documents > Obesity-related cancers in New York State · Obesity-related cancers in New York State Introduction...

Obesity-related cancers in New York State · Obesity-related cancers in New York State Introduction...

Date post: 06-Sep-2018
Category:
Upload: docong
View: 217 times
Download: 0 times
Share this document with a friend
27
1 Obesity-related cancers in New York State Introduction Over the last two decades, obesity has reached epidemic proportions in New York and the United States. The percentage of adults in New York State who are obese increased nearly 40% in just 10 years, rising from 17.7% in 2000 to 24.5% in 2010 (1). National data as well show the proportion of adults who are obese increased from an estimated 15.9% in 1995 to 27.5% in 2010, an increase of almost 75% (2). The high prevalence of obesity has important consequences for health. It is projected that if rates continue to increase as in the recent past, obesity could surpass cigarette smoking as the leading cause of death in the United States in the next few years (3). Adults who are overweight or obese are at greater risk for type 2 diabetes, high blood pressure, high cholesterol, stroke, heart disease and osteoarthritis. Adults who are obese are also at greater risk of gynecological problems, asthma, sleep apnea and respiratory problems, reduced quality of life, and premature death (1, 4-6). People who are obese also are at greater risk for several types of cancer. These include adenocarcinoma of the esophagus, colorectal cancer, gallbladder cancer, pancreatic cancer, kidney cancer, thyroid cancer, and, in women, post-menopausal breast cancer and endometrial cancer. Adenocarcinoma of the esophagus is one of the two main cell types (histologies) of cancer of the esophagus, mainly affecting the lower esophagus. Overweight and obese people are more likely to develop adenocarcinoma of the esophagus, although not the other major type of esophageal cancer, squamous cell cancer. Colorectal cancer has been strongly linked with increasing body weight in men and less strongly in women. Many studies have shown a slightly increased risk of pancreatic cancer in people who are overweight and obese. Renal cell carcinoma, the most common type of kidney cancer, has consistently been linked with obesity (7-9). In women, it is well established that post-menopausal women who are obese or overweight have a higher risk for breast cancer than those who are not obese or overweight. This is not true, however, for women who have not yet reached menopause. After menopause, when the ovaries stop producing hormones, fat tissue becomes the main source of estrogen in a woman’s body. Since obese women have more fat tissue and, therefore, more estrogen, estrogen-dependent breast tumors may grow more What is obesity? Obesity has been defined as an abnormally high and unhealthy proportion of body fat. To determine whether someone is obese, health professionals use an indicator known as the body mass index, or BMI. The BMI is calculated as a person’s weight in kilograms divided by the square of their height in meters. Adults with a body mass index of 30.0 or greater are considered obese. Adults with a body mass index between 25.0 and 29.9 are considered overweight.
Transcript

1

Obesity-related cancers in New York State

Introduction Over the last two decades, obesity has reached epidemic proportions in New York and the United States.

The percentage of adults in New York State who are obese increased nearly 40% in just 10 years, rising

from 17.7% in 2000 to 24.5% in 2010 (1). National data as well show the proportion of adults who are

obese increased from an estimated 15.9% in 1995 to 27.5% in 2010, an increase of almost 75% (2).

The high prevalence of obesity has important consequences for health. It is projected that if rates

continue to increase as in the recent past, obesity could surpass cigarette smoking as the leading cause

of death in the United States in the next few years (3). Adults who are overweight or obese are at

greater risk for type 2 diabetes, high blood pressure, high

cholesterol, stroke, heart disease and osteoarthritis. Adults

who are obese are also at greater risk of gynecological

problems, asthma, sleep apnea and respiratory problems,

reduced quality of life, and premature death (1, 4-6).

People who are obese also are at greater risk for several

types of cancer. These include adenocarcinoma of the

esophagus, colorectal cancer, gallbladder cancer,

pancreatic cancer, kidney cancer, thyroid cancer, and, in

women, post-menopausal breast cancer and endometrial

cancer. Adenocarcinoma of the esophagus is one of the

two main cell types (histologies) of cancer of the

esophagus, mainly affecting the lower esophagus.

Overweight and obese people are more likely to develop

adenocarcinoma of the esophagus, although not the other

major type of esophageal cancer, squamous cell cancer.

Colorectal cancer has been strongly linked with increasing body weight in men and less strongly in

women. Many studies have shown a slightly increased risk of pancreatic cancer in people who are

overweight and obese. Renal cell carcinoma, the most common type of kidney cancer, has consistently

been linked with obesity (7-9).

In women, it is well established that post-menopausal women who are obese or overweight have a

higher risk for breast cancer than those who are not obese or overweight. This is not true, however, for

women who have not yet reached menopause. After menopause, when the ovaries stop producing

hormones, fat tissue becomes the main source of estrogen in a woman’s body. Since obese women have

more fat tissue and, therefore, more estrogen, estrogen-dependent breast tumors may grow more

What is obesity?

Obesity has been defined as an

abnormally high and unhealthy

proportion of body fat. To determine

whether someone is obese, health

professionals use an indicator known

as the body mass index, or BMI. The

BMI is calculated as a person’s weight

in kilograms divided by the square of

their height in meters. Adults with a

body mass index of 30.0 or greater

are considered obese. Adults with a

body mass index between 25.0 and

29.9 are considered overweight.

2

rapidly in obese women (9). Cancer of the endometrium, or lining of the uterus, in women has also been

consistently linked with overweight and obesity; overweight and obese women have two to four times

the risk of this cancer as women who are not overweight or obese (9).

Studies have consistently found associations of gallbladder and thyroid cancer risk with increasing

weight. For gallbladder cancer, this association may be due to a higher prevalence of gallstones, a

known risk factor for gallbladder cancer, in people who are obese; the mechanism by which increasing

weight may affect thyroid cancer risk is not clear (9).

There is also some evidence of an association of obesity with cancers of the prostate, ovary and liver,

and some types of leukemia and lymphoma. The evidence for associations with these cancers, however,

is not as strong as for the other cancers noted above (9).

Obesity affects the entire continuum of cancer, from prevention and early detection to treatment and

cancer survivorship. Obesity may influence the early detection of cancer by serving as a potential barrier

to receiving cancer screenings (10, 11). There also is some evidence that obesity may reduce the

effectiveness of certain cancer screening tests. Excess weight may worsen the prognosis for several

cancers (see for example 12-14) and may be associated with a lower quality of life for cancer survivors

(15).

This report will focus on the eight cancers (adenocarcinoma of the esophagus, colorectal cancer,

gallbladder cancer, pancreatic cancer, kidney cancer, thyroid cancer and, in women, post-menopausal

breast cancer and endometrial cancer) for which the evidence for a link with obesity is the strongest. In

the following sections, information will be presented on the prevalence of obesity and its risk factors in

New York, the burden of cancers that have been associated with obesity, and on actions the New York

State Department of Health (NYSDOH) is taking to address the problem.

Obesity in New York

Adults In 2012, nearly one quarter (23.6%) of adults in New York State were obese (16). However, rates of

obesity vary for different segments of the population. The prevalence of obesity was lowest among the

youngest adults (ages 18-24 years). People who are non-Hispanic black had the highest prevalence of

obesity, while non-Hispanics of other races (including Asians and Native Americans) had the lowest.

Obesity was most prevalent for people with less than a high school education, and least prevalent

among college graduates. Obesity rates also were higher among people living with a disability than

among people who did not report activity limitations or the use of special equipment (16). A detailed

breakdown of obesity rates among subgroups of the adult population of New York State may be found

in Appendix 1.

The percentage of the adult population that can be classified as obese has been increasing over time.

The figure below shows the prevalence of obesity among adults in New York State by year between

3

2000 and 2010. The figure shows that the percentage of adults who are obese increased by over 40%

between 2000 and 2007, but did not change significantly between 2007 and 2010.

Source of data: New York State Behavioral Risk Factor Surveillance System (1)

In 2011, there was a change in the method used to collect and compute the data on which obesity

prevalence estimates are based. Prevalence estimates from the two different methodologies should,

therefore, not be compared. Figure 1b shows the prevalence of

adult obesity in New York for 2011 and 2012, obtained with the

new methodology. There was no significant change in the

prevalence of adult obesity between 2011 and 2012.

The percentage of adults who are obese also varies by county in

New York State. A map showing obesity prevalence by county,

based on the Expanded Behavioral Risk Factor Surveillance

System survey (and the 2009 New York City Community Health

Survey for the boroughs of New York City) may be found on the

NYSDOH web site at

http://www.health.ny.gov/statistics/chac/general/pdf/g75.pdf.

Source of data: New York State Behavioral Risk

Factor Surveillance System (16, 17)

0

5

10

15

20

25

30

2000 2001 2002 2003 2004 2005 2006 2007 2008 2009 2010

Per

cen

t o

bes

e

Year

Figure 1a. Obesity prevalence by year, New York State adults, 2000-2010

0

5

10

15

20

25

30

2011 2012

Per

cen

t o

bes

e

Year

Figure 1b. Obesity prevalence by year, New York State adults, 2011

and 2012

4

Children Although rates of obesity are lower in children than in adults, the prevalence of obesity in childhood has

been increasing as well. In addition to the added health risks during childhood, children who are obese

are much more likely to be obese as adults. For this reason, many NYSDOH programs in obesity

prevention focus on children.

Information on the weight status of children is available

from a number of sources. Data on student weight and

height are routinely collected by the NYSDOH for public

school children in New York State, outside of New York City,

and by the New York City Department of Education for

public school children in New York City. Surveillance data are

also collected as part of nutrition status monitoring of low-

income children who attend federally funded maternal and

child health and nutrition programs. In New York, these data

come from the Special Supplemental Nutrition Program for

Women, Infants and Children (WIC). Although these

statistics have been compiled from a large number of

children, they do not necessarily represent all children in New York.

In New York State outside of New York City during the school years 2010 and 2011, 17.6% of all public

school students were classified as obese (18). The prevalence of obesity was higher in middle and high

school students (18.2%) than in students in the elementary grades (17.2%). In New York City for the

school year 2010, 20.7% of public school children in grades kindergarten through 8th grade were

categorized as obese (19).

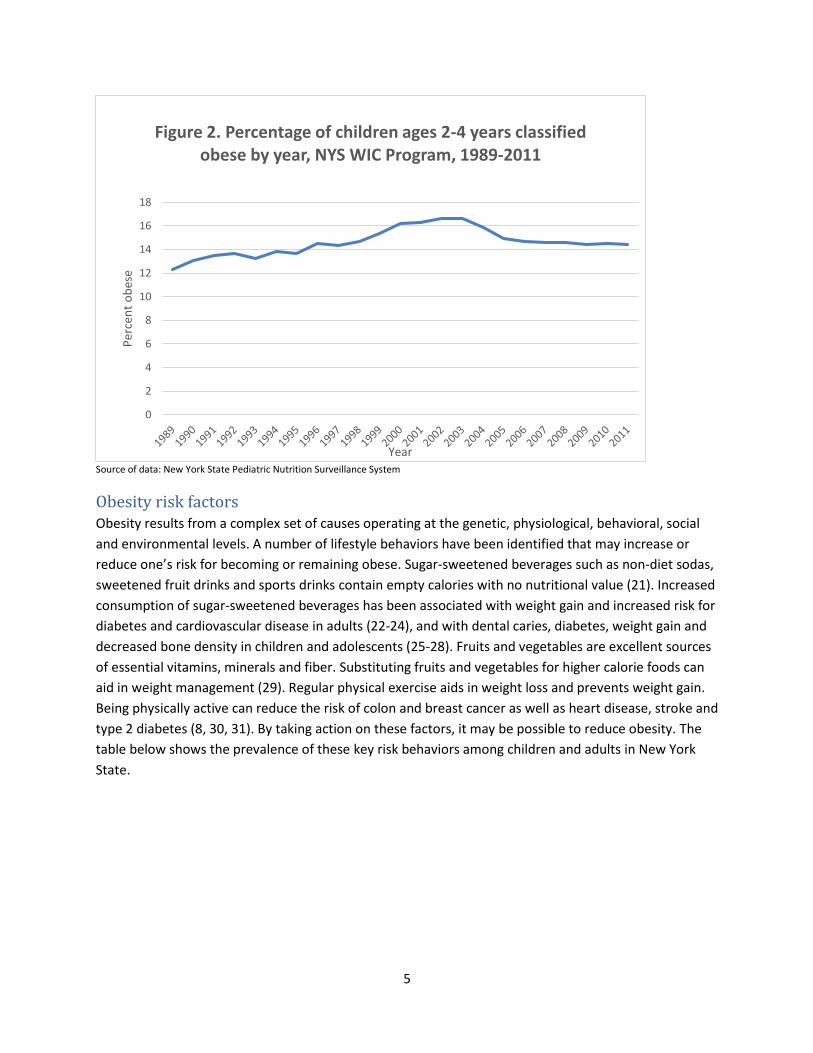
Data from the New York State WIC program show that in 2011, 14.4% of New York State children ages

two to four enrolled in the WIC program were obese (20). As shown on the graph (Figure 2), this is a

decline in the percentage of child WIC participants who were obese from its peak of 16.6% in 2002 and

2003. However, the current rates of obesity in child WIC participants represent a substantial proportion

of the childhood population and an increase over rates observed when data collection first began in

1989.

What is obesity in children?

Obesity in children is not measured

the same way as it is in adults. In

children, the child’s BMI is compared

with growth charts showing BMI at

different ages. If a child’s BMI falls at

or above the 95th percentile for their

age and gender on the CDC growth

chart for 2000, the child is considered

obese.

5

Source of data: New York State Pediatric Nutrition Surveillance System

Obesity risk factors Obesity results from a complex set of causes operating at the genetic, physiological, behavioral, social

and environmental levels. A number of lifestyle behaviors have been identified that may increase or

reduce one’s risk for becoming or remaining obese. Sugar-sweetened beverages such as non-diet sodas,

sweetened fruit drinks and sports drinks contain empty calories with no nutritional value (21). Increased

consumption of sugar-sweetened beverages has been associated with weight gain and increased risk for

diabetes and cardiovascular disease in adults (22-24), and with dental caries, diabetes, weight gain and

decreased bone density in children and adolescents (25-28). Fruits and vegetables are excellent sources

of essential vitamins, minerals and fiber. Substituting fruits and vegetables for higher calorie foods can

aid in weight management (29). Regular physical exercise aids in weight loss and prevents weight gain.

Being physically active can reduce the risk of colon and breast cancer as well as heart disease, stroke and

type 2 diabetes (8, 30, 31). By taking action on these factors, it may be possible to reduce obesity. The

table below shows the prevalence of these key risk behaviors among children and adults in New York

State.

0

2

4

6

8

10

12

14

16

18

Per

cen

t o

bes

e

Year

Figure 2. Percentage of children ages 2-4 years classified obese by year, NYS WIC Program, 1989-2011

6

Table 1. Prevalence of selected risk factors for obesity, New York State

Risk factor % with risk factor

Consumed one or more sugar-sweetened beverages a day (adults, 2011) 19.7

Consumed one or more sugar-sweetened beverages a day (children ages 2-17, 2009-2010) 31.1

Consumed fewer than 5 servings of fruits and vegetables a day (adults, 2009) 73.2

No leisure-time physical activity (adults, 2011) 26.3

Source of data: New York State Behavioral Risk Factor Surveillance System

Obesity-related cancers As noted above, obesity has been linked with a number of different cancers. Different cancers, while

sharing the underlying mechanism of the uncontrolled growth and replication of the body’s cells, are in

fact different diseases. They each have different

occurrence patterns, natural histories, effective

treatments, outlooks for survival, and sets of causes and

risk factors. The box on the following page summarizes

what is known about the cancers that have been

associated with obesity.

Did you know?

Up to one third of all cancer cases

may be related to excess weight,

unhealthy diet, and lack of sufficient

physical activity (7, 8).

7

Cancers related to obesity

Adenocarcinoma of the esophagus – The esophagus is the tube that connects the throat to the stomach. Adenocarcinoma of the esophagus, one of the two main types of this cancer, occurs mostly in the lower part of the esophagus. Adenocarcinoma of the esophagus is associated with acid reflux, the abnormal backward flow of stomach acid into the esophagus.

Colorectal cancer – The colon and rectum are part of the digestive system. The colon (large intestine) and rectum (the last 7-8 inches of the intestines) absorb water and eliminate waste products from the body. Other than obesity, risk of colorectal cancer is increased in people with a family history of the disease, people with certain inherited diseases, and people with intestinal conditions such as polyps or inflammatory bowel disease. Long-term smoking and heavy alcohol consumption also increase a person’s risk of getting colorectal cancer.

Gallbladder cancer – The gallbladder is an organ located below the liver that stores bile until it is needed for digestion. Cancer of the gallbladder is fairly rare. The most important risk factor for gallbladder cancer is gallstones. People who are obese are at greater risk of having gallstones, which may explain the association of gallbladder cancer with obesity.

Pancreatic cancer – The pancreas is an organ located behind the stomach that makes enzymes that help digest food, and hormones including insulin that help the body use it. Survival from this cancer is particularly poor. Risk factors other than obesity include certain inherited conditions, a family history of pancreatic cancer, a personal history of pancreatitis, having gallbladder disease or diabetes, and cigarette smoking.

Post-menopausal breast cancer – Breast cancer is the most frequently diagnosed type of cancer among women in the US, and most cases occur in women who are past menopause. Other risk factors for breast cancer include genetics and family history, reproductive factors such as having a first child later in life or not having any full-term pregnancies, long-term use of hormone replacement therapy, excessive alcohol consumption, and exposure to high levels of ionizing radiation such as x-rays.

Endometrial cancer – The uterus is the pear-shaped organ in a woman’s abdomen where a baby develops. The endometrium is the lining of this organ. Cancer of the endometrium rarely occurs before the age of 45. Risk factors, in addition to age and obesity, include a family history of the disease, reproductive factors such as not having any full-term pregnancies or having menopause at a late age, and long-term use of estrogen-only hormone replacement therapy.

Kidney cancer – The kidneys filter blood and produce urine to remove waste products from the body. Rates of newly diagnosed kidney cancers have been increasing in New York and nationally over the past 30 years. Risk factors for kidney cancer other than obesity include certain inherited diseases or a family history of kidney cancer, chronic kidney disease, and cigarette smoking.

Thyroid cancer – The thyroid is a butterfly-shaped gland in the neck that makes hormones that regulate metabolism and growth and development. Other than obesity, known risk factors for thyroid cancer include certain hereditary conditions and a family history of medullary thyroid cancer, exposure to high doses of ionizing radiation such as x-rays, and exposure to radioactive iodine in childhood.

8

Cancers related to obesity take a substantial toll. The table below illustrates the burden these cancers

place on New Yorkers in terms of incidence (new cases) and mortality (deaths). Although not all cases of

these cancers are related to obesity, each year about 35,000 New Yorkers are diagnosed with these

eight cancers combined. This total amounts to about a third of the 107,000 cancers diagnosed in New

Yorkers every year. Of the different obesity-related cancers, post-menopausal female breast cancer

accounts for the largest number of cases, followed by colorectal cancer, which strikes both males and

females. Adenocarcinoma of the esophagus and gallbladder cancer are relatively less common.

Table 2 shows that close to 10,000 New Yorkers die of obesity-related cancers each year. Over a quarter

of cancer deaths and about seven percent of total deaths in New Yorkers can be accounted for by these

cancers. Due to its high incidence and less favorable prognosis, colorectal cancers account for the largest

number of deaths of the obesity-related cancers, followed by deaths from the highly fatal pancreatic

cancer.

Table 2. Incidence of and mortality from obesity-related cancers, New York State, 2007-2011

Average new cases per year Rate1

95% CI (+/-)

Average deaths per

year Rate1

95% CI (+/-)

Adenocarcinoma of Esophagus2 614 2.8 0.2 890* 4.1* 0.2

Colon and Rectum 9,620 44.9 0.4 3,334 15.4 0.2

Gallbladder 312 1.5 0.0 175 0.8 0.0

Pancreas 2,943 13.7 0.2 2,402 11.1 0.2

Post-menopausal Breast (females only)3 11,631 341.1 2.7 2,354 66.5 1.2

Endometrial (females only)4 3,593 30.2 0.4 640 5.2 0.2

Kidney 3,409 16.0 0.2 712 3.3 0.2

Thyroid 3,499 17.2 0.2 114 0.5 0.0

All Obesity-related Cancers 35,007 9,732 Source of data: New York State Cancer Registry. Data provisional, November 2013. 1Rates are per 100,000, age adjusted to the 2000 US population (19 age groups), with 95% confidence intervals. 2Adenocarcinoma of the esophagus includes microscopically confirmed histologies 8140-8575. 3Post-menopausal breast cancer includes breast cancers in women ages 50 and older. 4Endometrial cancer includes cancers of the corpus uteri and uterus, not otherwise specified. *Mortality data include all histologies.

Demographics The incidence of different cancers varies according to different personal characteristics. As the table

below shows, of the six obesity-related cancers that affect both males and females, four

(adenocarcinoma of the esophagus, colorectal cancer, pancreatic cancer and kidney cancer) occur more

frequently in males than females.

Cancer incidence rates also vary by racial and ethnic group. Incidence rates of adenocarcinoma of the

esophagus are highest in non-Hispanic whites, while rates of gallbladder cancer are lowest in this group.

Non-Hispanic whites and non-Hispanic blacks have the highest rates of colorectal, pancreatic,

endometrial and kidney cancer compared to other groups. For post-menopausal female breast cancer,

9

rates are highest in non-Hispanic whites, followed by non-Hispanic blacks, then Hispanics, and non-

Hispanics of other and unknown racial groups. Rates of thyroid cancer are highest among non-Hispanic

others, almost as high among non-Hispanic whites, and lowest among non-Hispanic blacks.

Table 3. Incidence of obesity-related cancers by selected personal characteristics, New York State,

2007-2011

Adenocarcinoma of Esophagus3 Colon and Rectum Gallbladder Pancreas

Characteristic Cases1 Rate2

95% CI

(+/-) Cases1 Rate2

95% CI

(+/-) Cases1 Rate2

95% CI

(+/-) Cases1 Rate2

95% CI

(+/-)

Gender

Male 500 5.3 0.2 4,748 51.6 0.6 100 1.1 0.2 1,441 15.7 0.4

Female 114 0.9 0.0 4,872 39.8 0.6 212 1.7 0.2 1,502 12.0 0.2

Race/ethnicity

Non-Hispanic White 559 3.7 0.2 6,896 45.1 0.4 178 1.1 0.0 2,214 14.2 0.2

Non-Hispanic Black 19 0.7 0.2 1,322 49.5 1.2 56 2.2 0.2 381 14.6 0.6

Non-Hispanic Other and Unknown 9 0.7 0.2 518 40.1 1.6 24 2.0 0.4 105 8.8 0.8

Hispanic 27 1.2 0.2 884 38.6 1.2 54 2.4 0.4 243 11.3 0.6

Post-menopausal

breast (females only)4

Endometrial (females only)5 Kidney Thyroid

Characteristic Cases1 Rate2

95% CI

(+/-) Cases1 Rate2

95% CI

(+/-)

Cases1 Rate2

95% CI

(+/-) Cases1 Rate2

95% CI

(+/-)

Gender

Male 2,144 22.5 0.4 842 8.7 0.2

Female 11,631 341.1 2.7 3,593 30.2 0.4 1,264 10.8 0.2 2,657 25.2 0.4

Race/ethnicity

Non-Hispanic White 8,785 371.8 3.5 2,588 32.3 0.6 2,564 17.5 0.4 2,496 19.8 0.4

Non-Hispanic Black 1,420 307.4 7.3 512 30.8 1.2 415 14.9 0.6 269 9.3 0.6

Non-Hispanic Other and Unknown 485 229.0 9.4 168 21.3 1.6 141 10.3 0.8 351 21.7 1.0

Hispanic 942 247.2 7.3 325 22.6 1.2 289 11.5 0.6 384 12.9 0.6 Source of data: New York State Cancer Registry. Data provisional, November 2013. 1Average number of new cases per year. 2Rates are per 100,000, age adjusted to the 2000 US standard population, with 95% confidence intervals. 3Adenocarcinoma of the esophagus includes microscopically confirmed histologies 8140-8575. 4Post-menopausal breast cancer includes breast cancers in women ages 50 and older. 5Endometrial cancer includes cancers of the corpus uteri and uterus, not otherwise specified.

10

Time trends Incidence rates for different cancers change over time. This can be for a number of reasons, including

changes in the prevalence of various causes and risk factors, as well as changes in practices of screening

for and diagnosing different cancers and changes in cancer awareness among the public and health

professionals. Due to the long latency of cancer, one would not expect changes in risk or causal factors

to be reflected in changes in the incidence of various

cancers until many years after these changes have

occurred.

Figures 3a and 3b show changes in the incidence of the

eight cancers associated with obesity in New York State

since 1976, the first year for which cancer reporting to the

New York State Cancer Registry is considered complete on

a statewide basis. The two most frequently diagnosed

cancers, post-menopausal female breast cancer and

colorectal cancer, are displayed at a different scale to

better show variations in the incidence of the less

frequently diagnosed cancers.

While most of these cancers increased throughout this time period, the timing of the increases varied.

Cancer of the kidney and adenocarcinoma of the esophagus showed a steady increase over the entire

time period, while rates of endometrial cancer began to rise in the late 1980s to early 1990s. Thyroid

cancer incidence increased slowly until the early 1990s, when it began to increase more rapidly. The rise

in kidney and thyroid cancers involved mostly cancers detected at an early stage in their development,

and there is evidence that at least some of the increases are due to greater detection of pre-existing and

indolent disease rather than an increase in the actual occurrence of the disease.

Post-menopausal breast cancer showed both an increase and a slight decrease over this time period.

Rates increased steadily up to the late 1990s, then levelled off and even began to decline.

Mammography, a low-dose x-ray of the breast used to detect tumors at an early stage, when they are

more treatable, is recommended for women age 50 and older, and breast cancer incidence is sensitive

to trends in mammography use in this age group. Part of the decline in rates of post-menopausal breast

cancer is also likely to be related to a decrease in the use of hormone replacement therapy by post-

menopausal women following the publication of results from the Women’s Health Initiative in 2002

(32).

Finally, the incidence of colorectal cancer was fairly constant until around the late 1980s, when it began

to decline slowly. Screening techniques such as colonoscopy can actually prevent colorectal cancer by

identifying and removing precancerous lesions, and the decline in colorectal cancer incidence is believed

to be related to increasing use of these techniques (33).

What do we mean by cancer latency?

Unlike many diseases, cancers can

take a long time to develop. The time

between first exposure to a cancer-

causing agent and the diagnosis of

cancer is called cancer latency.

Latency for most cancers in adults is

measured in years or even decades.

11

Source of data: New York State Cancer Registry. Data provisional, November 2013. 1Rates age-adjusted to the 2000 US population. 2Adenocarcinoma of the esophagus includes microscopically confirmed histologies 8140-8575. 3Endometrial cancer includes cancers of the corpus uteri and uterus, not otherwise specified. 4Post-menopausal breast cancer includes breast cancers in women ages 50 and older.

0.0

5.0

10.0

15.0

20.0

25.0

30.0

35.0

1976 1978 1980 1982 1984 1986 1988 1990 1992 1994 1996 1998 2000 2002 2004 2006 2008 2010

Rat

e p

er 1

00

,00

01

Year

Figure 3a. Incidence of cancers related to obesity by year,New York State, 1976-2011

Cancers of the esophagus (adenocarcinoma)2, gallbladder, pancreas, endometrium3, kidney and thyroid

Adenoca. of esophagus Gallbladder

Pancreas Endometrium (females only)

Kidney thyroid

0.0

50.0

100.0

150.0

200.0

250.0

300.0

350.0

400.0

1976 1978 1980 1982 1984 1986 1988 1990 1992 1994 1996 1998 2000 2002 2004 2006 2008 2010

Rat

e p

er 1

00

,00

01

Year

Figure 3b. Incidence of cancers related to obesity by year, New York State, 1976-2011

Cancers of the female breast (post-menopausal)4 and colorectum

Colorectal Post-menopausal breast (females only)

12

Geographic variation The following maps show rates of six obesity-related cancers by county and borough in New York State.

(Maps are not provided for adenocarcinoma of the esophagus and gallbladder cancer due to the

relatively small numbers of cases of these cancers, which make rates unstable in many of the less

populated counties.) Data for individual counties may be found in Appendix 2.

The maps show considerable variation in the incidence of these cancers from one county to another.

Some of the areas to the south and east of Lake Ontario that have a high prevalence of obesity also have

higher rates of colorectal, pancreatic and/or kidney cancers. On the other hand, rates of post-

menopausal breast cancer are for the most part highest in the New York City suburbs and many of the

upstate urban counties. For thyroid cancer, rates are generally highest in the New York City suburbs and

the New York City boroughs of Staten Island (Richmond), Brooklyn (Kings) and Manhattan (New York),

where obesity rates are generally not among the highest. Breast and thyroid cancers, as well as other

cancers related to obesity, have important risk factors in addition to obesity that may vary from place to

place, so that their geographic patterns reflect variations in the sum total of risk factors and not

necessarily the variation in any one.

13

14

15

16

NYSDOH initiatives

Prevention Agenda 2013-2017 The New York State Prevention Agenda 2013-2017, released in 2013, sets goals to improve the health of

New Yorkers in five priority areas and to reduce health disparities. One priority area is preventing

chronic diseases, and a focus area within this priority is reducing obesity in children and adults, an

underlying risk factor for many chronic diseases and conditions. Objectives in this focus area call for

reducing the percentage of children who are obese and the percentage of adults who are obese by 1)

creating community environments that promote and support healthy food and beverage choices and

physical activity; 2) preventing childhood obesity through early child-care and schools; 3) expanding the

role of health care and health service providers and insurers in obesity prevention; and 4) expanding the

role of public and private employers in obesity prevention (34).

The Prevention Agenda acknowledges the necessary role of multiple sectors in accomplishing these

objectives. Sectors within which activities can be conducted to reduce illness, disability and deaths

related to obesity include the health care delivery system; employers, businesses and unions; the media;

academic institutions; community-based health and human service agencies; governmental and non-

governmental public health agencies; policy makers and elected officials; community members; and

philanthropic organizations (34).

Obesity Prevention Programs and Activities NYSDOH works with partners and contractors to develop and implement programs in many settings that

are aimed at reducing the burden of obesity in New York. In the community setting, Designing a Strong

and Healthy New York (DASH-NY) leads a statewide coalition and works with partners from multiple

sectors to develop sustainable policy, systems and environmental changes and strategies for reducing

the burden of obesity and chronic disease. DASH-NY provides policy analysis, training and support for

sustainable changes that increase access to healthy food and safe places to be physically active. Creating

Healthy Places to Live, Work and Play is a comprehensive initiative designed to prevent obesity and type

2 diabetes by implementing sustainable policy, systems and environmental changes in communities and

workplaces. Contractors work to improve health and physical activity status by increasing the availability

and accessibility of healthy food and places to be physically active, and, in the workplace, enhancing

employer health plans and creating a supportive environment for nursing mothers. The iChoose600®

campaign was developed to increase consumer awareness about calories in chain restaurant foods and

provide guidance on selecting meals to stay within calorie recommendations.

As noted above, New York participates in the federally funded Special Supplemental Nutrition Program

for Women, Infants and Children (WIC). The WIC Program provides supplemental food, nutrition

education and counseling, breastfeeding support, and links with health and social services for eligible

low-income women and children to improve pregnancy outcomes, promote optimal growth and

development, and influence lifetime nutrition and health behaviors. NYSDOH has developed many

initiatives that assist WIC participants in achieving healthier lifestyles and contribute to decreasing

overweight and obesity. These include implementing a new food package that provides foods such as

17

fruits and vegetables, whole grain cereals and breads, and low-fat dairy products, and ensuring the

availability of breastfeeding coordinators and peer counselors at all WIC agencies.

A number of community programs are aimed at children. The NYSDOH Child and Adult Care Food

Program (CACFP) provides reimbursement to child care and day care programs that serve nutritious

meals and snacks to children and adults in care. The CACFP’s Healthy Meal Pattern was implemented to

establish nutrition requirements that align more closely with the Dietary Guidelines for Americans and

with recommendations for preventing overweight and obesity in early childhood. The Eat Well Play Hard

in Child Care Settings program is a nutrition education and obesity prevention intervention for CACFP-

participating child care centers serving low-income children and their families. In schools, Healthy

Schools New York provides technical assistance and resources to school districts to establish healthful

eating environments and daily opportunities for physical activity for students through the development

of school wellness policies.

In the health care sector, NYSDOH is working with the National Institute for Children’s Health Quality to

develop and implement the Breastfeeding Quality Improvement in Hospitals learning collaborative. The

collaborative aims to increase breastfeeding and decrease formula supplementation during the birth

hospitalization. NYSDOH also awards the Breastfeeding Friendly Practices designation to pediatric,

family and obstetric/gynecologic provider practices that have improved their outpatient practices’

breastfeeding policies and procedures. In the Obesity Prevention in Pediatric Health Care Settings

initiative, NYSDOH contractors work with pediatric practices throughout the state in a learning

collaborative to implement national guidelines for assessment, prevention and treatment of obesity and

overweight, and to help practices achieve Breastfeeding Friendly Practice designation.

Comprehensive Cancer Control Plan The New York State Comprehensive Cancer Control Plan 2012-2017 was created as a guide to identify

and address the cancer burden in New York State. The Plan was developed by the New York State

Cancer Consortium, a statewide network of individuals and organizations from the public and private

sectors that collaborate to reduce the human and economic burden of cancer in New York. NYSDOH is a

major partner in the Consortium.

Focused on the health outcomes of cancer, the Plan includes measurable objectives, suggested

strategies, and evidence-based and evidence-informed interventions and best and promising practices in

six priority areas spanning the cancer continuum. These priority areas include health promotion and

cancer prevention, early detection, treatment, survivorship, palliative care, and the health care

workforce. The health promotion and cancer prevention priority area includes specific goals for the

prevention of obesity and risk factors for obesity through suggested strategies including 1) endorsing

policies and initiatives that support health-promoting behaviors, including access to nutritious foods and

opportunities for physical activity, especially among populations most at risk or affected by overweight

and obesity; 2) promoting voluntary adoption of food procurement and vending guidelines by

government and community-based agencies and their vendors; and 3) supporting policies to increase

the duration and exclusivity of breastfeeding (35).

18

Conclusion Obesity remains a serious problem in New York. The rise in obesity over the past decades has likely

contributed to the increase in at least some cancers. Because of cancer latency, the effects of the

increase in obesity will impact cancer incidence for years to come. However, efforts to control obesity

also will eventually aid in controlling some of the most frequently occurring cancers. Recent declines in

childhood obesity indicate that efforts to reduce childhood obesity are having an effect, but efforts must

be maintained to continue these gains and extend them to the adult population.

19

References 1. New York State Department of Health, Adult Overweight and Obesity in New York State 2000-

2010, Albany, New York: New York State Department of Health, Bureau of Chronic Disease

Evaluation and Research, 2012. Available at

http://www.health.ny.gov/prevention/obesity/statistics_and_impact/docs/2000-

2010_adult_obesity.pdf, accessed April 24, 2014.

2. Centers for Disease Control and Prevention (CDC). Behavioral Risk Factor Surveillance System

Survey Data. Atlanta, Georgia: U.S. Department of Health and Human Services, Centers for

Disease Control and Prevention. Accessed at http://apps.nccd.cdc.gov/brfss/ April 28, 2014.

3. Jia H and Lubetkin EI, Trends in quality-adjusted life-years lost contributed by smoking and

obesity, Am J Prev Med 38(2):138-144, 2010.

4. National Heart, Lung and Blood Institute. Clinical guidelines on the identification, evaluation,

and treatment of overweight and obesity in adults: the evidence report. Bethesda MD: US

Department of Health and Human Services, National Institutes of Health, National Heart, Lung

and Blood Institute; 1998. Available at

http://www.nhlbi.nih.gov./guidelines/obesity/ob_gdlns.htm.

5. U.S. Department of Health and Human Services, The Surgeon General's call to action to prevent

and decrease overweight and obesity. Rockville (MD): U.S. Department of Health and Human

Services, Public Health Service, Office of the Surgeon General; 2001. Section 1: Overweight and

Obesity as Public Health Problems in America. Available at

http://www.ncbi.nlm.nih.gov/books/NBK44206/.

6. Malnick SD, Knobler H, The medical complications of obesity, QJM 99(9):565-579, 2006.

7. World Cancer Research Fund/American Institute for Cancer Research, Food, Nutrition, Physical

Activity, and the Prevention of Cancer: A Global Perspective, Washington, DC: American

Institute for Cancer Research, 2007.

8. Eheman C, Henley SJ, Ballard-Barbash R et al., Annual report to the Nation on the status of

cancer, 1975-2008, featuring cancers associated with excess weight and lack of sufficient

physical activity, Cancer 118:2338-66, 2012.

9. National Cancer Institute, Obesity and Cancer Risk, Bethesda MD: US Department of Health and

Human Services, National Cancer Institute; 2012. Available at

http://www.cancer.gov/cancertopics/factsheet/Risk/obesity, accessed April 25, 2014.

10. Maruthur NM, Bolen SD, Brancati FL, Clark JM. The association of obesity and cervical cancer

screening: a systematic review and meta-analysis. Obesity (Silver Spring) 17(2):375-381, 2009.

11. Wee CC, McCarthy EP, Davis RB, Phillips RS. Screening for cervical and breast cancer: is obesity

an unrecognized barrier to preventive care? Ann Intern Med 132:697–704, 2000.

12. Demark-Wahnefried W, Platz EA, Ligibel JA, Blair CK, Courneya KS, Meyerhardt JA et al. The role

of obesity in cancer survival and recurrence. Cancer Epidemiol Biomarkers Prev 21(8):1244-1259,

2012.

13. Yuan C, Bao Y, Wu C, Kraft P, Ogino S, Ng K et al. Prediagnostic body mass index and pancreatic

cancer survival. J Clin Oncol 31(33):4229-4234, 2013.

20

14. Kroenke CH, Chen WY, Rosner B, Holmes MD. Weight, weight gain, and survival after breast

cancer diagnosis. J Clin Oncol 23(7):1370-1378, 2005.

15. Mosher CE, Sloane R, Morey MC, Snyder DC, Cohen H J, Miller P E et al.. Associations between

lifestyle factors and quality of life among older long-term breast, prostate, and colorectal cancer

survivors. Cancer 115: 4001-4009, 2009.

16. New York State Department of Health, Overweight and Obesity. New York State Adults 2012.

BRFSS Brief Number 1401, Albany NY: New York State Department of Health, Bureau of Chronic

Disease Evaluation and Research and Bureau of Community Chronic Disease Prevention.

Available at

http://www.health.ny.gov/statistics/brfss/reports/docs/1401_overweight_and_obesity.pdf ,

accessed May 30, 2014.

17. New York State Department of Health, Overweight and Obesity. New York State Adults 2011.

BRFSS Brief Number 1304, Albany NY: New York State Department of Health, Bureau of Chronic

Disease Evaluation and Research and Bureau of Community Chronic Disease Prevention.

Available at

http://www.health.ny.gov/statistics/brfss/reports/docs/1304_overweight_and_obesity.pdf .

Accessed April 29, 2014.

18. New York State Department of Health, Information for Action # 2013-5, Albany NY: New York

State Department of Health, Division of Chronic Disease Prevention, July 2013. Available at

http://www.health.ny.gov/statistics/prevention/injury_prevention/information_for_action/doc

s/2013-05_ifa_report.pdf . Accessed May 5, 2014.

19. Berger M, Konty K, Day S, et al., Obesity in K-8 students – New York City, 2006-07 to 2010-11

school years, MMWR Morbidity and Mortality Weekly Report 60:49, December 16, 2011.

20. New York State Department of Health, 2011 Pediatric Nutrition Surveillance Report, Albany NY:

New York State Department of Health, October 2012, available at

http://www.health.ny.gov/statistics/prevention/nutrition/pednss/2011/. Accessed May 5, 2014.

21. Guthrie JF, Morton JF. Food sources of added sweeteners in the diets of Americans. J Am Diet

Assoc. 100:43-51, 2000.

22. New York State Department of Health, Sugar Sweetened Beverages, New York State Adults,

2011. BRFSS Brief Number 1310, Albany NY: New York State Department of Health, Bureau of

Chronic Disease Evaluation and Research and Bureau of Community Chronic Disease Prevention.

Available at

http://www.health.ny.gov/statistics/brfss/reports/docs/1310_brfss_sugar_sweetened_beverag

es.pdf. Accessed June 10, 2014.

23. Apovian CM. Sugar-sweetened soft-drinks, obesity, and Type 2 diabetes. JAMA 292(8): 978-979,

2004.

24. Vartanian LR, Schwartz MB, Brownell KD. Effects of soft drink consumption on nutrition and

health: A systematic review and meta-analysis. Am J Public Health 97(4):667-675, 2007.

25. Tahmassebi J, Duggal M, Malik-Kotru G, et al. Soft drinks and dental health: a review of the

current literature. JDR 34(1):2-11, 2006.

21

26. Whiting S, Healey A, Psiuk S, et al. Relationship between carbonated and other low nutrient

dense beverages and bone mineral content of adolescents. Nutrition Research 21(8):1107-1115,

2001

27. Yoo S, Nicklas T, Baranowski T, et al. Comparison of dietary intakes associated with metabolic syndrome risk factors in young adults: the Bogalusa Heart Study. Am J Clin Nutr 80:841-848, 2004.

28. New York State Department of Health, Sugar-Sweetened Beverage Consumption, New York State Children Aged 2-17 Years, 2009-2010. BRFSS Brief Number 1203, Albany NY: New York State Department of Health, Bureau of Chronic Disease Evaluation and Research and Bureau of Community Chronic Disease Prevention. Available at http://www.health.ny.gov/statistics/brfss/reports/docs/1203_brfss_sugar_sweetened_beverages.pdf.

29. New York State Department of Health, Fruit and Vegetable Consumption New York State Adults

2009. BRFSS Brief Number 1202, Albany NY: New York State Department of Health, Bureau of

Chronic Disease Evaluation and Research and Bureau of Community Chronic Disease Prevention.

Available at

http://www.health.ny.gov/statistics/brfss/reports/docs/1202_brfss_fruit_and_vegetable_consu

mption.pdf, accessed June 10, 2014.

30. U.S. Department of Health and Human Services, 2008 Physical Activity Guidelines for Americans.

Hyattsville MD: U.S. Department of Health and Human Services, 2008. Available at

http://www.health.gov/paguidelines/guidelines/, accessed September 10, 2014.

31. New York State Department of Health, Physical Activity New York State Adults, 2011. BRFSS Brief

Number 1309, Albany NY: New York State Department of Health, Bureau of Chronic Disease

Evaluation and Research and Bureau of Community Chronic Disease Prevention. Available at

http://www.health.ny.gov/statistics/brfss/reports/docs/1309_brfss_physical_activity.pdf,

accessed June 10, 2014.

32. Ravdin PM, Cronin KA, Howlader N, et al., The decrease in breast-cancer incidence in 2003 in the

United States, NEJM 356(16): 1670-1674, 2007.

33. Edwards BK, Ward E, Kohler BA, et al., Annual report to the nation on the status of cancer, 1975-

2006, featuring colorectal cancer trends and impact of interventions (risk factors, screening, and

treatment) to reduce future rates, Cancer 116:544-573, 2010.

34. New York State Department of Health, Prevention Agenda 2013-2017: New York State’s Health

Improvement Plan, Albany NY: New York State Department of Health, March 2014. Available at

http://www.health.ny.gov/prevention/prevention_agenda/2013-2017/. Accessed May 29, 2014.

35. New York State Cancer Consortium, New York State Comprehensive Cancer Control Plan 2012-

2017, Rochester NY: New York State Cancer Consortium, December 2012. Available at

http://www.nyscancerconsortium.org/cancer/cancer_index.aspx. Accessed September 10,

2014.

22

Appendix 1 Obesitya among New York State adults, 2012 BRFSS

Percentb obesec 95% confidence interval New York State (NYS) 23.6 23.2-25.9 Gender

Male 24.3 23.3-27.4 Female 22.9 22.1-25.5

Age (years) 18-24 12.7 9.0-17.6 25-34 19.5 16.1-23.5 35-44 25.7 22.0-29.8 45-54 26.6 23.2-30.4 55-64 28.7 25.2-32.4 65+ 25.7 22.4-29.4

Race/ethnicity White non-Hispanic 23.2 21.6-25.0 Black non-Hispanic 31.5 26.4-37.0 Hispanic 25.1 21.0-29.8 Other non-Hispanic 12.2 8.0-18.1

Income <$25,000 27.9 24.8-31.3 $25,000-$34,999 24.1 18.9-30.2 $35,000-$49,999 23.2 19.3-27.6 $50,000-$74,999 22.6 19.2-26.5 $75,000+ 22.2 19.5-25.1 Missingd 19.5 15.7-24.1

Educational attainment Less than high school (HS) 33.0 27.7-38.8 High school or GED 23.0 20.3-25.9 Some post-HS 25.4 22.4-28.7 College graduate 18.0 16.0-20.1

Disabilitye Yes 36.6 32.9-40.5 No 20.3 18.7-22.0

Region New York City (NYC) 21.5 18.9-24.3 NYS exclusive of NYC 25.1 23.4-26.9

a Based on categories of body mass index (BMI), calculated as weight in kilograms divided by the square of height in meters. b weighted c BMI > 30.0. d “Missing” category included because more than 10% of the sample did not report income. e Respondents who reported activity limitations due to physical, mental, or emotional problems, OR had health problems that require the use of special equipment. Table adapted from (16)

23

Appendix 2 Average annual incidence by county and region, selected obesity-related cancers, New York State, 2007-2011

Colon and Rectum Pancreas

Post-menopausal Breast (females only)

Endometrial (females only) Kidney Thyroid

County/Region Cases1 Rate2

95% CI

(+/-) Cases1 Rate2

95% CI

(+/-) Cases1 Rate2

95% CI

(+/-) Cases1 Rate2

95% CI

(+/-) Cases1 Rate2

95% CI

(+/-) Cases1 Rate2

95% CI

(+/-)

New York State 9620 44.9 0.4 2943 13.7 0.2 11631 341.1 2.7 3593 30.2 0.4 3409 16.0 0.2 3499 17.2 0.2

New York City 3738 45.4 0.6 1114 13.5 0.4 4183 309.9 4.3 1418 29.7 0.8 1155 14.0 0.4 1459 17.3 0.4

Bronx 573 46.3 1.8 167 13.6 1.0 601 290.0 10.4 221 29.8 1.8 182 14.5 1.0 155 11.8 0.8

Kings (Brooklyn) 1178 48.7 1.2 335 13.9 0.6 1162 289.0 7.4 445 31.4 1.4 343 14.0 0.6 459 18.4 0.8

New York (Manhattan) 655 38.3 1.4 234 13.6 0.8 987 357.8 10.2 273 28.0 1.6 207 12.4 0.8 328 18.7 1.0

Queens 1095 46.0 1.2 304 12.8 0.6 1141 298.2 7.8 382 28.4 1.4 328 13.8 0.6 370 15.6 0.8

Richmond (Staten Island) 238 48.3 2.7 75 14.9 1.6 292 356.3 18.4 97 33.4 2.9 94 18.2 1.8 147 29.3 2.2

New York State, exclusive of New York City 5878 44.6 0.6 1827 13.7 0.2 7439 361.0 3.7 2173 30.5 0.6 2252 17.3 0.4 2039 17.3 0.4

Albany 160 45.5 3.1 48 13.5 1.8 206 366.7 22.7 51 26.6 3.3 55 16.2 2.0 49 15.5 2.0

Allegany 29 50.0 8.2 5 8.8 3.3 30 341.0 54.9 7 25.0 8.4 10 16.6 4.7 6 11.9 4.5

Broome 121 46.8 3.7 30 11.4 2.0 135 339.9 26.1 46 35.6 4.7 38 15.8 2.4 43 21.3 2.9

Cattaraugus 52 52.7 6.5 14 14.0 3.3 54 346.4 41.7 14 25.5 6.1 16 16.5 3.7 9 10.2 3.1

Cayuga 42 42.5 5.9 13 13.3 3.3 51 336.9 42.1 15 29.3 6.7 18 19.2 3.9 13 14.6 3.7

Chautauqua 78 44.5 4.5 22 12.4 2.4 95 354.0 32.3 30 33.7 5.5 28 16.5 2.7 17 12.3 2.7

Chemung 49 44.3 5.7 16 13.2 2.9 59 338.8 39.2 21 36.4 7.3 20 17.8 3.5 13 13.9 3.5

Chenango 33 50.5 7.8 9 13.8 3.9 31 305.4 48.6 12 35.7 9.0 13 19.7 4.9 9 18.7 5.5

Clinton 40 45.1 6.3 11 12.0 3.1 49 355.4 44.9 13 26.6 6.7 24 27.3 4.9 10 11.5 3.3

Columbia 45 51.3 6.9 10 11.4 3.1 39 285.4 40.8 12 25.6 6.7 12 13.8 3.7 8 10.4 3.5

Cortland 26 48.4 8.4 9 17.6 5.1 29 350.6 57.6 11 38.5 10.2 6 10.6 3.9 6 12.5 4.7

Delaware 31 44.7 7.3 10 13.8 3.9 30 274.0 44.5 11 33.7 9.4 10 13.5 3.7 8 14.6 4.9

24

Colon and Rectum Pancreas

Post-menopausal Breast (females only)

Endometrial (females only) Kidney Thyroid

County/Region Cases1 Rate2

95% CI

(+/-) Cases1 Rate2

95% CI

(+/-) Cases1 Rate2

95% CI

(+/-) Cases1 Rate2

95% CI

(+/-) Cases1 Rate2

95% CI

(+/-) Cases1 Rate2

95% CI

(+/-)

Dutchess 153 46.3 3.3 49 14.4 1.8 198 384.6 24.1 59 32.3 3.7 52 15.1 1.8 53 17.0 2.2

Erie 506 44.1 1.8 161 13.8 1.0 714 390.9 12.9 181 29.1 2.0 181 16.4 1.2 162 16.8 1.2

Essex 25 45.4 8.0 9 14.9 4.5 29 343.4 57.0 7 22.4 7.6 8 14.2 4.5 6 13.0 4.9

Franklin 29 50.3 8.2 8 14.3 4.5 27 313.7 52.7 8 26.5 8.6 11 19.9 5.3 4 7.6 3.3

Fulton 37 52.1 7.6 10 14.1 3.9 33 298.3 46.1 12 31.7 8.4 13 19.7 4.9 10 17.1 4.9

Genesee 34 44.8 6.9 10 12.9 3.7 41 355.5 49.6 12 30.7 7.8 12 15.6 4.1 7 10.3 3.5

Greene 33 50.2 7.8 12 17.7 4.5 34 343.9 52.1 12 35.4 9.2 9 13.3 3.9 8 13.5 4.3

Hamilton 4 48.6 23.7 1 *8.1 9.2 6 443.6 160.5 1 *25.8 28.8 1 *16.2 12.2 0 *8.6 13.1

Herkimer 38 44.9 6.5 11 12.5 3.3 41 316.0 43.9 15 35.6 8.2 17 21.1 4.7 11 16.8 4.7

Jefferson 54 49.5 5.9 15 14.5 3.3 56 343.5 40.6 19 32.2 6.7 18 15.9 3.3 12 10.5 2.7

Lewis 18 55.1 11.8 5 16.5 6.3 13 271.5 66.6 5 31.6 12.0 5 15.2 6.1 4 *13.3 6.3

Livingston 33 44.4 6.9 7 8.7 2.9 39 345.5 49.0 11 29.5 7.8 11 15.3 4.1 9 13.6 4.1

Madison 39 47.1 6.7 10 12.3 3.3 44 340.5 45.3 10 21.7 6.3 12 13.9 3.7 11 15.0 4.1

Monroe 365 42.7 2.0 112 13.1 1.2 513 378.7 14.9 142 30.2 2.4 159 18.9 1.4 106 13.8 1.2

Montgomery 37 54.2 8.0 9 13.6 3.9 29 275.5 46.5 11 30.8 8.6 11 17.3 4.7 8 14.2 4.7

Nassau 706 42.3 1.4 251 14.9 0.8 999 385.5 10.8 298 33.1 1.8 296 18.4 1.0 285 19.8 1.0

Niagara 122 44.0 3.5 28 10.0 1.8 163 379.8 26.5 43 29.8 4.1 46 17.0 2.2 32 13.6 2.2

Oneida 124 41.4 3.3 39 12.9 1.8 136 295.6 22.5 43 28.1 3.9 51 18.4 2.4 48 19.3 2.5

Onondaga 225 41.9 2.5 78 14.4 1.4 304 361.8 18.4 83 28.7 2.7 83 15.7 1.6 79 16.3 1.6

Ontario 47 35.8 4.7 18 13.3 2.7 72 342.7 36.1 21 28.5 5.5 21 15.8 3.1 15 13.0 3.1

Orange 167 47.0 3.3 47 13.4 1.8 178 319.4 21.4 63 31.0 3.5 62 16.9 2.0 85 22.9 2.2

Orleans 25 49.5 8.8 5 10.9 4.1 27 346.0 59.4 7 27.7 9.2 7 14.7 4.9 6 12.5 4.7

Oswego 64 49.5 5.5 20 15.7 3.1 59 296.1 34.3 25 34.8 6.3 27 20.0 3.5 20 16.0 3.1

Otsego 34 42.1 6.5 9 11.0 3.3 40 322.9 45.7 16 39.3 8.8 11 14.0 3.7 9 14.9 4.5

Putnam 44 40.8 5.5 15 14.4 3.3 65 390.2 43.3 17 28.0 6.1 23 21.5 4.1 21 18.4 3.7

Rensselaer 86 47.6 4.5 24 13.4 2.4 99 348.6 31.2 34 35.7 5.5 41 22.8 3.1 26 15.7 2.7

25

Colon and Rectum Pancreas

Post-menopausal Breast (females only)

Endometrial (females only) Kidney Thyroid

County/Region Cases1 Rate2

95% CI

(+/-) Cases1 Rate2

95% CI

(+/-) Cases1 Rate2

95% CI

(+/-) Cases1 Rate2

95% CI

(+/-) Cases1 Rate2

95% CI

(+/-) Cases1 Rate2

95% CI

(+/-)

Rockland 140 42.1 3.1 42 12.6 1.8 196 363.0 22.9 60 31.7 3.7 58 17.4 2.0 67 21.8 2.4

St. Lawrence 66 52.9 5.9 16 12.7 2.7 60 308.2 35.3 20 30.2 6.1 17 13.4 2.9 12 11.1 2.9

Saratoga 109 44.5 3.7 33 13.3 2.2 142 365.0 27.2 35 24.5 3.7 46 18.1 2.4 42 17.3 2.4

Schenectady 88 46.8 4.5 26 13.8 2.4 102 347.3 30.8 31 31.2 5.1 28 15.0 2.5 21 13.3 2.5

Schoharie 19 44.2 9.0 5 13.7 5.3 16 257.6 57.0 7 33.5 11.2 6 15.4 5.7 6 16.6 6.3

Schuyler 13 51.5 12.9 2 *9.1 5.5 11 301.2 79.0 4 30.5 13.5 3 *11.1 6.1 2 *10.4 6.5

Seneca 21 46.8 9.0 7 15.8 5.3 24 364.3 66.1 6 29.3 10.6 9 21.0 6.1 3 *8.1 4.3

Steuben 54 44.5 5.3 15 12.1 2.7 60 315.3 35.9 18 27.5 5.7 18 14.8 3.1 13 12.6 3.1

Suffolk 768 46.8 1.6 245 14.9 0.8 979 377.3 10.6 281 30.5 1.6 323 19.5 1.0 326 20.5 1.0

Sullivan 41 44.1 6.1 12 12.3 3.1 44 317.6 42.7 15 30.5 7.1 17 17.8 3.9 14 16.9 4.1

Tioga 32 50.9 8.0 9 12.9 3.9 34 350.4 52.7 9 25.7 7.6 12 18.9 4.9 9 17.3 5.1

Tompkins 38 40.7 5.9 12 13.1 3.3 47 319.7 42.1 19 37.4 7.8 11 12.2 3.3 14 15.2 3.7

Ulster 107 48.0 4.1 27 12.2 2.2 125 361.7 28.8 36 30.3 4.5 33 14.8 2.4 28 13.7 2.4

Warren 34 38.0 5.9 11 11.2 2.9 47 337.2 43.3 17 34.1 7.4 14 15.2 3.7 15 19.6 4.7

Washington 31 39.6 6.3 13 16.2 4.1 37 315.2 45.9 14 36.3 8.6 13 17.3 4.3 18 26.0 5.5

Wayne 49 44.9 5.7 14 12.8 3.1 62 367.7 41.4 17 28.1 6.1 20 18.9 3.7 10 10.5 2.9

Westchester 472 42.0 1.8 163 14.4 1.0 642 362.1 12.7 172 28.1 2.0 169 15.3 1.0 202 20.1 1.2

Wyoming 27 58.6 10.0 9 17.8 5.3 29 420.7 69.4 10 40.8 11.6 9 18.2 5.3 7 15.8 5.3

Yates 13 40.9 10.0 3 *10.2 4.9 16 330.5 72.1 6 35.7 12.9 6 19.0 7.1 4 17.7 8.0

Source of data: New York State Cancer Registry. Data Provisional November 2013.

Rates are per 100,000 and age-adjusted to the 2000 US Standard Million (19 age group) standard, with 95% confidence intervals.

* Rate based on fewer than 20 cases (fewer than 4 per year) and should be used with caution.

26

Sources of data The New York State Behavioral Risk Factor Surveillance System (BRFSS) is an annual statewide

telephone surveillance system designed by the Centers for Disease Control and Prevention (CDC). New

York State has participated annually since 1985. The BRFSS monitors modifiable risk behaviors and other

factors contributing to the leading causes of morbidity and mortality in the population. New York State's

BRFSS sample represents the non-institutionalized adult household population, aged 18 years and older.

Data from the BRFSS are useful for planning, initiating, and supporting health promotion and disease

prevention programs at the state and federal level, and monitoring progress toward achieving health

objectives for the state and nation. (http://www.health.ny.gov/statistics/brfss/)

The Student Weight Status Category Reporting System was established in New York State to support

state and local efforts to understand and confront the problem of childhood obesity. Data on student

BMI and weight status category (underweight, healthy weight, overweight or obese) are collected for

children in selected grades by public schools in New York State outside of New York City. Information is

reported to the local school district and then transmitted to the State Health Department.

http://www.health.ny.gov/prevention/obesity/statistics_and_impact/student_weight_status_data.htm

The NYC FITNESSGRAM is an annual fitness assessment conducted in New York City public schools. As

part of this assessment, physical education teachers measure the height and weight of students in

grades K-12 using standard protocols. The BMIs obtained from these measurements are provided to

students and parents along with other indicators of health-related fitness.

(http://schools.nyc.gov/Academics/FitnessandHealth/NycFitnessgram/NYCFITNESSGRAM.htm)

The Pediatric Nutrition Surveillance System (PedNSS) monitors the nutritional status of low-income

infants and children attending federally funded maternal and child health programs. In New York State,

data are available on birth weight, short stature, weight status, anemia, breastfeeding, smoking in the

household and television viewing for infants and children under 5 years of age participating in the

Special Supplemental Nutrition Program of Women, Infants, and Children (WIC Program).

(http://www.health.ny.gov/statistics/prevention/nutrition/pednss/index.htm,

http://www.cdc.gov/pednss/)

The New York State Cancer Registry is a population-based cancer incidence registry responsible for the

collection of demographic, diagnostic and treatment information on all patients diagnosed with and/or

treated for cancer at hospitals, laboratories and other health care facilities throughout New York State.

Submission of data is mandated under New York State Public Health Law, section 2401. The Cancer

Registry collects a wide variety of information that can be used for research and public health planning

and evaluation. Cancer Registry data are routinely used by programs within the Department of Health,

county and local health departments, patient advocacy groups, public interest groups, researchers and

the public. Because the Registry has collected statewide data since 1976, it can be used to monitor

cancer incidence patterns and trends for all areas of New York State.

(http://www.health.ny.gov/statistics/cancer/registry/about.htm)

27

For further information Additional information on and data from the New York State Behavioral Risk Factor Surveillance System

may be accessed from http://www.health.ny.gov/statistics/brfss/.

Statewide and county-level data from the New York State Student Weight Status Category Reporting

System may be obtained at

http://www.health.ny.gov/prevention/obesity/statistics_and_impact/student_weight_status_data.htm.

Information on occurrence patterns, risk factors and possible prevention strategies for different types of

cancer is available at http://www.health.ny.gov/statistics/cancer/registry/abouts/.

Detailed statistics on cancer incidence and mortality in New York, as well as a comprehensive

description of the New York State Cancer Registry, are available at

http://www.health.ny.gov/statistics/cancer/registry/.

Other useful sources of information on cancer, including symptoms and treatment, include the Web

sites of the American Cancer Society (http://www.cancer.org/index) and the National Cancer Institute

(http://www.cancer.gov/).

The entire New York State Prevention Agenda 2013-2017, including action plans, focus areas,

recommended interventions, and recommended evidence-based programs, policies and practices in five

priority areas, may be viewed at http://www.health.ny.gov/prevention/prevention_agenda/2013-2017/.

Further information on obesity prevention programs and activities undertaken by the New York State

Department of Health is available at

http://www.health.ny.gov/prevention/obesity/prevention_activities/.

The New York State Comprehensive Cancer Control Plan 2012-2017, which includes measurable

objectives, suggested strategies, and tested interventions and practices in six priority areas spanning the

cancer continuum, may be accessed at

http://www.nyscancerconsortium.org/cancer/cancer_index.aspx.


Recommended