68
Obici Healthcare Foundation Community Health Assessment Community Health Solutions, Inc. May 23, 2007
| Date post: | 26-Dec-2015 |
| Category: |
Documents |
| Upload: | mae-chandler |
| View: | 215 times |
| Download: | 0 times |

Obici Healthcare Foundation Community Health Assessment
Community Health Solutions, Inc.
May 23, 2007

Unofficial Discussion Draft Subject to Change 2
Table of Contents
Executive Summary (Slide 3)1. Health Demographic Indicators (Slide 13)2. Community Survey Indicators (Slide 19)3. Mortality Indicators (Slide 26)4. Birth Indicators (Slide 31)5. Adult Health Status Indicators (Slide 37)6. Health Care Access Indicators (Slide 42)Appendix A: Gates County, NC Indicators (Slide 53)Appendix B: Table of Charts (Slide 68)

Unofficial Discussion Draft Subject to Change 3
Executive Summary
• Executive Summary Outline– Study Purpose, Scope, and Limitations
– Study Methods
– The Study Region
– The Mission Statement as Organizing Principle
– Demographics of the Study Region
– Mission Focus 1: Addressing Unmet Needs of the Medically Indigent & Uninsured
– Mission Focus 2: Preventing or Reducing Illness or Disease
• Additional Issues
• Organization of the Report

Unofficial Discussion Draft Subject to Change 4
Study Purpose, Scope, and Limitations
• Purpose– The purpose of the study is to provide information on community
health status to the Obici Healthcare Foundation• Scope
– The study includes:• Seven cities and counties in Virginia and North Carolina• Six categories of health indicators from existing data• Original survey data from Survey of Local Health Professionals and
Community Leaders
• Limitations– The study was:
• Not designed or budgeted to identify or detail every conceivable health issue
• Designed to be a starting point to support Foundation planning rather than a comprehensive assessment of every issue

Unofficial Discussion Draft Subject to Change 5
Study Methods
• The study was conducted by Community Health Resource Center of Richmond, VA during December-May 2007– Demographic data were obtained from SRC, Inc., a commercial
data vendor– Death and Birth data were obtained from Virginia Department of
Health and the North Carolina Department of Health– Hospital Discharge data were obtained from Virginia Health
Information, Inc.– Adult health status data were obtained from the National
Behavioral Risk Factor Surveillance Survey– Community Survey data were obtained from a sample of local
health professionals and community leaders. The survey was limited to Virginia.
– Gates County, NC data are presented separately (in Appendix A) because data were not available for some indicators, and other data were in different formats than Virginia data.

Unofficial Discussion Draft Subject to Change 6
The Study Region
Franklin
Suffolk
Sussex
Surry
Southampton
Isle of Wight
Gates
The Obici Healthcare Foundation Service Region includes most of seven cities and counties, including Gates County, NC.
Gates
Suffolk
Isle of Wight
SurrySussex
Southampton
Franklin

Unofficial Discussion Draft Subject to Change 7
The Mission Statement as Organizing Principle
• The mission of the Obici Healthcare Foundation is to improve the health status of people living in the service area by:– 1) addressing the unmet needs of the medically
indigent and uninsured; and– 2) supporting programs which have the primary
purpose of preventing or reducing illness and disease.• Study results are summarized in terms of the two
mission focus areas.

Unofficial Discussion Draft Subject to Change 8
Demographics of the Service Area
• Major Findings from Virginia Service Region:– More than 156,000 people in the Virginia service
region– Expected to reach 178,000+ by 2011– Growing twice as fast as Virginia– Growth driven by Suffolk and Isle of Wight– 42 percent African American compared to 19 percent
for Virginia– 22% of adults age 25+ without high school diploma
compared to 14% for state– Poorer than state as a whole on most economic
measures, including low-income children
In addition, Gates County, NC has a population of 11,500+.and a roughly similar profile in terms of age, race, and income. See Appendix A for detail.

Unofficial Discussion Draft Subject to Change 9
Mission Focus 1: Addressing the Needs of the Medically Indigent & Uninsured
• Major Findings in the Virginia Service Region:– ‘Access to quality health services’ identified as immediate &
significant health concern by 39 of 63 respondents to Survey of Local Health Professionals and Community Leaders
– In the Virginia Study Region for 2005:• An estimated 22,500+ uninsured in the region, including 3,000-4000
children• An estimated 12,700+ uninsured with income below 200 percent of
poverty• An estimated 17,000+ adults could not see a doctor due to cost• An estimated 22,300+ adults had no dental visit in previous 2 years• 3,584 hospital discharges for potentially preventable conditions• Rates for all of the above were near or above the Virginia statewide
rate
In addition, Gates County, NC had an estimated 1,600+ uninsured in 2005. See Appendix A for detail.

Unofficial Discussion Draft Subject to Change 10
Mission Focus 2: Preventing or Reducing Illness and Disease
• Major Findings in the Virginia Service Region– Survey of Local Health Professionals and Community Leaders
identified the following as leading community health concerns:• Overweight, Obesity, & Nutrition• Heart Disease & Stroke• Diabetes• Physical Activity & Fitness• Cancer• Substance abuse• Oral health• Mental health & mental disorders• Sexually transmitted diseases• Injury & violence• Tobacco
– Additional issues are noted in the report

Unofficial Discussion Draft Subject to Change 11
Mission Focus 2: Preventing or Reducing Illness and Disease
• Major Findings in the Virginia Service Region– By the numbers:
• Leading causes of death = heart disease, cancer, stroke, chronic lower respiratory disease, injury, and diabetes
• Among adults, an estimated:– 73,000+ overweight or obese– 30,000+ no exercise in past 30 days– 91,000+ not consuming 5 or more fruits & vegetables per day– 26,000+ smoke– 15,900+ at risk for binge drinking– 37,000+ with high blood pressure– 35,700+ with high cholesterol– 15,700+ with asthma– 11,000+ with diabetes
• National rates of childhood overweight range from 10-16 percent, suggesting 3,700-6,000 children in the Virginia service region may be overweight.
• Rates in the Virginia Study Region were near or above Virginia statewide rates on most indicators.
Rates in Gates County, NC are similar to the Virginia Service Region rates. See Appendix A for detail.

Unofficial Discussion Draft Subject to Change 12
Additional Issues
• Community Survey Responses
– Community Survey Respondents were asked to identify local health concerns expected to emerge in the Virginia Service Region over next 1-3 years
– Most frequently mentioned emerging local health issues:
• Medical Product Safety
• Public Health Infrastructure
• Occupational Safety & Health
• Vision & Hearing
• Food Safety

Unofficial Discussion Draft Subject to Change 13
Part 1. Health Demographic Indicators
• Purpose– Health status is highly influenced by a person’s age, sex, race,
ethnicity, education, and income.
• Content– Chart 1.1-1.5 provide a demographic profile of the Virginia
Service Region.
• Source– CHRC analysis of data from SRC Corporation, a commercial
vendor of demographic data.

Unofficial Discussion Draft Subject to Change 14
Chart 1.1 Population Change 2000-2011
Indicator
Desired Direction Franklin
Isle of Wight
Southampton Suffolk Surry Sussex
VirginiaStudyRegion Virginia
Population 2000 - 8,346
29,728
17,482
63,677
6,829
12,504
138,566
7,078,515
Population 2005 - 8,339 33,171 17,233 79,287 7,057 11,639 156,726 7,538,791
Population 2011 - 8,645 37,059 17,078 97,063 7,170 11,499 178,514 8,078,397
Population Growth 2000-2011 - 299 7,331 -404 33,386 341 -1,005 39,948 999,882
Percent Growth 2000-2011 - 4% 25% -2% 52% 5% -8% 29% 14%
The Virginia Service Region population is expected to grow by 29 percent from 2000 to 2011, with Suffolk and Isle of Wight driving the increase.
Yellow shading = local rate above Virginia state rate. See Appendix A for Gates County, NC data

Unofficial Discussion Draft Subject to Change 15
Chart 1.2 Population by Age 2005
IndicatorDesired Direction Franklin
Isle of Wight
Southampton Suffolk Surry Sussex
VirginiaStudyRegion Virginia
Age 0-17 2005 - 2,040 7,575 3,535 20,668 1,597 2,175 37,590 1,811,335
Percent Age 0-17 2005 - 24% 23% 21% 26% 23% 19% 24% 24%
Age 18-64 2005 - 4,802 21,240 11,119 49,947 4,429 7,797 99,334 4,845,084
Percent Age 18-64 2005 - 58% 64% 65% 63% 63% 67% 63% 64%
Age 65 Plus 2005 - 1,497 4,356 2,579 8,672 1,031 1,667 19,802 882,375
Pct Age 65 Plus 2005 - 18% 13% 15% 11% 15% 14% 13% 12%
The Virginia Service Region includes more than 37,000 children and more than 19,800 seniors. The region is slightly older than Virginia as a whole.
Yellow shading = local rate above Virginia state rate. See Appendix A for Gates County, NC data

Unofficial Discussion Draft Subject to Change 16
Chart 1.3 Population by Race & Ethnicity 2005
Indicator FranklinIsle of Wight
Southampton Suffolk Surry Sussex
VirginiaStudyRegion Virginia
American Indian or Alaska Native 2005 9 65 26 182 13 12 307 16,819
Percent AIAN 2005 0% 0% 0% 0% 0% 0% 0% 0%
Asian Population 2005 65 118 35 624 10 15 867 345,897
Percent Asian 2005 1% 0% 0% 1% 0% 0% 1% 5%
Black or African American Pop. 2005 4,355 8,999 7,377 34,450 3,634 7,216 66,031 1,462,507
Percent Black or African Am. 2005 52% 27% 43% 43% 51% 62% 42% 19%
Hawaiian or Pacific Islander Pop. 2005 1 10 1 21 2 2 37 3,776
Percent Hawaiian or Pacific Is. 2005 0% 0% 0% 0% 0% 0% 0% 0%
Multirace Population 2005 77 314 101 1,035 67 87 1,681 148,715
Percent Multirace 2005 1% 1% 1% 1% 1% 1% 1% 2%
Other Race Population 2005 18 104 47 317 20 69 575 136,887
Percent Other Race 2005 0% 0% 0% 0% 0% 1% 0% 2%
Percent White 2005 46% 71% 56% 54% 47% 36% 56% 72%
White Population 2005 3,812 23,546 9,640 42,621 3,307 4,236 87,162 5,418,426
Hispanic Population 2005 76 418 169 1,313 73 156 2,205 435,843
Percent Hispanic 2005 1% 3% 1% 1% 2% 1% 1% 3%
The Virginia Service Region includes a significantly higher proportion of Black or African American residents than the state as a whole.
Yellow shading = local rate above Virginia state rate. See Appendix A for Gates County, NC data
Unofficial Discussion Draft Subject to Change 17
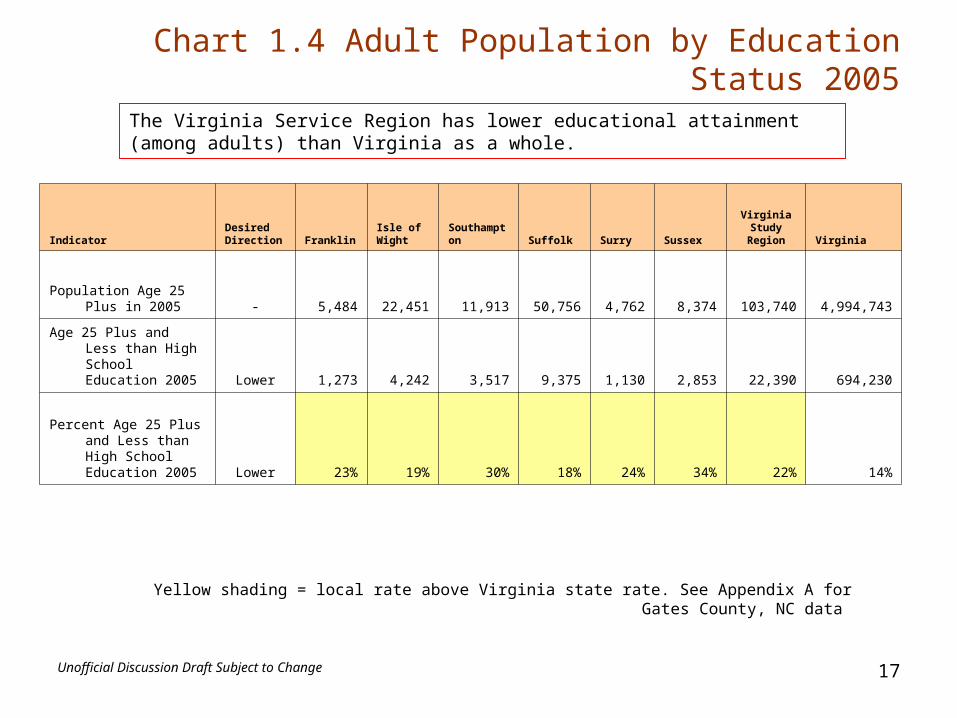
Chart 1.4 Adult Population by Education Status 2005
IndicatorDesired Direction Franklin
Isle of Wight
Southampton Suffolk Surry Sussex
VirginiaStudyRegion Virginia
Population Age 25 Plus in 2005 - 5,484 22,451 11,913 50,756 4,762 8,374 103,740 4,994,743
Age 25 Plus and Less than High School Education 2005 Lower 1,273 4,242 3,517 9,375 1,130 2,853 22,390 694,230
Percent Age 25 Plus and Less than High School Education 2005 Lower 23% 19% 30% 18% 24% 34% 22% 14%
The Virginia Service Region has lower educational attainment (among adults) than Virginia as a whole.
Yellow shading = local rate above Virginia state rate. See Appendix A for Gates County, NC data

Unofficial Discussion Draft Subject to Change 18
Chart 1.5 Population by Income Status 2005
IndicatorDesired Direction Franklin
Isle of Wight
Southampton Suffolk Surry Sussex
VirginiaStudyRegion Virginia
Per Capita Income 2006 Higher $21,363 $23,170 $18,958 $21,141 $18,408 $16,351 $20,704 $27,345
Average Household Income 2006 Higher $49,295 $59,560 $47,254 $56,088 $47,442 $42,826 $53,812 $69,571
Median Household Income 2006 Higher $35,968 $51,445 $38,349 $46,456 $41,051 $34,821 $44,359 $54,073
Child Poverty Rate 2004 Lower 24% 12% 18% 15% 15% 21% 16% 15%
Est. Children in Poverty Lower 490 909 636 3,100 240 457 5,831 271,700
Students Approved for Free/Reduced School Lunch 2005 Lower 80% 34% 40% 39% 52% 74% na 33%
Est. Population Below 200 Percent Poverty 2005
Lower 3,169 7,961 5,515
24,579 2,329 3,492 47,044 1,809,310
Percent Population Below 200 Percent Poverty 2000
Lower38% 24% 32% 31% 33% 30% 30% 24%
The Virginia Service Region includes higher rates of poverty and near-poverty than Virginia as a whole. Rates are high for both children and adults.
Yellow shading = local rate above Virginia state rate. See Appendix A for Gates County, NC data

Unofficial Discussion Draft Subject to Change 19
Part 2. Community Survey Indicators
• Purpose– Community officials and professionals have valuable
insight into community health concerns• Content
– Charts 2.1-2.6 summarize responses to the survey– Results are for Virginia Service Region only
• Source– The survey was sent to 180+ community officials and
health professionals from a list provided by Obici Healthcare Foundation
– 63 valid responses were received– Analysis is by CHRC

Unofficial Discussion Draft Subject to Change 20
Chart 2.1 Top Local Health Concerns from Community Survey
10
11
14
17
17
18
20
21
22
25
30
46
0 5 10 15 20 25 30 35 40 45 50
Health Education & Health Promotion
Adequate Health Provider Workforce
Sexually Transmitted Diseases
Mental Health and Mental Disorders
Access to Quality Health Services
Oral Health
Substance Abuse
Cancer
Physical Activity and Fitness
Diabetes
Heart Disease and Stroke
Overweight, Obesity, Nutrition
Overweight, Obesity, & Nutrition was the most frequently named top local health concern in the Virginia Service Region
Number of survey respondents (out of 63) identifying issue as among the ‘top five local health concerns.’

Unofficial Discussion Draft Subject to Change 21
Chart 2.2 Top Local Health Concerns from Community Survey
1
1
2
2
3
4
4
4
4
5
5
5
7
8
9
0 1 2 3 4 5 6 7 8 9 10
Environmental Health Health
Disability & Secondary Conditions
Chronic Kidney Diseases
Medical Product Safety
Immunization & Infectious Diseases
Vision & Hearing
HIV
Family Planning
Arthritis, Osteoporosis, and Chronic Back Conditions
Respiratory Diseases
Maternal Health/Pregnancy
Public Health Infrastructure
Tobacco Use
Infant/Child Health & Development
Injury & Violence Prevention
Number of survey respondents (out of 63) identifying issue as among the ‘top five local health concerns.’
(continued)

Unofficial Discussion Draft Subject to Change 22
Chart 2.3 Immediate & Significant Local Health Concerns from Community Survey
29
33
35
37
38
38
38
39
41
45
46
46
47
50
61
0 10 20 30 40 50 60 70
Family Planning
Health Education & Health Promotion
Infant/Child Health & Development
Injury & Violence Prevention
Tobacco Use
Sexually Transmitted Diseases
Oral Health
Access to Quality Health Services
Mental Health and Mental Disorders
Cancer
Substance Abuse
Diabetes
Physical Activity and Fitness
Heart Disease and Stroke
Overweight, Obesity, Nutrition
Number of survey respondents (out of 63) identifying issue as an ‘immediate significant local health concern.’
Overweight, Obesity, & Nutrition was the most frequently named ‘immediate significant local health concern’ in the Virginia Service Region.

Unofficial Discussion Draft Subject to Change 23
Chart 2.4 Immediate & Significant Local Health Concerns from Community Survey
4
7
9
15
15
16
17
18
19
21
23
27
27
28
0 5 10 15 20 25 30
Occupational Safety & Health
Medical Product Safety
Food Safety
Chronic Kidney Diseases
Vision & Hearing
Disability & Secondary Conditions
Environmental Health Health
Immunization & Infectious Diseases
Public Health Infrastructure
HIV
Respiratory Diseases
Arthritis, Osteoporosis, and Chronic Back Conditions
Adequate Health Provider Workforce
Maternal Health/Pregnancy
Number of survey respondents (out of 63) identifying issue as an ‘immediate significant local health concern.’
(continued)

Unofficial Discussion Draft Subject to Change 24
Chart 2.5 Emerging Local Health Concerns from Community Survey
14
14
15
17
17
18
18
20
20
20
22
23
23
24
24
0 5 10 15 20 25 30
Oral Health
Maternal Health/Pregnancy
Arthritis, Osteoporosis, and Chronic Back Conditions
Respiratory Diseases
Chronic Kidney Diseases
Disability & Secondary Conditions
HIV
Environmental Health Health
Immunization & Infectious Diseases
Adequate Health Provider Workforce
Food Safety
Vision & Hearing
Occupational Safety & Health
Public Health Infrastructure
Medical Product Safety
Medical Product Safety, Public Health Infrastructure, Occupational Safety & Health, Vision & Hearing, and Food Safety were the most frequently identified emerging local health issues in the Virginia Service Region.
Number of survey respondents (out of 63) identifying issue as ‘not a significant concern now, but may be in 1-3 years.’

Unofficial Discussion Draft Subject to Change 25
Chart 2.6 Emerging Local Health Concerns from Community Survey
2
5
5
6
7
7
8
8
9
9
10
10
11
13
0 2 4 6 8 10 12 14
Overweight, Obesity, Nutrition
Tobacco Use
Cancer
Substance Abuse
Heart Disease and Stroke
Diabetes
Sexually Transmitted Diseases
Health Education & Health Promotion
Physical Activity and Fitness
Injury & Violence Prevention
Access to Quality Health Services
Mental Health and Mental Disorders
Infant/Child Health & Development
Family Planning
(continued)
Number of survey respondents (out of 63) identifying issue as ‘not a significant concern now, but may be in 1-3 years.’

Unofficial Discussion Draft Subject to Change 26
Part 3. Mortality Indicators
• Purpose– Leading causes of death provide important insights
into the health and concerns of a population
• Content– Charts 3.1-3.4 show the leading causes of death in
terms of counts, deaths per 100,000 population, and age-adjusted deaths per 100,000 population.
• Source– CHRC analysis of 2004 data from the Virginia
Department of Health

Unofficial Discussion Draft Subject to Change 27
Chart 3.1 Leading Causes of Death
IndicatorDesired Direction Franklin
Isle of Wight
Southampton Suffolk Surry Sussex
Virginia StudyRegion Virginia
Total Deaths 2004 Lower 113 323 184 670 47 125 1,462 56,312
Deaths per 100,000 Population Lower 1,334 985 1,046 875 674 1,049 947 755
Age-adjusted Deaths per 100,000 Population Lower 939.2 1002.4 961.7 1000.6 606.9 948.1 na 806.0
Diseases of the Heart
Total Deaths 2004 Lower 38 88 49 165 14 28 382 13,850
Deaths per 100,000 Population Lower 448.5 268.4 278.6 215.4 200.9 235 247.5 185.7
Age-adjusted Deaths per 100,000 Population Lower 294.6 278.5 246.9 252.0 180.3 211.3 na 200.5
Malignant Neoplasms
Total Deaths 2004 Lower 23 79 44 149 15 25 335 13,005
Deaths per 100,000 Population Lower 271.5 241 250.2 194.5 215.2 209.8 217.1 174.3
Age-adjusted Deaths per 100,000 Population Lower 192.9 229.5 218.2 219.8 198.6 186.0 na 182.4
Cerebrovascular Disease
Total Deaths 2004 Lower 2 13 10 48 2 5 80 3,681
Deaths per 100,000 Population Lower 23.6 39.7 56.9 62.7 28.7 42 51.8 49.3
Age-adjusted Deaths per 100,000 Population Lower 14.4 41.8 49.3 73.1 27.1 37.1 na 54.0
In 2004, multiple localities had age-adjusted death rates above the statewide rate for overall deaths, heart disease deaths, and cancer deaths. Suffolk had a higher rate for cerebrovascular disease deaths.
Yellow shading = local rate above Virginia state rate. See Appendix A for Gates County, NC data

Unofficial Discussion Draft Subject to Change 28
Chart 3.2 Leading Causes of Death
IndicatorDesired Direction Franklin
Isle of Wight
Southampton Suffolk Surry Sussex
Virginia StudyRegion Virginia
Chronic Lower Respiratory Disease
Total Deaths 2004 Lower 6 16 4 24 1 6 57 2,652
Deaths per 100,000 Population Lower 70.8 48.8 22.7 31.3 14.3 50.4 36.9 35.5
Age-adjusted Deaths per 100,000 Population Lower 48.9 48.6 20.2 36.7 10.0 44.7 na 38.8
Unintentional Injury
Total Deaths 2004 Lower 3 11 18 33 2 7 74 2,458
Deaths per 100,000 Population Lower 35.4 33.6 102.4 43.1 28.7 58.8 48.0 32.9
Age-adjusted Deaths per 100,000 Population Lower 23.5 33.3 99.8 45.4 23.6 58.3 na 33.7
Diabetes Mellitus
Total Deaths 2004 Lower 4 11 5 30 0 6 56 1,555
Deaths per 100,000 Population Lower 47.2 33.6 28.4 39.2 0 50.4 36.3 20.8
Age-adjusted Deaths per 100,000 Population Lower 34.8 31.0 25.6 45.1 0.0 44.4 na 22.0
Alzheimer's Disease
Total Deaths 2004 Lower 4 13 4 22 0 1 44 1,452
Deaths per 100,000 Population Lower 47.2 39.7 22.7 28.7 0 8.4 28.5 19.5
Age-adjusted Deaths per 100,000 Population Lower 28.8 46.6 20.3 35.7 0.0 7.6 na 22.0
In 2004, multiple localities had age-adjusted death rates above the statewide rate for chronic lower respiratory disease, unintentional injury, diabetes, and Alzheimer’s.
Yellow shading = local rate above Virginia state rate. See Appendix A for Gates County, NC data

Unofficial Discussion Draft Subject to Change 29
IndicatorDesired Direction Franklin
Isle of Wight
Southampton Suffolk Surry Sussex
Virginia StudyRegion Virginia
Pneumonia and Influenza
Total Deaths 2004 Lower 7 6 5 12 2 6 38 1,401
Deaths per 100,000 Population Lower 82.6 18.3 28.4 15.7 28.7 50.4 24.6 18.8
Age-adjusted Deaths per 100,000 Population Lower 58.6 17.5 25.9 18.4 23.6 45.9 na 20.8
Nephritis and Nephrosis
Total Deaths 2004 Lower 5 1 6 14 0 4 30 1,232
Deaths per 100,000 Population Lower 59 3.1 34.1 18.3 0 33.6 19.4 16.5
Age-adjusted Deaths per 100,000 Population Lower 46.9 2.7 30.4 20.9 0.0 29.7 na 17.9
Septicemia
Total Deaths 2004 Lower 1 7 4 14 0 2 28 1,160
Deaths per 100,000 Population Lower 11.8 21.4 22.7 18.3 0 16.8 18.1 15.5
Age-adjusted Deaths per 100,000 Population Lower 9.1 22.1 18.7 21.2 0.0 15.2 na 16.8
Suicide
Total Deaths 2004 Lower 0 6 1 7 0 2 16 805
Deaths per 100,000 Population Lower 0 18.3 5.7 9.1 0 16.8 10.4 10.8
Age-adjusted Deaths per 100,000 Population Lower 0.0 18.6 6.8 9.6 0.0 16.7 na 10.6
Chart 3.3 Leading Causes of DeathIn 2004, multiple localities had age-adjusted death rates above the statewide rate for Pneumonia & Influenza, Nephritis & Nephrosis, Septicemia, and Suicide.
Yellow shading = local rate above Virginia state rate. See Appendix A for Gates County, NC data

Unofficial Discussion Draft Subject to Change 30
Chart 3.4 Leading Causes of Death
IndicatorDesired Direction Franklin
Isle of Wight
Southampton Suffolk Surry Sussex
Virginia StudyRegion Virginia
Pneumonitis due to Solids and Lquids
Total Deaths 2004 Lower 0.0 2.0 0.0 4.0 1.0 4.0 11.0 525.0
Deaths per 100,000 Population Lower 0.0 6.1 0.0 5.2 14.3 33.6 7.1 7.0
Age-adjusted Deaths per 100,000 Population Lower 0.0 5.8 0.0 6.0 12.9 29.7 na 7.8
Chronic Liver Disease
Total Deaths 2004 Lower 2 1 0 4 1 1 9 508
Deaths per 100,000 Population Lower 23.6 3.1 0 5.2 14.3 8.4 5.8 6.8
Age-adjusted Deaths per 100,000 Population Lower 20.5 3.5 0.0 5.8 10.0 7.5 na 6.7
Homicide and Legal Intervention
Total Deaths 2004 Lower 1 2 3 3 0 3 12 412
Deaths per 100,000 Population Lower 11.8 6.1 17.1 3.9 0 25.2 7.8 5.5
Age-adjusted Deaths per 100,000 Population Lower 11.4 6.0 18.3 3.8 0.0 26.1 na 5.5
In 2004, multiple localities had age-adjusted death rates above the statewide rate for pneumonitis, chronic liver disease, and homicide/legal intervention.
Yellow shading = local rate above Virginia state rate. See Appendix A for Gates County, NC data

Unofficial Discussion Draft Subject to Change 31
Part 4. Birth Indicators
• Purpose– Birth indicators provide insight into maternal
and child health and health care access
• Content– Charts 4.1-4.5 show counts and rates for
several common birth indicators.
• Source– CHRC analysis of 2004 data from the Virginia
Department of Health

Unofficial Discussion Draft Subject to Change 32
Chart 4.1 Total Pregnancies
IndicatorDesired Direction Franklin
Isle of Wight
Southampton Suffolk Surry Sussex
Virginia StudyRegion Virginia
Total Pregnancies - 210
455
209
1,636
91
159
2,760 137,157
Induced Terminations of Pregnancy Lower 47 67 22 355 20 27 538 25,918
Natural Fetal Deaths Lower 9 33 15 95 7 9 168 7,409
Total Live Births Higher 154
355
172
1,186
64
123
2,054
103,830
Birth Rate/1,000 Estimated Population - 18.2 10.8 9.8 15.5 9.2 10.3
14.07 13.9
In 2004, the region had 2,760 pregnancies resulting in 2,054 live births. Franklin, Suffolk, and the region as a whole had birth rates above the statewide rate.
Yellow shading = local rate above Virginia state rate. See Appendix A for Gates County, NC data

Unofficial Discussion Draft Subject to Change 33
Chart 4.2 Low Birth Weight and Late Prenatal Care Births
IndicatorDesired Direction Franklin
Isle of Wight
Southampton Suffolk Surry Sussex
VirginiaStudy Region Virginia
Low Weight Births
Low Weight Birth (<2,500 grams) Lower 17 26 17 121 4 10 195 8,674
Low Weight Birth Percent of Total Births Lower 11 7.3 9.9 10.2 6.3 8.1
9.5 8.4
Late/No Prenatal Care Births
Began Care in First 13 Weeks Higher 126 332 150 1,061 54 105 1828 88,054
Began Care After 13 Weeks Lower
28
23
22
125
10
18
226
15,776
Percent Began Care After 13 Weeks Lower
18.2
6.5
12.8
10.5
15.6
14.6
11.0
15.2
In 2004 there were 195 low weight births and 226 late or no prenatal care births. The low birth weight rate was higher than the statewide rate in three localities and the region as a whole. The late/no prenatal care rate was above the state rate in Franklin.
Yellow shading = local rate above Virginia state rate. See Appendix A for Gates County, NC data

Unofficial Discussion Draft Subject to Change 34
Chart 4.3 Non-marital Births
IndicatorDesired Direction
Franklin
Isle of Wight
Southampton Suffolk Surry Sussex
Virginia StudyRegion Virginia
Non-Marital Births Lower 88 113 71 408 28 65 773 32,190
Percent Non-Marital Births Lower 57.1 31.8 41.3 34.4 43.8 52.8 37.63 31
In 2004 there were 773 non-marital births. The non-marital birth rate exceeded the statewide rate throughout the region.
Yellow shading = local rate above Virginia state rate. See Appendix A for Gates County, NC data

Unofficial Discussion Draft Subject to Change 35
Chart 4.4 Teen Pregnancies
IndicatorDesired Direction
Franklin
Isle of Wight
Southampton Suffolk Surry Sussex
Virginia StudyRegion Virginia
Total Teenage Pregnancies Lower 38 47 23 192 7 29 336 13,343
Preg Rate/1,000 Pop Ages 10-19 Lower 60.1 21.6 21.1 34.3 13.5 45.7 na 26.5
Pregnancies Ages<15 yrs Lower 0 0 1 6 0 1 8 293
Preg Rate/1,000 Pop Ages<15 Lower 0 0 1.8 2.1 0 3.1 na 1.2
Pregnancies Ages 15-17 Lower 14 22 5 71 1 7 120 3,906
Preg Rate/1,000 Ages 15-17 Lower 65.4 33.4 14.3 38.9 5.3 34 na 26
Pregnancies Ages 18-19 Lower 24 25 17 115 6 21 208 9,144
Preg Rate/1,000 Ages 18-19 Lower 237.6 71 100 134.3 62.5 198.1 na 92
In 2004 there were 336 teenage pregnancies, including 128 to teens under 18. Teen pregnancy rates were above the statewide rate in multiple localities.
Yellow shading = local rate above Virginia state rate. See Appendix A for Gates County, NC data

Unofficial Discussion Draft Subject to Change 36
Chart 4.5 Infant Deaths
IndicatorDesired Direction Franklin
Isle of Wight
Southampton Suffolk Surry Sussex
Virginia Study Region Virginia
Total Infant Deaths 2004 Lower 3 4 4 12 0 1 24 768
Five-Year Infant Death Rate/1,000 Live Births 2000-2004 Lower 11.8 5.8 8.3 9.6 8.5 13.3 na 7.4
In 2004 there were 24 infant deaths. Over the period 200-2004, the infant death rate was higher than the statewide rate in every locality except Isle of Wight.
Yellow shading = local rate above Virginia state rate. See Appendix A for Gates County, NC data

Unofficial Discussion Draft Subject to Change 37
Part 5. Adult Health Status Estimates
• Purpose– Adult health status estimates paint a picture of community health
beyond death rates, birth rates, and hospitalization rates.
• Content– Charts 5.1-5.4 contain local estimates of adult health status.– The figures are ‘synthetic estimates’ based on application of
statewide and national survey data to local demographics. They are for planning purposes only, and are not guaranteed for accuracy.
• Source– CHRC analysis of data from the National Behavioral Risk Factor
Surveillance Survey and demographic data from SRC, Inc.

Unofficial Discussion Draft Subject to Change 38
Chart 5.1 Adult Health Limitation Estimates
IndicatorDesired Direction Franklin
Isle of Wight
Southampton Suffolk Surry Sussex
Virginia Study Region Virginia
Fair or Poor Health Status 2005 Lower 1,228 4,147 2,397 9,965 1,021 1,685 20,443 851,950
Percent Fair or Poor Health Status 2005 Lower 20% 16% 18% 17% 19% 18% 17% 15%
Limitations Due to Health 2005 Lower 1,222 4,838 2,534 10,610 1,021 1,647 21,872 1,018,935
Percent Limitations Due to Health 2005 Lower 19% 19% 19% 18% 19% 17% 18% 18%
In 2005 there were an estimated 20,000+ adults in fair or poor health status. Estimated rates were above the statewide average.
Yellow shading = local rate above Virginia state rate. See Appendix A for Gates County, NC data

Unofficial Discussion Draft Subject to Change 39
Chart 5.2 Adult Overweight, Obesity, Exercise, and Nutrition Estimates
IndicatorDesired Direction Franklin
Isle of Wight
Southampton Suffolk Surry Sussex
Virginia Study Region Virginia
Overweight or Obese 2005 Lower 3,874 15,383 8,452 35,992 3,374 6,019 73,094 3,300,258
Percent Overweight or Obese 2005 Lower 62% 60% 62% 61% 62% 64% 61% 58%
No Exercise in Past 30 Days 2005 Lower 1,757 6,169 3,520 15,124 1,474 2,527 30,571 1,315,080
Percent No Exercise in Past 30 Days 2005
Lower28% 24% 26% 26% 27% 27% 26% 23%
Less Than Five Servings Per Day of Fruits and Vegetables 2005 Lower 4,768 19,658 10,561 45,195 4,150 7,316 91,648 4,369,963
Percent Less than Five Servings per Day of Fruits & Vegetables 2005 76% 77% 77% 77% 76% 77% 77% 77%
In 2005 there were an estimated 73,000+ adults who could be classified as overweight or obese. Overweight/obesity rates were estimated to be above the statewide average throughout the region.
Yellow shading = local rate above Virginia state rate. See Appendix A for Gates County, NC data

Unofficial Discussion Draft Subject to Change 40
Chart 5.3 Adult Smoking and Alcohol Consumption Estimates
IndicatorDesired Direction Franklin
Isle of Wight
Southampton Suffolk Surry Sussex
Virginia Study Region Virginia
Smoke 2005 Lower 1,291 5,682 3,027 12,955 1,174 2,148 26,278 1,285,441
Percent Smoke 2005 Lower 21% 22% 22% 22% 22% 23% 22% 23%
Risk for Binge Drinking 2005 Lower 699 3,558 1,877 7,796 655 1,325 15,910 877,214
Percent Risk for Binge Drinking 2005
Lower11% 14% 14% 13% 12% 14% 13% 15%
In 2005 there were an estimated 26,000+ adult smokers and an estimated 15,900+ adults at risk for binge drinking.
Yellow shading = local rate above Virginia state rate. See Appendix A for Gates County, NC data

Unofficial Discussion Draft Subject to Change 41
Chart 5.4 Adult Chronic Disease Estimates
IndicatorDesired Direction Franklin
Isle of Wight
Southampton Suffolk Surry Sussex
Virginia Study Region Virginia
Diabetes (Told by Doctor) 2005 Lower 712 2,329 1,370 5,627 595 956 11,589 445,774
Percent Diabetes (Told by Doctor) 2005
Lower11% 9% 10% 10% 11% 10% 10% 8%
High Blood Pressure (Told by Doctor) 2005 Lower 2,242 7,730 4,397 18,055 1,862 3,047 37,333 1,525,070
Percent High Blood Pressure (Told by Doctor) 2005
Lower
36% 30% 32% 31% 34% 32% 31% 27%
High Cholesterol (Told by Doctor) 2005 Lower 1,990 7,884 4,150 17,293 1,682 2,726 35,724 1,646,714
Percent High Cholesterol (Told by Doctor) 2005
Lower
32% 31% 30% 30% 31% 29% 30% 29%
Asthma (Told by Doctor) 2005 Lower 806 3,251 1,753 7,562 693 1,221 15,286 731,758
Percent Asthma (Told by Doctor) 2005
Lower13% 13% 13% 13% 13% 13% 13% 13%
Arthritis (Told by Doctor) 2005 Lower 2,047 7,602 4,041 16,706 1,676 2,584 34,656 1,538,622
Percent Arthritis (Told by Doctor) 2005
Lower33% 30% 30% 29% 31% 27% 29% 27%
In 2005 there were an estimated 11,500+ adults with diabetes, 37,000+ adults with high blood pressure, 35,700+ with high cholesterol, 15,200+ with asthma, and 34,600+ with arthritis. These estimates assume a diagnosis of the specified disease, and do not include those not yet diagnosed.
Yellow shading = local rate above Virginia state rate. See Appendix A for Gates County, NC data

Unofficial Discussion Draft Subject to Change 42
Part 6. Health Care Access Indicators
• Purpose– Access to health care is a fundamental prerequisite for community
health.• Content
– Charts 6.1-6.9 provide various measures of health care access in the Virginia Service Region.
• Source– Uninsured estimates and adult health care access estimates were
produced by CHRC using ‘synthetic estimation techniques’ in which national and state-level survey data are applied to local demographic profiles.
– Underserved area designations were obtained from the U.S. Health Resources and Services Administration.
– Ambulatory Care Sensitive Condition indicators were produced by CHRC using discharge data from Virginia Health Information, Inc. and population data from SRC, Inc.

Unofficial Discussion Draft Subject to Change 43
Chart 6.1 Uninsured Estimates
IndicatorDesired Direction Franklin
Isle of Wight
Southampton Suffolk Surry Sussex
Virginia Study Region Virginia
Est. Population Below 200 Percent Poverty 2005 Lower 3,169
7,961
5,515
24,579
2,329
3,492
47,044
1,809,310
Est. Uninsured Below 200 Percent Poverty 2005 Lower 856
2,149
1,489
6,636
629
943
12,702
488,514
Est. Uninsured Above 200 Percent Poverty 2005 Lower 465
2,269
1,055
4,924
426
733
9,871
515,653
Est. Uninsured Rate 2005 Lower 16% 13% 15% 15% 15% 14% 14% 13%
Est. Uninsured Total 2005 Lower 1,321
4,418
2,544
11,560
1,054
1,676
22,573
1,004,167
Yellow shading = local rate above Virginia state rate. See Appendix A for Gates County, NC data
Among the uninsured are an estimated 3,000-5,000 children under 18, and17,500-19,500 adults.

Unofficial Discussion Draft Subject to Change 44
Chart 6.2 Adult Health Care Access Estimates
IndicatorDesired Direction Franklin
Isle of Wight
Southampton Suffolk Surry Sussex
Virginia Study Region Virginia
Est. Could Not See Doctor Due to Cost 2005 Lower 901 3,404 1,918 8,558 797 1,439 17,017 765,200
Est. Percent Could Not See Doctor Due to Cost 2005
Lower
14% 13% 14% 15% 15% 15% 14% 13%
Est. No Dental Visit Past 2 Years 2005 Lower 1,247 4,532 2,676 10,918 1,033 1,901 22,307 997,589
Percent No dental visit 2 years 2005 Lower 20% 18% 20% 19% 19% 20% 19% 18%
Yellow shading = local rate above Virginia state rate. See Appendix A for Gates County, NC data

Unofficial Discussion Draft Subject to Change 45
Chart 6.3 Underserved Area Designations
Franklin
Suffolk
Sussex
Surry
Southampton
Isle of Wight
Gates
Access to health care is closely tied to availability of health care providers. Every locality in the region except for Southampton and Franklin have been designated as health professional shortage areas (HPSAs), meaning they may have a shortage of health professionals to meet population need. In addition, Surry County, Sussex County, Gates County are designated as ‘medically underserved areas’ (MUA), indicating they have additional risk factors related to poverty, infant mortality, or both. Designations are made by the Federal Bureau of Primary Health Care in coordination with the Virginia Department of Health.
MUA/ HPSA
MUA/ HPSA
HPSA
HPSA
MUA/ HPSA

Unofficial Discussion Draft Subject to Change 46
Charts 6.4-6.9Ambulatory Care Sensitive Condition Discharges
• Ambulatory Care Sensitive Conditions are health conditions for which inpatient hospitalization may be avoided with proper ambulatory care.
• A region with high rates of ACSC discharges may have barriers to ambulatory care utilization.
• Technical Note:– Virginia Health Information, Inc. requires the following notice to accompany any
use of its data:– “VHI has provided non-confidential patient level information used in this report
which it has compiled in accordance with Virginia law, but which it has no authority to independently verify. By using this report, the user agrees to assume all risks that may be associated with or arise from the use of inaccurate data. VHI cannot and does not represent that the use of VHI’s data was appropriate for this report, or endorse or support any conclusions of inferences that may be drawn from the use of VHI’s data.”
Unofficial Discussion Draft Subject to Change 47
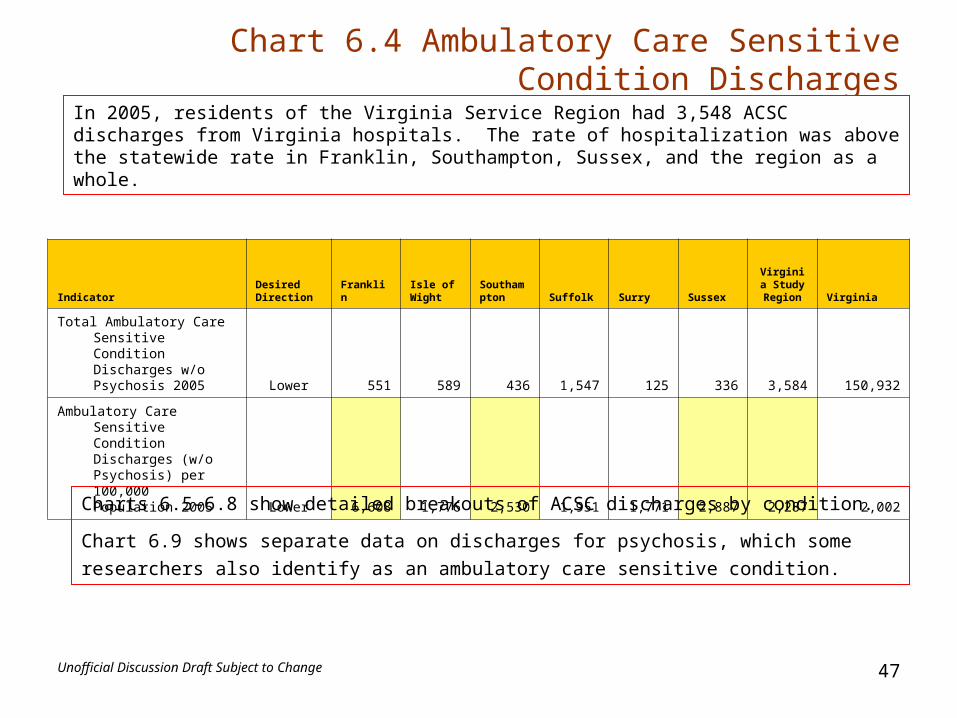
Chart 6.4 Ambulatory Care Sensitive Condition Discharges
IndicatorDesired Direction Franklin
Isle of Wight
Southampton Suffolk Surry Sussex
Virginia Study Region Virginia
Total Ambulatory Care Sensitive Condition Discharges w/o Psychosis 2005 Lower 551 589 436 1,547 125 336 3,584 150,932
Ambulatory Care Sensitive Condition Discharges (w/o Psychosis) per 100,000 Population 2005 Lower 6,608 1,776 2,530 1,951 1,771 2,887 2,287 2,002
In 2005, residents of the Virginia Service Region had 3,548 ACSC discharges from Virginia hospitals. The rate of hospitalization was above the statewide rate in Franklin, Southampton, Sussex, and the region as a whole.
Charts 6.5-6.8 show detailed breakouts of ACSC discharges by condition.
Chart 6.9 shows separate data on discharges for psychosis, which some researchers also identify
as an ambulatory care sensitive condition.

Unofficial Discussion Draft Subject to Change 48
Chart 6.5 Ambulatory Care Sensitive Condition Discharges
IndicatorDesired Direction Franklin
Isle of Wight
Southampton Suffolk Surry Sussex
Virginia Study Region Virginia
Dehydration Discharges 2005 Lower 151 127 99 292 28 89 786 34,555
Dehydration Discharges per 100,000 Pop. Lower 1,811 383 574 368 397 765 502 458
Congestive Heart Failure Discharges 2005 Lower 113 133 101 356 20 61 784 24,513
CHF Discharges per 100,000 Pop. Lower 1,355 401 586 449 283 524 500 325
Bacterial Pneumonia Discharges 2005 Lower 67 80 62 208 19 50 486 23,440
Bact Pneum Discharges per 100,000 Pop. Lower 803 241 360 262 269 430 310 311
Chronic Obstructive Pulmonary Disease Discharges 2005 Lower 35 46 29 114 9 31 264 14,097
COPD Discharges per 100,000 Pop. Lower 420 139 168 144 128 266 168 187
Asthma Discharges 2005 Lower 32 38 32 107 8 17 234 10,233
Asthma Discharges per 100,000 Pop. Lower 384 115 186 135 113 146 149 136
Yellow shading=rates above statewide rate. Use caution in interpreting rates for conditions with less than 30 discharges.

Unofficial Discussion Draft Subject to Change 49
Chart 6.6 Ambulatory Care Sensitive Condition Discharges
IndicatorDesired Direction Franklin
Isle of Wight
Southampton Suffolk Surry Sussex
Virginia Study Region Virginia
Kidney Discharges 2005 Lower 55 31 41 90 4 18 239 10,194
Kidney Discharges per 100,000 Pop. Lower 660 93 238 114 57 155 152 135
Cellulitis Discharges 2005 Lower 21 31 30 103 9 23 217 9,646
Cellulitis Discharges per 100,000 Pop. Lower 252 93 174 130 128 198 138 128
Diabetes Discharges 2005 Lower 34 48 15 133 10 14 254 8,498
Diabetes Discharges per 100,000 Pop. Lower 408 145 87 168 142 120 162 113
Convulsions Discharges 2005 Lower 12 14 10 48 4 11 99 4,122
Convulsions Discharges per 100,000 Pop. Lower 144 42 58 61 57 95 63 55
Gastroenteritis Discharges 2005 Lower 6 12 2 20 2 6 48 2,861
Gastro Discharges per 100,000 Pop. Lower 72 36 12 25 28 52 31 38
Yellow shading=rates above statewide rate. Use caution in interpreting rates for conditions with less than 30 discharges.

Unofficial Discussion Draft Subject to Change 50
Chart 6.7 Ambulatory Care Sensitive Condition Discharges
IndicatorDesired Direction Franklin
Isle of Wight
Southampton Suffolk Surry Sussex
Virginia Study Region Virginia
Hypertension Discharges 2005 Lower 4 3 1 23 4 4 39 2,133
Hypertension Discharges per 100,000 Pop. Lower 48 9 6 29 57 34 25 28
Angina Discharges 2005 Lower 4 7 6 10 0 3 30 2,105
Angina Discharges per 100,0000 Pop. Lower 48 21 35 13 0 26 19 28
Epilepsy Discharges 2005 Lower 6 1 2 10 1 0 20 1,204
Epilepsy Discharges per 100,000 Pop. Lower 72 3 12 13 14 0 13 16
Iron Deficiency Anemia Discharges 2005 Lower 3 1 0 7 2 2 15 753
Iron Deficiency Anemia Discharges per 100,000 Pop. Lower 36 3 0 9 28 17 10 10
Severe ENT Infection Discharges 2005 Lower 2 6 2 8 2 3 23 959
Severe ENT Discharges per 100,000 Pop. Lower 24 18 12 10 28 26 15 13
Yellow shading=rates above statewide rate. Use caution in interpreting rates for conditions with less than 30 discharges.

Unofficial Discussion Draft Subject to Change 51
Chart 6.8 Ambulatory Care Sensitive Condition Discharges
IndicatorDesired Direction Franklin
Isle of Wight
Southampton Suffolk Surry Sussex
Virginia Study Region Virginia
Pelvic Inflammatory Disease Discharges 2005 Lower 4 6 1 13 2 4 30 941
PID Discharges per 100,000 Pop. Lower 48 18 6 16 28 34 19 12
Dental Condition Discharges 2005 Lower 1 2 2 3 0 0 8 374
Dental Discharges per 100,000 Pop. Lower 12 6 12 4 0 0 5 5
Tuberculosis Discharges 2005 Lower 1 3 1 1 1 0 7 179
Tuberculosis Discharges per 100,000 Pop. Lower 12 9 6 1 14 0 4 2
Hypoglycemia Discharges 2005 Lower 0 0 0 1 0 0 1 125
Hypoglycemia Discharges per 100,000 Pop. Lower 0 0 0 1 0 0 1 2
Yellow shading=rates above statewide rate. Use caution in interpreting rates for conditions with less than 30 discharges.

Unofficial Discussion Draft Subject to Change 52
Chart 6.9 Ambulatory Care Sensitive Condition Discharges: Psychosis
IndicatorDesired Direction Franklin
Isle of Wight
Southampton Suffolk Surry Sussex
Virginia Study Region Virginia
Psychosis Discharges 2005 Lower 64 109 52 320 59 122 726 40,694
Psychosis Discharges per 100,000 Population 2005 Lower 767 329 302 404 836 1,048 463 540
Yellow shading=rates above statewide rate. Use caution in interpreting rates for conditions with less than 30 discharges.
Note: Psychosis is treated separately in this study because some but not all researchers identify psychosis as an ambulatory care sensitive condition.

Unofficial Discussion Draft Subject to Change 53
Appendix A. Gates County, NC Indicators
• Gates County, NC is treated separately in this report for two reasons:– 1) Data for some indicators were not available
in the same format or for the same year as the Virginia Study Region
– 2) the Survey of Local Health Professionals and Community Leaders was limited to the Virginia Study Region.

Unofficial Discussion Draft Subject to Change 54
Chart A.1 Gates County Population Profile
Indicator Value
Population 2000 10,516
Population 2005 11,060
Population 2011 11,519
Population Growth 2000-2011 1,003
Percent Growth 2000-2011 10%
Source: CHRC analysis of data from SRC Corp.

Unofficial Discussion Draft Subject to Change 55
Chart A.2 Gates County Race & Ethnicity Profile
Indicator Value
American Indian or Alaska Native 38
Percent AIAN 0%
Asian Population 2005 36
Percent Asian 2005 0%
Black or African American Population 2005 4249
Percent Black or African American 2005 38%
Hawaiian or Pacific Islander Population 2005 3
Percent Hawaiian or Pacific Islander 2005 0%
Multirace Population 2005 97
Percent Multirace 2005 1%
Other Race Population 2005 11
Percent Other Race 2005 0%
White Population 2005 6626
Percent White 2005 60%
Hispanic Population 2005 92
Percent Hispanic 2005 0%
Source: CHRC analysis of data from SRC Corp.

Unofficial Discussion Draft Subject to Change 56
Chart A.3 Gates County Age Profile
Indicator Value
Age 0-17 2005 2583
Percent Age 0-17 2005 23%
Age 18-64 2005 6832
Percent Age 18-64 2005 62%
Age 65 Plus 2005 1645
Pct Age 65 Plus 2005 15%
Source: CHRC analysis of data from SRC Corp.

Unofficial Discussion Draft Subject to Change 57
Chart A.4 Gates County Educational Attainment & Economic Profile
Indicator Value
Education
Population Age 25 Plus in 2005 7,370
Age 25 Plus and Less than High School Education 2005 1810
Percent Age 25 Plus and Less than High School Education 2005 25%
Economic Status
Per Capita Income 2006 $ 18,290
Average Household Income 2006 $ 47,623
Median Household Income 2006 $39,802
Child Poverty Rate 2004 18%
Est. Children in Poverty 462
Est. Population Below 200 Percent Poverty 2005 3,871
Percent Population Below 200 Percent Poverty 200035%
Source: CHRC analysis of data from SRC Corp.

Unofficial Discussion Draft Subject to Change 58
Chart A.5 Gates County Health Care Access Profile
Indicator Value
Medically underserved as of 2006 Yes
Uninsured Estimates
Est. Population Below 200 Percent Poverty 2005 3,871
Est. Uninsured Below 200 Percent Poverty 2005 1,045
Est. Uninsured Above 200 Percent Poverty 2005 647
Est. Uninsured Rate 2005 15%
Est. Uninsured Total 2005 1,692
Adult Access Estimates
Est. Could Not See Doctor Due to Cost 2005 1,102
Est. Percent Could Not See Doctor Due to Cost 200513%
Est. No Dental Visit Past 2 Years 2005 1,865
Percent No dental visit 2 years 2005 22%
Source: CHRC synthetic estimates using National Behavioral Risk Factor Surveillance Survey data applied to local demographic data from
SRC Corp.

Unofficial Discussion Draft Subject to Change 59
Chart A.6 Gates County Mortality ProfileIndicator Value
Deaths from All Causes
Total Deaths 2005 118
Deaths per 100,000 Population 204
Age-adjusted Deaths per 100,000 Population 226.8
Diseases of the Heart
Total Deaths 2005 23
Deaths per 100,000 Population 205
Age-adjusted Deaths per 100,000 Population 233.9
Malignant Neoplasms
Total Deaths 2005 31
Deaths per 100,000 Population 276.3
Age-adjusted Deaths per 100,000 Population 209.1
Cerebrovascular Disease
Total Deaths 2005 11
Deaths per 100,000 Population 98
Age-adjusted Deaths per 100,000 Population 62.9
Chronic Lower Respiratory Disease
Total Deaths 2005 5
Deaths per 100,000 Population 44.6
Age-adjusted Deaths per 100,000 Population 46
Source: CHRC analysis of data from NC Department of Health
Unofficial Discussion Draft Subject to Change 60
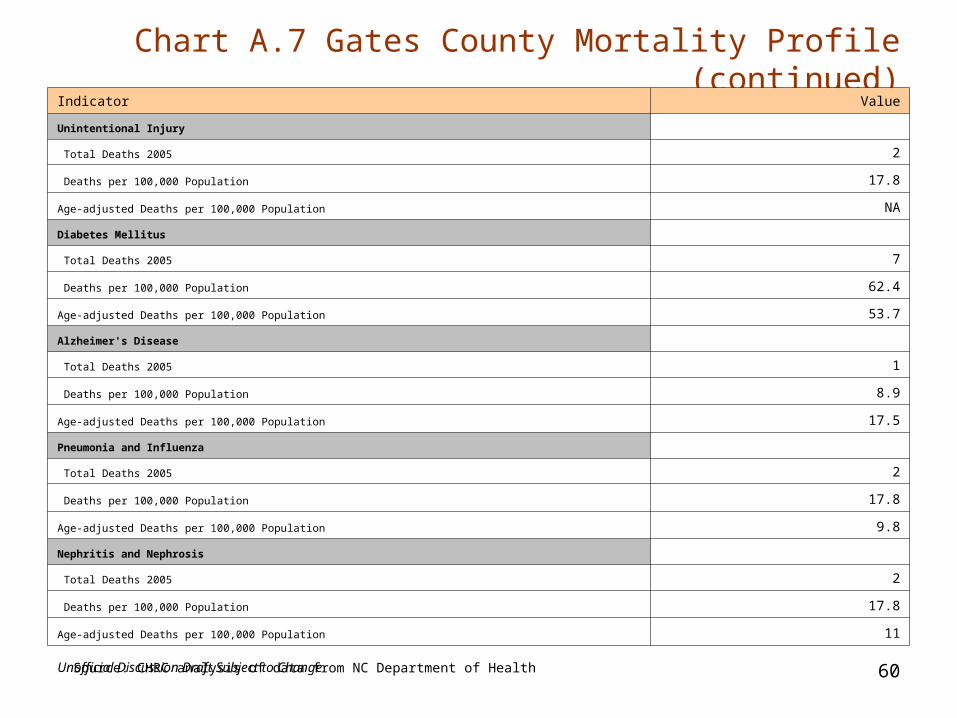
Chart A.7 Gates County Mortality Profile (continued)Indicator Value
Unintentional Injury
Total Deaths 2005 2
Deaths per 100,000 Population 17.8
Age-adjusted Deaths per 100,000 Population NA
Diabetes Mellitus
Total Deaths 2005 7
Deaths per 100,000 Population 62.4
Age-adjusted Deaths per 100,000 Population 53.7
Alzheimer's Disease
Total Deaths 2005 1
Deaths per 100,000 Population 8.9
Age-adjusted Deaths per 100,000 Population 17.5
Pneumonia and Influenza
Total Deaths 2005 2
Deaths per 100,000 Population 17.8
Age-adjusted Deaths per 100,000 Population 9.8
Nephritis and Nephrosis
Total Deaths 2005 2
Deaths per 100,000 Population 17.8
Age-adjusted Deaths per 100,000 Population 11
Source: CHRC analysis of data from NC Department of Health

Unofficial Discussion Draft Subject to Change 61
Chart A.8 Gates County Mortality Profile (continued)
Indicator Value
Septicemia
Total Deaths 2005 3
Deaths per 100,000 Population 26.7
Age-adjusted Deaths per 100,000 Population 24.6
Suicide
Total Deaths 2005 2
Deaths per 100,000 Population 17.8
Age-adjusted Deaths per 100,000 Population 5.4
Chronic Liver Disease
Total Deaths 2005 0
Deaths per 100,000 Population 0
Age-adjusted Deaths per 100,000 Population 6.7
Homicide and Legal Intervention
Total Deaths 2005 2
Deaths per 100,000 Population 17.8
Age-adjusted Deaths per 100,000 Population 15.2
Source: CHRC analysis of data from NC Department of Health

Unofficial Discussion Draft Subject to Change 62
Chart A.9 Gates County Birth Profile
Indicator Value
Pregnancies
Total Pregnancies 172
Induced Terminations of Pregnancy 44
Natural Fetal Deaths 1
Total Live Births 127
Birth Rate/1,000 Estimated Population 11.5
Source: CHRC analysis of data from NC Department of Health

Unofficial Discussion Draft Subject to Change 63
Chart A.10 Gates County Birth Profile (continued)
Indicator Value
Non-Marital Births
Non-Marital Births 64
Percent Non-Marital Births 50%
Low Weight Births
Low Weight Birth (<2,500 grams) 19
Low Weight Birth Percent of Total Births 15%
Late/No Prenatal Care Births
Began Care in First 13 Weeks 111
Began Care After 13 Weeks 16
Percent Began Care After 13 Weeks 13%
Source: CHRC analysis of data from NC Department of Health

Unofficial Discussion Draft Subject to Change 64
Chart A.11 Gates County Birth Profile (continued)
Indicator Value
Teen Pregnancy
Total Teenage Pregnancies 30
Preg Rate/1,000 Pop Ages 10-19 52.3
Pregnancies Ages<15 yrs 0
Preg Rate/1,000 Pop Ages<15 na
Pregnancies Ages 15-17 12
Preg Rate/1,000 Ages 15-17 na
Pregnancies Ages 18-19 18
Preg Rate/1,000 Ages 18-19 na
Source: CHRC analysis of data from NC Department of Health

Unofficial Discussion Draft Subject to Change 65
Chart A.12 Gates County Adult Health Status Indicators
Indicator Value
Adult Population 2005 8,477
Fair or Poor Health Status 2005 1,335
Percent Fair or Poor Health Status 200516%
Limitations Due to Health 2005 1,526
Percent Limitations Due to Health 2005 18%
Source: CHRC synthetic estimates using National Behavioral Risk Factor Surveillance Survey data applied to local demographic data from
SRC Corp.

Unofficial Discussion Draft Subject to Change 66
Chart A.13 Gates County Adult Health Status Indicators (continued)
Indicator Value
Overweight or Obese 2005 5,256
Percent Overweight or Obese 2005 62%
No Exercise in Past 30 Days 2005 2,204
Percent No Exercise in Past 30 Days 2005 26%
Less Than Five Servings Per Day of Fruits and Vegetables 2005 6,358
Percent Less Than Five Servings Per Day of Fruits and Vegetables 2005 75%
Smoke 2005 1,950
Percent Smoke 200523%
Risk for Binge Drinking 2005 1,102
Percent Risk for Binge Drinking 200513%
Source: CHRC synthetic estimates using National Behavioral Risk Factor Surveillance Survey data applied to local demographic data from
SRC Corp.

Unofficial Discussion Draft Subject to Change 67
Chart A.14 Gates County Adult Health Status Indicators (continued)
Indicator Value
Diabetes (Told by Doctor) 2005 839
Percent Diabetes (Told by Doctor) 200510%
High Blood Pressure (Told by Doctor) 2005 2,560
Percent High Blood Pressure (Told by Doctor) 200530%
High Cholesterol (Told by Doctor) 2005 2,357
Percent High Cholesterol (Told by Doctor) 200528%
Asthma (Told by Doctor) 2005 1,119
Percent Asthma (Told by Doctor) 200513%
Arthritis (Told by Doctor) 2005 2,543
Percent Arthritis (Told by Doctor) 200530%
Source: CHRC synthetic estimates using National Behavioral Risk Factor Surveillance Survey data applied to local demographic data from
SRC Corp.

Unofficial Discussion Draft Subject to Change 68
Appendix B. Table of ChartsPart 1 Health Demographic Indictors• Chart 1.1 Population Change 2000-2011 (Slide 14)• Chart 1.2 Population by Age 2005 (Slide 15)• Chart 1.3 Population by Race & Ethnicity 2005 (Slide 16)• Chart 1.4 Adult Population by Education Status 2005 (Slide 17)• Chart 1.5 Population by Income Status 2005 (Slide 18)
Part 2 Community Survey• Chart 2.1 Top Local Health Concerns from Community Survey
(Slide 20)• Chart 2.2 Top Local Health Concerns from Community Survey
Cont. (Slide 21)• Cart 2.3 Immediate & Significant Local Health Concerns from
Community Survey (Slide 22)• Chart 2.4 Immediate & Significant Local Health Concerns from
Community Survey Cont. (Slide 23)• Chart 2.5 Emerging Local Concerns from Community Survey
(Slide 24)• Chart 2.6 Emerging Local Concerns from Community Survey
Cont. (Slide 25)
Part 3 Mortality Indicators• Chart 3.1 Leading Causes of Death (Slide 27)• Chart 3.2 Leading Causes of Death Cont. (Slide 28)• Chart 3.3 Leading Causes of Death Cont. (Slide 29)• Chart 3.4 Leading Causes of Death Cont. (Slide 30)
Part 4 Birth Indicators• Chart 4.1 Total Pregnancies (Slide 32)• Chart 4.2 Low Birth Weight and Late Prenatal Care Births (Slide
33)• Chart 4.3 Non-marital Births (Slide 34)• Chart 4.4 Teen Pregnancies (Slide 35)
Part 5 Adult Health Status Estimates• Chart 5.1 Adult Health Limitation Estimates (Slide 38)• Chart 5.2 Adult Overweight, Obesity, and Nutrition Estimates
(Slide 39)• Chart 5.3 Adult Smoking and Alcohol Consumption Estimates
(Slide 40)• Chart 5.4 Adult Chronic Disease Estimates (Slide 41)
Part 6 Health Care Access Indicators• Chart 6.1 Uninsured Estimates (Slide 43)• Chart 6.2 Adult Health Care Access Estimates (Slide 44)• Chart 6.3 Uninsured Area Designations (Slide 45)• Chart 6.4 Ambulatory Care Sensitive Condition Discharges (Slide
46)• Chart 6.5 through Chart 6.8 Ambulatory Care Sensitive Condition
Discharges (Slides 47-51)• Chart 6.9 Ambulatory Care Sensitive Condition Discharges:
Psychosis (Slide 52)
Appendix A: Gates County, NC Indicators• Chart A.1 Gates County Population Profile (Slide 54)• Chart A.2 Gates County Race & Ethnicity Profile (Slide 55)• Chart A.3 Gates County Age Profile (Slide 56)• Chart A.4 Gates County Educational Attainment & Economic
Profile (Slide 57)• Chart A.5 Gates County Health Care Access Profile (Slide 58)• Chart A.6 Gates County Mortality Profile (Slide 59)• Chart A.7 – Chart A.8 Gates County Mortality Profile (Slides 60-
61)• Charts A.9-Chart A.11 Gates County Birth Profile (Slides 62-64)• Chart A.12 –Chart A.14Gates County Adult Health Status
Indicators (Slides 65-67)


