Object Detection using a Max-Margin Hough Transform * Subhransu Maji, Jitendra Malik Computer Science Division, EECS University of California at Berkeley {smaji,malik}@cs.berkeley.edu Abstract We present a discriminative Hough transform based ob- ject detector where each local part casts a weighted vote for the possible locations of the object center. We show that the weights can be learned in a max-margin framework which directly optimizes the classification performance. The dis- criminative training takes into account both the codebook appearance and the spatial distribution of its position with respect to the object center to derive its importance. On various datasets we show that the discriminative training improves the Hough detector. Combined with a verification step using a SVM based classifier, our approach achieves a detection rate of 91.9% at 0.3 false positives per image on the ETHZ shape dataset, a significant improvement over the state of the art, while running the verification step on at least an order of magnitude fewer windows than in a sliding window approach. 1. Introduction Various techniques for object detection have been pro- posed in the literature including sliding window classifiers, pictorial structures [7], constellation models [8] and im- plicit shape models [18]. Sliding window classifiers are es- pecially well suited for rigid objects and have been used widely for detection of faces [23, 25], pedestrians [5, 20], cars [24], etc. A binary classifier is evaluated on a uniform sample of the possible locations and scales and is followed by postprocessing step like non-max suppression to find the objects. Some of the popular techniques to alleviate the complexity issue include looking at salient regions, coarse to fine search, branch-and-bound [16]. The Hough transform [6] provides yet another way of dealing with the complexity issue of searching over pose and has been used for various pose estimation problems in- cluding shape detection [2]. Of particular interest is the im- * This work is funded by ARO MURI W911NF-06-1-0076 and ONR MURI N00014-06-1-0734 plicit shape model [18] which is a probabilistic formulation of the Hough transform where local parts probabilistically vote for locations of the objects. Combined with verifica- tion step, this approach has been used successfully for de- tection of objects [18, 22]. By allowing the local parts to vote for possible transformations of the object like transla- tion, scale and aspect variation, one can use the peaks of the voting space for importance sampling of windows for fur- ther evaluation. Any technique that causes the voting space to better reflect the presence of the object has a direct impact on the speed and accuracy of this two stage classifier. The main contribution of this paper is to place the Hough transform in a discriminative framework where each local part casts a weighted vote for the possible locations of the object center. The learning framework takes into account both the appearance of the part and the spatial distribution of its position with respect to the object center and parts which are both repeatable and occur at a consistent location are assigned higher weights. The final formulation turns out to be convex and one can obtain a globally optimal solu- tion using off the shelf optimization packages. We call our approach ’Max-Margin Hough Transform’ or M 2 HT. The framework treats the parts (or codewords) and the proba- bility distribution of the object locations as a blackbox, and hence it can be used to learn weights for the popular implicit shape model. We present experiments on various datasets to show the power of discriminative training by comparing it with a Hough transform that uses uniform codeword weights as well as a simple scheme which we refer to as naive-bayes weights, that takes into account only the “representative- ness” of the part and ignores its spatial distribution. On the ETHZ shape dataset [9] the M 2 HT detector has a detection rate of 60.9% at 1.0 false positives per image compared to 52.4% using uniform weights and 54.2% using naive-bayes weights. On UIUC cars dataset [1] the M 2 HT detector has half the false positives per image rate at 90% recall com- pared to the Hough detector based on both uniform and naive-bayes weights. The performance of M 2 HT is also bet- ter than both on the INRIA horses dataset.
Transcript
Object Detection using a Max-Margin Hough Transform ∗
Subhransu Maji, Jitendra Malik
Computer Science Division, EECS
University of California at Berkeley
{smaji,malik}@cs.berkeley.edu
Abstract
We present a discriminative Hough transform based ob-
ject detector where each local part casts a weighted vote for
the possible locations of the object center. We show that the
weights can be learned in a max-margin framework which
directly optimizes the classification performance. The dis-
criminative training takes into account both the codebook
appearance and the spatial distribution of its position with
respect to the object center to derive its importance. On
various datasets we show that the discriminative training
improves the Hough detector. Combined with a verification
step using a SVM based classifier, our approach achieves
a detection rate of 91.9% at 0.3 false positives per imageon the ETHZ shape dataset, a significant improvement over
the state of the art, while running the verification step on at
least an order of magnitude fewer windows than in a sliding
window approach.
1. Introduction
Various techniques for object detection have been pro-
posed in the literature including sliding window classifiers,
pictorial structures [7], constellation models [8] and im-
plicit shape models [18]. Sliding window classifiers are es-
pecially well suited for rigid objects and have been used
widely for detection of faces [23, 25], pedestrians [5, 20],
cars [24], etc. A binary classifier is evaluated on a uniform
sample of the possible locations and scales and is followed
by postprocessing step like non-max suppression to find the
objects. Some of the popular techniques to alleviate the
complexity issue include looking at salient regions, coarse
to fine search, branch-and-bound [16].
The Hough transform [6] provides yet another way of
dealing with the complexity issue of searching over pose
and has been used for various pose estimation problems in-
cluding shape detection [2]. Of particular interest is the im-
∗This work is funded by ARO MURI W911NF-06-1-0076 and ONR
MURI N00014-06-1-0734
plicit shape model [18] which is a probabilistic formulation
of the Hough transform where local parts probabilistically
vote for locations of the objects. Combined with verifica-
tion step, this approach has been used successfully for de-
tection of objects [18, 22]. By allowing the local parts to
vote for possible transformations of the object like transla-
tion, scale and aspect variation, one can use the peaks of the
voting space for importance sampling of windows for fur-
ther evaluation. Any technique that causes the voting space
to better reflect the presence of the object has a direct impact
on the speed and accuracy of this two stage classifier.
The main contribution of this paper is to place the Hough
transform in a discriminative framework where each local
part casts a weighted vote for the possible locations of the
object center. The learning framework takes into account
both the appearance of the part and the spatial distribution
of its position with respect to the object center and parts
which are both repeatable and occur at a consistent location
are assigned higher weights. The final formulation turns out
to be convex and one can obtain a globally optimal solu-
tion using off the shelf optimization packages. We call our
approach ’Max-Margin Hough Transform’ or M2HT. The
framework treats the parts (or codewords) and the proba-
bility distribution of the object locations as a blackbox, and
hence it can be used to learn weights for the popular implicit
shape model.
We present experiments on various datasets to show the
power of discriminative training by comparing it with a
Hough transform that uses uniform codeword weights as
well as a simple scheme which we refer to as naive-bayes
weights, that takes into account only the “representative-
ness” of the part and ignores its spatial distribution. On the
ETHZ shape dataset [9] the M2HT detector has a detection
rate of 60.9% at 1.0 false positives per image compared to52.4% using uniform weights and 54.2% using naive-bayesweights. On UIUC cars dataset [1] the M2HT detector has
half the false positives per image rate at 90% recall com-pared to the Hough detector based on both uniform and
naive-bayesweights. The performance of M2HT is also bet-
ter than both on the INRIA horses dataset.
We present further experiments by combining the Hough
detector with a verification step using a standard SVM clas-
sifier, which then finds the location of the objects by per-
forming a local search around the proposed regions. Our
two stage classifier achieves a detection rate of 91.9% at 0.3false positive per image (FPPI) on the ETHZ shape dataset,
a significant improvement over the state of the art, while
running the verification step on at least an order of mag-
nitude fewer windows than in a sliding window approach.
On UIUC cars we obtain a performace of 97.5% at equalerror rate, while having to run the verification step on only
10 windows per image. On INRIA horse dataset the overalldetector has a recall of 85.27% at 1.0 FPPI, almost the sameas sliding window detector while again considering only a
small set of windows per image.
The rest of the paper is structured as follows: We present
an overview of the probabilistic Hough transform in Sec-
tion 2. In Section 3 we cast the voting process in a dis-
criminative framework and outline the max-margin formu-
lation of the problem. The overall detection strategy is de-
scribed in Section 4. We present our experiments on various
datasets in Section 5 and conclude in Section 6.
2. Probabilistic Hough Transform
Let fi denote the feature observed at a location li, whichcould be based on the properties of the local patch around
li. Let S(O, x) denote the score of object O at a loca-tion x. Here x denotes pose related properties such asposition, scale, and aspect ratio. Let Ci denotes the i’thcodebook entry of the vector quantized space of features f .The implicit shape model [18] framework obtains the over-
all score S(O, x) by adding up the individual probabilitiesp(O, x, fj , lj) over all observations , i.e.
S(O, x) =∑
j
p(O, x, fj , lj) (1)
=∑
j
p(fj , lj)p(O, x|fj , lj) (2)
Assuming a uniform prior over features and locations and
marginalizing over the codebook entries we get :
S(O, x) ∝∑
j
p(O, x|fj , lj) (3)
=∑
i,j
p(Ci|fj , lj)p(O, x|Ci, fj, lj) (4)
One can simplify this further using the fact that
p(Ci|fj, lj) = p(Ci|fj) because the codebook entries arematched based on appearance only and the distribution
p(O, x|Ci, lj , fj) depends only on the matched codebook
entry Ci and lj .
S(O, x) ∝∑
i,j
p(Ci|fj)p(O, x|Ci, lj) (5)
=∑
i,j
p(Ci|fj)p(x|O, Ci, lj)p(O|Ci, lj)(6)
The first term is the likelihood that the codebook entry Ci
generated the feature fj . We base this on the distance of the
codebook entry to the feature as follows:
p(Ci|f) =
{
1
Zexp(−γd(Ci, f)) if d(Ci, f) ≤ t
0 otherwise(7)
Where Z is a constant to make p(Ci|f) a probability distri-bution and γ, t are positive constants. The second term isthe probabilistic Hough vote for the location of the object,
which can be estimated during training time by observing
the distribution of the locations of the codebook activations
relative to the object center. In our experiments we maintain
a binned estimate of p(x|O, Ci, lj) by discretizing the spaceof relative locations of the object. The third term is the
weight of the codebook entry emphasizing how confident
we are that the codebook entryCi at location lj matches theobject as opposed to background. Assuming that the prob-
ability p(O|Ci, l) is independent of the location (locationinvariance) we have a simple way of estimating this using
both positive and negative examples as follows :
p(O|Ci, l) = p(O|Ci) ∝p(Ci|O)
p(Ci)(8)
Here, p(Ci|O) is the relative frequency of the codebookentry Ci on the object features , while P (Ci) is the relativefrequency on both negative and positive training images.
We refer to this as naive-bayes weights, as the weight is set
independently for each codebook entry. This takes into ac-
count only the appearance of the codebook and ignores the
spatial distribution of the part relative to the object center.
In the next section we present a way to jointly consider both
for learning weights on codebooks. Figure 1 illustrates the
detection pipeline for the probabilistic Hough Tranform.
3. Max-Margin Hough Transform
The overall procedure in the previous section can be seen
as a weighted vote for object locations over all codebook
entries Ci. In this section we will show how to learn these
weights wi in a discriminative manner which directly op-
timizes the classification performance. The key idea is to
observe that the score of the S(O, x) is a linear function ofp(O|Ci) (making the similar location invariance assump-tion that p(O|Ci, l) = p(O|Ci)). One can see this readily
Figure 1. Pipeline for the Probabilistic Hough Tranform (PHT).
Given an image local features are extracted which are matched to
codebook entries. Votes are cast over possible locations accord-
ing to a learned distribution over object centers weighted by the
importance of each codeword.
from the following :
S(O, x) ∝∑
i,j
p(x|O, Ci, lj)p(Ci|fj)p(O|Ci, lj) (9)
=∑
i,j
p(x|O, Ci, lj)p(Ci|fj)p(O|Ci) (10)
=∑
i
p(O|Ci)∑
j
p(x|O, Ci, lj)p(Ci|fj) (11)
=∑
i
wi × ai(x) = wT A(x) (12)
where AT = [a1a2 . . . aK ] is the activation vector and ai
is given by the following equation:
ai(x) =∑
j
p(x|O, Ci, lj)p(Ci|fj) (13)
For a given object location and identity, the summation over
j is a constant and is only a function of the observed fea-tures, locations and the estimated distribution over the cen-
ters for the codebook entry Ci. This suggests a discrimi-
native training algorithm that finds weights that maximize
the score S on correct object locations over incorrect ones.Unlike the earlier method of estimating wi based just on
codebook activations, we have the ability to additionally use
the conditional distribution of the object centers to learn the
weights. In the next section we formalize our training al-
gorithm as well as present experiments to validate our ap-
proach.
3.1. Discriminative Training
Let {(yi, xi)}Ni=1be set of training examples, where
yi ∈ {+1,−1} is the label and xi is the location of the
i’th training instance. Typically we are given the positiveinstances and pick the “hard” negative instances by find-
ing the peaks in the voting space (using uniform weights)
negative training images. The first stage is to compute the
activations Ai = A(xi) for each example by carrying for-ward the voting process and adding up the votes for each
feature fj found at location lj according to the Equation 13.Thus the score assigned by the model to the instance i is
Figure 2. Training pipeline for the “Max-Margin Hough Trans-
form”. Given positive and negative training examples with true
locations (X±), we obtain the activations A(X±) (Equation 3) foreach example, from which weights are learned by using the M2HT
learning framework.
wT Ai. Weights are learned by maximizing this score on
correct locations of the object over incorrect ones. In order
to be robust to outliers and avoid overfitting, we propose a
max-margin formulation leading to the following optimiza-
tion problem :
minw,b,ξ
1
2wT w + C
T∑
i=1
ξi (14)
s.t. : yi(wT Ai + b) ≥ 1 − ξi (15)
w ≥ 0, ξi ≥ 0, ∀i = 1, 2, . . . , N (16)
This optimization is similar to the optimization problem
of a linear Support Vector Machine [4], with an additional
positivity constraint on the weights. We use a standard off
the shelf optimization package called CVX [13] for solving
this problem. Figure 2 shows the training pipeline and Fig-
ure 3 shows a toy example which illustrates the differences
between the uniform, naive-bayes and M2HT weights.
4. Overall Detection Strategy
The overall detector works in two stages; First theM2HT
detector is run on the image and a small set of regions most
likely to contain the object of interest is found. Next a ver-
ification classifier based on a SVM finds the true location
and score of the object by doing a local search around each
region by sampling nearby scales and translations. Instead
of densely sampling windows all over the image, the Hough
step lets us concentrate around the regions most likely to
contain the object and at the same time allows us to implic-
itly sample a wider set of transforms including aspect ratio.
We briefly describe the details of both the steps in the next
two sections.
4.1. M2HT Detector
Weights are learned on codebooks generated using k-means clustering of Geometric Blur (GB) features [3] sam-
pled uniformly along the edges in an image. We choose four
(-) neg example
(+) pos example
(a)
CodebookWeights
Type Codebook(C) p(C|−) p(C|+) A(X−) A(X+) UNIF NB M2HT
Figure 3. Toy Example. (a) Consider the case when we want to detect squares vs. parallel lines. The codebook C, consists of four types oflocal features: tip, v-edge, h-edge and corner. Assume that the tips and corners can localized reliably, but the v/h-edges have an ambiguity
in localization as shown by the blue dots in (a). Furthermore for simplicity assume that the a v/h-edge feature can be found in one of
five discrete locations along the edge, i.e. p(X + | v/h-edge) = 1/5. Table (b) shows various steps in the Hough voting. p(C|±) is theprobability of each codebook type in the ± example. A(X±) are the codebook activations obtained using Equation 3. Naive Bayes(NB)
weights ∝ 2p(C|+)p(C|+)+p(C|−)
correctly ignores the tip features and downweighs the v-edge features, but the h-edge and corner features are
weighted equally. M2HT on the other hand downweighs the h-edge features as they do not localize well. In addition it completely ignores
the v-edge features as they contribute equally to the + and − example. Table (c) shows the scores according to the weights for variousschemes. Notice how M2HT weights assigns a score of 0 on the negative example while at the same time achieving a high separationbetween the + and − example. It finds the corners as the most important feature type.
orientation directions and the outer radius of the GB fea-
ture typically as 20% of the object height, giving us a goodtradeoff between the repeatability and discriminativeness of
the features. In our simple implementation we found that
voting over scales is not as reliable, so instead we run the
M2HT detector at a small set of scales and vote for the rest
of the pose parameters. The choice of local features is arbi-
trary and we choose local features based on patches of fixed
size for simplicity, while taking note that [15] has recently
proposed a Hough transform based detector using regions
as local features. On the positive set of training images, the
relative pose of the center of the object is recorded during
training time and a binned approximation of this distribu-
tion is maintained. Negative examples are obtained by first
running the Hough detector using uniformweights on nega-
tive images and finding the peaks in the voting space above
a threshold. Negative images are typically ones not con-
taining the category of interest. Activations (Ai) are then
computed on the set of positive and negative locations and
are used to learn the weights of the codebook entries using
our max-margin formulation.
4.2. Verification Classifier
We train a SVM classifier using the pyramid match ker-
nel [14, 17] on histograms of oriented gradients as features.
Responses to [−1 0 1] and [−1 0 1]T filters define the gradi-
ents from which histograms in 9 orientations are computed.The image is divided into grids of increasing resolutions for
4 levels, and histograms from each level are weighted ac-cording to the equationwl = 2l−1 , l = 1 being the coarsestscale, and concatenated together to from one long feature
vector. A SVM is trained using the histogram intersection
kernel on these features. We refer to this as the IKSVM
classifier. On all datasets training is done by resizing the
positive instances of the category to the median aspect ratio
and a number of windows sampled from negative training
images serve as negative examples. To detect an instance of
an object in the sliding window mode the classifier is run at
various locations and scales by keeping the aspect ratio of
the image fixed. Search over aspect ratio adds another fac-
tor to the run time, so we do not do it. A simpler baseline
would have been to use a linear kernel, but others [9] have
noticed that on the ETHZ shape dataset, linear SVM does
not give full recall. We use the speedup method for IKSVM
classification proposed in [19] which makes the runtime of
the classifier essentially equivalent to a linear SVM.
5. Experimental Results
In all our experiments we would like to verify two
things: (1) The M2HT detector should have a better per-
formance compared to Hough transform detector using
uniform weights or naive-bayes weights. Quantitatively
this means a lower false positive rate for the same recall.
(2) The performance of the two stage M2HT + IKSVM de-
tector should be comparable to the IKSVM detector in the
sliding window mode, while having to evaluate the IKSVM
detector on a significantly fewer locations. Additionally, if
the Hough transform votes for pose parameters like aspect
ratio we would like to see that the two stage detector is ro-
bust to these pose changes. Finally the overall approach
should compare favorably to other approaches in the litera-
ture both in terms of accuracy and space-time complexity.
To validate our claims we present our experiments on the
ETHZ shape, UIUC cars and INRIA horses dataset.
5.1. ETHZ Shape Dataset
We first report our results on the ETHZ Shape Dataset.
It contains 255 test images and features five shape-basedclasses (apple logos, bottles, giraffes, mugs, and swans).
For training we use half the positive examples and an equal
number of negative examples equally distributed among the
rest of the categories. All the remaining examples are used
for testing. We use the same training and test splits used by
authors of [9] for a fair comparison.
M2HT Detector Training : For the Hough training step
all ground truth bounding boxes of a particular category are
scaled to a height of 96 pixels, while keeping the aspect ra-tio fixed. A separate codebook is learned for each category
using k-means clustering with k = 400 centers. For cate-gories like mugs and giraffes the aspect ratio varies widely
so we train the Hough detector to vote for both the center
and aspect ratio of the object. We maintain a binned ap-
proximation of distribution of the location of the center with
bin width=10px, bin height=10px and aspect width=0.1.We then run the max-margin training procedure described
in Section 4.1 to learn the weights for the codebook en-
tries. Figure 4(a), shows the learned weights for various
categories. The learning framework assigns high weights
to parts of the object which are both characteristic and are
good predictors of the object location, while simultaneously
ignoring the background clutter in images. Notice that we
only use the groundtruth bounding box for training, which
includes a significant amount of background clutter for cat-
egories like giraffes and swans. The naive-bayes weights
are strongly affected by rarely occurring structures in the
background. Table 1 shows the detection rates for various
weights. The learned weights do better than both uniform
and naive-bayes weights.
Overall Detector Results : Table 1 shows the results
for both the IKSVM detector used in the sliding window
mode at a fixed aspect ratio and the M2HT + IKSVM
detector. Precision/Recall and Detection Rate/FPPI plots
for the M2HT + IKSVM detector are in Figure 5. The
IKSVM baseline is quite good and achieves a detection rate
(a) ETHZ Shape Dataset
(b) UIUC Cars
(c) INRIA Horses
Figure 4. Naive Bayes / Learned weights using M2HT, on
various categories of the ETHZ shape (a top / bottom),
UIUC cars (b left / right) and INRIA horses dataset (c left / right)
respectively. For each category the colors represent the strength of
the weights (dark red is highest) and are on the same scale for both
naive-bayes and M2HT. In each image, the most important part is
circled with radius equal to the outer radius of the GB descriptor.
Notice how the salient parts like the handles on mugs, the neck
and leg regions of the giraffe are assigned high weights, while
the background clutter is ignored. The naive-bayes weights are
strongly affected by rare structures in the background. On UIUC
cars features at the bottom of the car like shadows and wheels are
emphasized which are both repeatable and good predictors of the
object center, while on INRIA horses regions near the head and
tail are found to be most important.
of 87.7% (0.3 FPPI) and 88.48%(0.4 FPPI). Sampling thenearby scales and locations around the regions proposed by
the Hough transform leads to an improved detection rate of
91.9%(0.3 FPPI) and 93.2%(0.4 FPPI). Including the win-dows of the local search is still at least two orders of mag-
nitude fewer than a sliding window detector for a similar
dense sampling. Additionally we implicitly sample over as-
pect ratios because the Hough detector proposes regions of
various aspect ratios. This leads to a significant improve-
ment over the baseline IKSVM detector for the giraffe and
mugs category, where the aspect ratio varies widely. Our
results are significant improvement over previous best re-
sults 61.4% of KAS [9] and 67.1% of TPS-RPM [10] at0.3 FPPI. While the results of TPS-RPM are not directly
0 0.1 0.2 0.3 0.4 0.5 0.6 0.7 0.8 0.9 10
0.1
0.2
0.3
0.4
0.5
0.6
0.7
0.8
0.9
1
False Pos Per Image
Dete
ction R
ate
ETHZ Shape Dataset [M2HT + IKSVM]
Applelogos
Bottles
Giraffes
Mugs
Swans
0 0.1 0.2 0.3 0.4 0.5 0.6 0.7 0.8 0.9 10
0.1
0.2
0.3
0.4
0.5
0.6
0.7
0.8
0.9
1
Recall
Pre
cis
ion
ETHZ Shape Dataset [M2HT + IKSVM]
Applelogos
Bottles
Giraffes
Mugs
Swans
Figure 5. Detection plots using the M2HT + IKSVM on ETHZ
shape dataset. (Left) Detection Rate vs. FPPI ; (Right) Precision
vs. Recall. All results are reported using the PASCAL criterion.
Figure 6. (Rows 1-2) Example detections on the ETHZ shape
dataset using M2HT+IKSVM detector (blue), IKSVM de-
tector used in sliding window mode (green) overlaid with
groundtruth (red). (Row 3) Example images where at least one
of the two detectors fails.
comparable as the authors report numbers using a five-fold
cross validation, ours are still better considering that the av-
erage standard deviation in accuracy over trials is about 9%.However [10] has the additional ability to localize the object
boundaries. The only other approach that achieves compa-
rable results on this dataset is the contemporaneouswork of
recognition using regions [15]. Figure 6 shows examples of
detections and misses for various categories.
5.2. UIUC Cars
This database was collected at UIUC [1] and contains
images of side views of cars. The training set consists of
550 car and 500 non-car images. We test our methods onthe single scale image test set which contains 170 imageswith 200 cars. The images are of different sizes themselvesbut contain cars of approximately the same scale as in the
training images.
M2HT Detector Training : Similar to the ETHZ
dataset we compute GB features on both the positive and
negative windows by uniformly sampling points on the
edges and learn a codebook using k-means with k = 100.For every cluster the conditional distribution of the center
of the object is maintained as binned approximation with a
bin width=4px and bin height=4px. This is a fairly densesampling given that the training images are 100 × 40, sowe spatially smooth the bins to avoid any artifacts. A sec-
ond loop over the training images is done and activations
are computed and codebook weights are learned using the
M2HT framework. Figure 4(b) shows the learned weights
using max-margin training and naive bayes. Notice how the
features near the bottom of the car are emphasized, which
are both repeatable and good predictors of the object center.
M2HT/Overall Detector Results : Figure 7(Left)
shows the recall as a function of false positives per image
for various learning schemes. At 90% recall the M2HT de-
tector has about half as many false positives per image than
the Hough detector using uniform weights or naive bayes
weights. Considering only the top 10 windows per im-age and running the IKSVM verification step leads to re-
call of 97.5% at equal error rate an improvement of 1.74%over IKSVM detector used in the sliding window mode,
while having to consider 10× fewer regions per image (Fig-ure 7(Middle)). The increased precision is because the
IKSVM classifier densely samples windows near the most
likely locations of the object, while being able to discard a
large fraction of the regions in the image not containing an
object. Our method compares favorably to other methods in
the literature as shown in Figure 7(Right).
5.3. INRIA Horses
The INRIA horse dataset collected by Jurie and Fer-
rari, consists of 170 images with one or more side-viewsof horses and 170 images without horses. Horses appear atseveral scales, and against cluttered backgrounds. We use
the same training and test split of [9] consisting of 50 pos-itive and 50 negative examples for training and the rest fortesting.
M2HT Detector Training : We learn a codebook using
k-means with k = 500 and learn weights for each clus-ter center. Figure 4(c) shows the weights learned for vari-
ous features using the max-margin training and naive-bayes
scheme. The IKSVM classifier is trained by resizing all the
ground truth bounding boxes to the median aspect ratio of
all horses in this dataset.
M2HT/Overall Detector Results : Figure 9 shows the
performance of the M2HT detector and the overall detec-
tor. The M2HT detector outperforms both the naive-bayes
and the uniform weights. The overall performance of the
M2HT + IKSVM detector is same as the IKSVM detec-
tor while having to consider only 25 windows per image,which is up to two orders of magnitude fewer than the slid-
ing window classifier. At 1.0 false positive per image wehave a detection rate of 85.27% for M2HT + IKSVM and
86% for IKSVM compared to previously published resultsof 80.77%[9, 11] and 73.75% [10]. The results of [10] arehowever not directly comparable as the authors report re-
sults using 5-fold cross validation. Figure 9(Right) showssome detections and misses on this dataset.
Average 52.4 54.2 60.9 87.5/88.4 91.9/93.2 61.4/66.9 67.1/71.9
Table 1. Performance of various algorithms on the ETHZ shape dataset. All the results are reported using the PASCAL criterion (Intersec-
tion/Union≥ 0.5). The Hough detector based on discriminatively learned weights (M2HT) alone has a detection rate of 60.9% at 1.0 FPPI,an improvement of 6.7% over the naive bayes weights (NB) and 8.5% over uniform weights (UNIF). The IKSVM classifier when used insliding window mode has a average detection rate of 87.5% at 0.3 FPPI. By combining with the Hough detector, the performance improvesto 91.9% at 0.3 FPPI. There are significant improvements in the giraffe and mugs category, which have high variation in aspect ratio. Thisis a significant improvement over previous best results 61.4% of KAS [9, 11] and 67.1% of TPS-RPM [10] at 0.3 FPPI. (The results ofTPS-RPM are not directly comparable as the authors report numbers using a 5-fold cross validation.)*
0 1 2 3 4 5 6 7 8 9 100
0.1
0.2
0.3
0.4
0.5
0.6
0.7
0.8
0.9
1
false pos per image
reca
ll
Single Scale UIUC Cars
uniform
naive−bayes
C=25.00
C=50.00
C=75.00
0 0.05 0.1 0.15 0.2 0.25 0.3 0.35 0.4 0.45 0.50.5
0.55
0.6
0.65
0.7
0.75
0.8
0.85
0.9
0.95
1
1−precision
reca
ll
Single Scale UIUC Cars
IKSVM [4.24]
M2HT + IKSVM [2.50]
Method Performance
IKSVM 95.76 %
M2HT + IKSVM 97.50 %
Agarwal & Roth [1] 79 %
Garg et al. [12] 88 %
Fergus et al. [8] 88.5 %
ISM [18] 97.5 %
Mutch & Lowe [21] 99.6 %
Lampert et al. [16] 98.5 %
Figure 7. (Left) Detection plots on UIUC car dataset for various values of the learning parameter C using the max-margin Hough training.At 90% recall the false positive rate is only about half compared to both uniform weights and naive bayes weights. (Middle) Combiningwith the verification step using the IKSVM classifier. Only the top 10 windows per image are considered, which is at least 10× fewer thanthe number of windows considered by a sliding window detector. By sampling around the regions proposed by the Hough detector there
is an improvement of 1.74% over the sliding window detector. (Right) Performance at Equal Error Rate on UIUC Single Scale Cars forvarious methods.
6. ConclusionsThe main contribution of this paper is to cast the Hough
transform in discriminative frameworkwhich leads to better
accuracy on various datasets compared to both uniform and
naive-bayes weights. The implicit shape model may bene-
fit from this framework to learn the weights as our frame-
work treats both the parts and spatial models as a blackbox.
The final problem is convex and easy to optimize using off
the shelf optimization packages. The proposed two stage
M2HT + IKSVM detector has better runtime complexity
than a sliding window detector and at the same time is more
robust to pose variations leading to state of the art results on
ETHZ shape dataset and competitive results on the UIUC
car and INRIA horse dataset.
References
[1] S. Agarwal and D. Roth. Learning a sparse representation
for object detection. In ECCV (4), pages 113–130, 2002.
[2] D. H. Ballard. Generalizing the hough transform to detect
[3] A. C. Berg and J. Malik. Geometric blur for template match-
ing. In CVPR (1), pages 607–614, 2001.
[4] C. Cortes and V. Vapnik. Support-vector networks. Machine
Learning, 20(3):273–297, 1995.
[5] N. Dalal and B. Triggs. Histograms of oriented gradients for
human detection. In CVPR (1), pages 886–893, 2005.
[6] R. O. Duda and P. E. Hart. Use of the hough transforma-
tion to detect lines and curves in pictures. Commun. ACM,
15(1):11–15, 1972.
[7] P. F. Felzenszwalb and D. P. Huttenlocher. Pictorial struc-
tures for object recognition. IJCV, 61(1):55–79, 2005.
[8] R. Fergus, P. Perona, and A. Zisserman. Object class recog-
nition by unsupervised scale-invariant learning. InCVPR (2),
pages 264–271, 2003.
[9] V. Ferrari, L. Fevrier, F. Jurie, and C. Schmid. Groups of
adjacent contour segments for object detection. IEEE Trans.
Pattern Anal. Mach. Intell., 30(1):36–51, 2008.
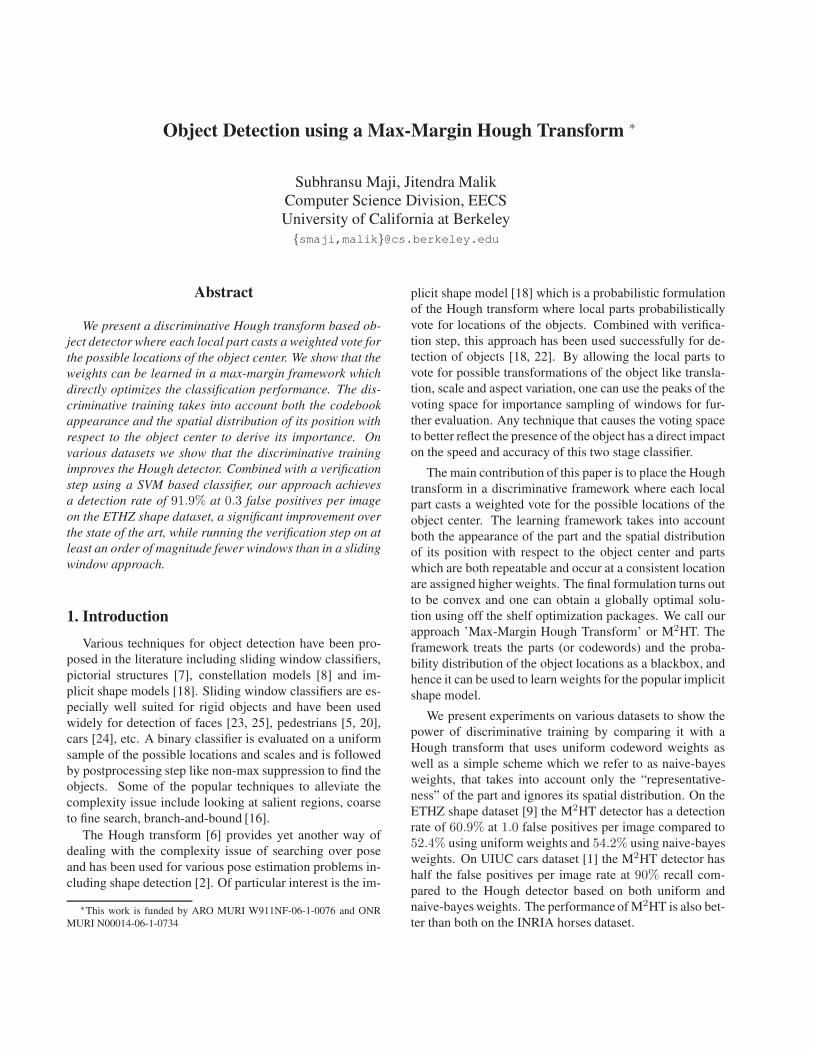
Figure 8. Example detections(green) and mis-detections(red) using the M2HT + IKSVM detector on UIUC cars dataset.
0 0.5 1 1.5 2 2.5 3 3.5 4 4.5 50
0.1
0.2
0.3
0.4
0.5
0.6
0.7
0.8
0.9
1
false positive per image
reca
ll
INRIA Horses (Hough Detector)
uniform
naive−bayes
C=1.00
C=5.00
C=10.00
C=50.00
0 0.1 0.2 0.3 0.4 0.5 0.6 0.7 0.8 0.9 10
0.1
0.2
0.3
0.4
0.5
0.6
0.7
0.8
0.9
1
false positive per image
recall
INRIA Horses (Overall Detector)
IKSVM
M2HT + IKSVM
KAS
TPS−RPM
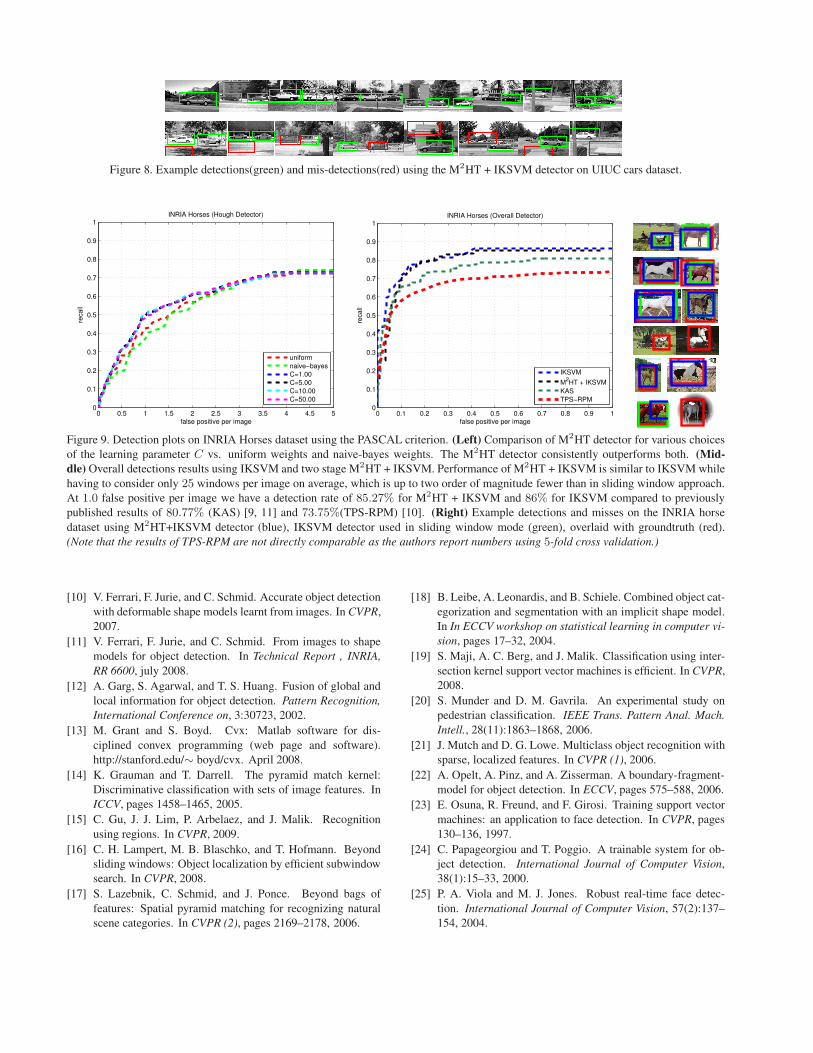
Figure 9. Detection plots on INRIA Horses dataset using the PASCAL criterion. (Left) Comparison of M2HT detector for various choices
of the learning parameter C vs. uniform weights and naive-bayes weights. The M2HT detector consistently outperforms both. (Mid-
dle)Overall detections results using IKSVM and two stage M2HT + IKSVM. Performance of M2HT + IKSVM is similar to IKSVMwhile
having to consider only 25 windows per image on average, which is up to two order of magnitude fewer than in sliding window approach.At 1.0 false positive per image we have a detection rate of 85.27% for M2HT + IKSVM and 86% for IKSVM compared to previouslypublished results of 80.77% (KAS) [9, 11] and 73.75%(TPS-RPM) [10]. (Right) Example detections and misses on the INRIA horsedataset using M2HT+IKSVM detector (blue), IKSVM detector used in sliding window mode (green), overlaid with groundtruth (red).
(Note that the results of TPS-RPM are not directly comparable as the authors report numbers using 5-fold cross validation.)
[10] V. Ferrari, F. Jurie, and C. Schmid. Accurate object detection
with deformable shape models learnt from images. In CVPR,
2007.
[11] V. Ferrari, F. Jurie, and C. Schmid. From images to shape
models for object detection. In Technical Report , INRIA,
RR 6600, july 2008.
[12] A. Garg, S. Agarwal, and T. S. Huang. Fusion of global and
local information for object detection. Pattern Recognition,
International Conference on, 3:30723, 2002.
[13] M. Grant and S. Boyd. Cvx: Matlab software for dis-
ciplined convex programming (web page and software).
http://stanford.edu/∼ boyd/cvx. April 2008.
[14] K. Grauman and T. Darrell. The pyramid match kernel:
Discriminative classification with sets of image features. In
ICCV, pages 1458–1465, 2005.
[15] C. Gu, J. J. Lim, P. Arbelaez, and J. Malik. Recognition
using regions. In CVPR, 2009.
[16] C. H. Lampert, M. B. Blaschko, and T. Hofmann. Beyond
sliding windows: Object localization by efficient subwindow
search. In CVPR, 2008.
[17] S. Lazebnik, C. Schmid, and J. Ponce. Beyond bags of
features: Spatial pyramid matching for recognizing natural
scene categories. In CVPR (2), pages 2169–2178, 2006.
[18] B. Leibe, A. Leonardis, and B. Schiele. Combined object cat-
egorization and segmentation with an implicit shape model.
In In ECCV workshop on statistical learning in computer vi-
sion, pages 17–32, 2004.
[19] S. Maji, A. C. Berg, and J. Malik. Classification using inter-
section kernel support vector machines is efficient. In CVPR,
2008.
[20] S. Munder and D. M. Gavrila. An experimental study on


![Locating An IRIS From Image Using Canny And Hough Transform · 2017-11-15 · Hough transform" after the related 1962 patent of Paul Hough.‖[5] In Hough Transform, input image is](https://static.documents.pub/doc/80x56/5ebebfab13dd9e6bb364610f/locating-an-iris-from-image-using-canny-and-hough-transform-2017-11-15-hough-transform.jpg)


![Deep Hough-Transform Line Priors · 1 day ago · Deep Hough-Transform Line Priors 3 more robust to noise. An extension of Hough transform with edge orientation is used in [13]. Though](https://static.documents.pub/doc/80x56/5f51542de5f918157102bd93/deep-hough-transform-line-priors-1-day-ago-deep-hough-transform-line-priors-3.jpg)
