Page 1
Page 1 of 22
Objective dysphonia quantification in vocal fold
paralysis: comparing nonlinear with classical measures
Max A. Little, Systems Analysis, Modeling and Prediction Group, University of Oxford, UK
Declan A.E. Costello, Specialist Registrar in ENT Surgery, Oxford Deanery, UK
Meredydd L. Harries, Consultant ENT Surgeon and Laryngologist, Royal Sussex County Hospital,
Brighton, UK
Key words: nonlinear analysis; random analysis; voice analysis; vocal fold paralysis; jitter;
shimmer; noise-to-harmonics ratio
Abstract
Clinical acoustic voice recording analysis is usually performed using classical perturbation measures
including jitter, shimmer and noise-to-harmonic ratios. However, restrictive mathematical
limitations of these measures prevent analysis for severely dysphonic voices. Previous studies of
alternative nonlinear random measures addressed wide varieties of vocal pathologies. Here, we
analyze a single vocal pathology cohort, testing the performance of these alternative measures
alongside classical measures.
We present voice analysis pre- and post-operatively in 17 unilateral vocal fold paralysis (UVFP)
patients and 11 healthy controls, patients undergoing standard medialisation thyroplasty surgery,
using jitter, shimmer and noise-to-harmonic ratio (NHR), and nonlinear recurrence period density
entropy (RPDE), detrended fluctuation analysis (DFA) and correlation dimension. Systematizing
the preparative editing of the recordings, we found that the novel measures were more stable and
hence reliable, than the classical measures, on healthy controls.
RPDE and jitter are sensitive to improvements pre- to post-operation. Shimmer, NHR and DFA
showed no significant change (p > 0.05). All measures detect statistically significant and clinically
important differences between controls and patients, both treated and untreated (p <
0.001, AUC > 0.7). Pre- to post-operation, GRBAS ratings show statistically significant and clinically
important improvement in overall dysphonia grade (G) (AUC = 0.946, p < 0.001).
Re-calculating AUCs from other study data, we compare these results in terms of clinical
importance. We conclude that, when preparative editing is systematized, nonlinear random
measures may be useful UVFP treatment effectiveness monitoring tools, and there may be
applications for other forms of dysphonia.
Introduction
Unilateral vocal fold paralysis (UVFP) is a voice disorder that typical results in breathy, hoarse or
rough voice and the general inability to produce clear phonation. The weakness of one side of the
larynx prevents proper adduction of both folds necessary to sustain vibration. The condition is
often disabling and distressing and can affect quality of life. Surgical intervention in the form of
medialisation is however often effective at restoring good vocal function.
Page 2
Page 2 of 22
Prior to and after any intervention, assessment of patients in the voice clinic should cover several
areas: the vocal tract should be examined videostroboscopically; the patient should self-rate their
voice (using, for example, the Voice Handicap Index) [1]; and the clinician should make an
assessment of the patient’s voice, using a rating tool such as the (perceptual) GRBAS scale [2]. A
summary of the recommended tools for assessment is presented in the European Laryngological
Society guidelines [3]. Although use of the GRBAS scale is recommended, objective measures of
acoustic voice recordings made in the clinic are also important, not only to quantify the degree of
dysphonia, but to monitor the patient’s response to treatment. This paper addresses the broad
question of the suitability of measures for characterizing UVFP objectively.
To obtain objective measures, a digital acoustic recording of the voice is analyzed using
mathematical algorithms, resulting in a set of numbers, each number characterizing a specific
aspect of the voice [4]. Such measures are valuable because, under controlled clinical conditions
and all other things being equal, an objective measure depends only upon the voice recording and
the details of the algorithm, and bypasses the many subjective aspects of perception and
interpretation of the individual clinician inherent to providing a GRBAS score [5]. Hence, objective
measures can provide an additional level of consistency in the quantification and monitoring of
dysphonia.
There are a large number of algorithms for the objective analysis of voice, but perhaps the most
dominant in clinical practice are the classical jitter, shimmer and noise-to-harmonic ratios (NHR)
(perturbation) measures [4, 6], and their many variants, based on mathematical signal analysis
techniques. Signal analysis itself being of utility across many scientific disciplines, there are many
broad mathematical signal analysis frameworks. Two frameworks have traditionally formed the
basis of the objective voice measures mentioned above: the classical concepts of waveform-based
cycle analysis [4, 7], and linear digital signal processing [8]. However, all frameworks make certain
mathematical assumptions about the signal that may not hold in reality [7], so that objective
algorithms will have practical limitations stemming partly from the specific assumptions of their
underlying frameworks.
From a biophysical standpoint, the celebrated source-filter model of voice production isolates the
vocal folds and the vocal tract as separate components, with the folds driving the tract (modeled
as a linear system) into resonance at specific formant frequencies [9]. The natural pairing of the
linear source-filter model with the linear signal processing framework is of great utility in a wide
variety of applications [9-11], including objective clinical voice analysis [4, 7]. However, at least
three decades ago, it was realized that nonlinearity in biophysical models was required to account
for the observed motion of the vocal folds [12-15], and that the idealized separation of folds and
tract into separate components misrepresents observed nonlinear feedback interactions between
the two [10, 13]. Subsequent biophysical modeling [16-20], and empirical voice signal analysis
studies [21-26], discovered a wealth of characteristically nonlinear phenomena produced by the
vocal system.
Furthermore, the voice involves turbulent airflow in the vocal organs, turbulence that is critical to
the production of consonants and aeroacoustic noise (breath noise) which is a pervasive feature of
voice production [13, 27-29]. Thus there is compelling evidence for nonlinearity and randomness
as inherent features of voice production, both in models and signals.
Page 3
Page 3 of 22
By definition, nonlinear phenomena are not naturally suited to linear signal processing analysis [13].
Nonlinear waveforms are also characteristically non-repetitive and complex [30]. Thus, neither are
they suited to cycle analysis, which assumes that the signal is nearly periodic (showing a nearly
repetitive waveform [7]). This mismatch between mathematical signal analysis framework and
signal characteristics is of particular relevance to clinical practice because it is precisely the mild to
severe dysphonic pathological voices, such as in UVFP, that show highly nonlinear and random
phenomena [13, 25] – healthy voice signals are often nearly periodic and hence more suited to
perturbation measures based on cycle analysis.
These limitations of cycle and linear analysis frameworks for pathological voices have motivated
the framework of nonlinear time series analysis [31] for objective voice measurement [13, 14, 17,
25, 32-37], more recently extended to encompass random motion as well [13, 14, 38-40]. This
new framework of nonlinear, random systems analysis is well suited to analyzing the full range of
nonlinear and noisy phenomena observed in pathological voices [13, 14], where the signals range
from strictly periodic (repetitive) to highly aperiodic (non-periodic) and random. This is important
in practice because when the assumptions of cycle or linear analysis no longer hold, as will be the
case for highly breathy, rough or otherwise dysphonic voices, an objective measure based on this
framework can fail to return a number, or, which is often worse, return a spurious number which,
rather than reflecting the severity of the dysphonia, responds to some unanticipated interaction
between the specifics of the analysis algorithm and the peculiarities of the signal [13, 41].
Novel objective measures based on the nonlinear random framework, such as recurrence period
density entropy (RPDE) and detrended fluctuation analysis (DFA), have recently been devised whose
output is rigorously characterized for all signals; from the strictly periodic, through nearly periodic,
to highly aperiodic and purely random signals, on a fixed numerical scale with finite lower and
upper limits [14]. In theory then, such measures are valuable to clinical practice because of their
wide applicability to all voice signals, not just those that are nearly periodic and hence amenable to
perturbation analysis.
In non-technical terms, DFA characterizes the changing detail of aeroacoustic breath noise in the
voice. It is therefore sensitive to similar features in the voice as noise-to-harmonic ratio. By
contrast, RPDE rigorously quantifies any ambiguity in fundamental pitch that might exist, and this is
useful because an increasing level of ambiguity is often indicative of vocal dysfunction. For nearly
periodic voices, RPDE and jitter measure similar properties of the signal. Correlation dimension
can be thought of as a measure of the overall complexity of a voice signal – periodic signals display
a single, simple oscillating pattern, and will therefore have low dimension. As the voice becomes
more dysphonic and hence aperiodic, the patterns of oscillation become harder to predict, and the
dimension increases.
Given the potential of such novel measures, previous studies [14, 42] have examined their
performance on a very wide variety of vocal pathologies alongside classical perturbation measures.
The aim has been to test the relative effectiveness of these novel measures at discriminating
pathological voices from healthy controls, compared to classical measures. This has demonstrated
that the novel measures are at least as, and often more, effective, than classical measures at
discriminating healthy from general dysphonic voices [14, 40].
Page 4
Page 4 of 22
However, missing in the literature is an analysis of the relative reliability of such measures: for
healthy voices, by how much do they vary, by comparison to classical measures? That is, how
relatively consistent are they when applied to controlled, signals from healthy voices? Next is the
question of relative sensitivity: can these novel measures detect changes in dysphonia, pre- and
post-operatively for UVFP, and in this respect, are they more or less sensitive than classical
measures? Finally, do these measures conform in any way to perceptual rating scales? Obtaining
answers to these questions is a necessary precondition for clinical usefulness in UVFP.
Previous studies have demonstrated a statistically significant change in nonlinear measures applied
to healthy controls and untreated UVFP patients [33], demonstrating that nonlinear measures hold
some promise. Furthermore, recent studies suggest that nonlinear measures correlate well with
perceptual evaluation by experienced listeners [37] for a broad range of voice disorders.
Nonetheless, the main questions above remain unanswered.
Hence, we compare pre- and post-operative patients against healthy controls, using the same
nonlinear measure, two novel nonlinear random measures, and the same classical perturbation
measures as in Zhang et al. [33]. We test the relative reliability of these measures on the healthy
controls. We pay careful attention to controlling for confounding factors such as inhomogeneity of
patient selection, pathological process and treatment regime, focusing on an accepted,
standardized surgical intervention applied uniformly across the whole group. We also avoid the
potentially confounding effect of selective digital audio editing that can occur when preparing the
recordings for objective analysis. Finally, blinded GRBAS ratings from three different clinical raters
were obtained pre- and post-operatively to compare against the objective results.
Our study therefore has several aims:
1 To assess the reproducibility of classical (jitter, shimmer) and nonlinear (RPDE (H),
correlation dimension and DFA (α)) methods in analyzing the voices of normal subjects;
2 To compare classical and nonlinear methods in analyzing the voices of UVFP subjects,
pre- and post-operatively;
3 To establish whether any changes in the classical and nonlinear analyses are matched by
changes in perceptual ratings (GRBAS);
4 To compare our results with the existing literature.
To our knowledge, this is the first direct assessment of the relative performance of a range of
novel nonlinear techniques alongside classical perturbation measures, comparing pre- and post-
operative UVFP voices.
Methods
Demographics and recording protocol
We recorded the voices of 17 patients (9 male and 8 female) with UVFP. Acoustic recordings
were made using the Laryngograph system (www.laryngograph.com, London, UK), under
standardized conditions, in the same quiet room. A microphone (Knowles EK-3132,
omnidirectional electret condenser type) was placed 16.5cm from the patient’s mouth and
Page 5
Page 5 of 22
recordings were taken (22.05kHz, 16 bits). We also recorded 11 healthy male and female controls
under similar quiet conditions.
All subjects were recorded sustaining the vowel /a/ at a loudness and pitch that was comfortable
to them and was at approximately conversational level. We obtained 166 recordings of separate
vowel phonations: an average of nearly six phonations per subject. All UVFP patients were
recorded dictating the standard running speech test “The North Wind and the Sun” for the
purposes of GRBAS scoring alone.
Surgical intervention
Each UVFP patient underwent a standard operative procedure: Isshiki type 1 (medialization)
thyroplasty [43]. A standard sedative (a propofol, remifentanil and alfentanil infusion) was
administered and the procedure was performed under local anesthesia. A transverse skin incision
was made at the level of the crico-thyroid membrane and the strap muscles were retracted
laterally. The thyroid lamina was exposed. A window was cut (or drilled, in the case of calcified
cartilages) and the internal periosteum was elevated. Through the window in the thyroid cartilage,
a silastic shim was inserted to medialise the paralyzed vocal fold. Prior to insertion, the shim was
cut to an appropriate size for the individual patient, depending on the size of the of glottic gap
seen on laryngoscopy. With the shim in situ, the sedation was reduced until the patient was lightly
sedated and able to phonate. The patient was then asked to perform some vocal tasks and if the
voice was deemed to be too breathy, a larger shim was cut and inserted. The skin was closed in
layers with no drain. All cases were performed by the same surgeon (MH) and patients were
discharged home within four hours of surgery.
Post-operative recording
Following a period of recuperation and acclimatization, the UVFP patients’ voices sustaining the
vowel /a/ and dictating the running speech test were re-recorded several months after surgery
under the same acoustic conditions.
Preparation of recordings – systematic trimming
At the onset of a vocal gesture, the voice may take a fraction of a second to stabilize. In order to
circumvent any confounding effect of spurious instability in phonation at the very start and end of
phonations, 0.12 seconds of the signal at the start and end of phonations was removed from every
recording. Figure 1 illustrates this “trimming” process. This 0.12 second trimming was applied
systematically across all phonations from both healthy and UVFP subjects.
GRBAS rating
Three experienced speech and language therapists (blinded as to whether the patients were pre-
or post-operative), independently rated each of the pre- and post-operative voice recordings
(both sustained vowels and running speech tests - “The North Wind and the Sun” passage) using
the GRBAS scale. Overall grade (G), roughness (R), breathiness (B), asthenia (A) and strain (S)
were each evaluated and assigned a value of 0, 1, 2 or 3 (where 0 corresponds to “none” and 3 to
“severe”).
Objective measures
Sustained phonations from all subjects were analyzed using objective measures, pre- and post-
operatively for UVFP patients. Six measures: (1) Jitter (ABS), (2) Shimmer (dB), (3) NHR, (4)
Page 6
Page 6 of 22
RPDE, (5) DFA and (6) correlation dimension were calculated for each sustained vowel recording.
The first three perturbation measures were calculated using the Praat software system [44].
Perturbation methods: Jitter, shimmer and NHR
Praat’s perturbation measures are based on estimating cycle lengths using the waveform-matching
algorithm, searching for the best match between successive cycles, occurring at a cross-correlation
maximum. Hence the measures are based on a combination of the two frameworks of cycle
analysis (assuming that the signal is composed of successive similar cycles), and classical linear
signal processing (for estimating the extent of the match between putative cycles). The Jitter (ABS)
algorithm is the average absolute difference between consecutive cycle lengths, in seconds. For
reference purposes, this coincides with the Kay Pentax Multi-Dimensional Voice Program “Jita”
parameter [45], where 83.200μs is given as the lower limit for pathological voice. The Shimmer
(dB) parameter is 20 times the average absolute (base 10) logarithm of the difference between the
amplitudes of successive cycles, in decibels (dB). This coincides with MDVP parameter “ShdB”
where 0.350dB is suggested as the lower limit for pathology. The NHR algorithm is calculated as
the average inverse harmonics-to-noise ratio (HNR) over each cycle. The (windowed)
autocorrelation is calculated and the time lag at which the autocorrelation achieves a global
maximum is found. The HNR for each cycle is 10 times the logarithm of the ratio of the maximum
autocorrelation, to one minus this maximum autocorrelation value [46]. For further details, see
Boersma et al. [46].
Nonlinear analysis methods: RPDE (H), DFA (α), and correlation dimension
The RPDE and correlation dimension measures are based on the framework of nonlinear time
series analysis, which assumes that the signal is generated by a model of the physical processes of
voice production itself (expressed as a set of nonlinear differential equations optionally driven by a
random input). They admit a larger class of signals than the cycle or linear frameworks, but include
signals that conform to both of these frameworks as special cases. An attempt is made to infer
properties about a nonlinear (and optionally random) model for the physical processes that
generated the voice signal by constructing a time-delay embedding (that is, a set of vectors
constructed from time-lagged copies of the signal). Four time lagged copies were used at a time lag
of 0.002 seconds, these embedding parameters estimated using a brute-force search procedure to
satisfy known special cases [14].
From the lagged vectors, RPDE estimates the relative uncertainty in the expected recurrence
periods of the embedded signal, that is, the time intervals between successive close returns to the
same point in the space spanned by the lagged vectors. It can be shown that this generalizes the
notion of cycle length for cyclic signals, and period for exactly periodic signals [14]. Thus both cyclic
and periodic signals are special cases of recurrent signals. RPDE then constructs a distribution of all
recurrence times. Exactly periodic signals have only one recurrence period, hence the relative
entropy (uncertainty with respect to uniformly random recurrence times, denoted Hnorm) of the
distribution will be zero, indicating no uncertainty about the recurrence period (cycle length/exact
period) of the signal. Nearly periodic signals will show some spread of recurrence periods – the
uncertainty will be slightly larger. Aperiodic signals, will show a typically large spread of recurrence
periods and hence have a still larger Hnorm. At the most extreme, a completely random signal
Page 7
Page 7 of 22
shows recurrence periods of all lengths, with larger periods being more rare than smaller periods,
and Hnorm is then at most unity.
Of fundamental interest in the nonlinear time series analysis framework are chaotic signals that are
often characteristically aperiodic [30]. In the lagged vector space, many of these chaotic signals
have fractal dimension (that is, for example, they occupy less space than a 3D object, but more
space than a flat, 2D object). Evidence points to many examples of aperiodic voice signals that
appear chaotic [17-19, 24, 25]. Thus, measuring the dimension of the signal in the lagged space
might usefully characterize voice disorders, assuming that healthy voices will be very close to
periodic and hence have low dimension, and that dysphonic signals will have a much higher
dimension. The correlation dimension measure is one approach to estimating this lagged space
dimension D; here we use the correlation dimension algorithm proposed by Judd et al. [47].
Turbulence is typically characterized by persistent random fluctuations on all time and spatial
scales – a commonly held theory proposes that the logarithm of the magnitude of these
fluctuations scales linearly with the logarithm of the temporal scale [48]. This is a defining property
of random fractals signals, and many dysphonic voice signals show this kind of behaviour on small
time scales. Measuring the acoustic manifestation of this turbulence contributes to the detection of
dysphonia [13, 14, 40]. DFA attempts to measure this scaling factor α in the fine scale detail of the
noise in the voice signal. Here the scale factor is normalized by a nonlinear transformation to lie in
the range zero to unity (the normalized scale factor is denoted αnorm).
Relative reliability of objective measures
Addressing the question of comparative reliability of the objective measures, the (fractional)
variability of each measure applied to the healthy sustained phonations was calculated. The
variability was estimated nonparametrically as the interquartile range (the difference between the
75th and 25th percentile) divided by the median of all healthy phonations. In order to test the
effect of altering the systematic trimming during the preparation of the recordings described
above, the variability for each measure was calculated as the trimming length was varied from 0.04
to 0.28 seconds in 0.04 second steps.
Results
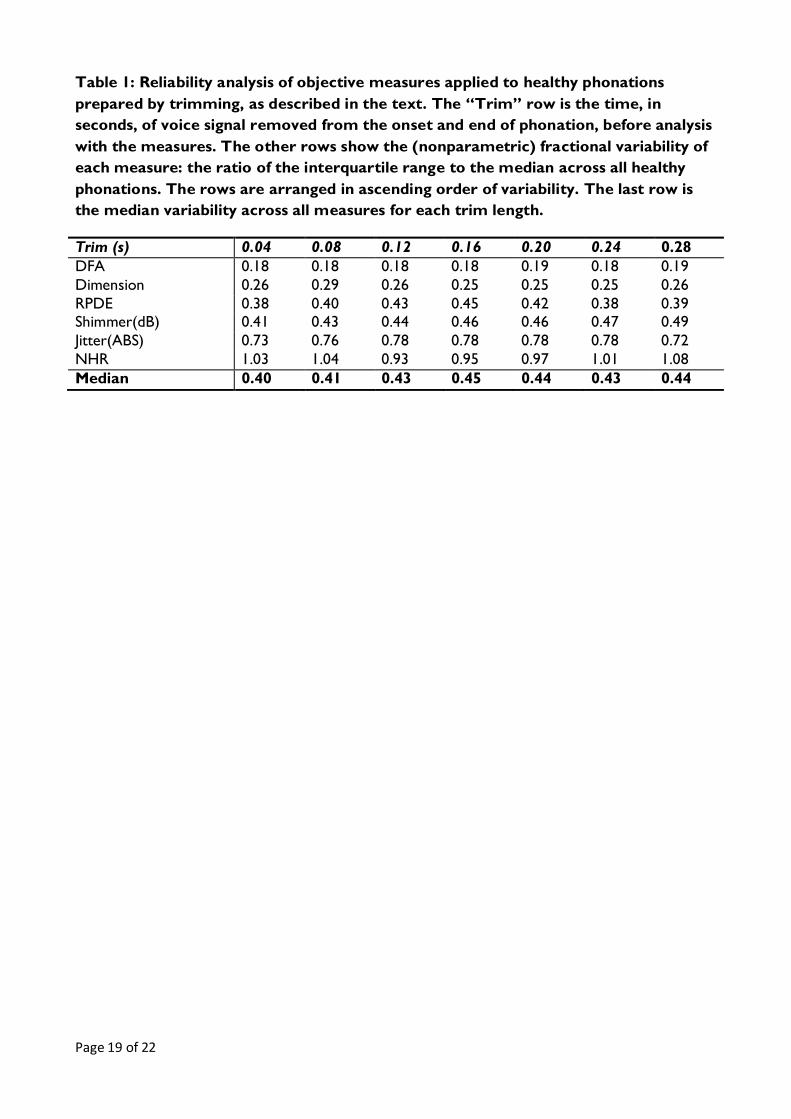
Table 1 shows the reliability analysis results, assessed using the fractional variability of each
objective measure applied to all the healthy phonations. The DFA measure shows the smallest
variability, and NHR the largest variability across all healthy subjects. The median variability across
all measures is somewhat sensitive to the systematic trimming time used in the preparation of the
recordings.
Next, Figure 2 shows the perceptual GRBAS scoring results for the UVFP patients. The total,
breathiness, asthenia and grade GRBAS scores show clear separation pre- and post-operation. The
strain and roughness sub-categories do not show clear separation.
Figure 3 gives a graphical representation of the objective measures applied to both healthy and
UVFP subjects (both pre- and post-operatively). It can be seen that the RPDE measure shows
visibly clear changes from untreated (solid black line) to treated (broken black line) recordings,
mirroring the GRBAS results. The RPDE curve shows a clear shift to the left. An obvious shift
Page 8
Page 8 of 22
from pathological towards healthy is seen in both RPDE, dimension, DFA and shimmer results. For
jitter and NHR, by contrast, the shift before and after treatment is not so clear. The DFA and
NHR measures show no clear, visible change between untreated and treated patients.
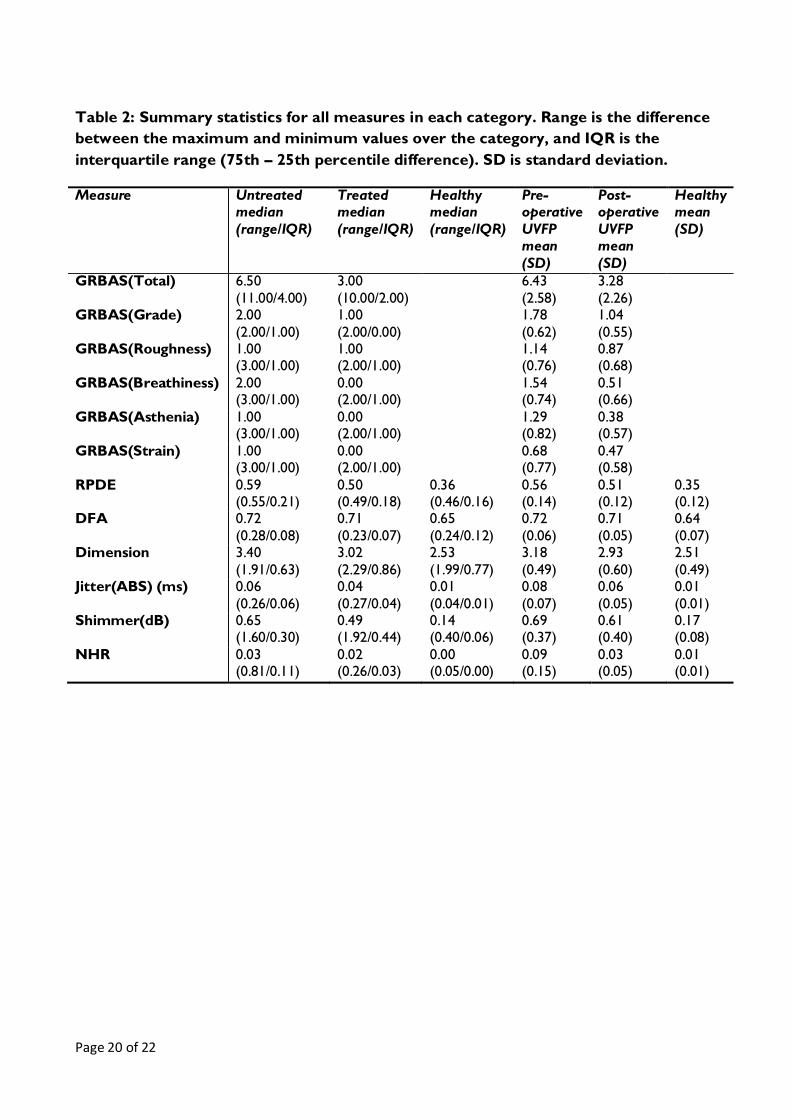
Table 2 lists summary statistics for the measures. Both median and mean of all measures show
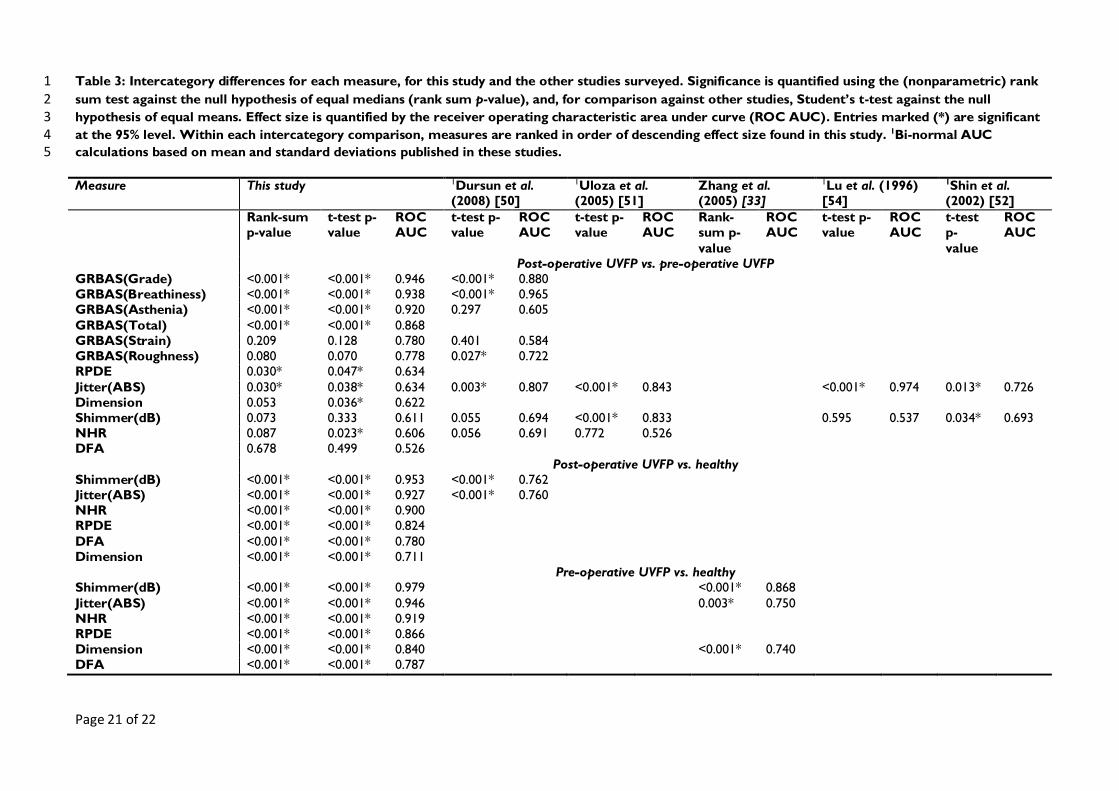
differences pre- and post-operation, and Table 3 details the corresponding numerical results of the
statistical analysis. Due to the heavy non-normality of the data, statistical significance and effect
sizes are assessed non-parametrically, significance using the rank-sum test, and effect size using the
receiver operating characteristic area under curve (ROC AUC), which is a measure of the overlap
between categories, in that an AUC value of unity indicates that it is possible to perfect separability
between categories, and an AUC of 0.5 indicates that we can do no better than uniformly random
classification [49].
The graphical findings above are confirmed in that GRBAS total (p < 0.001), breathiness (p <
0.001), asthenia (p < 0.001), grade (p < 0.001), RPDE (p = 0.03), and jitter (p = 0.03) all show a
statistically significant change (95% significance level) pre- and post-operatively (treated versus
untreated rows in the table). The largest effect size (AUC) corresponds to the most clinically
important change and this is achieved by the GRBAS grade score (AUC = 0.946). Of the objective
measures, only RPDE and jitter show a significant change and are of equal importance (AUC =
0.634). All objective measures show a significant and clinically important difference when detecting
normal versus UVFP, either treated or untreated.
Discussion
The first question posed in the introduction asked about the relative reliability of the objective
measures applied to healthy controls. The results shown in Table 1 are interesting because they
demonstrate that the novel nonlinear (random) measures show considerably less variability as a
fraction of their median values than the classical perturbation measures tested here. In fact, the
least variable of these novel measures (DFA) shows almost 1/6th the variability of NHR. This may
not be of particular consequence here because DFA could not detect the pre- to post-operative
improvement, but perhaps more importantly the only perturbation measure significantly able to
detect a pre- to post-operative change in UVFP (jitter), is nearly three times as variable as the
correlation dimension measure.
The next question posed is one of relative sensitivity to the voice changes evidenced by GRBAS
scoring in these UVFP patients post intervention. Figure 3 and Table 3 clearly demonstrate that
although it is not possible to achieve the same level of clear discrimination as perceptual scoring,
of all the objective measures, the novel RPDE and jitter measures are the most indicative.
The final question asks how the objective measures relate to the perceptual scores. Here, we can
see that the RPDE and jitter measures best reflect the large change detected pre- and post-
operatively, discriminating between categories with about 2/3 the separability of the GRBAS grade
score.
We now investigate how these results sit with other studies. Several general comments about
comparisons across studies must be made first. Our first observation, highlighted by our reliability
results, is that perturbation methods are subject to inherently large variability, even for controlled,
Page 9
Page 9 of 22
healthy voices. For example, a recent study showed poor test-retest reliability (that is, the
consistency of the measure without intervention) [41]. Thus, several repetitions of the sustained
phonation are required to minimize sampling variability even in the absence of pathology. Here we
take, on average, six phonations per subject, and include all phonations in the overall statistical
analysis. Other studies do not do this [50], or take the mean measure over three phonations [51],
or take a single phonation with the lowest jitter measure [52].
Similarly, although “jitter” and “shimmer” appear to name one algorithm, this disguises a plethora
of different algorithms, across many different software vendors [41]. Seemingly trivial differences
in cycle length measurement can give very different measures [7]. Many studies give no algorithm
details.
Furthermore, untreated UVFP voices can be so dysphonic that the cycle and/or linear signal
processing mathematical framework becomes inapplicable, and no perturbation analysis is possible
[6, 33, 41]. In this study, for example, one of the pre-operative voice recordings was very severely
dysphonic, and shimmer measurements were not possible at all. Thus, it is difficult to get
statistically powerful results, particularly for the pre-operative category. Often, this forces hand
editing of segments of the voice recording (described in, for example, Uloza et al. [51]) so that
perturbation analysis becomes possible. However, this practice is inherently subjective and thus
may introduce subtle and unintended selection biases. Hand editing methodology also differs
considerably, some studies analyzing a “middle” section and discarding undefined starts and ends
[51, 52], or selecting “the most stable 0.5 seconds” [52], without further methodological
clarification. Our reliability results suggest that a systematic, algorithmic approach to editing the
voice signal for objective analysis is necessary, because the variability of measures depends on
which parts of the recording are included for analysis.
Finally, comparing studies on the results of statistical significance tests alone is of limited usefulness
in practice, because a small but uninteresting effect can reach a high level of significance with large
sample size, conversely, a clinically important effect can be statistically insignificant due solely to a
small number of subjects [53]. We survey some representative studies, and re-analyze reported
data to make direct comparisons with our results, by calculating significances and AUC values from
reported category means and standard deviations [49], assuming their data is normal.
Previous work using nonlinear measures has tended to focus on a broad range of pathologies and
few studies have examined changes following therapy. However, Zhang et al. [34] investigated a
cohort of patients with vocal fold polyps. In that study, jitter, shimmer and two nonlinear
measures (correlation dimension and second-order entropy) were undertaken before and after
surgery. The nonlinear measures showed significant decrease after surgery. Shimmer showed no
significant change after surgery, but jitter did. These aspects of the study agree with our results.
Unfortunately, direct comparisons of effect size are not possible because full summary statistics for
the data are not disclosed.
A further study [33] tested the performance of correlation dimension against jitter and shimmer
on voices of patients with UVFP and healthy controls. Jitter and shimmer were calculated only for
that subset of voices that were nearly periodic, and correlation dimension was calculated for all
the voices in the study. All three measures showed a statistically significant difference between
healthy controls and UVFP, shimmer showing the largest AUC, jitter and correlation dimension
Page 10
Page 10 of 22
showing a lower (but similar) effect. Our study confirms these findings (see last rows in Table 1)
from the view of significance alone, but we find much larger AUC values. We note that in that
study, jitter and shimmer could not be applied to the very dysphonic voices.
Across studies, jitter is found to have a significant change pre- to post-surgery [50-52, 54], ranging
in effect size from AUC = 0.634 to 0.974, variability that is consistent with Zhang et al. [42]. Our
jitter effect is on the low side. By contrast, studies disagree about the significance of shimmer, and
we find no significant effect. All studies agree that NHR shows no statistical change after
thyroplasty.
Most of these studies assume that the normal distribution is a good model for the data. The high
variability and low consistency of perturbation measures discussed above often generates large
outliers. Coupled with the fact that our data is highly non-normal, this raises doubts about the
validity of such non-robust statistical methods. No normality tests results or plots of the data are
provided in these studies. As an illustration of the sort of variability that can occur, we calculated
normal Student’s t-test significances and compared them to our rank-sum results: normal
assumptions then admit both dimension and NHR as being significant, even though their AUC’s are
too small to be interesting.
Previous studies have shown that both RPDE and DFA are useful in separating healthy from
dysphonic voices of many causes [13, 14]. However, DFA did not show a significant change pre-
and post-operatively in UVFP, although, as with all the other measures, it did detect a change
between healthy and dysphonic voices. This contributes an additional layer of detail to other
studies which found broad differences in DFA between healthy and pathological voices.
One of the strengths of the present study is in the homogeneity of the patients: all had a defined
pathology that was managed with a uniform and repeatable operation. This study therefore avoids
many of the confounding factors seen in studies of other vocal pathologies. To our knowledge, this
is the first direct assessment of the relative performance of a range of novel nonlinear techniques
alongside classical perturbation measures, comparing pre- and post-operative UVFP voices.
Nonlinear objective measures have additional benefits for many clinical applications. Most
importantly, the nonlinear framework does not rely on near periodicity of the acoustic signal, and
is, consequently, applicable to the full range of periodic to highly aperiodic voices typically
encountered in clinical practice. Furthermore, measures such as RPDE and DFA produce outputs
constrained to lie on a fixed zero-one numerical scale, and this is useful for clinical communication
of the severity of dysphonic symptoms.
We now provide some notes on interpretation of these novel nonlinear (random) measures.
Classical perturbation methods based on cycle analysis might best be described as morphological
methods: that is, they are designed to find and characterize specific kinds of sequences of waveform
shapes in a signal (when considered as a graph of acoustic pressure against time). Although these
sequences of waveforms are observed in most voice signals, there is no theoretical basis that
affords confidence that the vocal system will not produce waveforms falling outside these narrowly
defined sequences. Thus, cycle analysis methods require near periodicity, but many real voice
signals are far from near periodic, for well-motivated physiological reasons [13].
Page 11
Page 11 of 22
By contrast, nonlinear (random) methods assume that there is an underlying mechanistic or random
process that generated the recording, and attempt to reconstruct and characterize aspects of this
underlying process from the recorded signal. In particular, RPDE measures one aspect of the
recurrence of the underlying physical state of the vocal system: that is, qualitatively, the extent to
which it repeats the same sequence of configurations and momentum, without specifying in
advance the signal morphology of these constituent sequences. One typical example is
subharmonic vibration, which can naturally develop even in normal phonation. This has an
ambiguous interpretation within the linear framework, because often the subharmonic has nearly
the same amplitude in the power spectrum as the fundamental pitch. RPDE will typically detect
both fundamental and subharmonic, but, RPDE will show an increased uncertainty value Hnorm
relative to phonation without subharmonics. Thus, in this situation, RPDE rigorously quantifies the
genuine ambiguity in fundamental pitch, and this ambiguity is often indicative of vocal dysfunct ion.
DFA characterizes the changing detail of aeroacoustic breath noise in the voice. Although there
are a very large number of classical noise measures, these are usually based on spectral analysis
using linear signal processing. Aperiodic dysphonia typical of chaotic vibration is inseparable from
aspiration noise in spectral analysis [13], even though the chaotic signal can be entirely smooth in
the time domain. DFA is sensitive to the temporal details of the signal alone, whether or not the
slow vibrational motion in the vocal system is aperiodic, nearly periodic or strictly periodic [13].
Excessive aeroacoustic noise is a common feature of many dysphonias, the underlying physical
origin of this being turbulent airflow in the larynx and vocal tract [27-29], often enhanced by
incomplete vocal fold closure and aphonia in severe UVFP cases [41].
All mathematical frameworks have limitations, including the nonlinear (random) framework. Here
we remark that RPDE and correlation dimension will not be applicable to completely silent signals,
or more generally, those that show less than one full repetition. In addition correlation dimension
requires sufficiently noise-free recordings. Similarly, DFA requires that the signal has enough
bandwidth to detect any scaling properties in the fine scale detail. Nonetheless, these limitations
are far less restrictive than those that must apply for reliable classical perturbation analysis.
Conclusion
In this study, we compared classical objective acoustic measures for UVFP dysphonia based around
the cycle and linear signal processing mathematical frameworks, against novel measures based on
the framework of nonlinear (random) time series analysis. We tested the reliability of all these
measures on healthy controls, and found that the nonlinear methods were more stable and
reproducible than the classical measures. We then quantified the performance of these measures
in detecting improvements in dysphonia after surgical treatment for UVFP, in a cohort of patients
that showed perceptually-rated improvements according to standardized expert clinical judgment.
Our main finding is that, when potential systematic biases due to hand-editing of acoustic
recordings were circumvented, only one of the nonlinear measures and one of the perturbation
measures were able to provide a statistically significant detection of this change, although this was
dependent on the statistical assumptions. This measure has, however, comparable performance to
the only classical perturbation measure shown consistently able to detect the change. The main
contribution of this study is to provide further evidence that nonlinear objective measures are able
Page 12
Page 12 of 22
to perform at least as well as their classical counterparts, and that they change consistently with
perceptual voice analysis scales [37].
We believe these results motivate future research developing further applications for the
nonlinear analysis and additional comparisons with classical measures. It is possible that, with
widening experience of these newer measures they will be available alongside classical measures in
commercially available software packages, where they can provide more sophisticated, objective
tracking and monitoring of dysphonia in the treatment of voice disorders. We conclude with the
recommendation that nonlinear random acoustic objective measures should play an increasing role
in the assessment protocol in the voice clinic.
Acknowledgements
We are very grateful to Carol Harris, Caroline Fraser and Nikki Wright for their assistance with
the project.
Page 13
Page 13 of 22
References
1. Jacobson, B.H., et al., The Voice Handicap Index (VHI): Development and Validation. Am J
Speech Lang Pathol, 1997. 6(3): p. 66-70.
2. Hirano, M., Clinical examination of voice. Disorders of human communication. 1981, Wien ;
New York: Springer-Verlag. xi, 100 p.
3. Dejonckere, P.H., et al., A basic protocol for functional assessment of voice pathology, especially
for investigating the efficacy of (phonosurgical) treatments and evaluating new assessment
techniques. Guideline elaborated by the Committee on Phoniatrics of the European Laryngological
Society (ELS). Eur Arch Otorhinolaryngol, 2001. 258(2): p. 77-82.
4. Baken, R.J. and R.F. Orlikoff, Clinical measurement of speech and voice. 2nd ed. 2000, San
Diego: Singular Thomson Learning. xii, 610 p.
5. Hirano, M., et al., Acoustic analysis of pathological voice. Some results of clinical application. Acta
Otolaryngol, 1988. 105(5-6): p. 432-8.
6. Titze, I.R., Workshop on acoustic voice analysis: Summary statement. 1995.
7. Roark, R.M., Frequency and voice: Perspectives in the time domain. Journal of Voice, 2006.
20(3): p. 325-354.
8. Proakis, J.G. and D.G. Manolakis, Digital signal processing: principles, algorithms, and
applications. 3rd ed. 1996, Upper Saddle River, N.J.: Prentice Hall. 1 v. (various pagings).
9. Flanagan, J.L., Speech analysis; synthesis and perception. 2nd ed. 1972, Berlin, New York,:
Springer-Verlag. x, 444 p.
10. Quatieri, T.F., Discrete-Time Speech Signal Processing: Principles and Practice. Prentice-Hall
Signal Processing Series. 2002, Upper Saddle River, NJ: Prentice Hall. 781.
11. Cox, R.V., Speech coding standards, in Speech Coding and Synthesis, W. Kleijn and K. Paliwal,
Editors. 1995, Elsevier: Amsterdam; New York. p. 49-78.
12. Ishizaka, K. and J.L. Flanagan, Synthesis of Voiced Sounds From a Two-Mass Model of the Vocal
Cords. ATT Bell System Technical Journal, 1972. 51(6): p. 1233-1268.
13. Little, M.A., Biomechanically Informed Nonlinear Speech Signal Processing. 2007, University of
Oxford: Oxford.
14. Little, M.A., et al., Exploiting nonlinear recurrence and fractal scaling properties for voice disorder
detection. Biomed Eng Online, 2007. 6: p. 23.
15. Titze, I.R., Human Vocal Cords - Mathematical-Model .1. Phonetica, 1973. 28(3-4): p. 129-170.
16. Herzel, H., et al., Nonlinear dynamics of the voice - signal analysis and biomechanical modeling.
Chaos, 1995. 5(1): p. 30-34.
17. Jiang, J.J., Y. Zhang, and C. McGilligan, Chaos in voice, from modeling to measurement. J Voice,
2006. 20(1): p. 2-17.
18. Jiang, J.J., Y. Zhang, and J. Stern, Modeling of chaotic vibrations in symmetric vocal folds. Journal
of the Acoustical Society of America, 2001. 110(4): p. 2120-2128.
19. Jiang, J.J. and Y. Zhang, Chaotic vibration induced by turbulent noise in a two-mass model of vocal
folds. Journal of the Acoustical Society of America, 2002. 112(5): p. 2127-2133.
20. Steinecke, I. and H. Herzel, Bifurcations in an Asymmetric Vocal-Fold Model. Journal of the
Acoustical Society of America, 1995. 97(3): p. 1874-1884.
21. Tokuda, I., T. Miyano, and K. Aihara, Surrogate analysis for detecting nonlinear dynamics in
normal vowels. Journal of the Acoustical Society of America, 2001. 110(6): p. 3207-17.
22. Tokuda, I., R. Tokunaga, and K. Aihara, A simple geometrical structure underlying speech signals
of the {Japanese} vowel a. International Journal of Bifurcation and Chaos, 1996. 6(1): p. 149-
160.
23. Little, M.A., et al., Testing the assumptions of linear prediction analysis in normal vowels. J
Acoust Soc Am, 2006. 119(1): p. 549-58.
24. Titze, I., R. Baken, and H. Herzel, Evidence of chaos in vocal fold vibration, in Vocal Fold
Physiology: Frontiers in Basic Science. 1993.
Page 14
Page 14 of 22
25. Herzel, H., et al., Analysis of vocal disorders with methods from nonlinear dynamics. Journal of
Speech and Hearing Research, 1994. 37(5): p. 1008-1019.
26. Berry, D.A., et al., Interpretation of Biomechanical Simulations of Normal and Chaotic Vocal Fold
Oscillations with Empirical Eigenfunctions. Journal of the Acoustical Society of America, 1994.
95(6): p. 3595-3604.
27. Krane, M.H., Aeroacoustic production of low-frequency unvoiced speech sounds. Journal of the
Acoustical Society of America, 2005. 118(1): p. 410-427.
28. Sinder, D.J., Synthesis of unvoiced speech sounds using an aeroacoustic source model. 1999,
Rutgers University: New Jersey, USA.
29. Zhao, W., et al., Computational aeroacoustics of phonation, part I: Computational methods and
sound generation mechanisms. Journal of the Acoustical Society of America, 2002. 112(5 Pt
1): p. 2134-46.
30. Sprott, J.C., Chaos and time-series analysis. 2003, Oxford ; New York: Oxford University
Press. xx, 507 p.
31. Kantz, H. and T. Schreiber, Nonlinear time series analysis. 2nd ed. 2004, Cambridge; New
York: Cambridge University Press. xvi, 369 p.
32. Zhang, Y. and J.J. Jiang, Nonlinear dynamic analysis in signal typing of pathological human voices.
Electronics Letters, 2003. 39(13): p. 1021-1023.
33. Zhang, Y., et al., Perturbation and nonlinear dynamic analyses of voices from patients with
unilateral laryngeal paralysis. J Voice, 2005. 19(4): p. 519-28.
34. Zhang, Y., et al., Nonlinear dynamic analysis of voices before and after surgical excision of vocal
polyps. J Acoust Soc Am, 2004. 115(5 Pt 1): p. 2270-7.
35. Behrman, A. and R.J. Baken, Correlation dimension of electroglottographic data from healthy and
pathologic subjects. Journal of the Acoustical Society of America, 1997. 102(4): p. 2371-
2379.
36. Giovanni, A., M. Ouaknine, and J.L. Triglia, Determination of largest Lyapunov exponents of
vocal signal: Application to unilateral laryngeal paralysis. Journal of Voice, 1999. 13(3): p. 341-
354.
37. Yu, P., et al., Objective voice analysis in dysphonic patients: new data including nonlinear
measurements. Folia Phoniatr Logop, 2007. 59(1): p. 20-30.
38. Stark, J., et al., Takens embedding theorems for forced and stochastic systems. Nonlinear
Analysis-Theory Methods and Applications, 1997. 30(8): p. 5303-5314.
39. Jackson, P.J.B. and C.H. Shadle, Pitch-scaled estimation of simultaneous voiced and turbulence-
noise components in speech. IEEE Transactions on Speech and Audio Processing, 2001. 9(7):
p. 713-726.
40. Little, M., et al., Suitability of Dysphonia Measurements for Telemonitoring of Parkinson's Disease.
IEEE Transactions on Biomedical Engineering, 2008.
41. Carding, P.N., et al., The reliability and sensitivity to change of acoustic measures of voice quality.
Clin Otolaryngol Allied Sci, 2004. 29(5): p. 538-44.
42. Zhang, Y. and J.J. Jiang, Acoustic analyses of sustained and running voices from patients with
laryngeal pathologies. J Voice, 2008. 22(1): p. 1-9.
43. Isshiki, N., et al., Thyroplasty as a new phonosurgical technique. Acta Otolaryngol, 1974. 78(5-
6): p. 451-7.
44. Boersma, P. and D. Weenink, Praat: doing phonetics by computer. 2008.
45. KayPENTAX, Kay Elemetrics Disordered Voice Database, Model 4337. 1996-2005, Kay
Elemetrics, Lincoln Park, NJ, USA.
46. Boersma, P. Accurate short-term analysis of the fundamental frequency and the harmonics-to-
noise ratio of a sampled sound. in Proceedings of the Institute of Phonetic Sciences. 1993:
University of Amsterdam.
47. Judd, K., An improved estimator of dimension and some comments on providing confidence
intervals. Physica D: Nonlinear Phenomena, 1992. 56(2-3): p. 216-228.
Page 15
Page 15 of 22
48. Falconer, K.J., Fractal geometry: mathematical foundations and applications. 1990, Chichester;
New York: Wiley. xxii, 288 p.
49. Marzban, C., The ROC curve and the area under it as performance measures. Weather and
Forecasting, 2004. 19(6): p. 1106-1114.
50. Dursun, G., et al., Long-term results of different treatment modalities for glottic insufficiency.
American Journal of Otolaryngology, 2008. 29(1): p. 7-12.
51. Uloza, V., R. Pribuisiene, and V. Saferis, Multidimensional assessment of functional outcomes of
medialization thyroplasty. European Archives of Oto-Rhino-Laryngology, 2005. 262(8): p.
616-621.
52. Shin, J.E., et al., Analysis of voice and quantitative measurement of glottal gap after thyroplasty
type I in the treatment of unilateral vocal paralysis. Journal of Voice, 2002. 16(1): p. 136-142.
53. Gardner, M.J. and D.G. Altman, Confidence-Intervals Rather Than P-Values - Estimation Rather
Than Hypothesis-Testing. British Medical Journal, 1986. 292(6522): p. 746-750.
54. Lu, F.L., et al., Longitudinal evaluation of vocal function after thyroplasty type I in the treatment of
unilateral vocal paralysis. Laryngoscope, 1996. 106(5): p. 573-577.
Page 16
Page 16 of 22
Figure 1: Illustration of systematic trimming used to select useful parts of the
sustained phonations for subsequent analysis by objective measures. The dark shaded
areas indicate the portion removed at the start and end of the phonation, with
exactly equal lengths in seconds from the start and end. This removal was applied
uniformly across all phonations.
Page 17
Page 17 of 22
0 1 2 3 4 5 6 7 8 9 1011 12 1314 150
5
10
15
GRBAS(Total)
Count
(a)
0 1 2 30
10
20
30
40
GRBAS(Grade)
Count
(b)
0 1 2 30
10
20
30
GRBAS(Roughness)
Count
(c)
0 1 2 30
10
20
30
GRBAS(Breathiness)C
ount
(d)
0 1 2 30
10
20
30
40
GRBAS(Asthenia)
Count
(e)
0 1 2 30
10
20
30
GRBAS(Strain)
Count
(f)
Figure 2: Histograms of subjective GRBAS ratings for the UVFP phonations. Unfilled
white bars are pre-operative scores, filled black bars are post-operative. Horizontal
axes is the GRBAS score in each sub-category, vertical axis is the number of instances
of that score.
Page 18
Page 18 of 22
0.2 0.4 0.6 0.80
0.01
0.02
0.03
Hnorm
P(H
norm
)(a)
0.5 0.6 0.7 0.8 0.90
0.01
0.02
0.03
norm
P(
norm
)
(b)
1 2 3 40
0.02
0.04
D
P(D
)
(c)
0 1 2 3
x 10-4
0
0.02
0.04
0.06
Jitt
P(J
itt)
(d)
0 0.5 1 1.5 20
0.02
0.04
0.06
Shim
P(S
him
)
(e)
0 0.2 0.4 0.6 0.80
0.05
0.1
NHR
P(N
HR
)
(f)
Figure 3: Estimated probability of all measures (a) recurrence probability density
entropy (RPDE), (b) normalized detrended fluctuation (DFA), (c) correlation
dimension, (d) absolute jitter (seconds), (e) shimmer (dB) (f) noise-to-harmonics ratio
(NHR). See text for full algorithm descriptions. The probabilities for the three
separate groups normal voices (solid gray lines), pre-operative UVFP (solid black
lines) and post-operative UVFP (dashed black lines), are estimated using the kernel
density method with Gaussian kernel. The vertical axes are probabilities. The vertical
lines are the median values of the measures for each group.
Page 19
Page 19 of 22
Table 1: Reliability analysis of objective measures applied to healthy phonations
prepared by trimming, as described in the text. The “Trim” row is the time, in
seconds, of voice signal removed from the onset and end of phonation, before analysis
with the measures. The other rows show the (nonparametric) fractional variability of
each measure: the ratio of the interquartile range to the median across all healthy
phonations. The rows are arranged in ascending order of variability. The last row is
the median variability across all measures for each trim length.
Trim (s) 0.04 0.08 0.12 0.16 0.20 0.24 0.28
DFA 0.18 0.18 0.18 0.18 0.19 0.18 0.19
Dimension 0.26 0.29 0.26 0.25 0.25 0.25 0.26
RPDE 0.38 0.40 0.43 0.45 0.42 0.38 0.39
Shimmer(dB) 0.41 0.43 0.44 0.46 0.46 0.47 0.49
Jitter(ABS) 0.73 0.76 0.78 0.78 0.78 0.78 0.72
NHR 1.03 1.04 0.93 0.95 0.97 1.01 1.08
Median 0.40 0.41 0.43 0.45 0.44 0.43 0.44
Page 20
Page 20 of 22
Table 2: Summary statistics for all measures in each category. Range is the difference
between the maximum and minimum values over the category, and IQR is the
interquartile range (75th – 25th percentile difference). SD is standard deviation.
Measure Untreated median
(range/IQR)
Treated median
(range/IQR)
Healthy median
(range/IQR)
Pre-operative
UVFP mean
(SD)
Post-operative
UVFP mean
(SD)
Healthy mean
(SD)
GRBAS(Total) 6.50
(11.00/4.00)
3.00
(10.00/2.00)
6.43
(2.58)
3.28
(2.26)
GRBAS(Grade) 2.00
(2.00/1.00)
1.00
(2.00/0.00)
1.78
(0.62)
1.04
(0.55)
GRBAS(Roughness) 1.00 (3.00/1.00)
1.00 (2.00/1.00)
1.14 (0.76)
0.87 (0.68)
GRBAS(Breathiness) 2.00 (3.00/1.00)
0.00 (2.00/1.00)
1.54 (0.74)
0.51 (0.66)
GRBAS(Asthenia) 1.00 (3.00/1.00)
0.00 (2.00/1.00)
1.29 (0.82)
0.38 (0.57)
GRBAS(Strain) 1.00 (3.00/1.00)
0.00 (2.00/1.00)
0.68 (0.77)
0.47 (0.58)
RPDE 0.59 (0.55/0.21)
0.50 (0.49/0.18)
0.36 (0.46/0.16)
0.56 (0.14)
0.51 (0.12)
0.35 (0.12)
DFA 0.72
(0.28/0.08)
0.71
(0.23/0.07)
0.65
(0.24/0.12)
0.72
(0.06)
0.71
(0.05)
0.64
(0.07) Dimension 3.40
(1.91/0.63)
3.02
(2.29/0.86)
2.53
(1.99/0.77)
3.18
(0.49)
2.93
(0.60)
2.51
(0.49) Jitter(ABS) (ms) 0.06
(0.26/0.06)
0.04
(0.27/0.04)
0.01
(0.04/0.01)
0.08
(0.07)
0.06
(0.05)
0.01
(0.01) Shimmer(dB) 0.65
(1.60/0.30) 0.49 (1.92/0.44)
0.14 (0.40/0.06)
0.69 (0.37)
0.61 (0.40)
0.17 (0.08)
NHR 0.03 (0.81/0.11)
0.02 (0.26/0.03)
0.00 (0.05/0.00)
0.09 (0.15)
0.03 (0.05)
0.01 (0.01)
Page 21
Page 21 of 22
Table 3: Intercategory differences for each measure, for this study and the other studies surveyed. Significance is quantified using the (nonparametric) rank 1 sum test against the null hypothesis of equal medians (rank sum p-value), and, for comparison against other studies, Student’s t-test against the null 2 hypothesis of equal means. Effect size is quantified by the receiver operating characteristic area under curve (ROC AUC). Entries marked (*) are significant 3 at the 95% level. Within each intercategory comparison, measures are ranked in order of descending effect size found in this study. 1Bi-normal AUC 4 calculations based on mean and standard deviations published in these studies. 5
Measure This study 1Dursun et al. (2008) [50]
1Uloza et al. (2005) [51]
Zhang et al. (2005) [33]
1Lu et al. (1996) [54]
1Shin et al. (2002) [52]
Rank-sum p-value
t-test p-value
ROC AUC
t-test p-value
ROC AUC
t-test p-value
ROC AUC
Rank-sum p-
value
ROC AUC
t-test p-value
ROC AUC
t-test p-
value
ROC AUC
Post-operative UVFP vs. pre-operative UVFP GRBAS(Grade) <0.001* <0.001* 0.946 <0.001* 0.880 GRBAS(Breathiness) <0.001* <0.001* 0.938 <0.001* 0.965 GRBAS(Asthenia) <0.001* <0.001* 0.920 0.297 0.605
GRBAS(Total) <0.001* <0.001* 0.868 GRBAS(Strain) 0.209 0.128 0.780 0.401 0.584 GRBAS(Roughness) 0.080 0.070 0.778 0.027* 0.722 RPDE 0.030* 0.047* 0.634
Jitter(ABS) 0.030* 0.038* 0.634 0.003* 0.807 <0.001* 0.843 <0.001* 0.974 0.013* 0.726 Dimension 0.053 0.036* 0.622 Shimmer(dB) 0.073 0.333 0.611 0.055 0.694 <0.001* 0.833 0.595 0.537 0.034* 0.693 NHR 0.087 0.023* 0.606 0.056 0.691 0.772 0.526 DFA 0.678 0.499 0.526
Post-operative UVFP vs. healthy Shimmer(dB) <0.001* <0.001* 0.953 <0.001* 0.762 Jitter(ABS) <0.001* <0.001* 0.927 <0.001* 0.760 NHR <0.001* <0.001* 0.900 RPDE <0.001* <0.001* 0.824
DFA <0.001* <0.001* 0.780 Dimension <0.001* <0.001* 0.711 Pre-operative UVFP vs. healthy Shimmer(dB) <0.001* <0.001* 0.979 <0.001* 0.868
Jitter(ABS) <0.001* <0.001* 0.946 0.003* 0.750 NHR <0.001* <0.001* 0.919 RPDE <0.001* <0.001* 0.866 Dimension <0.001* <0.001* 0.840 <0.001* 0.740 DFA <0.001* <0.001* 0.787