75
| Date post: | 14-Oct-2018 |
| Category: |
Documents |
| Upload: | nguyenthuy |
| View: | 215 times |
| Download: | 0 times |


United States Office of Research and EPA/600/R-96/055Environmental Protection Development September 1994Agency Washington, D.C. 20460
GUIDANCE FOR THE DATA QUALITYOBJECTIVES PROCESS
EPA QA/G-4

GUIDANCE FOR THE DATA QUALITY OBJECTIVES PROCESS
EPA QA/G-4
United States Environmental Protection AgencyQuality Assurance Management Staff
Washington, DC 20460
FINAL
SEPTEMBER 1994EPA/600/R-96/055
iiiEPA QA/G-4 September 1994
FOREWORD
The U.S. Environmental Protection Agency (EPA) has developed the Data QualityObjectives (DQO) Process as an important tool for project managers and planners to determinethe type, quantity, and quality of data needed to support Agency decisions. This guidance is theculmination of experiences in applying DQOs in different Program Offices at the EPA. Manyelements of prior guidance, advice, statistics, and scientific planning have been incorporated intothis document. This guidance supersedes all previous guidance, including the EPA's"Development of Data Quality Objectives, Description of Stages I and II" (July 1986), and"Guidance for Planning for Data Collection in Support of Environmental Decision Making Usingthe Data Quality Objectives Process" (Interim Final, October 1993). This document is consistentwith the Office of Emergency and Remedial Response guidance, "Data Quality Objectives forSuperfund" (EPA 540-R-93-071).
The purpose of this document is to provide general guidance to organizations ondeveloping data quality criteria and performance specifications for decision making. Thisguidance assumes that an appropriate Quality System has been established and is operational.
This guidance has been prepared in response to EPA Order 5360.1, entitled "Policy andProgram Requirements to Implement the Quality Assurance Program," which establishesrequirements for quality assurance when generating environmental data in support of Agencydecisions. In addition, this guidance reflects the policy of the Agency to develop and implementthe DQO Process as expressed by Deputy Administrator A. James Barnes in his memorandum on"Agency Institutionalization of Data Quality Objectives," dated November 1986.
This document is a product of the collaborative effort of many quality managementprofessionals throughout the EPA and among the contractor community. It has been peerreviewed by the EPA Program Offices, Regional Offices, and Laboratories. Many valuablecomments and suggestions have been incorporated to make it more useful.
This electronic version of the guidance differs slightly from the printed version as a resultof the conversion to a format (pdf) accessible on many computer platforms. Page spacing andfigures may not coincide with the printed version; however, the contents of the document havenot been altered. For a copy of the printed version, please contact the EPA’s Quality AssuranceDivision at (202) 260-5763.
ivEPA QA/G-4 September 1994
Table of Contents
Chapter Page
Foreword . . . . . . . . . . . . . . . . . . . . . . . . . . . . . . . . . . . . . . . . . . . . . . . . . . . . . . . . . . . . ii
List of Figures and Tables . . . . . . . . . . . . . . . . . . . . . . . . . . . . . . . . . . . . . . . . . . . . . . iv
Introduction . . . . . . . . . . . . . . . . . . . . . . . . . . . . . . . . . . . . . . . . . . . . . . . . . . . . . . . . .1
1. Step 1: State the Problem . . . . . . . . . . . . . . . . . . . . . . . . . . . . . . . . . . . . . . . . . . . . . . . 9
2. Step 2: Identify the Decision . . . . . . . . . . . . . . . . . . . . . . . . . . . . . . . . . . . . . . . . . . . . 13
3. Step 3: Identify the Inputs to the Decision. . . . . . . . . . . . . . . . . . . . . . . . . . . . . . . . . . 17
4. Step 4: Define the Boundaries of the Study . . . . . . . . . . . . . . . . . . . . . . . . . . . . . . . . . 19
5. Step 5: Develop a Decision Rule . . . . . . . . . . . . . . . . . . . . . . . . . . . . . . . . . . . . . . . . . 23
6. Step 6: Specify Tolerable Limits on Decision Errors . . . . . . . . . . . . . . . . . . . . . . . . . . 27
7. Step 7: Optimize the Design for Obtaining Data . . . . . . . . . . . . . . . . . . . . . . . . . . . . . 37
Bibliography . . . . . . . . . . . . . . . . . . . . . . . . . . . . . . . . . . . . . . . . . . . . . . . . . . . . . . . .41
Appendices
A. Beyond the DQO Process: The Quality Assurance Project Plan and Data Quality Assessment . . . . . . . . . . . . . . . . . . . . . . . . . . . . . . . . . . . . . . . . . . . . . . . 43
B. DQO Case Study: Cadmium-Contaminated Fly Ash Waste . . . . . . . . . . . . . . . . . . . . . 47
C. Derivation of Sample Size Formula for Testing Mean of Normal Distribution Versus an Action Level . . . . . . . . . . . . . . . . . . . . . . . . . . . . . . . . . . . . . . 61
D. Glossary of Terms . . . . . . . . . . . . . . . . . . . . . . . . . . . . . . . . . . . . . . . . . . . . . . . . . . . . 65

vEPA QA/G-4 September 1994
List of FiguresPage
0-1. The Data Quality Objectives Process . . . . . . . . . . . . . . . . . . . . . . . . . . . . . . . . . . . . . . . 2
0-2. Repeated Application of the DQO Process Throughout theLife Cycle of a Single Project . . . . . . . . . . . . . . . . . . . . . . . . . . . . . . . . . . . . . . . . . . . . . 5
2-1. Example of Multiple Decisions Organized Into a Flowchart . . . . . . . . . . . . . . . . . . . . . 16
4-1. An Example of How to Stratify a Site With Soil Contamination . . . . . . . . . . . . . . . . . . 22
6-1. An Example of a Decision Performance Goal Diagram — Baseline Condition: Parameter Exceeds Action Level . . . . . . . . . . . . . . . . . . . . . . . . . 35
6-2. An Example of a Decision Performance Goal Diagram — Baseline Condition: Parameter is Less Than Action Level . . . . . . . . . . . . . . . . . . . . . . 36
7-1. An Example of a Power Curve — Baseline Condition: Parameter is Less Than Action Level. . . . . . . . . . . . . . . . . . . . . . . 40
A-1. QA Planning and the Data Life Cycle . . . . . . . . . . . . . . . . . . . . . . . . . . . . . . . . . . . . . . 44
A-2. Quality Assurance Assessment . . . . . . . . . . . . . . . . . . . . . . . . . . . . . . . . . . . . . . . . . . . 46
B-1. Design Performance Goal Diagram for Cadmium Compliance Testing — Baseline Condition: Mean Exceeds Action Level. . . . . . . . . . . . . . . . . . . . . . . . . . . . . 53
List of Tables
1-1. Elements of the Problem Description . . . . . . . . . . . . . . . . . . . . . . . . . . . . . . . . . . . . . . 12
5-1. Attributes of Different Statistical Parameters to Characterize the Population . . . . . . . 25
6-1. Decision Error Limits Table Corresponding to Figure 6-1 . . . . . . . . . . . . . . . . . . . . . . 35
6-2. Decision Error Limits Table Corresponding to Figure 6-2 . . . . . . . . . . . . . . . . . . . . . . 36
1EPA QA/G-4 September 1994
INTRODUCTION
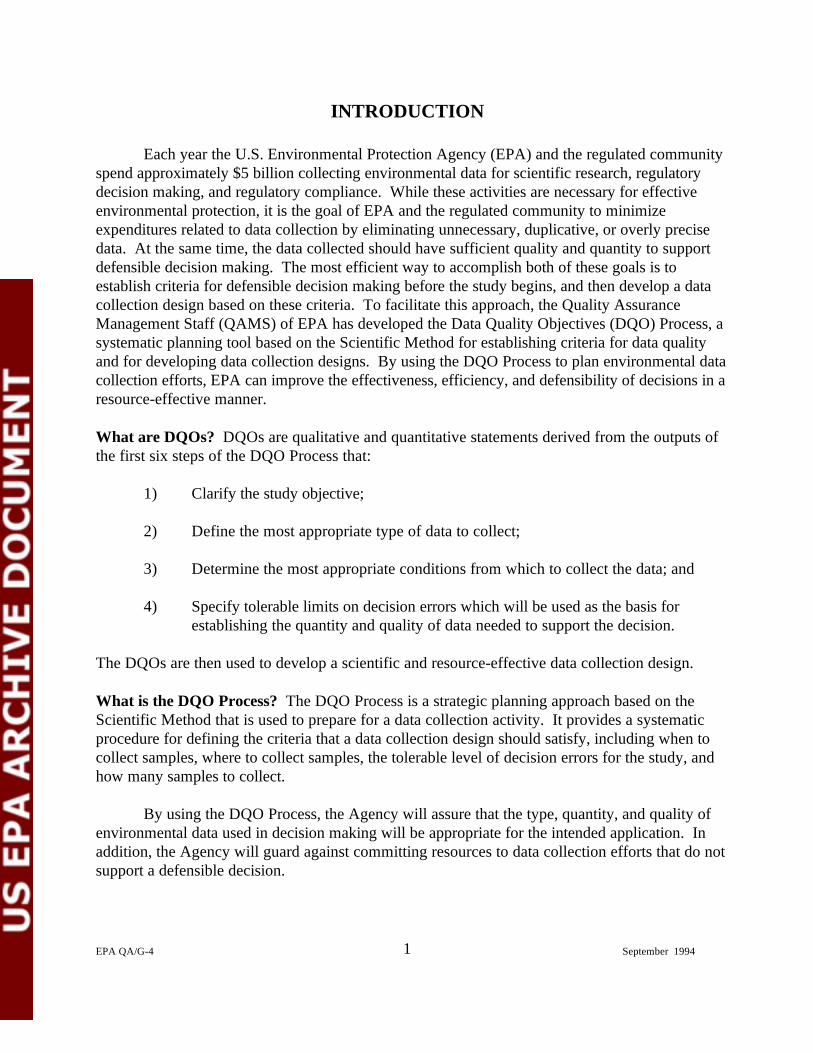
Each year the U.S. Environmental Protection Agency (EPA) and the regulated communityspend approximately $5 billion collecting environmental data for scientific research, regulatorydecision making, and regulatory compliance. While these activities are necessary for effectiveenvironmental protection, it is the goal of EPA and the regulated community to minimizeexpenditures related to data collection by eliminating unnecessary, duplicative, or overly precisedata. At the same time, the data collected should have sufficient quality and quantity to supportdefensible decision making. The most efficient way to accomplish both of these goals is toestablish criteria for defensible decision making before the study begins, and then develop a datacollection design based on these criteria. To facilitate this approach, the Quality AssuranceManagement Staff (QAMS) of EPA has developed the Data Quality Objectives (DQO) Process, asystematic planning tool based on the Scientific Method for establishing criteria for data qualityand for developing data collection designs. By using the DQO Process to plan environmental datacollection efforts, EPA can improve the effectiveness, efficiency, and defensibility of decisions in aresource-effective manner.
What are DQOs? DQOs are qualitative and quantitative statements derived from the outputs ofthe first six steps of the DQO Process that:
1) Clarify the study objective;
2) Define the most appropriate type of data to collect;
3) Determine the most appropriate conditions from which to collect the data; and
4) Specify tolerable limits on decision errors which will be used as the basis forestablishing the quantity and quality of data needed to support the decision.
The DQOs are then used to develop a scientific and resource-effective data collection design. What is the DQO Process? The DQO Process is a strategic planning approach based on theScientific Method that is used to prepare for a data collection activity. It provides a systematicprocedure for defining the criteria that a data collection design should satisfy, including when tocollect samples, where to collect samples, the tolerable level of decision errors for the study, andhow many samples to collect.
By using the DQO Process, the Agency will assure that the type, quantity, and quality ofenvironmental data used in decision making will be appropriate for the intended application. Inaddition, the Agency will guard against committing resources to data collection efforts that do notsupport a defensible decision.

State the Problem
Identify the Decision
Identify Inputs to the Decision
Define the Study Boundaries
Develop a Decision Rule
Specify Limits on Decision Errors
Optimize the Design for Obtaining Data
2EPA QA/G-4 September 1994
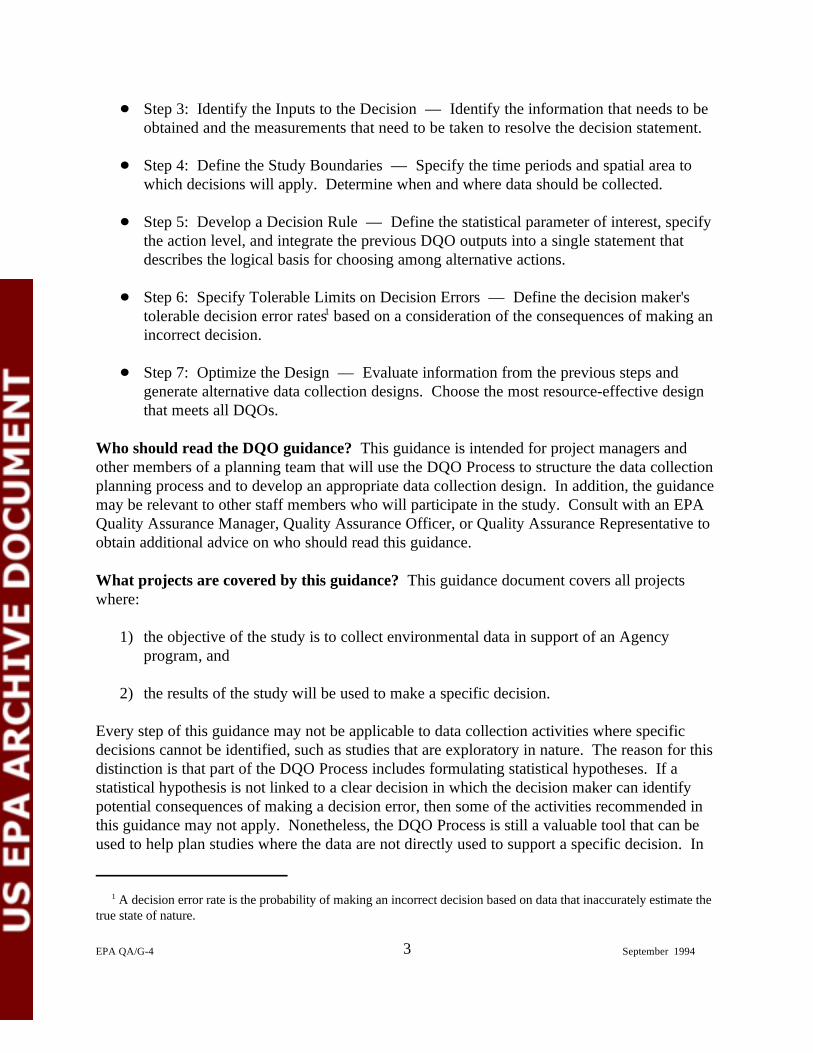
The DQO Process consists of seven steps, as shown in Figure 0-1. The output from eachstep influences the choices that will be made later in the Process. Even though the DQO Processis depicted as a linear sequence of steps, in practice it is iterative; the outputs from one step maylead to reconsideration of prior steps. This iteration should be encouraged since it will ultimatelylead to a more efficient data collection design. During the first six steps of the DQO Process, theplanning team will develop the decision performance criteria (DQOs) that will be used to developthe data collection design. The final step of the Process involves developing the data collectiondesign based on the DQOs. The first six steps should be completed before the planning teamattempts to develop the data collection design because this final step is dependent on a clearunderstanding of the first six steps taken as a whole. In Figure 0-1, the iterative link between theDQOs and the Optimize the Design step is illustrated by double arrows, which signify that it maybe necessary to revisit any one or more of the first six steps to develop a feasible and appropriatedata collection design. Above all, every step should be completed before data collection begins.
Figure 0-1. The Data Quality Objectives Process.
Each of the seven steps is described briefly below. A more detailed description can befound in the subsequent chapters of this guidance.
Step 1: State the Problem — Concisely describe the problem to be studied. Reviewprior studies and existing information to gain a sufficient understanding to define theproblem.
Step 2: Identify the Decision — Identify what questions the study will attempt toresolve, and what actions may result.
A decision error rate is the probability of making an incorrect decision based on data that inaccurately estimate the1
true state of nature.
3EPA QA/G-4 September 1994
Step 3: Identify the Inputs to the Decision — Identify the information that needs to beobtained and the measurements that need to be taken to resolve the decision statement.
Step 4: Define the Study Boundaries — Specify the time periods and spatial area towhich decisions will apply. Determine when and where data should be collected.
Step 5: Develop a Decision Rule — Define the statistical parameter of interest, specifythe action level, and integrate the previous DQO outputs into a single statement thatdescribes the logical basis for choosing among alternative actions.
Step 6: Specify Tolerable Limits on Decision Errors — Define the decision maker'stolerable decision error rates based on a consideration of the consequences of making an1
incorrect decision.
Step 7: Optimize the Design — Evaluate information from the previous steps andgenerate alternative data collection designs. Choose the most resource-effective designthat meets all DQOs.
Who should read the DQO guidance? This guidance is intended for project managers andother members of a planning team that will use the DQO Process to structure the data collectionplanning process and to develop an appropriate data collection design. In addition, the guidancemay be relevant to other staff members who will participate in the study. Consult with an EPAQuality Assurance Manager, Quality Assurance Officer, or Quality Assurance Representative toobtain additional advice on who should read this guidance.
What projects are covered by this guidance? This guidance document covers all projectswhere:
1) the objective of the study is to collect environmental data in support of an Agencyprogram, and
2) the results of the study will be used to make a specific decision.
Every step of this guidance may not be applicable to data collection activities where specificdecisions cannot be identified, such as studies that are exploratory in nature. The reason for thisdistinction is that part of the DQO Process includes formulating statistical hypotheses. If astatistical hypothesis is not linked to a clear decision in which the decision maker can identifypotential consequences of making a decision error, then some of the activities recommended inthis guidance may not apply. Nonetheless, the DQO Process is still a valuable tool that can beused to help plan studies where the data are not directly used to support a specific decision. In
4EPA QA/G-4 September 1994
these cases, it may be possible to frame a research type study question in the form of a decision ormodify the activities described in this guidance to address the needs of the study.
What is the value of using the DQO Process?
The DQO Process is a planning tool that can save resources by making data collectionoperations more resource-effective. Good planning will streamline the study process andincrease the likelihood of efficiently collecting appropriate and useful data.
The structure of the DQO Process provides a convenient way to document activities anddecisions and to communicate the data collection design to others.
The DQO Process enables data users and relevant technical experts to participate in datacollection planning and to specify their particular needs prior to data collection. The DQOprocess fosters communication among all participants, one of the central tenets of qualitymanagement practices.
The DQO Process provides a method for defining decision performance requirements thatare appropriate for the intended use of the data. This is done by considering theconsequences of decision errors and then placing tolerable limits on the probability that thedata will mislead the decision maker into committing a decision error. A statisticalsampling design can then be generated to provide the most efficient method for controllingdecision errors and satisfying the DQOs.
The DQO Process helps to focus studies by encouraging data users to clarify vagueobjectives and to limit the number of decisions that will be made.
When should the DQO Process be used? The DQO Process should be used during theplanning stage of any study that requires data collection, before the data are collected. In general,EPA's policy is to use the DQO Process to plan all data collection efforts that will require orresult in a substantial commitment of resources. The Quality Management Plans (QMPs) of theAgency's National Program Offices, Regional Offices, and Research and Developmentorganizations will specify which studies require DQOs.
Can the DQO Process be used for small studies? The DQO Process applies to any study,regardless of its size. However, the depth and detail of DQO development will depend on the complexity of the study. The more complex a study, the more likely that it will have severaldecisions that could benefit from the DQO Process and that the decisions will require moreintensive DQO development.
Should the DQO Process be applied as intensively to all situations? No, the DQO Process isa flexible planning tool that can be used more or less intensively as the situation requires. Forprojects that have multiple decisions, where the resolution of one decision only leads to the
ITERATEAS
NEEDED
STARTDEVELOPING
DQOs
PRIMARYSTUDY
DECISION
STATETHE
PROBLEM
OPTIMIZETHE DESIGN
IDENTIFY THE
DECISION
DEVELOP A
DECISION RULE
DEFINETHE
STUDYBOUNDARIES
IDENTIFYINPUTS TO THE
DECISION
INCREASING LEVEL OF EVALUATION EFFORT
STATETHE
PROBLEM
OPTIMIZETHE DESIGN
IDENTIFY THE
DECISIONDEVELOP ADECISION RULE
DEFINETHE
STUDYBOUNDARIES
IDENTIFYINPUTS TO THE
DECISION
SPECIFYLIMITS ONDECISION ERRORS
STATETHE
PROBLEM
OPTIMIZETHE DESIGN
IDENTIFY THE
DECISION
DEVELOP A
DECISION RULE
DEFINETHE
STUDYBOUNDARIES
IDENTIFYINPUTS TO THE
DECISION
STUDY PLANNINGCOMPLETED
STUDY PLANNING COMPLETED
SPECIFYLIMITS ONDECISION ERRORS
SPECIFYLIMITS ONDECISION ERRORS
STUDY PLANNING COMPLETED
INTERME-DIATESTUDY
DECISIONADVANCED
STUDYDECISION
DECIDE NOT TO USE
PROBABILISTICSAMPLINGAPPROACH
5EPA QA/G-4 September 1994
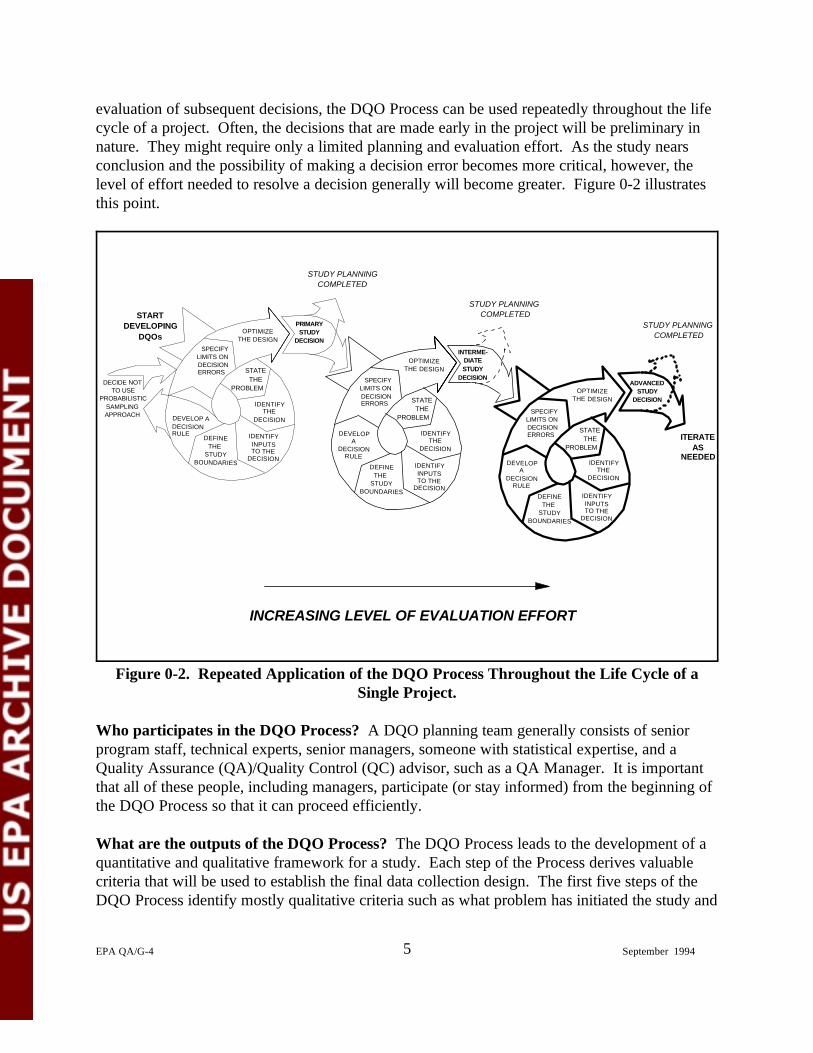
evaluation of subsequent decisions, the DQO Process can be used repeatedly throughout the lifecycle of a project. Often, the decisions that are made early in the project will be preliminary innature. They might require only a limited planning and evaluation effort. As the study nearsconclusion and the possibility of making a decision error becomes more critical, however, thelevel of effort needed to resolve a decision generally will become greater. Figure 0-2 illustratesthis point.
Figure 0-2. Repeated Application of the DQO Process Throughout the Life Cycle of aSingle Project.
Who participates in the DQO Process? A DQO planning team generally consists of seniorprogram staff, technical experts, senior managers, someone with statistical expertise, and aQuality Assurance (QA)/Quality Control (QC) advisor, such as a QA Manager. It is importantthat all of these people, including managers, participate (or stay informed) from the beginning ofthe DQO Process so that it can proceed efficiently.
What are the outputs of the DQO Process? The DQO Process leads to the development of aquantitative and qualitative framework for a study. Each step of the Process derives valuablecriteria that will be used to establish the final data collection design. The first five steps of theDQO Process identify mostly qualitative criteria such as what problem has initiated the study and

6EPA QA/G-4 September 1994
what decision it attempts to resolve. They also define the type of data that will be collected,where and when the data will be collected, and a decision rule that defines how the decision willbe made. The sixth step defines quantitative criteria expressed as limits on decision errors that thedecision maker can tolerate. The final step is used to develop a data collection design based onthe criteria developed in the first six steps. The final product of the DQO Process is a datacollection design that meets the quantitative and qualitative needs of the study.
Much of the information that is developed in the DQO Process will also be useful for thedevelopment of Quality Assurance Project Plans (QAPPs) and the implementation of the DataQuality Assessment (DQA) Process. The outputs of the DQO Process can be used directly andindirectly as inputs to a QAPP. To evaluate the data using the DQA Process, it is necessary tohave first established decision quality criteria using the DQO Process or its equivalent. Therefore,the DQO Process not only helps plan a study, establish decision quality criteria, and develop adata collection design, but it also aids in the development of QAPPs and the DQA Process.
What is a data collection design? A data collection design specifies the final configuration ofthe environmental monitoring or measurement effort required to satisfy the DQOs. It designatesthe types and quantities of samples or monitoring information to be collected; where, when, andunder what conditions they should be collected; what variables are to be measured; and theQA/QC procedures to ensure that sampling design and measurement errors are controlledsufficiently to meet the tolerable decision error rates specified in the DQOs. These QA/QCprocedures are established in the QAPP.
Where does the DQO Process fit into EPA's Quality System? The DQO Process is the part ofthe Quality System that provides the basis for linking the intended use of the data to the QA/QCrequirements for data collection and analysis. This document is one of a series of qualitymanagement requirements and guidance documents that the U.S. EPA Quality AssuranceManagement Staff (QAMS) has prepared to assist users in implementing the Agency-wide QualitySystem. The current document list contains:
EPA QA/R-1 EPA Quality System Requirements for Environmental Programs
EPA QA/G-1 Guidance for Developing, Implementing, and Evaluating Quality Systems forEnvironmental Programs
EPA QA/R-2 EPA Requirements for Quality Management Plans
EPA QA/G-2 Guidance for Preparing Quality Management Plans for Environmental Programs
EPA QA/G-4 Guidance for The Data Quality Objectives Process
EPA QA/R-5 EPA Requirements for Quality Assurance Project Plans for Environmental DataOperations
7EPA QA/G-4 September 1994
EPA QA/G-5 Guidance for Quality Assurance Project Plans
EPA QA/G-9 Guidance for Data Quality Assessments
Agency policy statements are found in the requirements documents (QA/R-xx series). Advisory papers are found in the guidance documents (QA/G-xx series).
Can existing data be used to support decisions using the DQO Process? Existing data can bevery useful for supporting decisions using the DQO Process. There are three ways that existingdata can be used:
1) If sufficient documentation is available, existing data may be used alone or combined withnew data. Determining whether data can appropriately be combined can be a verycomplex operation that should be undertaken with great care. In many cases it will requirethe expertise of a statistician.
2) The existing data may provide valuable information (such as variability) that can be used inthe development of the data collection design.
3) The existing data may be useful in guiding the selection of an efficient data collectiondesign.
Will the use of the DQO Process always result in statistical/probabilistic sampling methodsfor data collection? No. While statistical methods for developing the data collection design arestrongly encouraged, this guidance recognizes that not every problem can be evaluated usingprobabilistic techniques. The DQO Process, however, can and should be used as a planning toolfor studies even if a statistical data collection design ultimately will not be used. In these cases,the planning team is encouraged to seek expert advice on how to develop a non-statisticaldatacollection design and on how to evaluate the result of the data collection. When non-probabilistic, judgemental, or quota sampling methods are used, be sure to consult with an EPAQA Manager, QA Officer, or QA Representative to ensure that program-specific QArequirements are satisfied.
How should this guidance be used? This guidance should be used as a tool to structure theplanning activities for collecting environmental data. It should be used to organize meetings,focus the collection of background information, and facilitate communication between technicalexperts, program managers, and decision makers.
How is this guidance structured? This guidance contains seven chapters, four appendices, anda bibliography. Each of the remaining chapters describes one of the seven steps of the DQOProcess. Each chapter is divided into four sections as follows:
(1) Purpose - This section explains the objective of the chapter.

8EPA QA/G-4 September 1994
(2) Expected Outputs - This section identifies the products expected uponcompletion of the DQO Process step.
(3) Background - This section provides background information on the DQO Processstep, including the rationale for the activities in that step.
(4) Activities - This section describes the activities recommended for completing theDQO Process step, including how inputs to the step are used.
Appendix A provides a brief overview of both the Quality Assurance Project Plan (QAPP)development process, which is used to document the operational and QA/QC procedures neededto implement the data collection design, and the Data Quality Assessment (DQA) Process, whichis used after the data have been collected to evaluate whether the DQOs have been satisfied. Appendix B is a case study in which the DQO Process is applied to an environmental problem. Appendix C provides a derivation of the sample size formula used in Appendix B. Appendix Dprovides a glossary of terms used in this guidance.
Where is it possible to get statistical support? Access to statistical support is available throughthe EPA Quality Assurance Management Staff (QAMS) at (202) 260-5763.
How long will this guidance be in effect? This guidance will remain in effect for five years fromthe publication date, unless superseded by an updated version.
Where is it possible to get more information about the DQO Process? A DQO trainingcourse is available through the EPA at the U.S. EPA Headquarters in Washington, D.C. Additional documents on DQO applications can be obtained from the Quality AssuranceManagement Staff at EPA Headquarters.
Two documents that can provide additional detail on the DQO Process are:
U.S. Environmental Protection Agency. 1993. Data Quality Objectives Processfor Superfund: Interim Final Guidance. EPA 540-R-93-071.
Bates, D.J., R.O. Gilbert, N.L. Hassig, R.F. O'Brien, B.A. Pulsipher, 1993. Decision Performance Criteria: The Driver Behind The Data Quality ObjectivesProcess — A Statistical Introduction (Draft). Pacific Northwest Laboratory,Richland, Washington.
THE DATA QUALITY OBJECTIVES PROCESS
State the Problem
Identify the Decision
Identify Inputs to the Decision
Define the Study Boundaries
Develop a Decision Rule
Specify Limits on Decision Errors
Optimize the Design for Obtaining Data
STATE THE PROBLEM
Purpose
To clearly define the problem so that the focusof the study will be unambiguous.
Activities
Identify members of the planning team.
Identify the primary decision maker.
Develop a concise description of the problem.
Specify available resources and relevant deadlines for the study.
9EPA QA/G-4 September 1994
CHAPTER 1
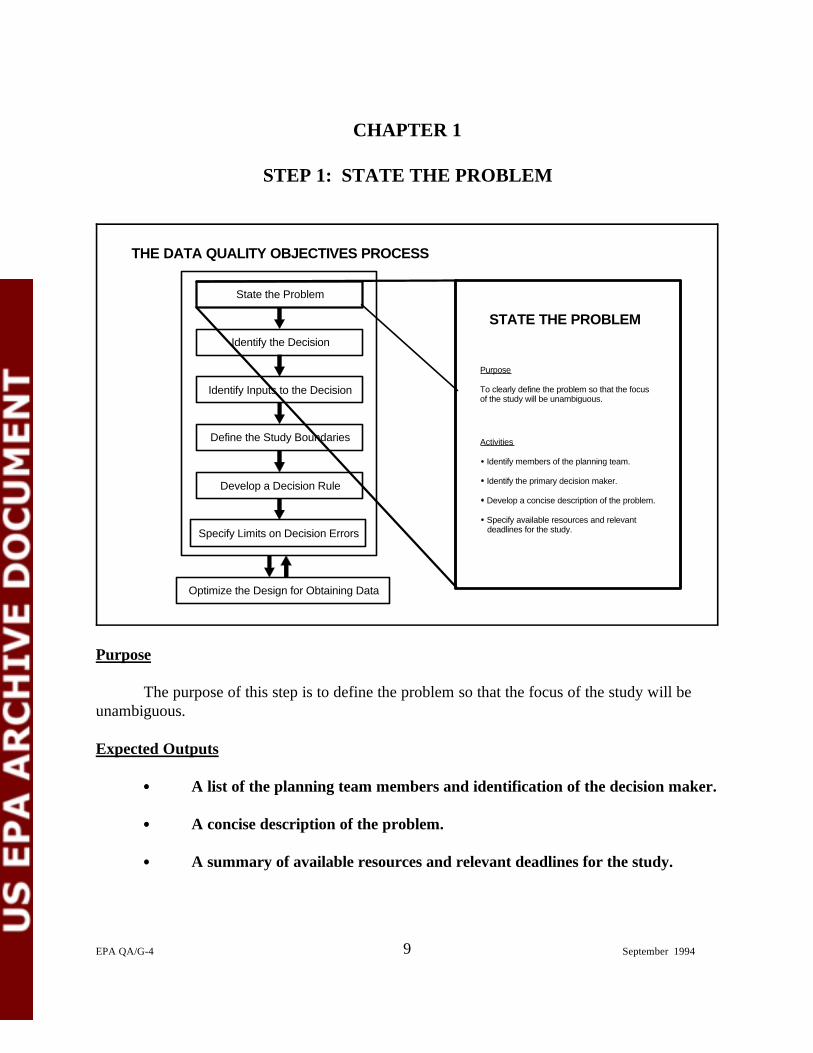
STEP 1: STATE THE PROBLEM
Purpose
The purpose of this step is to define the problem so that the focus of the study will beunambiguous.
Expected Outputs
A list of the planning team members and identification of the decision maker.
A concise description of the problem.
A summary of available resources and relevant deadlines for the study.
10EPA QA/G-4 September 1994
Background
The first step in any decision making process is to define the problem that has initiated thestudy. Since most environmental problems present a complex interaction of technical, economic,social, and political factors, it is critical to the success of the process to define the problemcompletely and in an uncomplicated format. A problem will have the greatest chance of being solvedwhen a multidisciplinary team of technical experts and stakeholders can help to recognize all of theimportant facets of the problem and ensure that complex issues are described accurately. Generallyteams will function more effectively when they have one clearly identified decision maker.
This step in the DQO Process addresses development of a planning team that will definethe problem and implement subsequent steps of the Process. It also calls for the identification of adecision maker who will lead the planning team and make final resolutions during the Process. The goal is to create a well-structured planning team that will work effectively and efficiently todevelop a concise and complete description of the problem, which will provide the basis for therest of the DQO development.
Activities
Identify members of the planning team. The planning team is the group that will developDQOs for the study. The number of planning team members will be directly related to the sizeand complexity of the problem. The team should include representatives from all groups who arestakeholders in the project, including, but not limited to, samplers, chemists and other scientistsand engineers, modelers, technical project managers, community representatives, administrativeand executive managers, QA/QC experts (such as a QA Manager), data users, and decisionmakers. A reasonable effort should be made to include any decision makers who may use thestudy findings later. A statistician (or someone knowledgeable and experienced withenvironmental statistical design and analysis) should also be included on this team.
Identify the primary decision maker of the planning team and define each member's roleand responsibility during the DQO Process. The planning team generally has a leader, referredto as the “decision maker.” The decision maker has the ultimate authority for making finaldecisions based on the recommendations of the planning team. The decision maker is often theperson with the most authority over the study, and may be responsible for assigning the roles andresponsibilities to the planning team members. In cases where the decision maker cannot attendDQO planning meetings, a senior staff member should keep the decision maker informed ofimportant planning issues.
Develop a concise description of the problem. The problem description provides backgroundinformation on the fundamental issue to be addressed by the study. Below is a list of steps thatmay be helpful during this phase of DQO development.
11EPA QA/G-4 September 1994
Describe the conditions or circumstances that are causing the problem and thereason for understanding the study. Typical examples for environmental problemsinclude conditions that may pose a threat to human health or the environment, andcircumstances of potential non-compliance with regulations.
Describe the problem as it is currently understood by briefly summarizing existinginformation. (See Table 1-1 for a list of elements that may be appropriate toinclude in the problem description.)
Conduct literature searches and examine past or ongoing studies to ensure that theproblem is correctly defined and has not been solved previously. Organize andreview relevant information, including preliminary studies, and indicate the sourceand reliability of the information. Take note of information about the performanceof sampling and analytical methods observed in similar studies since thisinformation may prove to be particularly valuable later in the DQO Process.
If the problem is complex, consider breaking it into more manageable pieces. Identify those pieces that could be addressed by separate studies. Assign prioritiesto and logical relationships among the pieces of the problem.
Specify the available resources and relevant deadlines for the study. Stipulate the anticipatedbudget, available personnel, and contractual vehicles (if applicable). Also, enumerate anydeadlines for completion of the study and any intermediate deadlines that may need to be met.

12EPA QA/G-4 September 1994
Table 1-1. Elements of the Problem Description
The following elements may be appropriate to include in the problem description. Note: this list only provides the basic elements of the problem description. Yourelements may be slightly different.
Study objectives/regulatory context.
Persons or organizations involved in the study.
Persons or organizations that have an interest in the study.
Political issues surrounding the study.
Sources and amount of funding.
Previous study results.
Existing sampling design constraints (some aspects of samplingdesign may be specified in regulations or established through pastplanning efforts)
.
THE DATA QUALITY OBJECTIVES PROCESS
State the Problem
Identify the Decision
Identify Inputs to the Decision
Define the Study Boundaries
Develop a Decision Rule
Specify Limits on Decision Errors
Optimize the Design for Obtaining Data
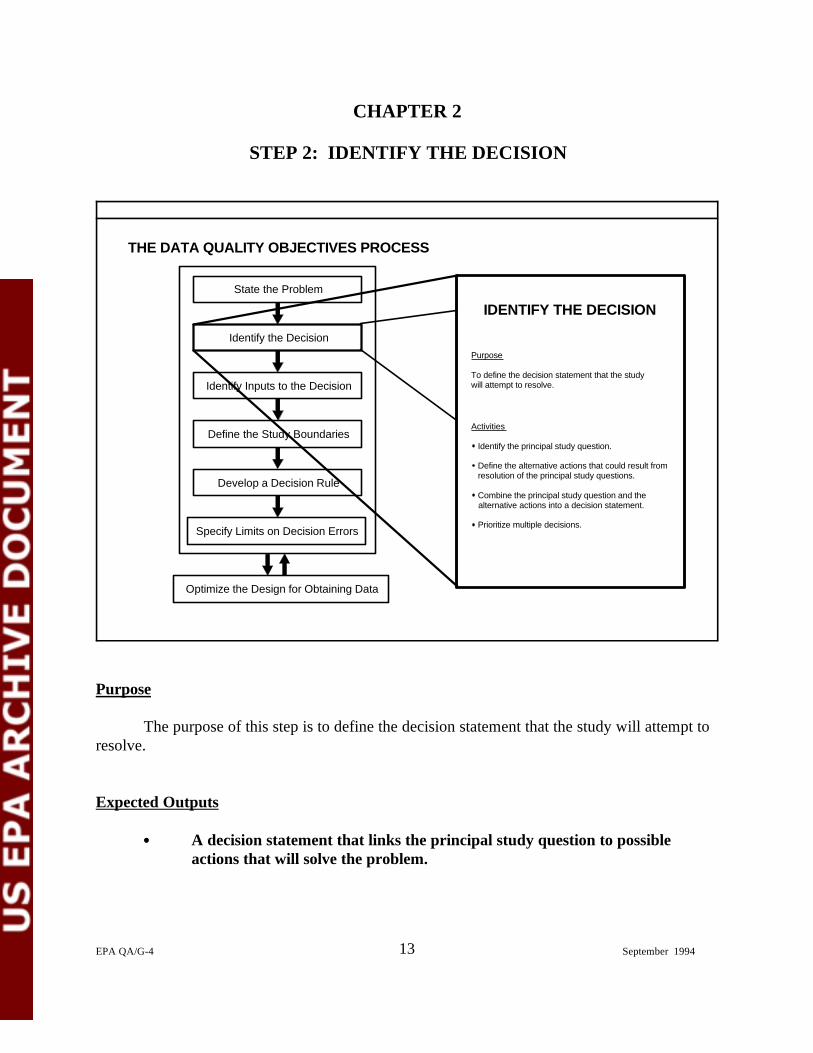
IDENTIFY THE DECISION
Purpose
To define the decision statement that the study will attempt to resolve.
Activities
Identify the principal study question.
Define the alternative actions that could result from resolution of the principal study questions.
Combine the principal study question and the alternative actions into a decision statement.
Prioritize multiple decisions.
13EPA QA/G-4 September 1994
CHAPTER 2
STEP 2: IDENTIFY THE DECISION
Purpose
The purpose of this step is to define the decision statement that the study will attempt toresolve.
Expected Outputs
A decision statement that links the principal study question to possibleactions that will solve the problem.
14EPA QA/G-4 September 1994
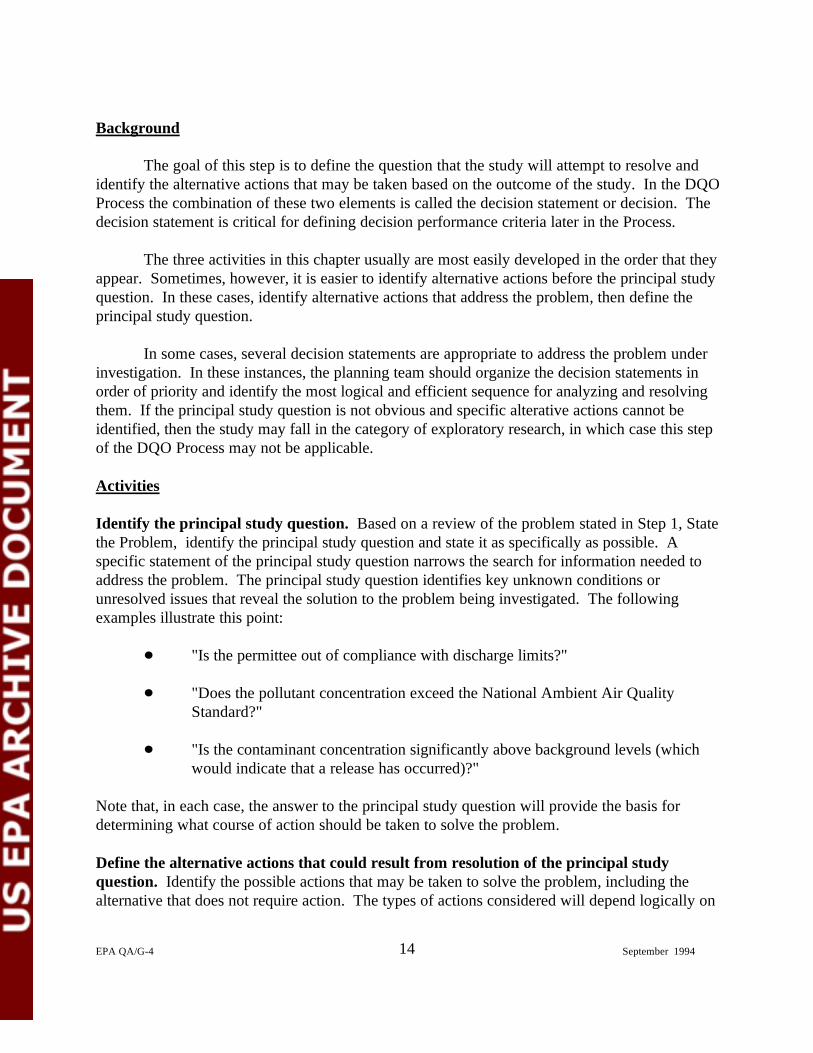
Background
The goal of this step is to define the question that the study will attempt to resolve andidentify the alternative actions that may be taken based on the outcome of the study. In the DQOProcess the combination of these two elements is called the decision statement or decision. Thedecision statement is critical for defining decision performance criteria later in the Process.
The three activities in this chapter usually are most easily developed in the order that theyappear. Sometimes, however, it is easier to identify alternative actions before the principal studyquestion. In these cases, identify alternative actions that address the problem, then define theprincipal study question.
In some cases, several decision statements are appropriate to address the problem underinvestigation. In these instances, the planning team should organize the decision statements inorder of priority and identify the most logical and efficient sequence for analyzing and resolvingthem. If the principal study question is not obvious and specific alterative actions cannot beidentified, then the study may fall in the category of exploratory research, in which case this stepof the DQO Process may not be applicable.
Activities
Identify the principal study question. Based on a review of the problem stated in Step 1, Statethe Problem, identify the principal study question and state it as specifically as possible. Aspecific statement of the principal study question narrows the search for information needed toaddress the problem. The principal study question identifies key unknown conditions orunresolved issues that reveal the solution to the problem being investigated. The followingexamples illustrate this point:
"Is the permittee out of compliance with discharge limits?"
"Does the pollutant concentration exceed the National Ambient Air QualityStandard?"
"Is the contaminant concentration significantly above background levels (whichwould indicate that a release has occurred)?"
Note that, in each case, the answer to the principal study question will provide the basis fordetermining what course of action should be taken to solve the problem.
Define the alternative actions that could result from resolution of the principal studyquestion. Identify the possible actions that may be taken to solve the problem, including thealternative that does not require action. The types of actions considered will depend logically on
15EPA QA/G-4 September 1994
the possible answers to the principal study question. These alternative actions form the basis fordefining decision performance criteria in Step 6: Specify Tolerable Limits on Decision Errors.
The following example illustrates how alternative actions are defined based on possibleanswers to the following principal study question: "Are the lead pellets that are fired by birdhunters and collect on the bottom of ponds contributing to the decrease in the duck population inAdelayed County?" Possible resolutions of the principal study question are 1) the lead pellets are a factor in the decrease of the duck population, or 2) the lead pellets are nota factor in the duck population's decrease. If the lead is a contributing factor, the action may beto remove the lead from the bottom of the ponds and, at the same time, regulate the type ofpellets that hunters may use in the future. If lead pellets are not found to contribute to a decreasein the duck population, then no action will be taken.
Combine the principal study question and the alternative actions into a decision statement. Combine the alternative actions identified in the previous activity and the principal study questioninto a decision statement that expresses a choice among alternative actions. The followingstandard form may be helpful in drafting decision statements: "Determine whether or not[unknown environmental conditions/issues/criteria from the principal study question] require (orsupport) [taking alternative actions]."
To illustrate the decision statement framing activity, consider the previous example. Theprincipal study question is, "Are lead pellets on the bottom of ponds in Adelayed Countycontributing to the decrease in the duck population?", and the alternative actions are to"remediate the lead and regulate the use of lead pellets for hunting," or "take no action." Therefore the decision statement is, "Determine whether or not lead pellets are contributing to thedecrease in the duck population and require remediation and regulation." For a compliancemonitoring problem, a decision statement that incorporates the principal study question andexpresses a choice among alternative actions might be, "Determine whether or not the permittee isout of compliance with discharge limits and requires enforcement action."
Organize multiple decisions. If several separate decision statements must be defined to addressthe problem, list them and identify the sequence in which they should be resolved. It may beuseful to document the decision resolution sequence and relationships in a diagram or flowchart(see example in Figure 2-1).

Start Is contamination present? DocumentFindings Stop
Does contamination poseunacceptable risk?
DocumentDecision Stop
Determine extent of unacceptablecontamination
Investigate possible remedies
Choose remedy
Apply remedy
Is remedy working?
Final Goal Achieved?DocumentDecision Stop
No
Yes
No
Yes
Yes
Yes
No
No
16EPA QA/G-4 September 1994
Figure 2-1. Example of Multiple Decisions Organized Into a Flowchart.
THE DATA QUALITY OBJECTIVES PROCESS
State the Problem
Identify the Decision
Identify Inputs to the Decision
Define the Study Boundaries
Develop a Decision Rule
Specify Limits on Decision Errors
Optimize the Design for Obtaining Data
IDENTIFY INPUTS
Purpose
To identify the informational inputs that will be required to resolve the decision statement anddetermine which inputs require environmentalmeasurements.
Activities
Identify the information that will be required to resolve the decision statement.
Determine the sources for each item of information identified.
Identify the information that is needed to establish the action level.
Confirm that appropriate analytical methods exist to provide the necessary data.
17EPA QA/G-4 September 1994
CHAPTER 3
STEP 3: IDENTIFY THE INPUTS TO THE DECISION
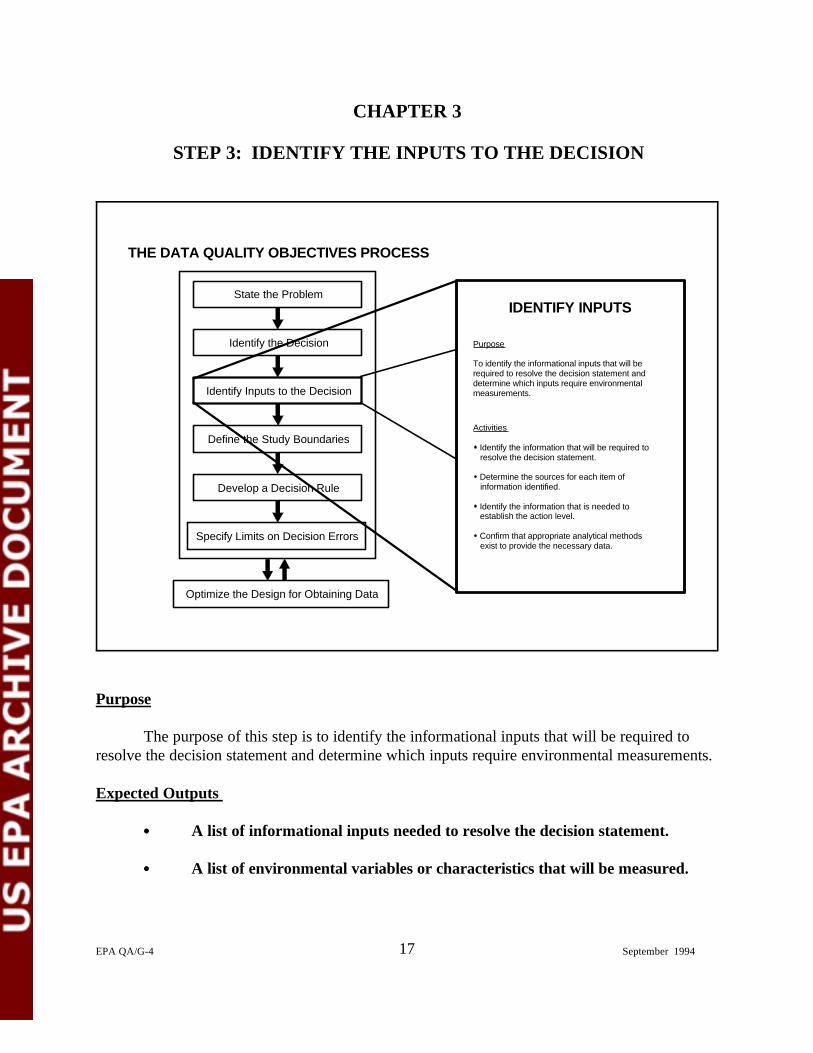
Purpose
The purpose of this step is to identify the informational inputs that will be required toresolve the decision statement and determine which inputs require environmental measurements.
Expected Outputs
A list of informational inputs needed to resolve the decision statement.
A list of environmental variables or characteristics that will be measured.
18EPA QA/G-4 September 1994
Background
To resolve most decision statements, it is necessary to collect data or information. In thisstep, the planning team identifies the different types of information that will be needed to resolvethe decision statement. The key information requirements include the measurements that may berequired, the source of data or information (e.g., historic or new data), and the basis for settingthe action level. Once the planning team has determined what needs to be measured, they willrefine the specifications and criteria for these measurements in later steps of the DQO Process.
Activities
Identify the information that will be required to resolve the decision statement. Determinewhich environmental variables or other information are needed to resolve the decision statement. Consider whether monitoring or modeling approaches, or a combination of both, will be used toacquire the information. Based on the selected data acquisition approach, identify the types ofinformation needed to support the decision statement. Ask general questions such as, "Isinformation on the physical properties of the media required?" or "Is information on the chemicalcharacteristics of the matrix needed?" These types of questions and their answers help identify theinformation needs. In compliance monitoring for pollutants discharged into surface water,examples of environmental variables of interest may include levels of lead, silver, total suspendedsolids, or temperature measurements.
Determine the sources for each item of information identified above. Identify and list thesources for the information needed to resolve the decision statement. These sources may includeresults of previous data collections, historical records, regulatory guidance, professionaljudgement, scientific literature, or new data collections. Next, qualitatively evaluate whether anyexisting data are appropriate for the study. Existing data will be evaluated quantitatively inStep 7: Optimize the Design for Obtaining Data.
Identify the information that is needed to establish the action level. Define the basis forsetting the action level. The action level is the threshold value which provides the criterion forchoosing between alternative actions. Action levels may be based on regulatory thresholds orstandards, or they may be derived from problem-specific considerations such as risk analysis. Inthis step, simply determine the criteria that will be used to set the numerical value. The actualnumerical action level will be set in Step 5: Develop a Decision Rule.
Confirm that appropriate measurement methods exist to provide the necessary data. Usethe list of environmental measurements identified earlier in this step to develop a list of potentiallyappropriate measurement methods. Note the method detection limit and limit of quantitation foreach potential method; this performance information will be used in steps 5 and 7 of the DQOProcess.
THE DATA QUALITY OBJECTIVES PROCESS
State the Problem
Identify the Decision
Identify Inputs to the Decision
Define the Study Boundaries
Develop a Decision Rule
Specify Limits on Decision Errors
Optimize the Design for Obtaining Data
DEFINE BOUNDARIES
Purpose
To define the spatial and temporal boundariesthat are covered by the decision statement.
Activities
Specify the characteristics that define the population parameter of interest.
Define the geographical area within which all decisions must apply.
When appropriate, divide the population into strata that have relatively homogeneous characteristics.
Determine the time frame to which the decision applies.
Determine when to collect data.
Define the scale of decision making.
Identify any practical constraints on data collection.
19EPA QA/G-4 September 1994
CHAPTER 4
STEP 4: DEFINE THE BOUNDARIES OF THE STUDY
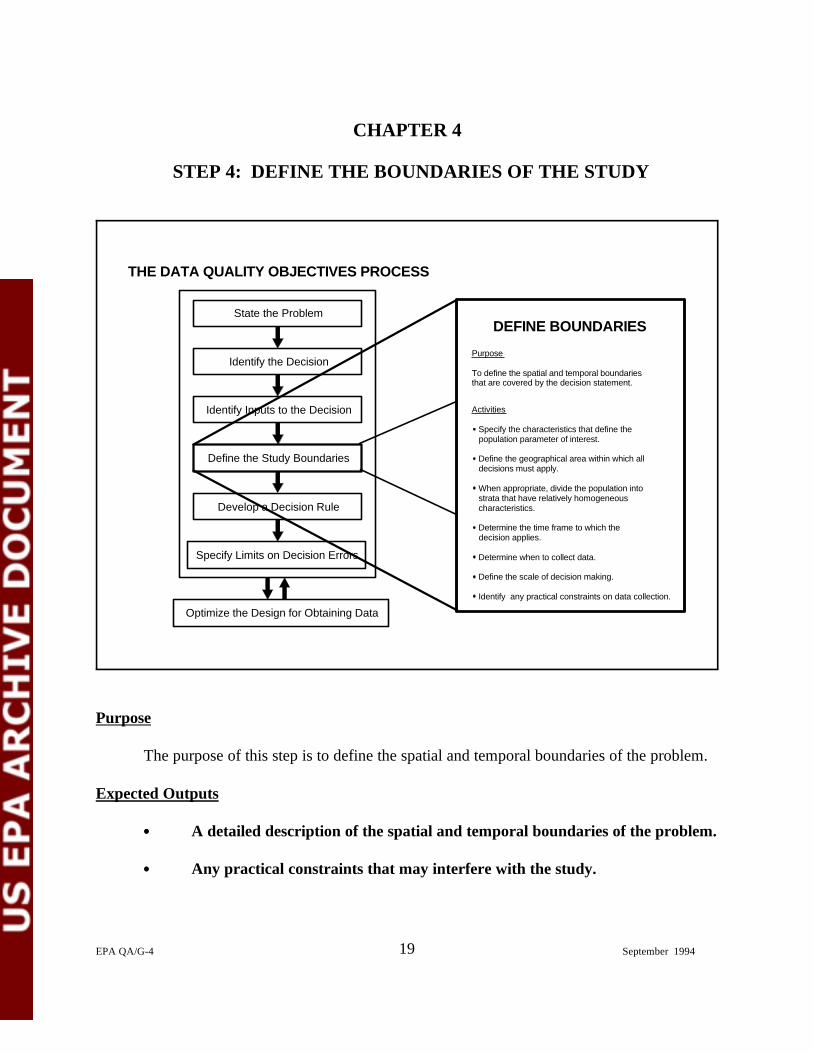
Purpose
The purpose of this step is to define the spatial and temporal boundaries of the problem.
Expected Outputs
A detailed description of the spatial and temporal boundaries of the problem.
Any practical constraints that may interfere with the study.
20EPA QA/G-4 September 1994
Background
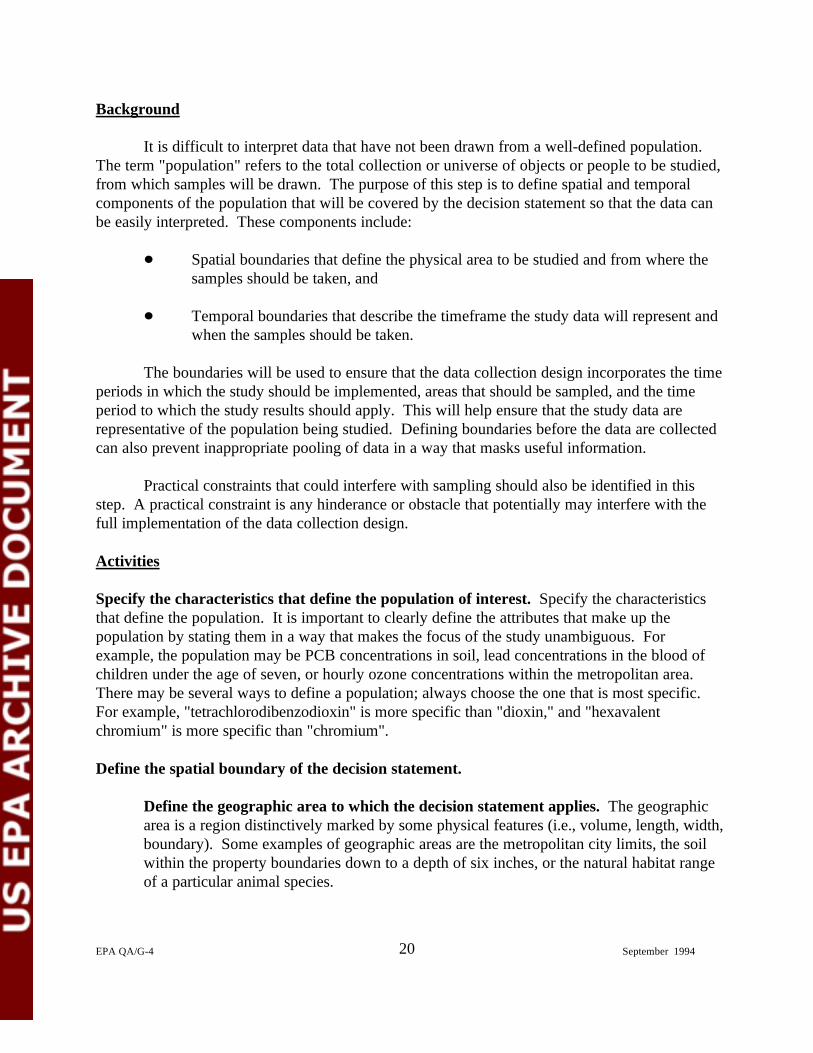
It is difficult to interpret data that have not been drawn from a well-defined population. The term "population" refers to the total collection or universe of objects or people to be studied,from which samples will be drawn. The purpose of this step is to define spatial and temporalcomponents of the population that will be covered by the decision statement so that the data canbe easily interpreted. These components include:
Spatial boundaries that define the physical area to be studied and from where thesamples should be taken, and
Temporal boundaries that describe the timeframe the study data will represent andwhen the samples should be taken.
The boundaries will be used to ensure that the data collection design incorporates the timeperiods in which the study should be implemented, areas that should be sampled, and the timeperiod to which the study results should apply. This will help ensure that the study data arerepresentative of the population being studied. Defining boundaries before the data are collectedcan also prevent inappropriate pooling of data in a way that masks useful information.
Practical constraints that could interfere with sampling should also be identified in thisstep. A practical constraint is any hinderance or obstacle that potentially may interfere with thefull implementation of the data collection design.
Activities
Specify the characteristics that define the population of interest. Specify the characteristicsthat define the population. It is important to clearly define the attributes that make up thepopulation by stating them in a way that makes the focus of the study unambiguous. Forexample, the population may be PCB concentrations in soil, lead concentrations in the blood ofchildren under the age of seven, or hourly ozone concentrations within the metropolitan area. There may be several ways to define a population; always choose the one that is most specific. For example, "tetrachlorodibenzodioxin" is more specific than "dioxin," and "hexavalentchromium" is more specific than "chromium".
Define the spatial boundary of the decision statement.
Define the geographic area to which the decision statement applies. The geographicarea is a region distinctively marked by some physical features (i.e., volume, length, width,boundary). Some examples of geographic areas are the metropolitan city limits, the soilwithin the property boundaries down to a depth of six inches, or the natural habitat rangeof a particular animal species.

21EPA QA/G-4 September 1994
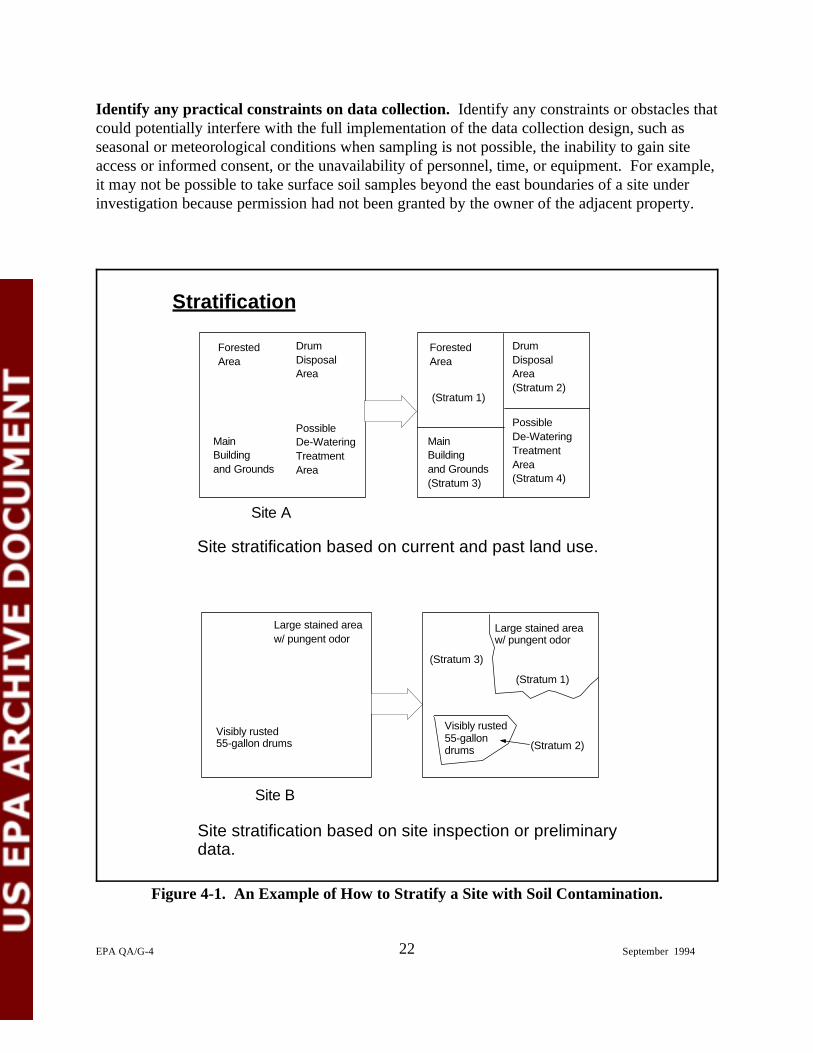
When appropriate, divide the population into strata that have relativelyhomogeneous characteristics. Using existing information, stratify or segregate theelements of the population into subsets or categories that exhibit relatively homogeneousproperties or characteristics that may have an influence on the outcome of the study, suchas contaminant concentrations, age, or height. Dividing the population into strata isdesirable for studying sub-populations, reducing variability within subsets of data, orreducing the complexity of the problem by breaking it into more manageable pieces. SeeFigure 4-1 for an example of how to stratify a site with soil contamination.
Define the temporal boundary of the problem.
Determine the timeframe to which the decision applies. It may not be possible tocollect data over the full time period to which the decision will apply. Therefore theplanning team should determine the timeframe that the data should reflect; for example,"The data will reflect the condition of contaminant leaching into ground water over aperiod of a hundred years," or "The data will be used to reflect the risk conditions of anaverage resident over their average length of residence which is estimated to be eightyears." Timeframes should be defined for the overall population and any sub-populationsof interest.
Determine when to collect data. Conditions may vary over the course of a study, whichmay affect the success of data collection and the interpretation of data results. Thesefactors may include weather, temperature, humidity, or amount of sunlight and wind. Determine when conditions will be most favorable for collecting data and select the mostappropriate time period to collect data that reflect those conditions. For example, a studyto measure ambient airborne particulate matter may give misleading information if thesampling is conducted in the wetter winter months rather than the drier summer months.
Define the scale of decision making. Define the smallest, most appropriate subsets of thepopulation (sub-populations) for which decisions will be made based on the spatial or temporalboundaries. For example, in a study where the decision statement is, "Determine whether or notthe concentration of lead in soil poses an unacceptable health risk to children and requiresremediation", the geographic area is the top six inches of soil within the property boundaries, andthe population is the lead concentration in surface soil. The scale of decision making could be setto an area which has a size that corresponds to the area where children derive the majority of theirexposure (such as a play area or an average residential lot size if the future land use will beresidential). Studying the site at this scale will be protective of children, a sensitive population inrisk assessment. A temporal scale of decision making might be necessary for other types ofstudies. For example, in order to regulate water quality, it would be useful to set a scale ofdecision making that limits the time between sampling events. This would minimize the potentialadverse effects in case the water quality was degraded between sampling events.
Forested Area
DrumDisposal Area(Stratum 2)
MainBuilding and Grounds(Stratum 3)
PossibleDe-Watering TreatmentArea(Stratum 4)
Stratification
Forested Area
DrumDisposal Area
MainBuilding and Grounds
PossibleDe-Watering TreatmentArea
Site stratification based on current and past land use.
Site stratification based on site inspection or preliminary data.
Large stained area w/ pungent odor
Visibly rusted 55-gallon drums
Large stained area w/ pungent odor
(Stratum 1)
(Stratum 3)
(Stratum 1)
Visibly rusted 55-gallon drums (Stratum 2)
Site A
Site B
22EPA QA/G-4 September 1994
Identify any practical constraints on data collection. Identify any constraints or obstacles thatcould potentially interfere with the full implementation of the data collection design, such asseasonal or meteorological conditions when sampling is not possible, the inability to gain siteaccess or informed consent, or the unavailability of personnel, time, or equipment. For example,it may not be possible to take surface soil samples beyond the east boundaries of a site underinvestigation because permission had not been granted by the owner of the adjacent property.
Figure 4-1. An Example of How to Stratify a Site with Soil Contamination.
THE DATA QUALITY OBJECTIVES PROCESS
State the Problem
Identify the Decision
Identify Inputs to the Decision
Define the Study Boundaries
Develop a Decision Rule
Specify Limits on Decision Errors
Optimize the Design for Obtaining Data
DEVELOP A DECISION RULE
Purpose
To define the parameter of interest, specify the action level, and integrate previous DQO outputsinto a single statement that describes a logicalbasis for choosing among alternative actions.
Activities
Specify the statistical parameter that characterizes the population.
Specify the action level for the study.
Combine the outputs of the previous DQO steps into an "if . . . then . . ." decision rule that defines the conditions that would cause the decision maker to choose among alternative actions.
23EPA QA/G-4 September 1994
CHAPTER 5
STEP 5: DEVELOP A DECISION RULE
Purpose
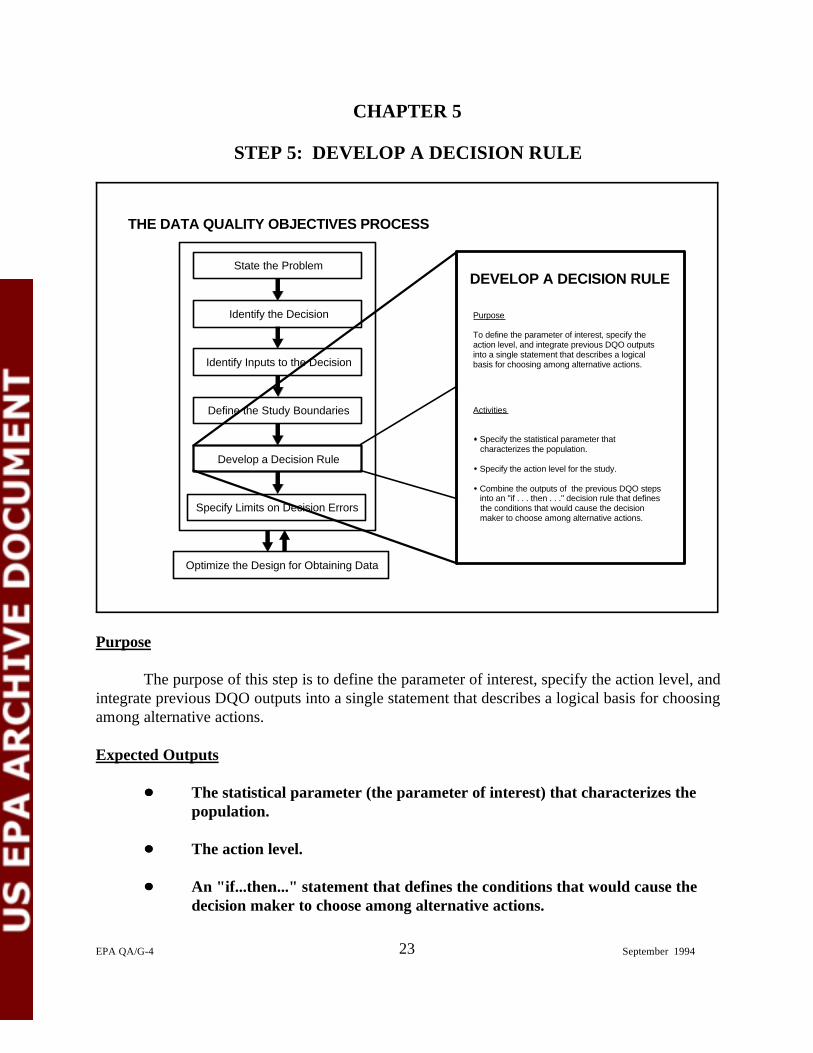
The purpose of this step is to define the parameter of interest, specify the action level, andintegrate previous DQO outputs into a single statement that describes a logical basis for choosingamong alternative actions.
Expected Outputs
The statistical parameter (the parameter of interest) that characterizes thepopulation.
The action level.
An "if...then..." statement that defines the conditions that would cause thedecision maker to choose among alternative actions.
24EPA QA/G-4 September 1994
Background
The decision rule summarizes what attributes the decision maker wants to know about thepopulation and how that knowledge would guide the selection of a course of action to solve theproblem. The Decision Rule step combines criteria from past steps with the parameter of interest(statistical characteristic of the population) and the action level to provide a concise description ofwhat action will be taken based on the results of the data collection.
There are four main elements to a decision rule:
(1) The parameter of interest, a descriptive measure (such as a mean, median, orproportion) that specifies the characteristic or attribute that the decision makerwould like to know about the statistical population. The purpose of the datacollection design is to produce environmental data that can be used to develop areasonable estimate of the population parameter.
(2) The scale of decision making, the smallest, most appropriate subset (sub-population) for which separate decisions will be made. (The scale of decisionmaking was defined in Step 4: Define the Boundaries of the Study.)
(3) The action level, a measurement threshold value of the parameter of interest thatprovides the criterion for choosing among alternative actions. The action level canbe based on regulatory standards, an exposure assessment, technology basedlimits, or reference-based standards.
(4) The alternative actions, the actions that the decision maker would take, dependingon the true value of the parameter of interest. (The alternative actions wereidentified in Step 2: Identify the Decision.)
Activities
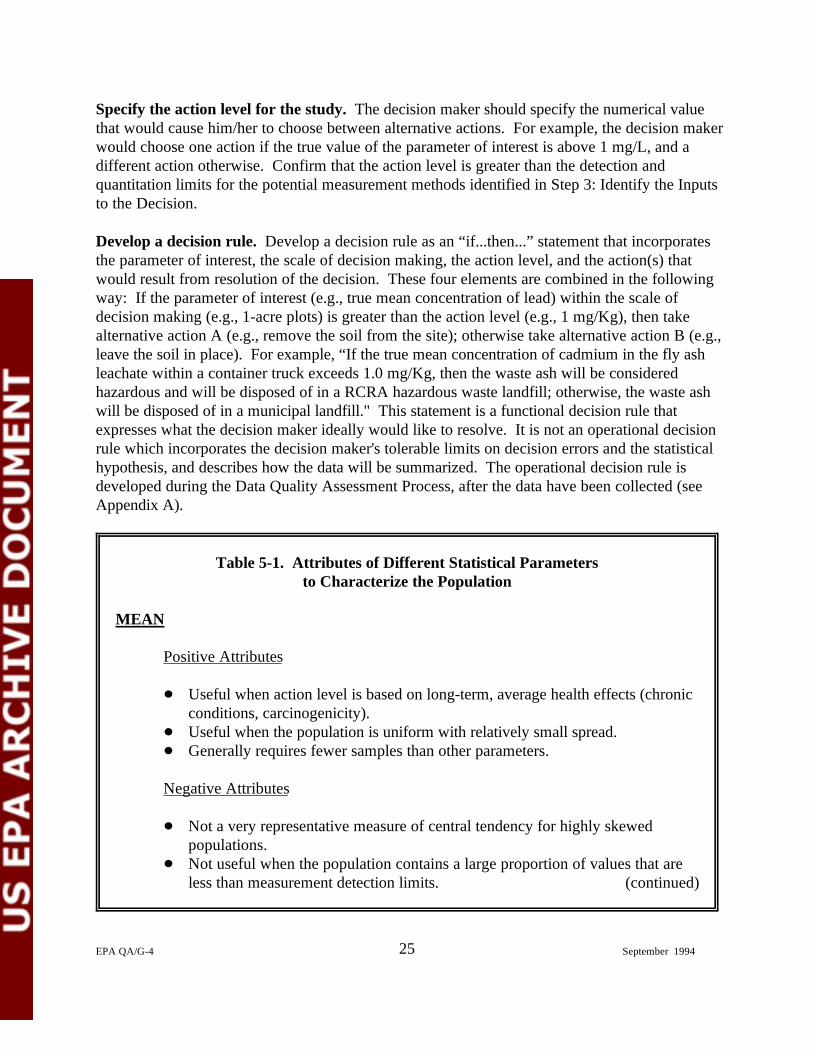
Specify the statistical parameter that characterizes the population (the parameter ofinterest). The planning team should specify the parameter of interest (such as the mean, median,or percentile) whose true value the decision maker would like know and that the data willestimate. For example, to determine if the contamination level at a given site exceeds an actionlevel, the planning team must specify the parameter that will be evaluated with respect to theaction level (e.g., the mean concentration). Some regulations specify the parameter, but if this isnot the case, it may be necessary to consult with a statistician to help select a parameter that isconsistent with the intended application. Recognize that the parameter that is chosen in this stepmay be changed to an equivalent descriptive measure as more information becomes availablebased on statistical considerations in Step 7 of the DQO Process and in the Data QualityAssessment Process. Information about positive and negative attributes of commonly usedparameters is provided at the end of this chapter.
25EPA QA/G-4 September 1994
Specify the action level for the study. The decision maker should specify the numerical valuethat would cause him/her to choose between alternative actions. For example, the decision makerwould choose one action if the true value of the parameter of interest is above 1 mg/L, and adifferent action otherwise. Confirm that the action level is greater than the detection andquantitation limits for the potential measurement methods identified in Step 3: Identify the Inputsto the Decision.
Develop a decision rule. Develop a decision rule as an “if...then...” statement that incorporatesthe parameter of interest, the scale of decision making, the action level, and the action(s) thatwould result from resolution of the decision. These four elements are combined in the followingway: If the parameter of interest (e.g., true mean concentration of lead) within the scale ofdecision making (e.g., 1-acre plots) is greater than the action level (e.g., 1 mg/Kg), then takealternative action A (e.g., remove the soil from the site); otherwise take alternative action B (e.g.,leave the soil in place). For example, “If the true mean concentration of cadmium in the fly ashleachate within a container truck exceeds 1.0 mg/Kg, then the waste ash will be consideredhazardous and will be disposed of in a RCRA hazardous waste landfill; otherwise, the waste ashwill be disposed of in a municipal landfill." This statement is a functional decision rule thatexpresses what the decision maker ideally would like to resolve. It is not an operational decisionrule which incorporates the decision maker's tolerable limits on decision errors and the statisticalhypothesis, and describes how the data will be summarized. The operational decision rule isdeveloped during the Data Quality Assessment Process, after the data have been collected (seeAppendix A).
Table 5-1. Attributes of Different Statistical Parametersto Characterize the Population
MEAN
Positive Attributes
Useful when action level is based on long-term, average health effects (chronicconditions, carcinogenicity).Useful when the population is uniform with relatively small spread.Generally requires fewer samples than other parameters.
Negative Attributes
Not a very representative measure of central tendency for highly skewedpopulations.Not useful when the population contains a large proportion of values that areless than measurement detection limits. (continued)
26EPA QA/G-4 September 1994
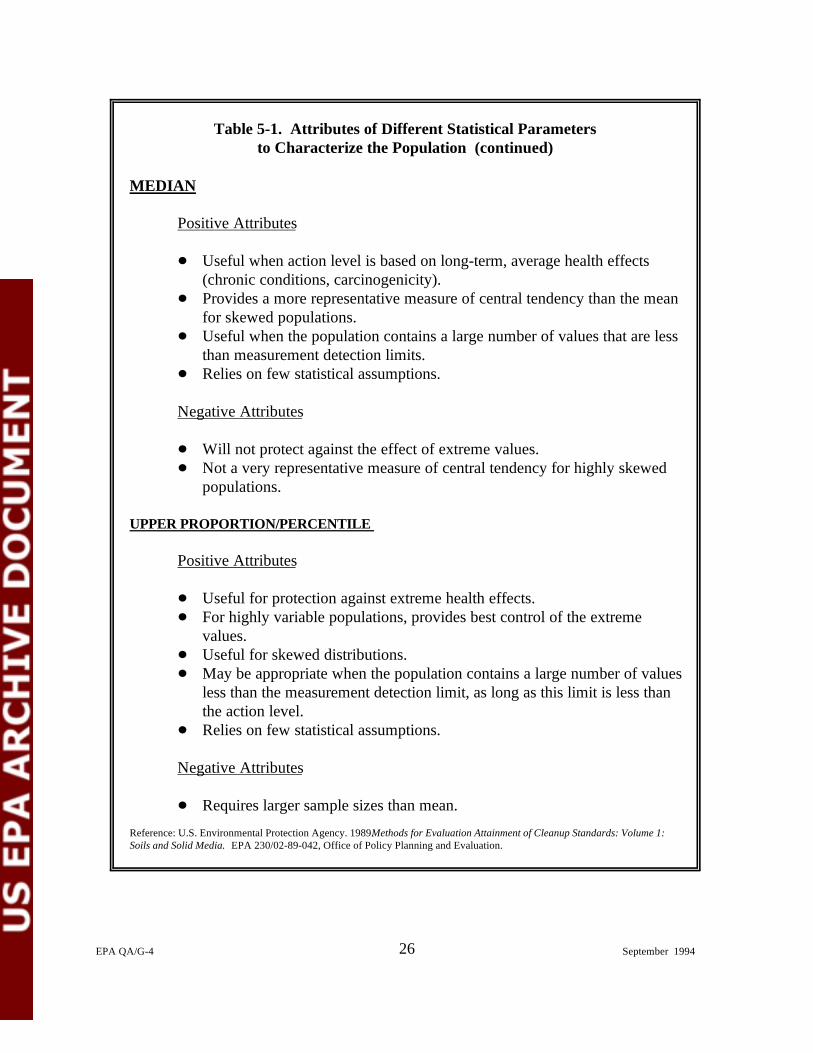
Table 5-1. Attributes of Different Statistical Parameters
to Characterize the Population (continued)
MEDIAN
Positive Attributes
Useful when action level is based on long-term, average health effects(chronic conditions, carcinogenicity).Provides a more representative measure of central tendency than the meanfor skewed populations.Useful when the population contains a large number of values that are lessthan measurement detection limits.Relies on few statistical assumptions.
Negative Attributes
Will not protect against the effect of extreme values.Not a very representative measure of central tendency for highly skewedpopulations.
UPPER PROPORTION/PERCENTILE
Positive Attributes
Useful for protection against extreme health effects.For highly variable populations, provides best control of the extremevalues.Useful for skewed distributions.May be appropriate when the population contains a large number of valuesless than the measurement detection limit, as long as this limit is less thanthe action level.Relies on few statistical assumptions.
Negative Attributes
Requires larger sample sizes than mean.
Reference: U.S. Environmental Protection Agency. 1989. Methods for Evaluation Attainment of Cleanup Standards: Volume 1:Soils and Solid Media. EPA 230/02-89-042, Office of Policy Planning and Evaluation.
Purpose
To specify the decision maker's tolerable limits on decision errors.
SPECIFY LIMITSON DECISION ERRORS
Activities
Determine the possible range of the parameter of interest.
Identify the decision errors and choose the null hypothesis.
Specify a range of possible parameter values where the consequences of decision errors are relatively minor (gray region).
Assign probability values to points above and below the action level that reflect the tolerable probability for the occurrence of decision errors.
THE DATA QUALITY OBJECTIVES PROCESS
State the Problem
Identify the Decision
Identify Inputs to the Decision
Define the Study Boundaries
Develop a Decision Rule
Specify Limits on Decision Errors
Optimize the Design for Obtaining Data
27EPA QA/G-4 September 1994
CHAPTER 6
STEP 6: SPECIFY TOLERABLE LIMITS ON DECISION ERRORS
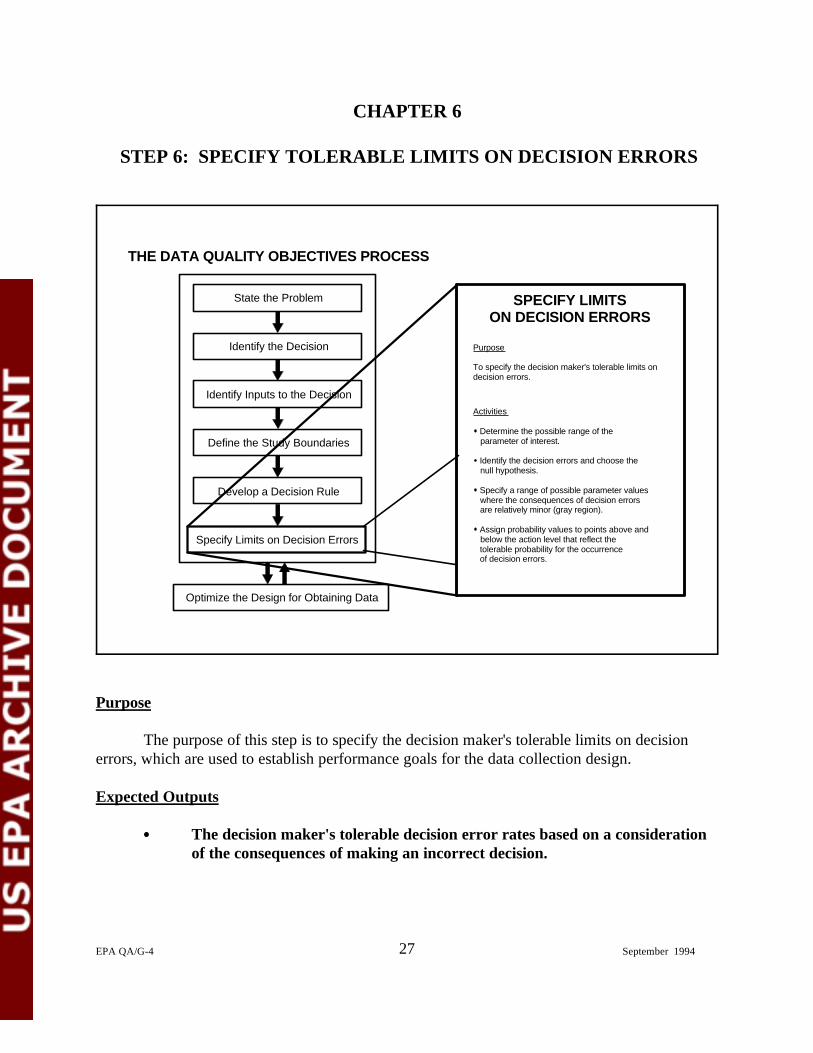
Purpose
The purpose of this step is to specify the decision maker's tolerable limits on decisionerrors, which are used to establish performance goals for the data collection design.
Expected Outputs
The decision maker's tolerable decision error rates based on a considerationof the consequences of making an incorrect decision.
28EPA QA/G-4 September 1994
Background
Decision makers are interested in knowing the true state of some feature of theenvironment. Since data can only estimate this state, decisions that are based on measurementdata could be in error (decision error). Most of the time the correct decision will be made;however, this chapter will focus on controlling the less likely possibility of making a decisionerror. The goal of the planning team is to develop a data collection design that reduces thechance of making a decision error to a tolerable level. This step of the DQO Process will providea mechanism for allowing the decision maker to define tolerable limits on the probability ofmaking a decision error.
There are two reasons why the decision maker cannot know the true value of a populationparameter (i.e., the true state of some feature of the environment):
(1) The population of interest almost always varies over time and space. Limitedsampling will miss some features of this natural variation because it is usuallyimpossible or impractical to measure every point of a population. Sampling designerror occurs when the sampling design is unable to capture the complete extent ofnatural variability that exists in the true state of the environment.
(2) Analytical methods and instruments are never absolutely perfect, hence ameasurement can only estimate the true value of an environmental sample. Measurement error refers to a combination of random and systematic errors thatinevitably arise during the various steps of the measurement process (for example,sample collection, sample handling, sample preparation, sample analysis, datareduction, and data handling).
The combination of sampling design error and measurement error is called total studyerror, which may lead to a decision error. Since it is impossible to eliminate error in measurementdata, basing decisions on measurement data will lead to the possibility of making a decision error.
The probability of decision errors can be controlled by adopting a scientific approach. Inthis approach, the data are used to select between one condition of the environment (the nullhypothesis, H ) and an alternative condition (the alternative hypothesis, H ). The null hypothesiso a
is treated like a baseline condition that is presumed to be true in the absence of strong evidence tothe contrary. This feature provides a way to guard against making the decision error that thedecision maker considers to have the more undesirable consequences.
A decision error occurs when the decision maker rejects the null hypothesis when it istrue, or fails to reject the null hypothesis when it is false. These two types of decision errors areclassified as false positive and false negative decision errors, respectively. They are describedbelow.
Note that these definitions are not the same as false positive or false negative instrument readings, where similar1
terms are commonly used by laboratory or field personnel to describe a fault in a single result; false positive and falsenegative decision errors are defined in the context of hypothesis testing, where the terms are defined with respect to thenull hypothesis.
29EPA QA/G-4 September 1994
False Positive Decision Error — A false positive decision error occurs when the nullhypothesis (H ) is rejected when it is true. Consider an example where the decision makero
presumes that a certain waste is hazardous (i.e., the null hypothesis or baseline condition is "thewaste is hazardous"). If the decision maker concludes that there is insufficient evidence to classifythe waste as hazardous when it truly is hazardous, then the decision maker would make a falsepositive decision error. A statistician usually refers to the false positive error as a "Type I" error. The measure of the size of this error is called alpha ( ), the level of significance, or the size of thecritical region.
False Negative Decision Error — A false negative decision error occurs when the nullhypothesis is not rejected when it is false. In the above waste example, the false negative decisionerror occurs when the decision maker concludes that the waste is hazardous when it truly is nothazardous. A statistician usually refers to a false negative error as a "Type II" error. Themeasure of the size of this error is called beta ( ), and is also known as the complement of thepower of a hypothesis test.
The definition of false positive and false negative decision errors depends on the viewpointof the decision maker. Consider the viewpoint where a person has been presumed to be1
"innocent until proven guilty" (i.e., H is "innocent"; H is "guilty"). A false positive error wouldo a
be convicting an innocent person; a false negative error would be not convicting the guilty person. From the viewpoint where a person is presumed to be "guilty until proven innocent" (i.e., H iso
"guilty"; H is "innocent"), the errors are reversed. Here, the false positive error would be nota
convicting the guilty person, and the false negative error would be convicting the innocent person.
While the possibility of a decision error can never be totally eliminated, it can becontrolled. To control the possibility of making decision errors, the planning team must controltotal study error. There are many ways to accomplish this, including collecting a large number ofsamples (to control sampling design error), analyzing individual samples several times or usingmore precise laboratory methods (to control measurement error). Better sampling designs canalso be developed to collect data that more accurately and efficiently represent the population ofinterest. Every study will use a slightly different method of controlling decision errors, dependingon where the largest components of total study error exist in the data set and the ease of reducingthose error components. Reducing the probability of making decision errors generally increasescosts. In many cases controlling decision error within very small limits is unnecessary for makinga decision that satisfies the decision maker's needs. For instance, if the consequences of decisionerrors are minor, a reasonable decision could be made based on relatively crude data (data withhigh total study error). On the other hand, if the consequences of decision errors are severe, the
30EPA QA/G-4 September 1994
decision maker will want to control sampling design and measurement errors within very smalllimits.
To minimize unnecessary effort controlling decision errors, the planning team mustdetermine whether reducing sampling design and measurement errors is necessary to meet thedecision maker's needs. These needs are made explicit when the decision maker specifiesprobabilities of decision errors that are tolerable. Once these tolerable limits on decision errorsare defined, then the effort necessary to analyze and reduce sampling design and measurementerrors to satisfy these limits can be determined in Step 7: Optimize the Design for ObtainingData. It may be necessary to iterate between these two steps before finding tolerable probabilitiesof decision errors that are feasible given resource constraints.
Activities
Determine the possible range of the parameter of interest. Establish the possible range of theparameter of interest by estimating its likely upper and lower bounds. This will help focus theremaining activities of this step on only the relevant values of the parameter. For example, therange of the parameter shown in Figures 6-1 and 6-2 at the end of this chapter is between 50 and200 ppm. Historical and documented analytical data are of great help in establishing the potentialparameter range.
Identify the decision errors and choose the null hypothesis. Define where each decision erroroccurs relative to the action level and establish which decision error should be defined as the nullhypothesis (baseline condition). This process has four steps:
(1) Define both types of decision errors and establish the true state of nature for eachdecision error. Define both types of decision errors and determine which oneoccurs above and which one occurs below the action level. A decision erroroccurs when the data mislead the decision maker into concluding that theparameter of interest is on one side of the action level when the true value of theparameter is on the other side of the action level. For example, consider asituation in which a study is being conducted to determine if mercurycontamination is creating a health hazard and EPA wants to take action if morethan 5% of a population of fish have mercury levels above a risk-based actionlevel. In this case, a decision error would occur if the data lead the decision makerto conclude that 95% of the mercury levels found in the fish population werebelow the action level (i.e., the parameter is the "95th percentile" of mercury levelsin the fish population) when the true 95th percentile of mercury levels in the fishpopulation was above the action level (which means that more than 5% of the fishpopulation contain mercury levels greater than the action level). The otherdecision error for this example would be that the data lead the decision maker toconclude that the 95th percentile of mercury levels in the fish population is greaterthan the action level when the true 95th percentile is less than the action level.
31EPA QA/G-4 September 1994
The "true state of nature" is the actual condition or feature of the environment thatexists, but is unknown to the decision maker. Each decision error consists of twoparts, the true state of nature and the conclusion that the decision maker draws.Using the example above, the true state of nature for the first decision error is thatthe 95th percentile of mercury levels in the fish population is above the actionlevel.
(2) Specify and evaluate the potential consequences of each decision error. Specifythe likely consequences of making each decision error and evaluate their potentialseverity in terms of economic and social costs, human health and ecologicaleffects, political and legal ramifications, and so on. Consider the alternativeactions that would be taken under each decision error scenario, as well assecondary effects of those actions. For example, in determining whether or not95% of a fish population contain mercury levels above a risk-based action level,there may be a variety of potential consequences of committing a decision error. In the first decision error described above, where the decision maker concludesthat the 95th percentile is below when the true 95th percentile was above theaction level, the decision maker may decide to continue to allow fishing in thewaters and not undertake any cleanup activity. The resulting consequences mightinclude human health and ecological effects from consumption of contaminatedfish by humans and other animals, economic and social costs of health care andfamily disruption, and damaged credibility of EPA when (and if) the decision erroris detected. If the other type of decision error is committed, where the decisionmaker decides that the 95th percentile exceeds the action level when the true 95thpercentile is below the action level, the decision maker might ban all fishing in thelocal waters and initiate cleanup activities. The consequences might includeeconomic and social costs of lost revenues and job displacement in the fishingindustry, damaged credibility for EPA when the cleanup activities expose thenature of the decision error, and the threat of lawsuits by fishing interests.
Evaluate the severity of potential consequences of decision errors at differentpoints within the domains of each type of decision error, since the severity ofconsequences may change as the parameter moves further away from the actionlevel. Consider whether or not the consequences change abruptly at some value,such as a threshold health effect level; the decision maker may want to change thetolerable limit on the decision error at such a point.
(3) Establish which decision error has more severe consequences near the actionlevel. Based on the evaluation of potential consequences of decision errors, thedecision maker should determine which decision error causes greater concernwhen the true parameter value is near the action level. It is important to focus onthe region near the action level because this is where the true parameter value ismost likely to be when a decision error is made (in other words, when the true
Note that this differs somewhat from the conventional use of hypothesis testing in the context of planned2
experiments. There, the alternative hypothesis usually corresponds to what the experimenter hopes to prove, and thenull hypothesis usually corresponds to some baseline condition that represents an "opposite" assumption. For instance,the experimenter may wish to prove that a new water treatment method works better than an existing accepted method. The experimenter might formulate the null hypothesis to correspond to "the new method performs no better than theaccepted method," and the alternative hypothesis as "the new method performs better than the accepted method." Theburden of proof would then be on the experimental data to show that the new method performs better than the acceptedmethod, and that this result is not due to chance.
32EPA QA/G-4 September 1994
parameter is far above or far below the action level, the data are much more likelyto indicate the correct decision). This determination typically involves valuejudgements about the relative severity of different types of consequences withinthe context of the problem. In the fish contamination problem above, the decisionmaker would weigh the potential health consequences from allowing people toconsume contaminated fish versus the economic and social disruption frombanning all fishing in the community. In this case, the decision maker mightcarefully consider how uncertain or conservative the risk-based action level is.
(4) Define the null hypothesis (baseline condition) and the alternative hypothesis andassign the terms "false positive" and "false negative" to the appropriate decisionerror. In problems that concern regulatory compliance, human health, orecological risk, the decision error that has the most adverse potential consequencesshould be defined as the null hypothesis (baseline condition). In statistical2
hypothesis testing, the data must conclusively demonstrate that the null hypothesisis false. That is, the data must provide enough information to authoritatively rejectthe null hypothesis (disprove the baseline condition) in favor of the alternative. Therefore, by setting the null hypothesis equal to the true state of nature that existswhen the more severe decision error occurs, the decision maker guards againstmaking the more severe decision error by placing the burden of proof ondemonstrating that the most adverse consequences will not be likely to occur.
It should be noted that the null and alternative hypotheses have beenpredetermined in many regulations. If not, the planning team should define the nullhypothesis (baseline condition) to correspond to the true state of nature for themore severe decision error and define the alternative hypothesis to correspond tothe true state of nature for the less severe decision error.
Using the definitions of null and alternative hypotheses, assign the term "falsepositive" to the decision error in which the decision maker rejects the nullhypothesis when it is true, which corresponds to the decision error with the moresevere consequences identified in task (3). Assign the term "false negative" to thedecision error in which the decision maker fails to reject the null hypothesis when itis false, which corresponds to the decision error with the less severe consequencesidentified in task (3).

33EPA QA/G-4 September 1994
Specify a range of possible parameter values where the consequences of decision errors arerelatively minor (gray region). The gray region is a range of possible parameter values wherethe consequences of a false negative decision error are relatively minor. The gray region isbounded on one side by the action level and on the other side by that parameter value where theconsequences of making a false negative decision error begin to be significant. Establish thisboundary by evaluating the consequences of not rejecting the null hypothesis when it is false. Theedge of the gray region should be placed where these consequences are severe enough to set alimit on the magnitude of this false negative decision error. Thus, the gray region is the areabetween this parameter value and the action level.
It is necessary to specify a gray region because variability in the population andunavoidable imprecision in the measurement system combine to produce variability in the datasuch that a decision may be "too close to call" when the true parameter value is very near theaction level. Thus, the gray region (or "area of uncertainty") establishes the minimum distancefrom the action level where the decision maker would like to begin to control false negativedecision errors. In statistics, the width of this interval is called the "minimum detectabledifference" and is often expressed as the Greek letter delta ( ). The width of the gray region is anessential part of the calculations for determining the number of samples needed to satisfy theDQOs, and represents one important aspect of the decision maker's concern for decision errors. A more narrow gray region implies a desire to detect conclusively the condition when the trueparameter value is close to the action level ("close" relative to the variability in the data). Whenthe true value of the parameter falls within the gray region, the decision maker may face a highprobability of making a false negative decision error, since the data may not provide conclusiveevidence for rejecting the null hypothesis, even though it is actually false (i.e., the data may be toovariable to allow the decision maker to recognize that the presumed baseline condition is, in fact,not true).
From a practical standpoint, the gray region is an area where it will not be feasible orreasonable to control the false negative decision error rate to low levels because of high costs. Given the resources that would be required to reliably detect small differences between the actionlevel and the true parameter value, the decision maker must balance the resources spent on datacollection with the expected consequences of making that decision error. For example, whentesting whether a parameter (such as the mean concentration) exceeds the action level, if the trueparameter is near the action level (relative to the expected variability of the data), then theimperfect data will tend to be clustered around the action level, with some values above the actionlevel and some below. In this situation, the likelihood of committing a false negative decisionerror will be large. To determine with confidence whether the true value of the parameter isabove or below the action level, the decision maker would need to collect a large amount of data,increase the precision of the measurements, or both. If taken to an extreme, the cost of collectingdata can exceed the cost of making a decision error, especially where the consequences of thedecision error may be relatively minor. Therefore, the decision maker should establish the grayregion, or the region where it is not critical to control the false negative decision error, by
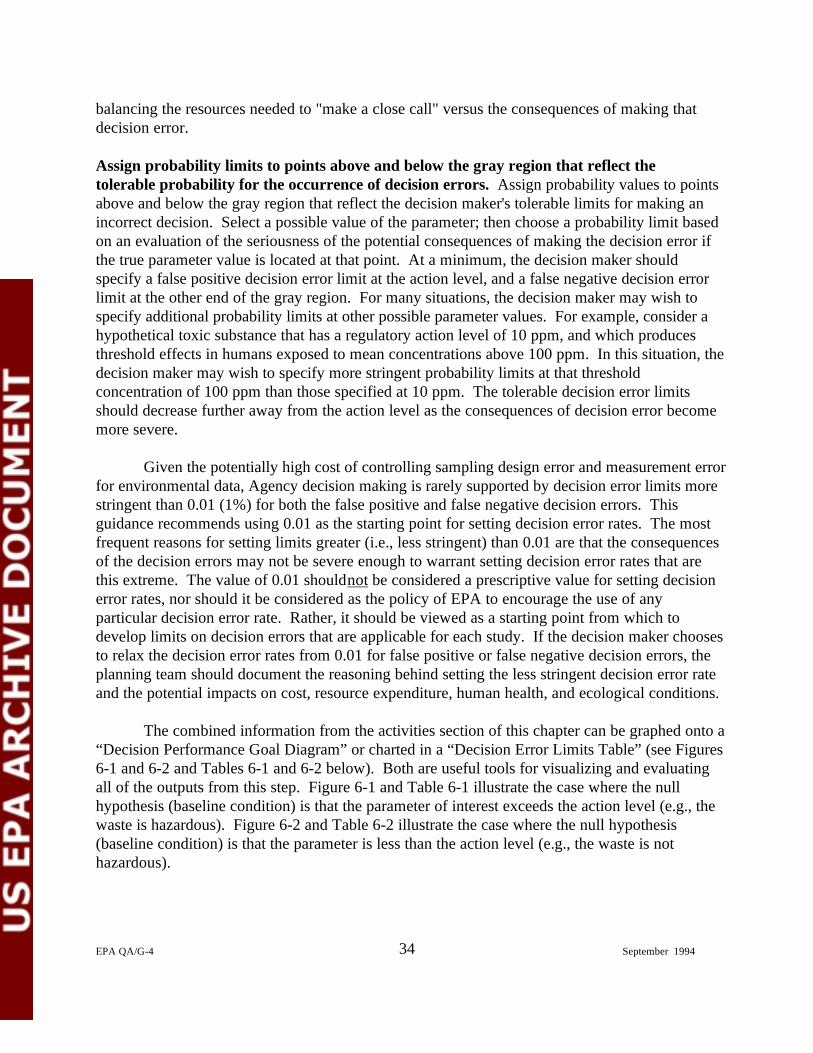
34EPA QA/G-4 September 1994
balancing the resources needed to "make a close call" versus the consequences of making thatdecision error.
Assign probability limits to points above and below the gray region that reflect thetolerable probability for the occurrence of decision errors. Assign probability values to pointsabove and below the gray region that reflect the decision maker's tolerable limits for making anincorrect decision. Select a possible value of the parameter; then choose a probability limit basedon an evaluation of the seriousness of the potential consequences of making the decision error ifthe true parameter value is located at that point. At a minimum, the decision maker shouldspecify a false positive decision error limit at the action level, and a false negative decision errorlimit at the other end of the gray region. For many situations, the decision maker may wish tospecify additional probability limits at other possible parameter values. For example, consider ahypothetical toxic substance that has a regulatory action level of 10 ppm, and which producesthreshold effects in humans exposed to mean concentrations above 100 ppm. In this situation, thedecision maker may wish to specify more stringent probability limits at that thresholdconcentration of 100 ppm than those specified at 10 ppm. The tolerable decision error limitsshould decrease further away from the action level as the consequences of decision error becomemore severe.
Given the potentially high cost of controlling sampling design error and measurement errorfor environmental data, Agency decision making is rarely supported by decision error limits morestringent than 0.01 (1%) for both the false positive and false negative decision errors. Thisguidance recommends using 0.01 as the starting point for setting decision error rates. The mostfrequent reasons for setting limits greater (i.e., less stringent) than 0.01 are that the consequencesof the decision errors may not be severe enough to warrant setting decision error rates that arethis extreme. The value of 0.01 should not be considered a prescriptive value for setting decisionerror rates, nor should it be considered as the policy of EPA to encourage the use of anyparticular decision error rate. Rather, it should be viewed as a starting point from which todevelop limits on decision errors that are applicable for each study. If the decision maker choosesto relax the decision error rates from 0.01 for false positive or false negative decision errors, theplanning team should document the reasoning behind setting the less stringent decision error rateand the potential impacts on cost, resource expenditure, human health, and ecological conditions.
The combined information from the activities section of this chapter can be graphed onto a“Decision Performance Goal Diagram” or charted in a “Decision Error Limits Table” (see Figures6-1 and 6-2 and Tables 6-1 and 6-2 below). Both are useful tools for visualizing and evaluatingall of the outputs from this step. Figure 6-1 and Table 6-1 illustrate the case where the nullhypothesis (baseline condition) is that the parameter of interest exceeds the action level (e.g., thewaste is hazardous). Figure 6-2 and Table 6-2 illustrate the case where the null hypothesis (baseline condition) is that the parameter is less than the action level (e.g., the waste is nothazardous).
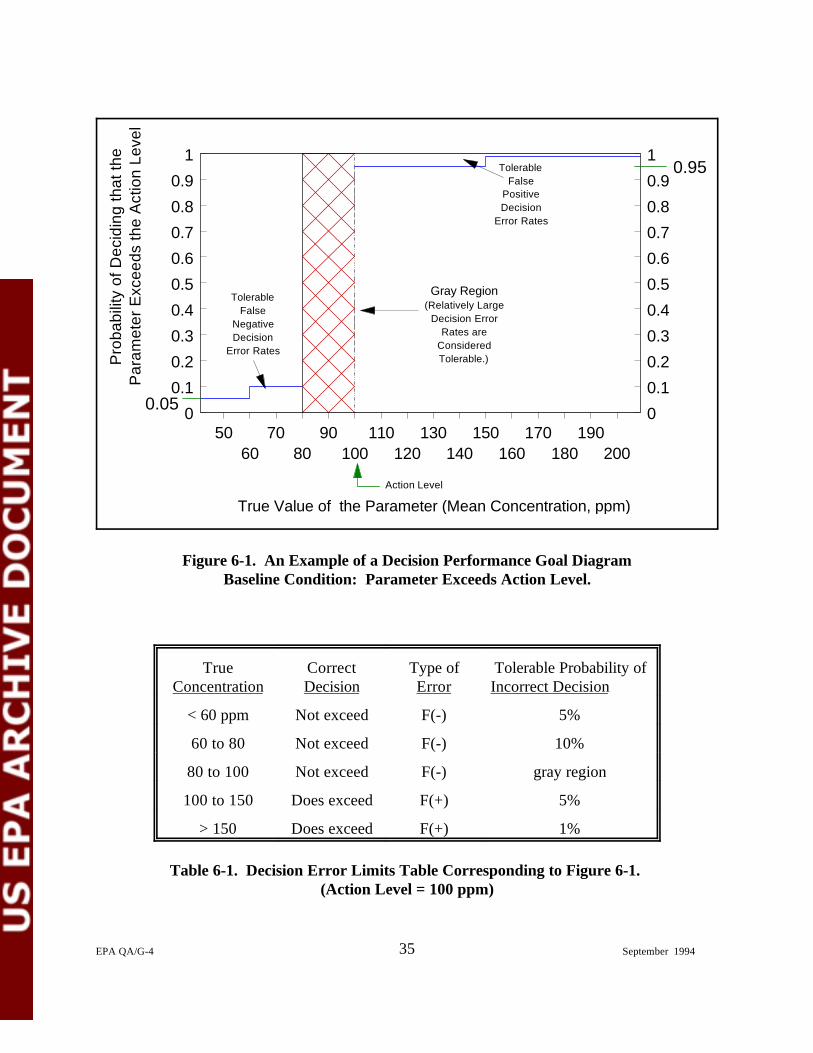
5060
7080
90100
110120
130140
150160
170180
190200
0
0.1
0.2
0.3
0.4
0.5
0.6
0.7
0.8
0.9
1
0
0.1
0.2
0.3
0.4
0.5
0.6
0.7
0.8
0.9
1Tolerable
FalsePositiveDecision
Error Rates
TolerableFalse
NegativeDecision
Error Rates
Gray Region(Relatively Large
Decision ErrorRates are
ConsideredTolerable.)
Action Level
Pro
babi
lity
of D
ecid
ing
that
the
Par
amet
er E
xcee
ds th
e A
ctio
n Le
vel
True Value of the Parameter (Mean Concentration, ppm)
0.05
0.95
35EPA QA/G-4 September 1994
Figure 6-1. An Example of a Decision Performance Goal DiagramBaseline Condition: Parameter Exceeds Action Level.
True Correct Type of Tolerable Probability ofConcentration Decision Error Incorrect Decision
< 60 ppm Not exceed F(-) 5%
60 to 80 Not exceed F(-) 10%
80 to 100 Not exceed F(-) gray region
100 to 150 Does exceed F(+) 5%
> 150 Does exceed F(+) 1%
Table 6-1. Decision Error Limits Table Corresponding to Figure 6-1. (Action Level = 100 ppm)

5060
7080
90100
110120
130140
150160
170180
190200
0
0.1
0.2
0.3
0.4
0.5
0.6
0.7
0.8
0.9
1
0
0.1
0.2
0.3
0.4
0.5
0.6
0.7
0.8
0.9
1
TolerableFalse
PositiveDecision
Error Rates
TolerableFalse
NegativeDecision
Error Rates
Gray Region(Relatively Large
Decision ErrorRates are
ConsideredTolerable.)
Action Level
Pro
babi
lity
of D
ecid
ing
that
the
Par
amet
er E
xcee
ds th
e A
ctio
n Le
vel
True Value of the Parameter (Mean Concentration, ppm)
0.05
0.95
36EPA QA/G-4 September 1994
Figure 6-2. An Example of a Decision Performance Goal DiagramBaseline Condition: Parameter is Less Than Action Level.
True Correct Type of Tolerable Probability ofConcentration Decision Error Incorrect Decision
< 60 ppm Not exceed F(+) 5%
60 to 100 Not exceed F(+) 10%
100 to 120 Does exceed F(-) gray region
120 to 150 Does exceed F(-) 20%
> 150 Does exceed F(-) 5%
Table 6-2. Decision Error Limits Table Corresponding to Figure 6-2.(Action Level = 100 ppm).
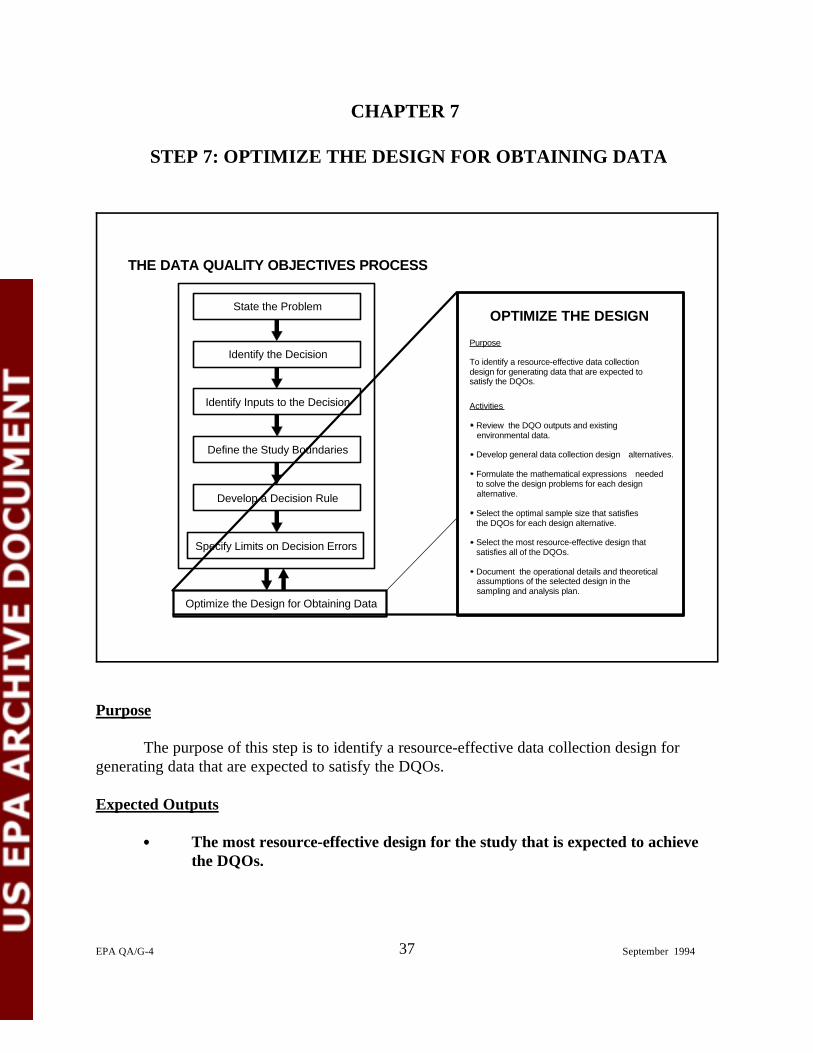
THE DATA QUALITY OBJECTIVES PROCESS
State the Problem
Identify the Decision
Identify Inputs to the Decision
Define the Study Boundaries
Develop a Decision Rule
Specify Limits on Decision Errors
Optimize the Design for Obtaining Data
Purpose
To identify a resource-effective data collection design for generating data that are expected tosatisfy the DQOs.
OPTIMIZE THE DESIGN
Activities
Review the DQO outputs and existing environmental data.
Develop general data collection design alternatives.
Formulate the mathematical expressions needed to solve the design problems for each design alternative.
Select the optimal sample size that satisfies the DQOs for each design alternative.
Select the most resource-effective design that satisfies all of the DQOs.
Document the operational details and theoretical assumptions of the selected design in the sampling and analysis plan.
37EPA QA/G-4 September 1994
CHAPTER 7
STEP 7: OPTIMIZE THE DESIGN FOR OBTAINING DATA
Purpose
The purpose of this step is to identify a resource-effective data collection design forgenerating data that are expected to satisfy the DQOs.
Expected Outputs
The most resource-effective design for the study that is expected to achievethe DQOs.
38EPA QA/G-4 September 1994
Background
In this step, statistical techniques are used to develop alternative data collection designsand evaluate their efficiency in meeting the DQOs. To develop the optimal design for this study,it may be necessary to work through this step more than once after revisiting previous steps of theDQO Process.
The objective of this step is to identify the most resource-effective data collection designexpected to generate data that satisfy the DQOs specified in the preceding steps. While a fullexplanation of the procedures for developing a data collection design is beyond the scope of thisguidance document, it does provide a broad overview of the steps that need to be accomplished toreach this goal. The example in Appendix B illustrates some of these activities in more detail.
Activities
Review the DQO outputs and existing environmental data. Review the DQO outputsgenerated in the preceding six steps to ensure that they are internally consistent. The DQOsshould provide a succinct collection of information on the context of, requirements for, andconstraints on the data collection design. Review existing data in more detail if it appears thatthey can be used to support the data collection design (e.g., analyze the variability in existing dataif they appear to provide good information about the variance for the new data). If existing dataare going to be combined with new data to support the decision, then determine if there are anygaps that can be filled or deficiencies that might be mitigated by including appropriate features inthe new data collection design.
Develop general data collection design alternatives. Develop alternative data collection andanalysis designs based on the DQO outputs and other relevant information, such as historicalpatterns of contaminant deposition, estimates of variance, and technical characteristics of thecontaminants and media. Generally, the goal is to find cost-effective alternatives that balancesample size and measurement performance, given the feasible choices for sample collectiontechniques and analytical methods. In some cases where there is a relatively high spatial ortemporal variability, it may be more cost-effective to use less expensive yet less precise analyticalmethods so that a relatively large number of samples can be taken, thereby controlling thesampling design error component of total study error. In other cases where the contaminantdistribution is relatively homogeneous, or the action level is very near the method detection limit,it may be more cost-effective to use more expensive yet more precise and/or more sensitiveanalytical methods and collect fewer samples, thereby controlling the analytical measurement errorcomponent of total study error. Examples of general data collection design alternatives include:
factorial design sequential random samplingsimple random sampling systematic samplingstratified random sampling composite sampling (in conjunction
with another sampling design)
In this guidance, the performance curve is based on either the power curve or the complement of the power curve. 1
This ensures that the performance curve always rises from left to right.
39EPA QA/G-4 September 1994
Formulate the mathematical expressions needed to solve the design problem for each datacollection design alternative. Develop the following three mathematical expressions needed tooptimize the data collection design as follows:
(1) Define a suggested method for testing the statistical hypothesis and define asample size formula that corresponds to the method if one exists(e.g., a Student's t-test).
(2) Develop a statistical model that describes the relationship of the measuredvalue to the "true" value. Often the model will describe the components oferror or bias that are believed to exist in the measured value.
(3) Develop a cost function that relates the number of samples to the total costof sampling and analysis.
Select the optimal sample size that satisfies the DQOs for each data collection designalternative. Using the mathematical expressions from the previous activity, solve for the optimalsample size that satisfies the DQOs, including the decision maker's limits on decision errors. If nodesign will meet the limits on decision errors within the budget or other constraints, then theplanning team will need to relax one or more constraints. For example:
increase the budget for sampling and analysis;increase the width of the gray region;increase the tolerable decision error rates;relax other project constraints, such as the schedule; orchange the boundaries; it may be possible to reduce sampling and analysis costs bychanging or eliminating subgroups that will require separate decisions.
Select the most resource-effective data collection design that satisfies all of the DQOs. Evaluate the design options based on cost and ability to meet the DQO constraints. Choose theone that provides the best balance between cost (or expected cost) and ability to meet the DQOs.
The statistical concept of a power function is extremely useful in investigating theperformance of alternative designs. The power function is the probability of rejecting the nullhypothesis (H ) when the null hypothesis is false (i.e., the alternative condition is true). If thereo
was no error associated with a decision, the ideal power function would be 0 if H were true, ando
1 if H were false. Since decisions are based on imperfect data, however, it is impossible too
achieve this ideal power function. Instead, the power function will most likely yield values thatare small when H is true and large when H is false. A performance curve is based on the grapho o
of the power function. The performance curve can be overlaid into the Decision Performance 1
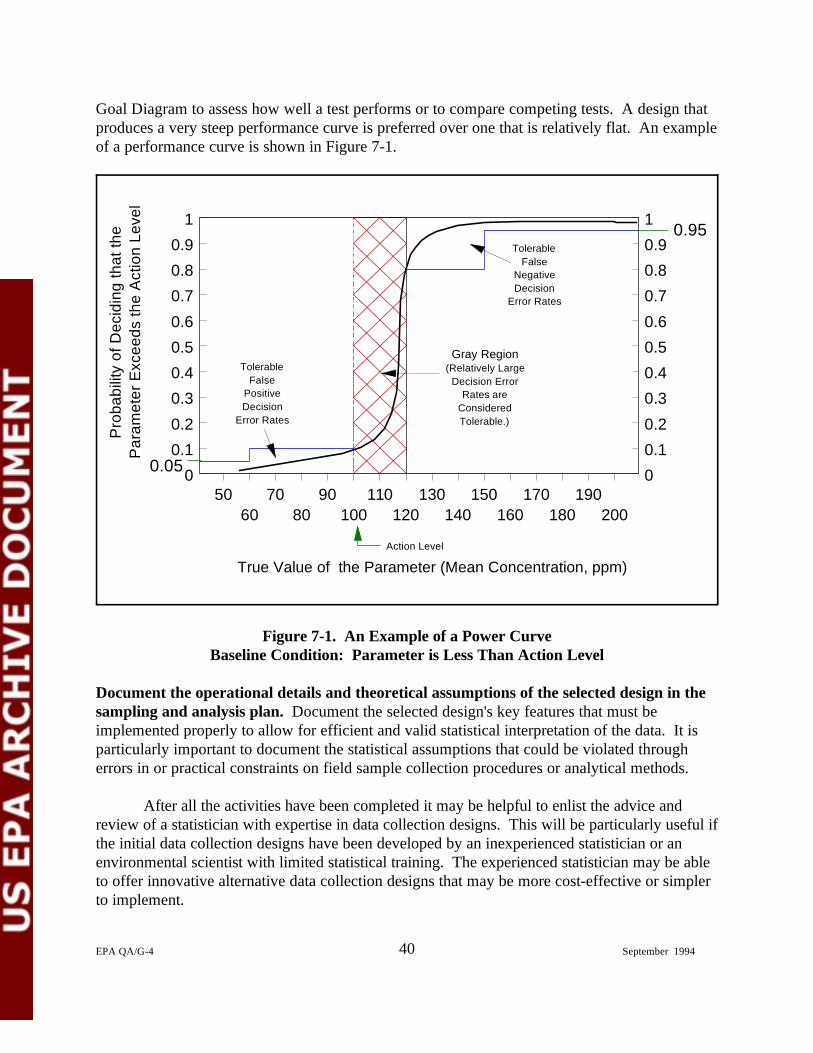
5060
7080
90100
110120
130140
150160
170180
190200
0
0.1
0.2
0.3
0.4
0.5
0.6
0.7
0.8
0.9
1
0
0.1
0.2
0.3
0.4
0.5
0.6
0.7
0.8
0.9
1
TolerableFalse
PositiveDecision
Error Rates
TolerableFalse
NegativeDecision
Error Rates
Gray Region(Relatively Large
Decision ErrorRates are
ConsideredTolerable.)
Action Level
Pro
babi
lity
of D
ecid
ing
that
the
Par
amet
er E
xcee
ds th
e A
ctio
n Le
vel
True Value of the Parameter (Mean Concentration, ppm)
0.05
0.95
40EPA QA/G-4 September 1994
Goal Diagram to assess how well a test performs or to compare competing tests. A design thatproduces a very steep performance curve is preferred over one that is relatively flat. An exampleof a performance curve is shown in Figure 7-1.
Figure 7-1. An Example of a Power CurveBaseline Condition: Parameter is Less Than Action Level
Document the operational details and theoretical assumptions of the selected design in thesampling and analysis plan. Document the selected design's key features that must beimplemented properly to allow for efficient and valid statistical interpretation of the data. It isparticularly important to document the statistical assumptions that could be violated througherrors in or practical constraints on field sample collection procedures or analytical methods.
After all the activities have been completed it may be helpful to enlist the advice andreview of a statistician with expertise in data collection designs. This will be particularly useful ifthe initial data collection designs have been developed by an inexperienced statistician or anenvironmental scientist with limited statistical training. The experienced statistician may be ableto offer innovative alternative data collection designs that may be more cost-effective or simplerto implement.
41EPA QA/G-4 September 1994
BIBLIOGRAPHY
Bates, D.J., R.O. Gilbert, N.L. Hassig, R.F. O'Brien, B.A. Pulsipher. November 1993. Decision Performance Criteria: The Driver Behind the Data Quality Objectives Process, AStatistical Introduction (Draft). Battelle Pacific Northwest Laboratory, Richland,Washington.
Cochran, W. 1977. Sampling Techniques. New York: John Wiley.
Desu, M.M., and D. Raghavarao. 1990. Sample Size Methodology. San Diego, CA: AcademicPress.
Gilbert, Richard O. 1987. Statistical Methods for Environmental Pollution Monitoring. NewYork: Von Nostrand Reinhold.
Guenther, William C. 1977. Sampling Inspection in Statistical Quality Control. Griffin'sStatistical Monographs and Courses, No. 37, London: Charles Griffin.
Guenther, William C. 1981. "Sample Size Formulas for Normal Theory T Test." The AmericanStatistician. Vol. 35, No. 4.
U.S. Environmental Protection Agency. 1994. EPA Quality System Requirements forEnvironmental Programs. EPA QA/R-1.
U.S. Environmental Protection Agency. 1994. EPA Requirements for Quality Assurance ProjectPlans for Environmental Data Operations. EPA QA/R-5.
U.S. Environmental Protection Agency. 1994. EPA Requirements for Quality Management Plans. EPA QA/R-2.
U.S. Environmental Protection Agency. 1994. Guidance for Data Quality Assessments. EPAQA/G-9.
U.S. Environmental Protection Agency. 1993. Guidance for Planning in Support ofEnvironmental Decision Making Using the Data Quality Objectives Process (InterimFinal). Quality Assurance Management Staff.
U.S. Environmental Protection Agency. 1992. Statistical Methods for Evaluating theAttainment of Cleanup Standards: Volume III: Reference-Based Standards for Soils andSolid Media. EPA 230-R-94-004, Office of Policy, Planning and Evaluation.
42EPA QA/G-4 September 1994
U.S. Environmental Protection Agency. 1992. Methods for Evaluating the Attainment of Cleanup Standards: Volume 2: Ground Water. EPA 230-R-92-014, Office of Policy,Planning and Evaluation.
U.S. Environmental Protection Agency. 1989. Methods for Evaluating Attainment of Cleanup Standards: Volume 1: Soils and Solid Media. EPA 230/02-89-042, Office of Policy,Planning and Evaluation.
U.S. Environmental Protection Agency. 1986. Development of Data Quality Objectives, Description of Stages I and II. Quality Assurance Management Staff.
U.S. Environmental Protection Agency. April 1984. "Order 5360.1, Policy and Program Requirements to Implement the Mandatory Quality Assurance Program." Office of the
Administrator.
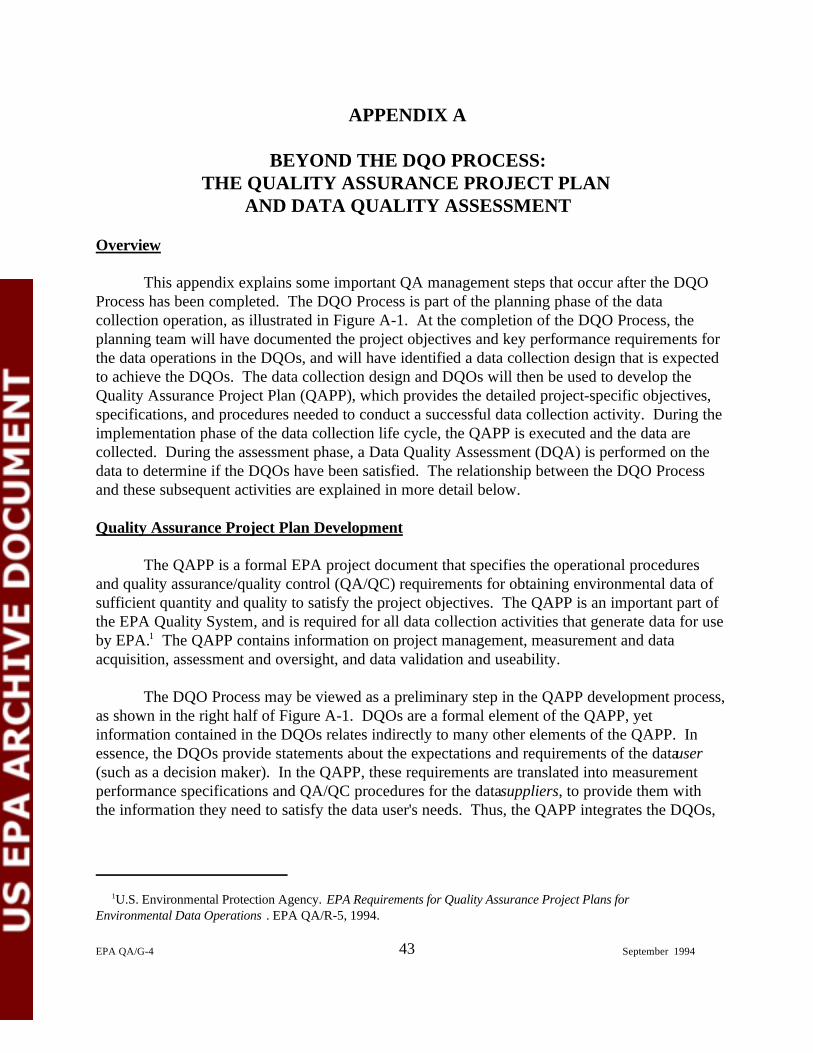
U.S. Environmental Protection Agency. EPA Requirements for Quality Assurance Project Plans for1
Environmental Data Operations . EPA QA/R-5, 1994.
43EPA QA/G-4 September 1994
APPENDIX A
BEYOND THE DQO PROCESS:THE QUALITY ASSURANCE PROJECT PLAN
AND DATA QUALITY ASSESSMENT
Overview
This appendix explains some important QA management steps that occur after the DQOProcess has been completed. The DQO Process is part of the planning phase of the datacollection operation, as illustrated in Figure A-1. At the completion of the DQO Process, theplanning team will have documented the project objectives and key performance requirements forthe data operations in the DQOs, and will have identified a data collection design that is expectedto achieve the DQOs. The data collection design and DQOs will then be used to develop theQuality Assurance Project Plan (QAPP), which provides the detailed project-specific objectives,specifications, and procedures needed to conduct a successful data collection activity. During theimplementation phase of the data collection life cycle, the QAPP is executed and the data arecollected. During the assessment phase, a Data Quality Assessment (DQA) is performed on thedata to determine if the DQOs have been satisfied. The relationship between the DQO Processand these subsequent activities are explained in more detail below.
Quality Assurance Project Plan Development
The QAPP is a formal EPA project document that specifies the operational proceduresand quality assurance/quality control (QA/QC) requirements for obtaining environmental data ofsufficient quantity and quality to satisfy the project objectives. The QAPP is an important part ofthe EPA Quality System, and is required for all data collection activities that generate data for useby EPA. The QAPP contains information on project management, measurement and data1
acquisition, assessment and oversight, and data validation and useability.
The DQO Process may be viewed as a preliminary step in the QAPP development process,as shown in the right half of Figure A-1. DQOs are a formal element of the QAPP, yetinformation contained in the DQOs relates indirectly to many other elements of the QAPP. Inessence, the DQOs provide statements about the expectations and requirements of the data user(such as a decision maker). In the QAPP, these requirements are translated into measurementperformance specifications and QA/QC procedures for the data suppliers, to provide them withthe information they need to satisfy the data user's needs. Thus, the QAPP integrates the DQOs,
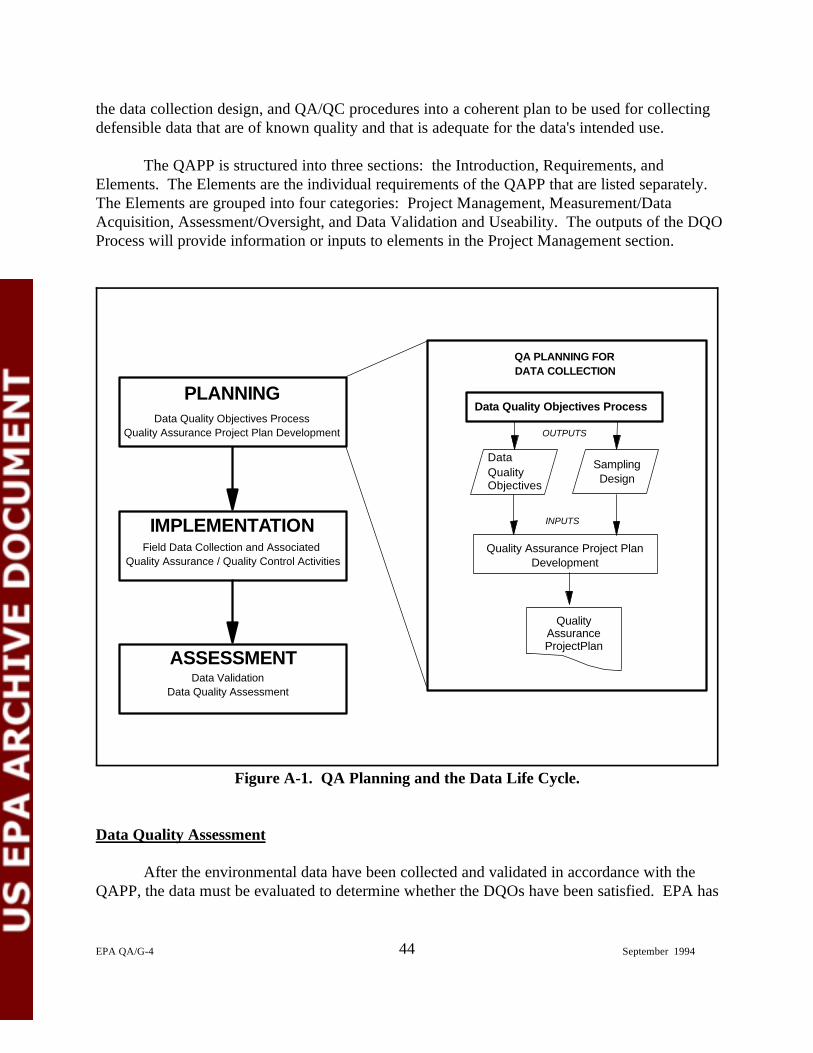
Data Quality Objectives Process
DataQuality Objectives
SamplingDesign
Quality Assurance Project PlanDevelopment
Quality Assurance ProjectPlan
QA PLANNING FOR DATA COLLECTION
IMPLEMENTATIONField Data Collection and Associated
Quality Assurance / Quality Control Activities
ASSESSMENTData Validation
Data Quality Assessment
PLANNINGData Quality Objectives Process
Quality Assurance Project Plan Development OUTPUTS
INPUTS
44EPA QA/G-4 September 1994
the data collection design, and QA/QC procedures into a coherent plan to be used for collectingdefensible data that are of known quality and that is adequate for the data's intended use.
The QAPP is structured into three sections: the Introduction, Requirements, andElements. The Elements are the individual requirements of the QAPP that are listed separately.The Elements are grouped into four categories: Project Management, Measurement/DataAcquisition, Assessment/Oversight, and Data Validation and Useability. The outputs of the DQOProcess will provide information or inputs to elements in the Project Management section.
Figure A-1. QA Planning and the Data Life Cycle.
Data Quality Assessment
After the environmental data have been collected and validated in accordance with theQAPP, the data must be evaluated to determine whether the DQOs have been satisfied. EPA has

U. S. Environmental Protection Agency. Guidance for Data Quality Assessments . EPA QA/G-9, 1994.2
45EPA QA/G-4 September 1994
developed guidance on Data Quality Assessment (DQA) to address this need (see Figure A-2). 2
DQA involves the application of statistical tools to determine:
whether the data meet the assumptions under which the DQOs and the datacollection design were developed; and
whether the total error in the data is small enough to allow the decision maker touse the data to support the decision within the tolerable decision error ratesexpressed by the decision maker.
It is important to verify the assumptions that underlie the DQOs and the data collectiondesign so that statistical calculations performed on the data relate to the decision maker's problemin a scientifically valid and meaningful way. If the data do not support the underlyingassumptions, then corrective actions must be taken to ensure that the decision maker's needs aremet. Corrective action may be as simple as selecting a different statistical approach that relies onassumptions that are in better agreement with the data, or it may be as complicated as revising thedata collection design and collecting new data that satisfy the decision maker's needs.
If the data support the conclusion that the assumptions are reasonable, then the next stepof a DQA can be taken, which is to evaluate how well the data support the actual decision. Thisis determined by evaluating whether the data conclusively demonstrate that the populationparameter of interest is above (or below) the action level. In essence, this is where the decisionmaker applies a more specific or "operational" version of the decision rule that was developed inStep 5 of the DQO Process (in statistical terms, this is performing the hypothesis test). Whetherthe data are "conclusive" or not will depend on the estimated value and variability of the statisticalparameter in relation to the gray region and the limits on decision errors that were specified inStep 6 of the DQO Process. If the decision cannot be made in accordance with the decisionmaker's DQOs, then the decision maker must decide whether to take corrective actions (such ascollect more or better data), relax the DQOs, or make a decision anyway, without the benefit ofadequate data.
Thus, DQA is an essential element of the data operation because it helps to bring closureto the issues raised at the beginning of the DQO Process. By verifying the assumptions requiredto draw scientifically valid and meaningful conclusions from the data, and by implementing thedecision rule, DQA helps the decision maker determine whether the DQOs have been satisfied.
QUALITY ASSURANCE ASSESSMENT
IMPLEMENTATIONField Data Collection and Associated
Quality Assurance / Quality Control Activities
ASSESSMENTData Validation
Data Quality Assessment
PLANNINGData Quality Objectives Process
Quality Assurance Project Plan Development INPUTS
OUTPUT
Routine Data QC/PerformanceEvaluation Data
DATA VALIDATION/VERIFICATIONverify measurement performanceverify measurement procedures and reporting
VALIDATED/VERIFIED DATA
DATA QUALITY ASSESSMENTverify DQOsverify assumptionsmake statistical decision
DATA QUALITY ASSESSMENT
CONCLUSIONS DRAWN FROM DATA
INPUT
OUTPUT
DATA VALIDATION/VERIFICATION
46EPA QA/G-4 September 1994
Figure A-2. Quality Assurance Assessment.
47EPA QA/G-4 September 1994
APPENDIX B DQO CASE STUDY: CADMIUM-CONTAMINATED
FLY ASH WASTE
Introduction
This appendix presents a functional, but realistic example of the DQO outputs for adecision that could be made within the Resource Conservation and Recovery Act (RCRA)hazardous waste management program. The example is intended to illustrate the types of outputsthat are common to the DQO Process. It is not intended, however, to represent the policy of theRCRA program for actual situations that may be similar to the example. Please consult with aknowledgeable representative within the RCRA program office about the current policy formaking waste classification decisions for fly ash or other types of hazardous waste.
The case study has been chosen because it is simple and straightforward, and because theoutputs are uncomplicated. Although some of the outputs from this example may seem intuitive,this is not often the case in practice. For many studies, the DQO Process is complicated andthought-provoking. Even so, some steps will require more effort than others. Keep in mind thatall of the steps in the DQO Process are necessary to develop a data collection design. Once thefirst six steps have been completed and thoroughly thought-out, then development of the mostresource-effective data collection design can proceed.
Background
A waste incineration facility located in the Midwest routinely removes fly ash from its fluegas scrubber system and disposes of it in a local sanitary landfill. Previously it was determinedthat the ash was not hazardous according to RCRA program regulations. The incinerator,however, recently began treating a new waste stream. The representatives of the incinerationcompany are concerned that the waste fly ash could now contain hazardous levels of cadmiumfrom the new waste sources. They have decided to test the ash to determine whether it should besent to a hazardous waste landfill or continue to be sent to the municipal landfill. They havedecided to employ the DQO Process to help guide their decision making.
Cadmium is primarily used as corrosion protection on metal parts of cars and electricalappliances. It is also used in some batteries. Cadmium and cadmium salts have toxic effects forhumans through both ingestion and inhalation exposures. Ingestion exposure usually causes mildto severe irritation of the gastrointestinal tract, which can be caused by concentrations as low as0.1 mg/kg/day. Chronic (long-term) inhalation exposure can cause increased incidence ofemphysema and chronic bronchitis, as well as kidney damage.
Under the current Code of Federal Regulations, 40 CFR, Part 261, a solid waste can beconsidered "hazardous" if it meets specific criteria of ignitability, corrosivity, reactivity, and

48EPA QA/G-4 September 1994
toxicity. One method that is used to determine if a solid substance, such as fly ash, meets thecriteria for toxicity under the RCRA program regulations is to test a “representative sample” ofthe waste and perform a Toxicity Characteristic Leaching Procedure (TCLP) described in 40CFR, Pt. 261, App. II. During this process, the solid fly ash will be “extracted” using an acidsolution. The extraction liquid (the TCLP leachate) will then be subjected to tests for specificmetals and compounds. For this example, the only concern is with the concentration of cadmiumin the leachate. The primary benefit of the DQO Process will be to establish the data collectiondesign needed to determine if the waste is hazardous under RCRA regulations within tolerabledecision error rates.
As a precursor to the DQO Process, the incineration company has conducted a pilot studyof the fly ash to determine the variability in the concentration of cadmium between loads of ashleaving the facility. They have determined that each load is fairly homogeneous. There is a highvariability between loads, however, due to the nature of the waste stream. Most of the fly ashproduced is not hazardous and may be disposed of in a sanitary landfill. Thus, the company hasdecided that testing each individual waste load before it leaves the facility would be the mosteconomical. Then they could send loads of ash that exceeded the regulated standards to thehigher cost RCRA landfills and continue to send the others to the sanitary landfill.
DQO Development
The following is a representative example of the output from each step of the DQOProcess for the fly ash toxicity problem.
State the Problem — a description of the problem(s) and specifications of available resourcesand relevant deadlines for the study.
(1) Identify the members of the planning team — The members of the planning team willinclude the incineration plant manager, a plant engineer, a statistician, a quality assuranceofficer, an EPA representative who works within the RCRA program, and a chemist withsampling experience.
(2) Identify the primary decision maker — There will not be a primary decision maker;decisions will be made by consensus.
(3) Develop a concise description of the problem — The problem is to determine which loadsshould be sent to a RCRA landfill versus a sanitary landfill.
(4) Specify available resources and relevant deadlines for the study — While the project willnot by constrained by cost, the waste generator (the incineration company) wishes to holdsampling costs below $2,500. They have also requested that the waste testing becompleted within 1 week for each container load.

49EPA QA/G-4 September 1994
Identify the Decision — a statement of the decision that will use environmental data and theactions that could result from this decision.
(1) Identify the principal study question — Is the fly ash waste considered hazardous underRCRA regulations?
(2) Define alternative actions that could result from resolution of the principal studyquestion —
(a) The waste fly ash could be disposed of in a RCRA landfill.
(b) The waste fly ash could be disposed of in a sanitary landfill.
(3) Combine the principal study question and the alternative actions into a decisionstatement — Decide whether or not the fly ash waste is hazardous under RCRA andrequires special disposal procedures.
(4) Organize multiple decisions — Only one decision is being evaluated.
Identify the Inputs to the Decision — a list of the environmental variables or characteristics thatwill be measured and other information needed to resolve the decision statement.
(1) Identify the information that will be required to resolve the decision statement — Toresolve the decision statement, the planning team needs to obtain measurements of thecadmium concentration in the leachate resulting from TCLP extraction.
(2) Determine the sources for each item of information identified — The fly ash should betested to determine if it meets RCRA regulated standards for toxicity using the testmethods listed in 40 CFR, Pt. 261, App. II. Existing pilot study data provide informationabout variability, but do not provide enough information to resolve the decision statement.
(3) Identify the information that is needed to establish the action level — The action levelwill be based on the RCRA regulations for cadmium in TCLP leachate.
(4) Confirm that appropriate measurement methods exist to provide the necessary data —Cadmium can be measured in the leachate according to the method specified in 40 CFR,Pt. 261, App. II. The detection limit is below the standard.
Define the Boundaries of the Study — a detailed description of the spatial and temporalboundaries of the problem, characteristics that define the population of interest, and any practicalconsiderations for the study.

50EPA QA/G-4 September 1994
(1) Specify the characteristics that define the population of interest — Fly ash waste from thehazardous waste incinerator will be analyzed. The fly ash should not be mixed with anyother constituents except water that is used for dust control. Each load of ash should fillat least 70% of the waste trailer. In cases where the trailer is filled less than 70%, thetrailer must wait on-site until more ash is produced and fills the trailer to the appropriatecapacity.
(2) Define the spatial boundary of the decision statement —
(a) Define the geographic area to which the decision statement applies. Decisions willapply to each container load of fly ash waste.
(b) When appropriate, divide the population into strata that have relatively homogeneouscharacteristics. Stratification is not necessary since the waste ash is relativelyhomogeneous within each container.
(3) Define the temporal boundary of the decision statement —
(a) Determine the timeframe to which the decision statement applies. It will be assumedthat the sampling data represent both the current and future concentration of cadmiumwithin the ash.
(b) Determine when to collect data. Contained in the trucks, the waste does not pose athreat to humans or the environment. Additionally, since the fly ash is not subject tochange, disintegration, or alteration, the decision about the waste characteristics doesnot warrant any temporal constraints. To expedite decision making, however, theplanning team has placed deadlines on sampling and reporting. The fly ash waste willbe tested within 48 hours of being loaded onto waste hauling trailers. The analyticalresults from each sampling round should be completed and reported within 5 workingdays of sampling. Until analysis is complete, the trailer cannot be used.
(4) Define the scale of decision making — The scale of decision making will be eachcontainer of waste ash.
(5) Identify practical constraints on data collection — The most important practicalconsideration that could interfere with the study is the ability to take samples from the flyash that is stored in waste hauling trailers. Although the trailers have open access, specialprocedures and methods will have to be implemented for the samples to be representativeof the entire depth of the ash. It has been suggested that core samples may be onepractical solution to this problem. To get additional samples from each truck and tominimize the cost, compositing of core samples has been suggested.

51EPA QA/G-4 September 1994
52EPA QA/G-4 September 1994
Develop a Decision Rule — to define the parameter of interest, specify the action level andintegrate previous DQO outputs into a single statement that describes a logical basis for choosingamong alternative actions.
(1) Specify the statistical parameter that characterizes the population of interest — Theplanning team is interested in the true mean concentration of cadmium in the TCLPleachate for each container.
(2) Specify the action level for the study — The action level for the decision will be theRCRA regulatory standard for cadmium of 1.0 mg/L in the TCLP leachate.
(3) Develop a decision rule (an “if...then...” statement) — If the mean concentration ofcadmium from the fly ash leachate in each container load is greater than 1.0 mg/L (usingthe TCLP method as defined in 40 CFR 261), then the waste will be considered hazardousand will be disposed of at a RCRA landfill. If the mean concentration of cadmium fromthe fly ash waste leachate is less than 1.0 mg/L (using the TCLP method as defined in 40CFR 261), then the waste will be considered non-hazardous and will be disposed of in asanitary landfill.
Specify Tolerable Limits on Decision Errors — the decision maker's tolerable decision errorrates based on a consideration of the consequences of making a decision error.
(1) Determine the possible range of the parameter of interest — From analysis of records ofsimilar studies of cadmium in environmental matrices, the range of the cadmiumconcentrations is expected to be from 0-2 mg/L. Therefore the mean concentration isexpected to be between 0-2 mg/L for this investigation.
(2) Identify the decision errors and choose the null hypothesis —
(a) Define both types of decision errors and establish the true state of nature for eachdecision error. The planning team has determined that the two decision errors are (i)deciding that the waste is hazardous when it truly is not, and (ii) deciding that thewaste is not hazardous when it truly is.
The true state of nature for decision error (i) is that the waste is not hazardous.
The true state of nature for decision error (ii) is that the waste is hazardous.
(b) Specify and evaluate the potential consequences of each decision error.
The consequences of deciding that the waste is hazardous when it truly is not willbe that the incinerator company will have to pay more for the disposal of the flyash at a RCRA facility than at a sanitary landfill.
53EPA QA/G-4 September 1994
The consequences of deciding that the waste is not hazardous when it truly is willbe that the incinerator company will dispose of the waste in a sanitary landfillwhich could possibly endanger human health and the environment. In thissituation, they may also be liable for future damages and environmental cleanupcosts. Additionally, the reputation of the incinerator company may becompromised, jeopardizing its future profitability.
(c) Establish which decision error has more severe consequences near the action level. The planning team has concluded that decision error (ii) has the more severeconsequences near the action level since the risk of jeopardizing human healthoutweighs the consequences of having to pay more for disposal.
(d) Define the null hypothesis (baseline condition) and the alternative hypothesis andassign the terms "false positive" and "false negative" to the appropriate decisionerror.
The baseline condition or null hypothesis (H) is "the waste is hazardous."o
The alternative hypothesis (H) is "the waste is not hazardous."a
The false positive decision error occurs when the null hypothesis is rejected when it istrue. For this example, the false positive decision error occurs when the decisionmaker decides the waste is not hazardous when it truly is hazardous. The falsenegative decision error occurs when the null hypothesis is not rejected when it is false. For this example, the false negative decision error occurs when the decision makerdecides that the waste is hazardous when it truly is not hazardous.
(3) Specify a range of possible values of the parameter of interest where the consequences ofdecision errors are relatively minor (gray region) — The gray region is the area adjacentto the action level where the planning team feels that the consequences of a false negativedecision error are minimal. To decide how to set the width of the gray region, theplanning team must decide where the consequences of a false negative decision error areminimal. Below the action level, even if the concentration of cadmium were very close tothe action level, the monetary costs of disposing of the waste at a RCRA facility are thesame as if the waste had a much lower concentration of cadmium. Clearly any falsenegative decision error (to the left of the action level) will cause the incinerator companyand their customers to bear the cost of unnecessary expense (i.e., sending nonhazardouswaste to a RCRA facility). The planning team, however, also realizes that they mustdefine a reasonable gray region that balances the cost of sampling with risk to humanhealth and the environment and the ability of measurement instruments to detectdifferences. Therefore the planning team has specified a width of 0.25 mg/L for this grayregion based on their preferences to detect decision errors at a concentration of 0.75 mg/L(see Figure B-1).

True Value of the Parameter (Mean Concentration, mg/L)
1
0.9
0.8
0.7
0.6
0.5
0.4
0.3
0.2
0.1
0
Gray Region Pro
babi
lity
of D
ecid
ing
that
the
Par
amet
er E
xcee
ds th
e A
ctio
n Le
vel
DecisionError Rates
TolerableFalse
Positive
DecisionError Rates
TolerableFalse
Negative
Decision Error(Relatively Large
Rates areConsideredTolerable.)
Performance Curve
.25 .50 .75 1.0 1.25 1.5 1.75 2.00
1
0.9
0.8
0.7
0.6
0.5
0.4
0.3
0.2
0.1
0
Action Level
54EPA QA/G-4 September 1994
(4) Assign probability values to points above and below the action level that reflect thetolerable probability for the occurrence of decision errors — For this example, RCRAregulations allow a 5% decision error rate at the action level. The planning team has setthe decision error rate to 5% from 1 mg/L to 1.5 mg/L and 1% from 1.5 mg/L to 2 mg/Las the consequences of health effects from the waste disposed of in the municipal landfillincrease. On the other side of the action level, the planning team has set the tolerableprobability of making a false negative error at 20% when the true parameter is from 0.25to 0.75 mg/L and 10% when it is below 0.25 mg/L, based on both experience and aneconomic analysis that shows that these decision error rates are reasonable to balance thecost of sampling versus the consequence of sending clean ash to the RCRA facility (seeFigure B-1).
Optimize the Design — select the most resource-effective data collection and analysis design forgenerating data that are expected to satisfy the DQOs. Optimizing the design is the one step ofthe DQO Process that will most likely be completed by a statistician or someone who has datacollection design expertise. Using the case study as an example, the following section has beenincluded to provide the reader with a background on the overall process that the statistician mightfollow to optimize the final data collection design.
Figure B-1. Decision Performance Goal Diagram for Cadmium Compliance TestingBaseline Condition: Mean Exceeds Action Level

55EPA QA/G-4 September 1994
Overview
Developing a data collection design requires an understanding of the sampled medium andthe information that was generated in previous DQO steps. The statistician's job is to review thebackground information, determine the appropriate statistical application to adequately solve theproblem, and develop one or more appropriate data collection designs. Once this is complete, thestatistician will compare the cost and performance of the different data collection designs. Thisprocess can be broken down into five distinct steps:
(1) Review the DQO outputs and existing environmental data.
(2) Develop general data collection design alternatives.
(3) For each data collection design alternative, select the optimal sample size thatsatisfies the DQOs.
(4) Select the most resource-effective data collection design that satisfies all of theDQOs.
(5) Document the operational details and theoretical assumptions of the selecteddesign in the sampling and analysis plan.
Activities
(1) Review the DQO outputs and existing environmental data — Because the statistician hasparticipated in the DQO Process for this problem, there is no need to review the DQOoutputs further. The only existing data relevant to this problem are the pilot study data. Based on the pilot study, the incineration company has determined that each load of ash isfairly homogeneous, and has estimated the standard deviation in the concentration ofcadmium within loads of ash to be 0.6 mg/L.
(2) Develop general data collection design alternatives — Generally, the design alternativesare based on a combination of design objectives developed in previous DQO Process stepsand knowledge of statistical parameters about the medium or contaminant. Below arefour examples of possible designs that could apply to the case study:
(a) Simple Random Sampling — The simplest type of probability sample is the simplerandom sample. With this type of sampling, every possible point in the samplingmedium has an equal chance of being selected. Simple random samples are usedprimarily when the variability of the medium is relatively small and the cost of analysisis relatively inexpensive. Simple random sample locations are generally developedthrough the use of a random number table or through computer generation of pseudo-random numbers.

Decide not to reject the null based on tolerable decision error limits.1
56EPA QA/G-4 September 1994
In the case of the cadmium-contaminated ash, a fixed number of random grab sampleswould be selected and analyzed. Standard lab splits and QC samples would be takenaccording to standard procedures for the RCRA program. Each sample would bechosen randomly in three dimensions. A Student's t-test is suggested as a possiblemethod for testing the statistical hypothesis.
(b) Composite Simple Random Sampling (composite sampling) — This type of samplingconsists of taking multiple samples, physically combining (compositing) them, anddrawing one or more subsamples for analysis. Composite samples are taken primarilywhen an average concentration is sought and there is no need to detect peakconcentrations. By compositing the samples, researchers are able to sample a largernumber of locations than if compositing was not used, while reducing the cost ofanalysis by combining several samples.
In the case of the cadmium-contaminated ash, a fixed number of random grab sampleswould be taken and composited. The number of grab samples contained in acomposite sample (g) is also fixed. To determine sampling locations within thecomposite, a container would be divided into "g" equal-volume strata and sampleswould be chosen randomly within each strata. The use of strata ensure full coverageof each container. Standard lab splits and QC samples would be taken according tostandard procedures for the RCRA program. A Student's t-test is suggested as thepossible method for testing the statistical hypothesis.
(c) Sequential Sampling — Sequential sampling involves making several rounds ofsampling and analysis. A statistical test is performed after each analysis to arrive atone of three possible decisions: reject the null hypothesis, accept the null hypothesis,1
or collect more samples. This strategy is applicable when sampling and/or analysiscosts are high, when information concerning sampling and/or measurement variabilityis lacking, when the waste and site characteristics of interest are stable over thetimeframe of the sampling effort, and when the objective of the sampling is to test asingle hypothesis. By taking samples in sequence, the researcher can hold down thecost of sampling and analysis.
In the case of the cadmium-contaminated ash, a sequential probability sample could beperformed. The samples in each sampling round would be chosen randomly in threedimensions. If the decision to stop sampling has not been made before the number ofsamples required for the simple random sample are taken, sampling would stop at thispoint and the simple random sample test would be performed. Standard laboratorysplits and QC samples would be taken according to standard procedures for theRCRA program. An approximate ratio test is suggested after each round of sampling
57EPA QA/G-4 September 1994
is complete to decide whether or not to conclude that the waste is hazardous or tocontinue sampling.
(d) Stratified Random Sampling — Stratified sampling involves dividing the study areainto two or more non-overlapping subsets (strata) which cover the entire volume to besampled. These strata should be defined so that physical samples within a stratum aremore similar to each other than to samples from other strata. Sampling depth,concentration level, previous cleanup attempts, and confounding contaminants can beused as the basis for creating strata. Once the strata have been defined, each stratumis then sampled separately using one of the above designs. Stratification is often usedto ensure that important areas of a site are represented in the sample. In addition, astratified random sample may provide more precise estimates of contaminant levelsthan those obtained from a simple random sample. Even with imperfect information, astratified sample can be more resource-effective.
Since the incineration company has already determined that each load of ash is fairlyhomogeneous, stratification does not have any advantages over a simple randomsample. In addition, since the company has decided to test each waste loadindividually before it leaves the facility, stratifying each waste load would be difficultand unnecessary. Therefore, this data collection design will not be considered further.
(3) For each data collection design alternative, select the optimal sample size that satisfiesthe DQOs — The formula for determining the sample size (number of samples to becollected) is chosen based on the hypothesis test and data collection design. Standardformulas can be found in several references, including:
Cochran, W. 1977. Sampling Techniques. New York: John Wiley.
Desu, M.M., and D. Raghavarao. 1990. Sample Size Methodology. San Diego,CA: Academic Press.
Gilbert, Richard O. 1987. Statistical Methods for Environmental PollutionMonitoring. New York: Van Nostrand Reinhold.
U.S. Environmental Protection Agency. 1989. Methods for Evaluating theAttainment of Cleanup Standards: Volume 1: Soils and Solid Media. EPA 230/02-89-042, Office of Policy, Planning and Evaluation.
U.S. Environmental Protection Agency. 1992. Methods for Evaluating theAttainment of Cleanup Standards: Volume 2: Ground Water. EPA 230-R-92-014, Office of Policy, Planning and Evaluation.
nˆ2(z1 z1 )2
2(0.5)z 2
1
58EPA QA/G-4 September 1994
U.S. Environmental Protection Agency. 1994. Statistical Methods for Evaluatingthe Attainment of Clean-up Standards: Volume 3: Reference-BasedStandards for Soils and Solid Media. EPA 230-R-94-004. Office of Policy,Planning and Evalutaion.
These formulas can also be found in many basic statistics textbooks. Different formulasare necessary for each data collection design, for each parameter, and for each statisticaltest. These formulas are generally a function of ; ; the detection difference, (delta);and the standard deviation, . The detection difference, , is defined to be the differencebetween the action level (AL) and the other bound of the gray region (U); i.e., = AL -U. In this case the standard deviation was derived from pilot data under approximatelythe same conditions as expected for the real facility.
For example, a formula for computing the sample size necessary to meet the DQOconstraints for comparing a mean against a regulatory threshold, when a simple randomsample is selected, is:
where:
ˆ = estimated variance in measurements (from pilot study)2
n = number of samples required,z = the p percentile of the standard normal distribution (from standard statisticalp
th
tables), and = U - AL
Simple Random Sample — Using the formula above, it was determined that 37 samplesare necessary to achieve the specified limits on decision errors. This sampling plansatisfies all the DQOs including budget, schedule, and practical constraints.
Composite Sampling — To determine sample sizes for a composite sample, it is necessaryto compute the number of composites samples, n; the number of samples, g, within eachcomposite; and the number of subsamples, m, to be measured for each composite. Usuallym=1; however, since this design is to be used repeatedly, it is suggested that twosubsamples from each composite sample be measured to estimate composite variability,which can then be used to re-optimize the number of samples m and g.
For a composite sample, with random sample locations, it has been determined that eightcomposite samples of eight samples each are sufficient to meet the limits on decisionerrors that have been specified. This design is more than sufficient to achieve the specified

59EPA QA/G-4 September 1994
limits on decision errors and satisfies all the DQOs including budget, schedule, andpractical constraints.
Sequential Sampling — For the purposes of comparing costs, the average number ofsamples in a sequential sampling design can be estimated, but these estimates are onlyaverages. The average sample size for concluding that the waste is hazardous is 16 andthe average sample size for concluding the waste is not hazardous is 22. The averagesizes are different because the burden of proof is placed on disproving the null hypothesis,thus, more samples on average are required to prove that the alternative hypothesis (thewaste is not hazardous) is true. However, these sample sizes are only averages. In somecases, fewer samples are necessary; in others, more may be necessary. This sampling plansatisfies all the DQOs including budget, schedule, and practical constraints.
(4) Select the most resource-effective data collection design that satisfies the DQOs —Compare the overall efficiency of each model and choose the one that will solve theproblem most effectively.
Cost Estimates for Each Design
First, the costs for the three designs alternatives will be evaluated:
Simple Random Sampling — A simple random sampling scheme can be implemented foreach load of fly ash by first generating three-dimensional random sampling points. Thiscan most easily be done by using a computer. Samples can then be taken using a specialgrab sampler which will be forced into the ash, opened to take the sample, then closed andremoved. The difficulty with this type of sampling scheme is measuring samplinglocations in three dimensions, and it may be difficult to gain access to the correct samplinglocations.
This design meets all of the required limits on decision errors. The cost of this design iscalculated based on the assumed cost of selecting a sample ($10), and the cost ofanalyzing a sample ($150). Since 37 samples need to be taken and analyzed, the cost ofthis design is:
Cost = 37 × $10 + 37 × $150 SRS
= $370 + $5550 = $5920
Composite Sampling — Composite sampling will be performed similarly to simple randomsampling except that after eight random samples are collected (one from each stratum),they will be combined and homogenized. Two sample aliquots for analysis will then bedrawn from the homogenized mixture. This process will be repeated eight times.

60EPA QA/G-4 September 1994
This design meets all of the required limits on decision errors. The cost of this design isbased on the cost of selecting ($10) and analyzing ($150) a sample. Eight samples will beused to make each composite sample for a sampling cost of $80; two subsamples will beanalyzed from this composite sample for a cost of $300. Therefore, each compositesample will cost $380. The total cost of this design is:
Cost = 8 × $380 = $3040.CS
Sequential Sampling — Sequential sampling will be performed similarly to randomsampling. The primary difference is that the ultimate number of samples will bedetermined by the results of one or more sampling rounds.
This design has the potential to reduce the number of samples required in the simplerandom sampling design and still meet the decision error limits. The average costs of thetwo decisions are used below:
The ash is hazardous: 16 × ($160) = $2,560The ash is non-hazardous: 22 × ($160) = $3,520
To determine the expected cost, estimate the number of loads of ash that should be sent toa RCRA facility versus the number of loads that can be sent to a municipal facility. Suppose 25% of the loads are hazardous and should be sent to a RCRA facility. Then theexpected cost (EC ) of this design should beSS
EC = 0.25 × (cost of sampling when ash is hazardous) + (0.75 × cost of samplingSS
when ash is non-hazardous)
= 0.25 × ($2,560) + 0.75 × ($3,520) = $ 3,280
Selection of a Design
Because the simple random sampling design requires that many samples be taken andanalyzed, it is inefficient for the goals of this study. Sampling will cost almost as much todetermine whether the waste is hazardous or nonhazardous as it would cost to send all thewaste to a RCRA hazardous waste landfill. Therefore, this decision is not resource-effective.
The sequential data collection design is more resource-effective than the simple randomsampling design. The potential savings over sending all waste to a RCRA hazardouswaste facility is $6,750 - $3,280 = $3,470. The site owner has expressed disapproval forthis sampling plan because of the time it may take before a decision can be made. If theash was not homogeneous within a container, however, this data collection design may bethe design of choice.
61EPA QA/G-4 September 1994
The composite sample design is the best option. It is the most resource-effective designand requires the least amount of time to implement. In addition, the use of strata ensuresfull coverage of each container. It is recommended that each of the eight compositesamples have two subsamples analyzed. In the future, after sufficient data have beencollected to estimate the variability within each composite sample, it may be possible toreduce the number of samples that will be necessary to make a decision about the wastecontents.
(5) Document the operational details and theoretical assumptions of the selected design inthe sampling and analysis plan — A composite sample design should be used todetermine whether each container of ash should be sent to a RCRA landfill or to amunicipal landfill. Eight composite samples, consisting of eight grab samples, should betaken from each container and two subsamples from each composite should be analyzed atthe laboratory. To form the composite samples, the containers will be divided into eightstrata of equal size and one grab sample will be taken randomly within each stratum andcomposited. Sample locations will be generated randomly using computer-generatedrandom numbers. The model assumes that the variability within a composite sample isnegligible. Data from the subsamples can be used to test this assumption and makecorrections to the model.
Beyond the DQO Process - Evaluation of the Design using the DQA Process
For this study, the data were collected using the composite sampling design. Once thesamples were collected and analyzed, the data were evaluated statistically and scientifically usingthe DQA Process to inspect for anomalies, confirm that the model assumptions were correct,select a statistical test, and verify that the test assumptions such as distribution and independencecan be met. For this study, a t-test satisfied the DQOs, and inspection of the data indicated thatthere was no reason to believe that the data were not normally distributed or that there wascorrelation between data points. It was also verified that the within-composite variability wasnegligible.
After three weeks of sampling, approximately 30% of the waste loads leaving theincinerator were found to have hazardous concentrations of cadmium in the fly ash. The datacollection design was determined to be cost-effective because the combined cost of sampling anddisposal was less than sending all of the waste to a RCRA landfill.
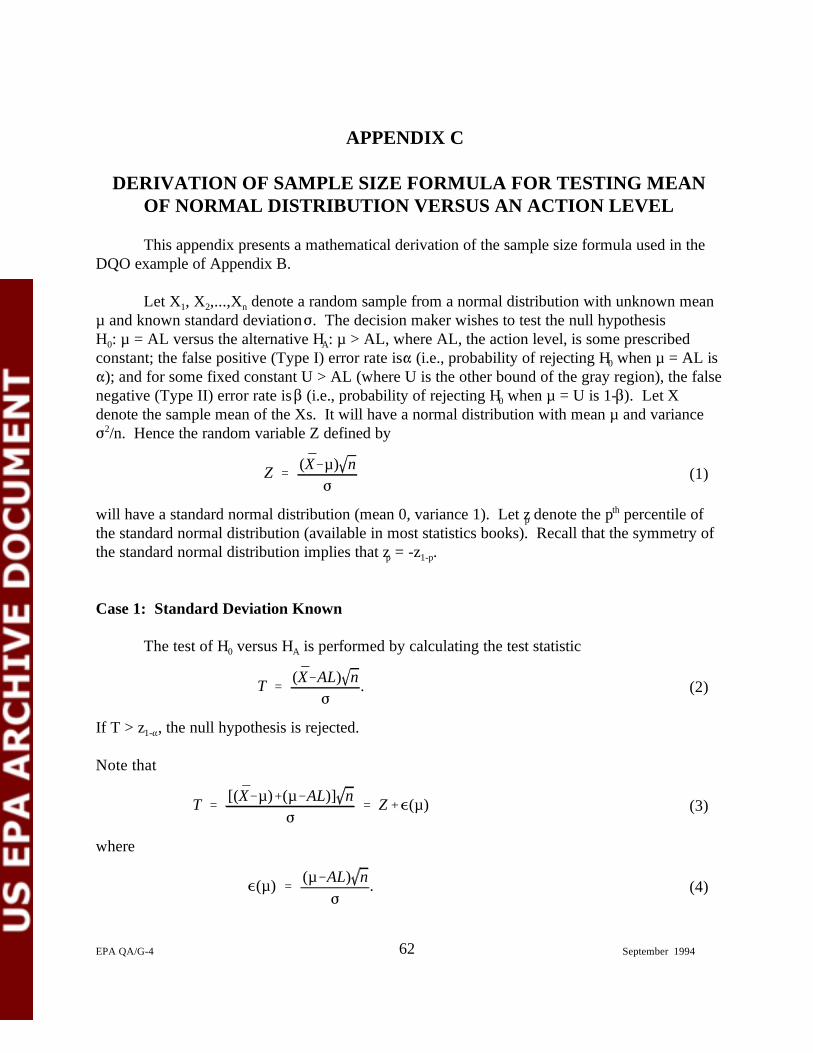
Z (X̄ µ) n
T (X̄ AL) n .
T [(X̄ µ) (µ AL)] n Z (µ)
(µ) (µ AL) n .
62EPA QA/G-4 September 1994
APPENDIX C
DERIVATION OF SAMPLE SIZE FORMULA FOR TESTING MEANOF NORMAL DISTRIBUTION VERSUS AN ACTION LEVEL
This appendix presents a mathematical derivation of the sample size formula used in theDQO example of Appendix B.
Let X , X ,...,X denote a random sample from a normal distribution with unknown mean1 2 n
µ and known standard deviation . The decision maker wishes to test the null hypothesisH : µ = AL versus the alternative H : µ > AL, where AL, the action level, is some prescribed0 A
constant; the false positive (Type I) error rate is (i.e., probability of rejecting H when µ = AL is0
); and for some fixed constant U > AL (where U is the other bound of the gray region), the falsenegative (Type II) error rate is (i.e., probability of rejecting H when µ = U is 1- ). Let X0
denote the sample mean of the Xs. It will have a normal distribution with mean µ and variance/n. Hence the random variable Z defined by2
(1)
will have a standard normal distribution (mean 0, variance 1). Let z denote the p percentile ofpth
the standard normal distribution (available in most statistics books). Recall that the symmetry ofthe standard normal distribution implies that z = -z .p 1-p
Case 1: Standard Deviation Known
The test of H versus H is performed by calculating the test statistic0 A
(2)
If T > z , the null hypothesis is rejected.1-
Note that
(3)
where
(4)
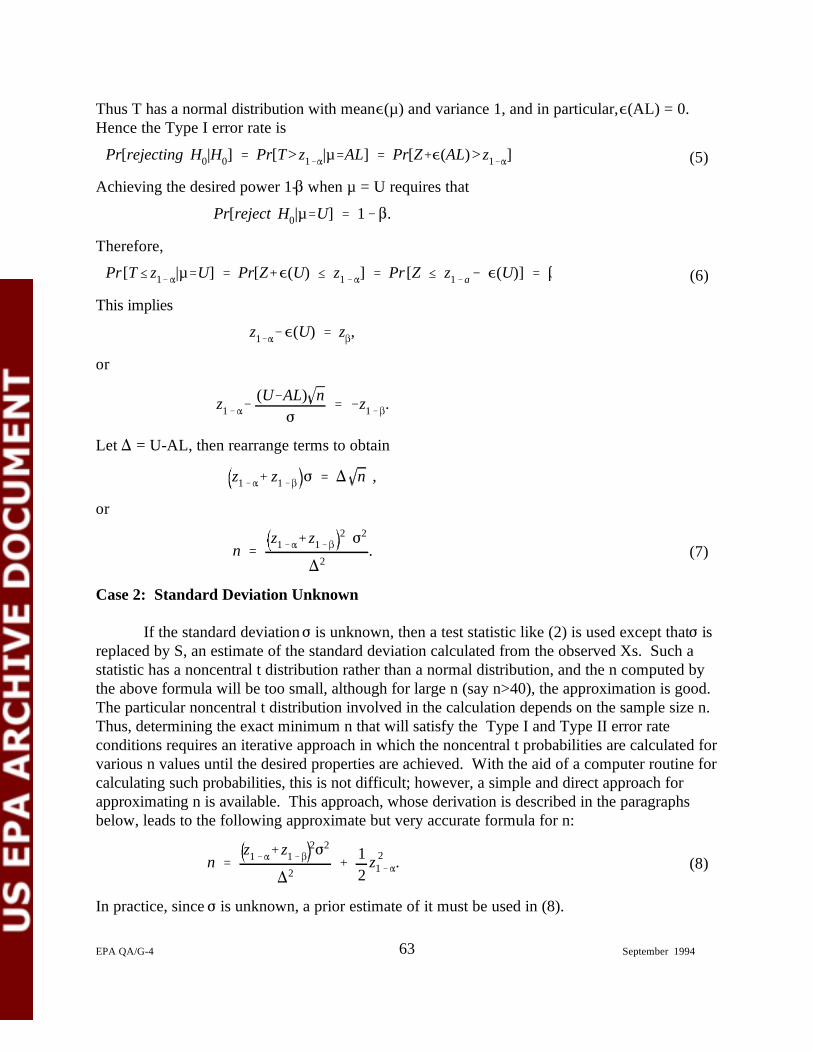
Pr[rejecting H0|H0] Pr[T>z1 |µ AL] Pr[Z (AL)>z1 ]
Pr[reject H0|µ U] 1 .
Pr[T z1 |µ U] Pr[Z (U) z1 ] Pr[Z z1 a (U)]
z1 (U) z ,
z1(U AL) n z1 .
z1 z1 n ,
nz1 z1
2 2
2.
nz1 z1
2 2
2
12
z 21 .
63EPA QA/G-4 September 1994
Thus T has a normal distribution with mean (µ) and variance 1, and in particular, (AL) = 0. Hence the Type I error rate is
(5)
Achieving the desired power 1- when µ = U requires that
Therefore,
(6)
This implies
or
Let = U-AL, then rearrange terms to obtain
or
(7)
Case 2: Standard Deviation Unknown
If the standard deviation is unknown, then a test statistic like (2) is used except that isreplaced by S, an estimate of the standard deviation calculated from the observed Xs. Such astatistic has a noncentral t distribution rather than a normal distribution, and the n computed bythe above formula will be too small, although for large n (say n>40), the approximation is good. The particular noncentral t distribution involved in the calculation depends on the sample size n. Thus, determining the exact minimum n that will satisfy the Type I and Type II error rateconditions requires an iterative approach in which the noncentral t probabilities are calculated forvarious n values until the desired properties are achieved. With the aid of a computer routine forcalculating such probabilities, this is not difficult; however, a simple and direct approach forapproximating n is available. This approach, whose derivation is described in the paragraphsbelow, leads to the following approximate but very accurate formula for n:
(8)
In practice, since is unknown, a prior estimate of it must be used in (8).
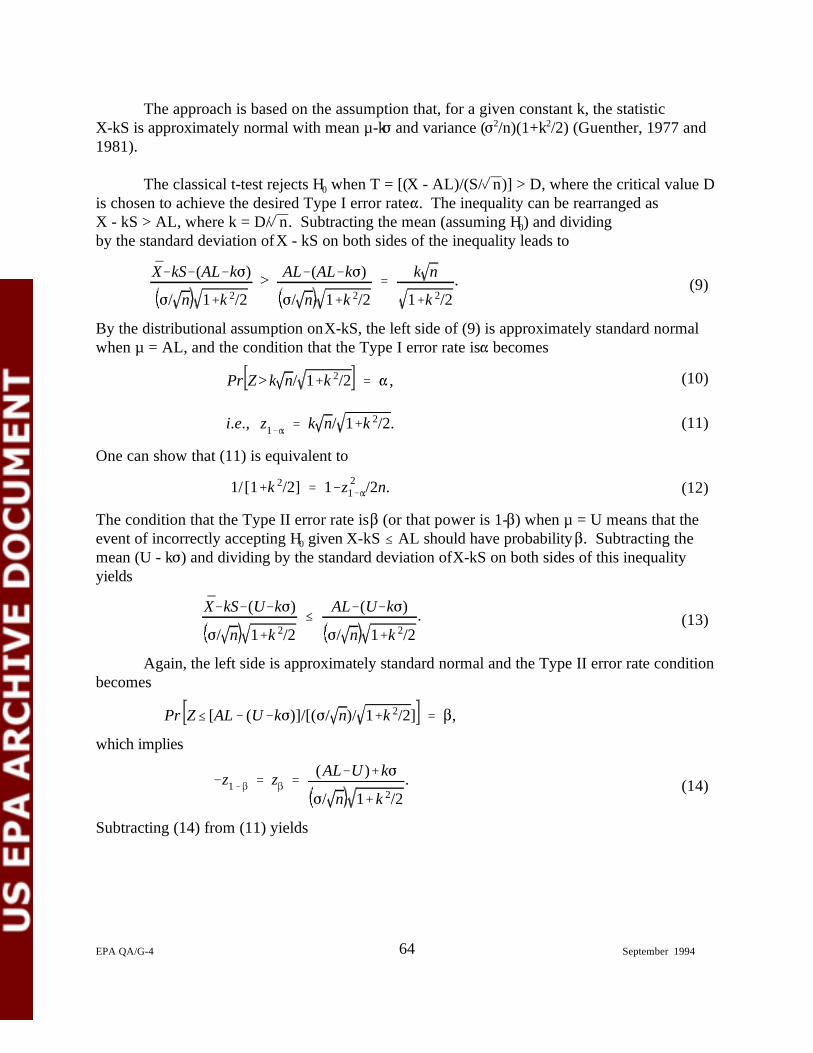
X̄ kS (AL k )
/ n 1 k 2/2> AL (AL k )
/ n 1 k 2/2
k n
1 k 2/2.
Pr Z>k n/ 1 k 2/2 ,
i.e., z1 k n/ 1 k 2/2.
1/[1 k 2/2] 1 z 21 /2n.
X̄ kS (U k )
/ n 1 k 2/2
AL (U k )
/ n 1 k 2/2.
Pr Z [AL (U k )]/[( / n)/ 1 k 2/2] ,
z1 z (AL U) k
/ n 1 k 2/2.
64EPA QA/G-4 September 1994
The approach is based on the assumption that, for a given constant k, the statistic X-kS is approximately normal with mean µ-k and variance ( /n)(1+k /2) (Guenther, 1977 and 2 2
1981).
The classical t-test rejects H when T = [(X - AL)/(S/ n)] > D, where the critical value D0
is chosen to achieve the desired Type I error rate . The inequality can be rearranged as X - kS > AL, where k = D/ n. Subtracting the mean (assuming H) and dividing 0
by the standard deviation of X - kS on both sides of the inequality leads to
(9)
By the distributional assumption on X-kS, the left side of (9) is approximately standard normalwhen µ = AL, and the condition that the Type I error rate is becomes
(10)
(11)
One can show that (11) is equivalent to
(12)
The condition that the Type II error rate is (or that power is 1- ) when µ = U means that theevent of incorrectly accepting H given X-kS AL should have probability . Subtracting the0
mean (U - k ) and dividing by the standard deviation of X-kS on both sides of this inequalityyields
(13)
Again, the left side is approximately standard normal and the Type II error rate conditionbecomes
which implies
(14)
Subtracting (14) from (11) yields

z1 z1(U AL)
/ n 1 k 2/2,
z1 z1
(U AL)n
1 k 2/2.
z1 z1
(U AL)n 1 z 2
1 /2n.
65EPA QA/G-4 September 1994
(15)
or
(16)
Substituting (12) into the denominator on the right side of (16) yields
(17)
Squaring both sides of (17) and solving for n yields equation (8).
References
Guenther, William C. 1977. Sampling Inspection in Statistical Quality Control. Griffin'sStatistical Monographs and Courses, No. 37, London: Charles Griffin.
Guenther, William C. 1981. "Sample Size Formulas for Normal Theory T Test." The AmericanStatistician. Vol. 35, No. 4.

66EPA QA/G-4 September 1994
APPENDIX DGLOSSARY OF TERMS
action level: the numerical value that causes the decision maker to choose one of the alternativeactions (e.g., compliance or noncompliance). It may be a regulatory threshold standard,such as a Maximum Contaminant Level for drinking water; a risk-based concentrationlevel; a technological limitation; or a reference-based standard. [Note: the action level isspecified during the planning phase of a data collection activity; it is not calculated fromthe sampling data.]
alternative hypothesis: See hypothesis.
bias: the systematic or persistent distortion of a measurement process which causes errors inone direction (i.e., the expected sample measurement is different than the sample's truevalue).
boundaries: the spatial and temporal conditions and practical constraints under whichenvironmental data are collected. Boundaries specify the area or volume (spatialboundary) and the time period (temporal boundary) to which the decision will apply. Samples are then collected within these boundaries.
data collection design: A data collection design specifies the configuration of the environmentalmonitoring effort to satisfy the DQOs. It includes the types of samples or monitoringinformation to be collected; where, when, and under what conditions they should becollected; what variables are to be measured; and the Quality Assurance and QualityControl (QA/QC) components that ensure acceptable sampling design error andmeasurement error to meet the decision error rates specified in the DQOs. The datacollection design is the principal part of the QAPP.
Data Quality Assessment (DQA) Process: a statistical and scientific evaluation of the data setto assess the validity and performance of the data collection design and statistical test, andto establish whether a data set is adequate for its intended use.
Data Quality Objectives (DQOs): Qualitative and quantitative statements derived from theDQO Process that clarify study objectives, define the appropriate type of data, and specifythe tolerable levels of potential decision errors that will be used as the basis forestablishing the quality and quantity of data needed to support decisions.
Data Quality Objectives Process: a Quality Management tool based on the Scientific Method,developed by the U.S. Environmental Protection Agency to facilitate the planning ofenvironmental data collection activities. The DQO Process enables planners to focus theirplanning efforts by specifying the intended use of the data (the decision), the decisioncriteria (action level), and the decision maker's tolerable decision error rates. Theproducts of the DQO Process are the DQOs.
67EPA QA/G-4 September 1994
decision error: an error made when drawing an inference from data in the context of hypothesistesting, such that variability or bias in the data mislead the decision maker to draw aconclusion that is inconsistent with the true or actual state of the population under study. See also false negative decision error, false positive decision error.
defensible: the ability to withstand any reasonable challenge related to the veracity, integrity, orquality of the logical, technical, or scientific approach taken in a decision making process.
false negative decision error: a false negative decision error occurs when the decision makerdoes not reject the null hypothesis when the null hypothesis actually is false. In statisticalterminology, a false negative decision error is also called a Type II error. The measure ofthe size of the error is expressed as a probability, usually referred to as "beta ( )"; thisprobability is also called the complement of power.
false positive decision error: a false positive decision error occurs when a decision maker
rejects the null hypothesis when the null hypothesis actually is true. In statisticalterminology, a false positive decision error is also called a Type I error. The measure ofthe size of the error is expressed as a probability, usually referred to as "alpha ( )," the"level of significance," or "size of the critical region."
gray region: a range of values of the population parameter of interest (such as mean contaminantconcentration) where the consequences of making a decision error are relatively minor. The gray region is bounded on one side by the action level.
hypothesis: a tentative assumption made to draw out and test its logical or empiricalconsequences. In hypothesis testing, the hypothesis is labeled "null" or "alternative",depending on the decision maker's concerns for making a decision error.
limits on decision errors: the tolerable decision error probabilities established by the decisionmaker. Potential economic, health, ecological, political, and social consequences ofdecision errors should be considered when setting the limits.
mean: (i) a measure of central tendency of the population (population mean), or (ii) thearithmetic average of a set of values (sample mean).
measurement error: the difference between the true or actual state and that which is reportedfrom measurements.
median: the middle value for an ordered set of n values; represented by the central value when nis odd or by the average of the two most central values when n is even. The median is the50th percentile.
medium: a substance (e.g., air, water, soil) which serves as a carrier of the analytes of interest.

68EPA QA/G-4 September 1994
natural variability: the variability that is inherent or natural to the media, objects, or peoplebeing studied.
null hypothesis: See hypothesis.
parameter: a numerical descriptive measure of a population.
percentile: the specific value of a distribution that divides the distribution such that p percent ofthe distribution is equal to or below that value. Example for p=95: "The 95th percentileis X" means that 95% of the values in the population (or statistical sample) are less than orequal to X.
planning team: the group of people that will carry out the DQO Process. Members include thedecision maker (senior manager), representatives of other data users, senior program andtechnical staff, someone with statistical expertise, and a QA/QC advisor (such as a QAManager).
population: the total collection of objects, media, or people to be studied and from which asample is to be drawn.
power function: the probability of rejecting the null hypothesis (H) over the range of possibleo
population parameter values. The power function is used to assess the goodness of ahypothesis test or to compare two competing tests.
quality assurance (QA): an integrated system of management activities involving planning,quality control, quality assessment, reporting, and quality improvement to ensure that aproduct or service (e.g., environmental data) meets defined standards of quality with astated level of confidence.
Quality Assurance Project Plan (QAPP): a formal technical document containing the detailedQA, QC and other technical procedures for assuring the quality of environmental dataprepared for each EPA environmental data collection activity and approved prior tocollecting the data.
quality control (QC): the overall system of technical activities that measures the attributes andperformance of a process, item, or service against defined standards to verify that theymeet the stated requirements established by the customer.
Quality Management Plan (QMP): a formal document describing the management policies,objectives, principles, organizational authority, responsibilities, accountability, andimplementation protocols of an agency, organization, or laboratory for ensuring quality inits products and utility to its users. In EPA, QMPs are submitted to the Quality AssuranceManagement Staff (QAMS) for approval.

69EPA QA/G-4 September 1994
range: the numerical difference between the minimum and maximum of a set of values.
sample: a single item or specimen from a larger whole or group, such as any single sample of1
any medium (air, water, soil, etc.).
sample: a set of individual samples (specimens or readings), drawn from a population, whose2
properties are studied to gain information about the whole.
sampling: the process of obtaining representative samples and/or measurements of a subset of apopulation.
sampling design error: the error due to observing only a limited number of the total possiblevalues that make up the population being studied. It should be distinguished from errorsdue to imperfect selection; bias in response; and errors of observation, measurement, orrecording, etc.
scientific method: the principles and processes regarded as necessary for scientific investigation,including rules for concept or hypothesis formulation, conduct of experiments, andvalidation of hypotheses by analysis of observations.
standard deviation: the square root of the variance.
statistic: a function of the sample measurements; e.g., the sample mean or standard deviation.
statistical test: any statistical method that is used to determine which of several hypotheses are true.
total study error: the combination of sampling design error and measurement error.
true: being in accord with the actual state of affairs.
Type I error: A Type I error occurs when a decision maker rejects the null hypothesis when it isactually true. See false positive decision error.
Type II error: A Type II error occurs when the decision maker fails to reject the null hypothesiswhen it is actually false. See false negative decision error.
variable: The attribute of the environment that is indeterminant.
variance: a measure of (i) the variability or dispersion in a population (population variance), or(ii) the sum of the squared deviations of the measurements about their mean divided by thedegrees of freedom (sample variance).


