Observation, Measurement, and Data Analysis in PER: Methodological Issues and Challenges David E. Meltzer Department of Physics and Astronomy Iowa State University Ames, Iowa Supported in part by National Science Foundation grants DUE #9981140 and REC #0206683
Transcript
Observation, Measurement, andData Analysis in PER:
Methodological Issues and Challenges
David E. MeltzerDepartment of Physics and Astronomy
Iowa State University
Ames, Iowa
Supported in part by National Science Foundation grants DUE #9981140and REC #0206683
CollaboratorsTom Greenbowe(Department of Chemistry, ISU)
Mani K. Manivannan(Southwest Missouri State University)
Graduate StudentsJack Dostal (ISU/Montana State)Ngoc-Loan NguyenTina FanettiLarry EngelhardtWarren Christensen
Outline• Observing Instruments• Issues related to assessment of an individual
student– context dependence of students’ ideas– multidimensionality of student mental states (“models”)– time dependence (rate of change) of students’ thinking
• Measures of learning gain (g, d, etc.)• Issues related to assessment of many
students– “hidden variables” in students’ pre-instruction state– sample-selection bias
• Dynamic Assessment (Time-dependent assessment)
Tools of Physics EducationResearch
• Conceptual surveys or “diagnostics”: short-answer or multiple-choice questions emphasizing qualitativeunderstanding, e.g., FCI, MBT, FMCE, CSEM, etc.
• Students’ written explanations of theirreasoning
• Interviews with studentse.g. “individual demonstration interviews” (U. Wash.)
• Observations of student group interactions
Observations of Student GroupInteractions
• Very time consuming– real-time observation and/or recording
• Identify more fruitful and less fruitful studentgroup behaviors e.g. R. Thornton, PERC 2001
• Characterize student-technology interactionse.g. V. Otero, PERC 2001; E. George, M. J. Broadstock, and J.Vasquez-Abad, PERC 2001
• Identify productive instructor interventions e.g.D. MacIsaac and K. Falconer, 2002
Caution: Careful probing needed!
• It is very easy to overestimate students’ levelof understanding.
• Students frequently give correct responsesbased on incorrect reasoning.
• Students’ written explanations of theirreasoning, and interviews with students, areindispensable diagnostic tools.
T. O’Brien Pride, S. Vokos, and L. C. McDermott, Am. J. Phys. 66, 147 (1998)
Posttest Variant #1N = 435
55%45%80%50%momentumcomparison
45%30%65%35%kinetic energycomparison
Correctanswer,
explanationignored
(∆x,∆t≠const.)
Correctanswer,correct
explanation
(∆x,∆t≠const.)
Correctanswer,
explanationignored
(∆t=const.)
Correctanswer,correct
explanation
(∆t=const.)
[comparison of KEand p, two objectsdifferent mass, actedupon by same force]
Posttest Variant #2N = 320
Consistent results when explanations taken into account
Ignoring Students’ Explanations Affects both Validity and Reliability
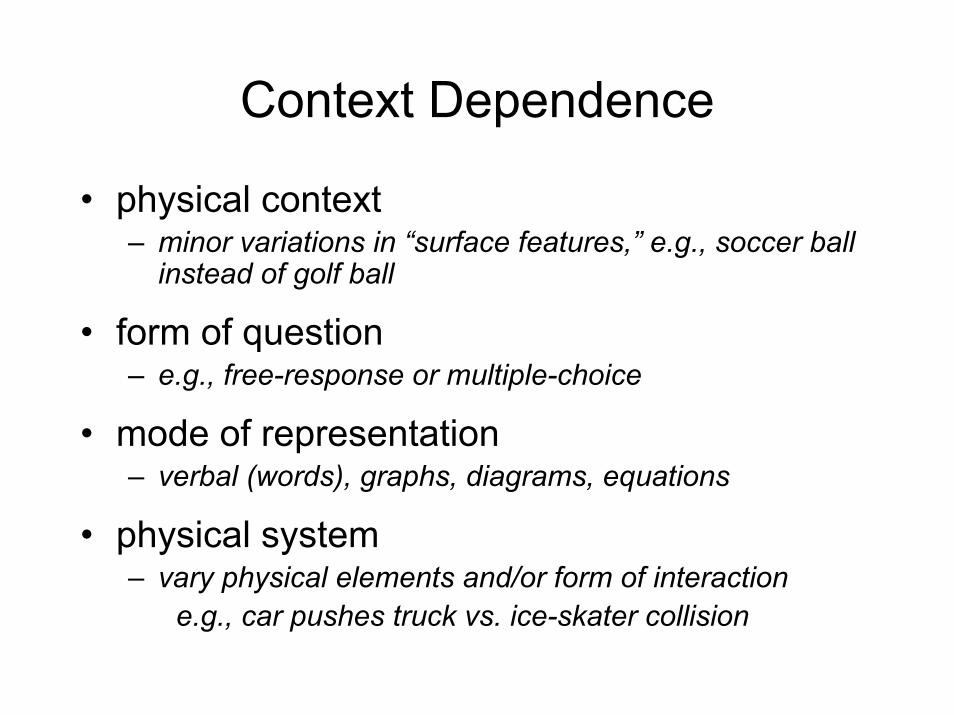
Context Dependence
• physical context– minor variations in “surface features,” e.g., soccer ball
instead of golf ball
• form of question– e.g., free-response or multiple-choice
• mode of representation– verbal (words), graphs, diagrams, equations
• physical system– vary physical elements and/or form of interaction
e.g., car pushes truck vs. ice-skater collision
Context Dependence of StudentResponses
• Changing physical context may significantlyalter students’ responses– E.g., FCI #13, forces on steel ball thrown straight up. When
changed to “vertical pistol shot,” many who originallyincluded upward force in direction of motion changed tocorrect response (gravity only). H. Schecker and J. Gerdes,Zeitschrift für Didaktik der Naturwissenschaften 5, 75 (1999).
• Changing form of question may significantlyalter students’ responses– E.g., free-response final-exam problems similar to several
FCI posttest questions. In some cases, significantdifferences in percent correct responses among studentswho took both tests. R. Steinberg and M. Sabella, PhysicsTeacher 35, 150 (1997).
Different Results with DifferentRepresentations
Example: Elementary Physics Course atSoutheastern Louisiana University.(DEM and K. Manivannan, 1998)
Newton’s second-law questions from FMCE.(nearly identical questions posed in graphical, and “naturallanguage” form.)
The force is toward the left and is decreasing in strength (magnitude).The force is toward the left and is of constant strength (magnitude).The force is toward the left and is increasing in strength (magnitude).
Direction of Force
A.
B.
C.
The force is toward the right and is increasing in strength (magnitude).The force is toward the right and is of constant strength (magnitude).The force is toward the right and is decreasing in strength (magnitude).
Direction of Force
D. No applied force is needed
1. Which force would keep the sled moving toward the right and speeding up at a steady rate(constant acceleration)?
2. Which force would keep the sled moving toward the right at a steady (constant) velocity?
3. The sled is moving toward the right. Which force would slow it down at a steady rate (constant acceleration)?
4. Which force would keep the sled moving toward the left and speeding up at a steady rate (constant acceleration)?
R. Thornton and D. Sokoloff,Am. J. Phys. 66, 38 (1998)
Questions 14-21 refer to a toy car which can move to the right or left along a horizontal line (the positive part of the distance axis).
+0Assume that friction is so small that it can be ignored.
You may use a choice more than once or not at all. If you think that none is correct, answer choice . J
A force is applied to the car. Choose the one force graph ( through ) for each statement below which could allow the described motion of the car to continue.
A H
The car moves toward the right (away from the origin) with a steady (constant) velocity.
__14.
The car is at rest.__15.
The car moves toward the right and is speeding up at a steady rate (constant acceleration).
__16.
The car moves toward the left (toward the origin) with a steady (constant) velocity.
__17.
The car moves toward the right and is slowing down at a steady rate (constant acceleration).
__18.
The car moves toward the left and is speeding up at a steady rate (constant acceleration).
__19.
The car moves toward the right, speeds up and then slows down.
__20.
The car was pushed toward the right and then released. Which graph describes the force after the car is released.
DEM: I need you to explain #3 [Force Sled Question #3]. ["The sled is moving to the right. Which force would
slow it down at a steady rate (constant acceleration)?"] Student: [reads answer she chose] "The force is toward
the left and is decreasing in strength." . . . I was picturingthe sled, and I was thinking that it would take less force onceit started slowing down . . . I don't know . . .
You want it to slow down at a steady rate. So since it's
moving towards me and I want it to slow down, I'm actuallygoing to have to go with it . . . and I guess I would increasemy force to slow it down, not decrease it. I don't know . . .
DEM: Does the fact that it says "constant acceleration,"does that help you to figure this out? STUDENT: Only in so far as if the acceleration is constant,then the slope is zero . . . DEM: The slope of what? STUDENT: The slope of the acceleration, and so the slopeof the force is going to be zero: they mirror each other.The force is going to be constant. [Draws graph to explainher reasoning.] When I think of constant acceleration, Ithink of this [horizontal line].
0 t
a +
–
DEM: Now, on this one we’ve gone all the way around. Atfirst you said less force was needed once it startedslowing down, then you said maybe you have to increasethe force. And now you’re saying, “constant force.”
STUDENT: Well, according to what I know, or what I think Iknow about graphs, I would say that the force had toremain constant because the acceleration is constant.
According to the visual image I have in my head, if askater was coming towards me and I wanted to slow herdown at a steady rate, I don’t think that my force would beconstant. I don’t know why I don’t think that, I just think itwould take less force towards the end.
WarningJust because you saw it once does not
necessarily mean you’ll see it the next time• Class averages on full sets of test items tend to be very
stable, one measurement to the next (e.g., different year)• Measurements on individual test items fluctuate significantly
Example: Algebra-based physics, male students at ISU, FCI #29Original: forces acting on office chair at rest on floor [no graphic]Variant (“Gender FCI”; L. McCullough): forces acting on diary at rest onnightstand [drawing of system is shown]
Replication is important, especially for surprising results
Superposition of Mental States
• Students tend to be inconsistent in applyingsame concept in different situations, implyingexistence of “mixed-model” mental state. E.g.,use “impetus” model in one case, Newtonian model onanother. I. Halloun and D. Hestenes, Am. J. Phys. 53, 1058 (1985).
• Time-dependent changes in degree ofconsistency of students’ mental states maycorrelate with distinct learning patterns withdifferent physical concepts. E.g., students learn torecognize presence of normal force, but still believe in“force in direction of motion.” L. Bao and E. F. Redish,PERS of AJP 69, S45 (2001).
Issues Related to Multiple-Choice ExamsCf. N. S. Rebello and D. A. Zollman, PERS of AJP (in press)
• Even well-validated multiple-choice questionsmay miss significant categories of responses.
• Selection of distracters made available tostudents can significantly affect proportion ofcorrect responses.
• As a result of instruction, new misconceptionsmay arise that are not matched to original setof distracters.
Deciphering Students’ Mental Modelsfrom their Exam Responses
• Distinct patterns of incorrect responses maycorrelate to transitional mental states. R. Thornton,ICUPE Proceedings (1997)
• Varying the selection of answer options can alterthe models ascribed to students’ thinking. R.Dufresne, W. Leonard, and W. Gerace, Physics Teacher 40,174 (2002).
• Students’ justifications for incorrect responsesmay change as a result of instruction. J. Adams and T.Slater (1997)
• Precision design of questions and answeroptions necessary for accurate targeting ofstudents’ mental models. Bao and Redish, PERS of AJP69, S45 (2001); Bao, Hogg, and Zollman, AJP, 70, 772 (2002).
D. Maloney, T. O’Kuma, C. Hieggelke, and A. Van Heuvelen, PERS of AJP 69, S12 (2001).
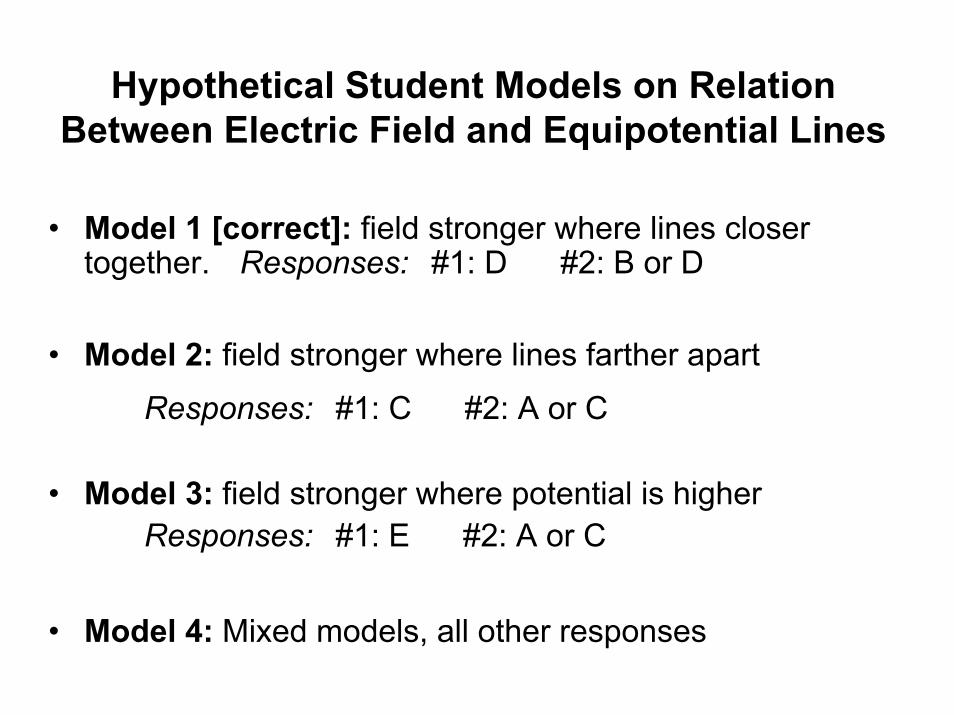
Hypothetical Student Models on RelationBetween Electric Field and Equipotential Lines
• Model 1 [correct]: field stronger where lines closertogether. Responses: #1: D #2: B or D
• Model 2: field stronger where lines farther apartResponses: #1: C #2: A or C
• Model 3: field stronger where potential is higherResponses: #1: E #2: A or C
• Model 4: Mixed models, all other responses
Evolution of Student ModelsAlgebra-based physics at ISU (1998-2001)
27%57%Model #4
8%9%Model #3
2%14%Model #2
63%20%Model #1
Post-testPre-testn = 299
[disappears]
[remains]
Caution: Models much less firm than theymay appear
Spring 2002: 116 Students in same coursegave answers pre-instruction withexplanations to the two questions.
Patterns of student thinking that seemed to be present on pretest may actually have been largely random.
Interview Evidence of Students’Mental State-Function
• Initially, students may offer largely formulaicresponses e.g., equations, verbatim repetition ofphrases, etc.
• Later responses may contradict earlier ones;sometimes resolvable by student, sometimesnot. Sometimes they have no well-defined concept.
• Even with minimum-intensity probing,students may in time succeed in solvingproblem that was initially intractable.If student “learns” during interview, have wemeasured “knowledge” or “learning ability”?
Time Dependence of Student Learning
• Multi-dimensionality of student mental states(i.e., diversity of individual model states)suggests possible correlations with diverselearning trajectories and learning rates.
• Can initial learning rate be correlated withfinal learning gains? Ambiguous results so far.(DEM, 1997)
• To date there has been little focus onassessing physics students’ learning rates.
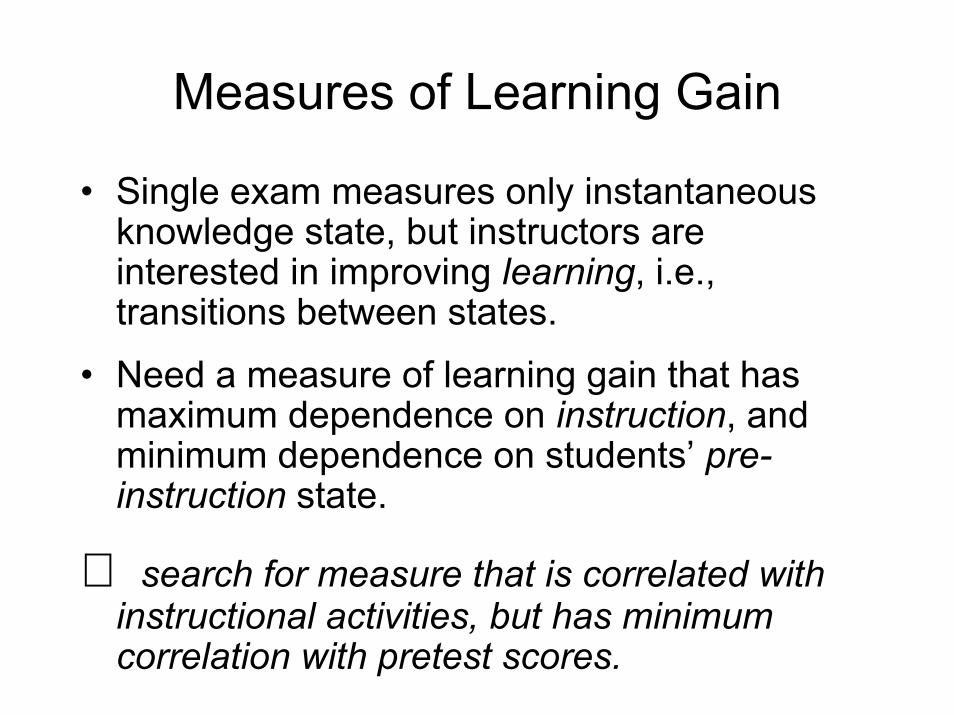
Measures of Learning Gain
• Single exam measures only instantaneousknowledge state, but instructors areinterested in improving learning, i.e.,transitions between states.
• Need a measure of learning gain that hasmaximum dependence on instruction, andminimum dependence on students’ pre-instruction state.
⇒ search for measure that is correlated withinstructional activities, but has minimumcorrelation with pretest scores.
Normalized Learning Gain “g”R. R. Hake, Am. J. Phys. 66, 64 (1998)
In a study of 62 mechanics courses enrolling over6500 students, Hake found that mean normalizedgain <g> on the FCI is:
• virtually independent of class mean pretest score (r = +0.02);• = 0.23±0.04(s.d.) for traditional instruction, nearly
independent of instructor;• =0.48±0.14(s.d.) for courses employing “interactive
engagement” active-learning instruction.
These findings have been largely confirmed in hundreds of physics courses worldwide
Fundamental Quandary: Assessmentof “Knowledge” or “Learning”?
(To analyze motion of particle, initial position andmomentum required. And to analyze studentunderstanding? . . .)
• To assess the impact of the teaching environment, weexamine students “before” and “after.” How do wemeasure magnitude of learning effect?
• Two students at same instantaneous knowledge “point”may be following very different trajectories. How can theybe distinguished?(Imagine ensemble of points representing individualstudents’ mental state-functions. The trajectory of theensemble is influenced by the teaching “force field,” butalso depends on initial momentum distribution.)
“Dynamic” Assessment?Cf. C. S. Lidz, Dynamic Assessment (Guilford, New York, 1987)
• Even within the time period of a single interview, astudent’s mental state may vary significantly.– random fluctuation, or secular change?
• Full description of mental state function requiresdynamical information, i.e., rates of change, reactionto instructional “perturbation,” etc. (and rememberstudent state-function is multi-dimensional!)
• Full analysis of teaching/learning environment willrequire broad array of interaction parameters.
• Simplification a practical necessity (just as in all otherphysics research!), but can’t lose sight of underlyingreality.
Conclusion
• “Detector” design for data collection inPER has just begun to scratch thesurface.
• We need to improve identification andcontrol of variables.
• Dynamic, time-dependent assessmentis likely to increase in importance.