Received: 4 April 2012 – Published in Atmos. Meas. Tech. Discuss.: 13 June 2012Revised: 30 November 2012 – Accepted: 5 December 2012 – Published: 4 January 2013
Abstract. On 4 June 2011 an eruption of the Chilean volcanocomplex Puyehue–Cordon Caulle injected large amounts ofvolcanic ash into the atmosphere and affected local life aswell as hemisphere-wide air traffic. Observations of the In-frared Atmospheric Sounding Interferometer (IASI) flown onboard of the MetOp satellite have been exploited to analyzethe evolution of the ash plume around the Southern Hemi-sphere. A novel singular vector-based retrieval methodology,originally developed for observation of desert dust over landand ocean, has been adapted to enable remote sensing of vol-canic ash.
Since IASI observations in the 8–12 µm window are ap-plied in the retrieval, the method is insensitive to solar illu-mination and therefore yields twice the observation rate ofthe ash plume evolution compared to solar backscatter meth-ods from polar orbiting satellites. The retrieval scheme, theemission characteristics and the circumpolar transport of theash are examined by means of a source–receptor analysis.
1 Introduction
Volcanic eruptions can emit large quantities of ash parti-cles and gases, such as H2O, CO2 or SO2, into the at-mosphere. Depending on the injection height, volcanic ashcan remain up to several weeks in the troposphere and upto months in the stratosphere. According to Halmer andSchmincke (2003), 80 % of ash emissions from explosivevolcanic eruptions exceed altitudes of 6 km, 60 % of 10 kmand 20 % altitudes of 15 km. Therefore, volcanic ash mayalso be subject to long-range transport in the free troposphereand stratosphere.
In ambient air, volcanic ash poses a severe health riskto human beings and animals (Horwell and Baxter, 2006).Moreover, volcanic ash has proven to be a hazard to aviation
(Miller and Casadevall, 2000). Depending on its concentra-tion and composition it can strongly reduce visibility, clogthe sensors of the aircraft, disturb the avionics and in theworst case lead to a failure of turbojet engines (Swanson andBeget, 1991).
In the past more than 90 aircraft were damaged after flyingthrough volcanic ash plumes. The total cost of the damage toaircraft in the period 1982–2000 is estimated at 250 millionUS dollars, but so far none of the incidents have resulted infatal accidents (van Geffen et al., 2007). The eruption of theIcelandic volcano Eyjafjalla in March and April 2010 andthe closure of the European air space has clearly demon-strated the vulnerability of the economy to such an air dis-aster (Zehner, 2010). Moreover, it has demonstrated the im-portance of satellite data for tracking and early warning ofvolcanic emissions and, in particular, ash plumes.
Very often observations of SO2 and the ultraviolet aerosolabsorbing index (Torres et al., 1998) have been used oper-ationally as a proxy for the location of volcanic ash fromsatellite instruments like the Total Ozone Monitoring Spec-trometer (TOMS), the Global Ozone Monitoring Exper-iment (GOME, GOME-2), Scanning Imaging AbsorptionSpectrometer for Atmospheric Cartography (SCIAMACHY)and the Ozone Monitoring Instrument (OMI) (e.g. Krueger,1983; Thomas et al., 2005; Loyola et al., 2008; Rix et al.,2009; Krotkov et al., 2006).
Mineral aerosol extinction in the thermal infrared win-dow is mainly caused by Si-O resonance absorption around9.5 µm in silicates (e.g. Hudson et al., 2008a, b). Like desertdust, volcanic ash is largely composed of silicate materi-als (e.g. Pettijohn et al., 1972; Horwell and Baxter, 2006;Prata and Kerkmann, 2007). Prata (1989) showed that in-frared split window satellite observations can be used to de-tect volcanic ash plumes. Different approaches to exploit-ing differential volcanic ash absorption in infrared satellite
Published by Copernicus Publications on behalf of the European Geosciences Union.
36 L. Kl user et al.: Observation of volcanic ash from Puyehue–Cordon Caulle
observations for ash detection have been applied to volcaniceruptions since (e.g. Wen and Rose, 1994; Hilger and Clarke,2002; Corradini et al., 2009; Karagulian et al., 2010). Re-cently, the Infrared Atmospheric Sounding Interferometer(IASI) on MetOp has been applied to observe volcanic SO2and to successfully detect volcanic ash, e.g. from the Chaiten(Chile, 2008), Kasatochi (Aleutian Islands, 2008) and Ey-jafjalla (Iceland, 2010) eruptions (e.g. Clarisse et al., 2008,2012; Gangale et al., 2010; Karagulian et al., 2010).
In this paper the adaptation of a novel retrieval methodfor mineral dust to volcanic ash is presented. It enables re-mote sensing of volcanic ash aerosol optical depth (AOD)with IASI. The method is applied to a plinian eruption froma fissure in the Puyehue–Cordon Caulle Volcanic Complexin central Chile, which began on 4 June 2011 at 19:15 UTC(SERNAGEOMIN, 2011). Hereafter the eruption will be re-ferred to as PCCE (Puyehue–Cordon Caulle eruption). Itcaused ash fall over South America and widespread air spaceclosure over South Africa, Australia and New Zealand aswell. The ash plume could be detected south of Australiasome days after the eruption and reached the Chilean coastfrom westerly directions again on 14 June 2011 after circum-polar transport.
After this introduction the ash retrieval method for IASIis described in Sect. 2, followed by observations and anal-ysis of the PCCE ash plume. After a discussion in Sect. 4,conclusions are drawn in Sect. 5.
2 The SVD based volcanic ash retrieval methodfrom IASI
The Infrared Atmospheric Sounding Interferometer (IASI)is a Michelson interferometer developed for atmosphericsounding in the thermal infrared spectrum (Larar et al.,2010). It has a spectral resolution of 0.5 cm−1 in 8641 chan-nels at a ground resolution of 12 km (diameter) at nadir.
In Kl user et al. (2011), a methodology to retrieve mineraldust aerosol optical depth (AOD) from IASI observationswas presented. This method uses singular vector decompo-sition (SVD) for un-mixing the signals of (mineral) aerosol,gas absorption and surface emissivity. Unlike classical prin-cipal component analysis (PCA), SVD is performed on thedata (or observation) matrix directly and not on the covari-ance matrix. Mathematically it is the solution of the eigen-value problem for a non-symmetric matrix.
The approach extracts the aerosol information from thespectral extinction (due to absorption and scattering by theaerosol) pattern matched to linear combinations of third andhigher order singular vectors of IASI spectra.
The basic idea of the method is to apply a volcanic ash ob-servation method which does not rely on a priori assumptionssuch as atmospheric state or surface emissivity. Followingthis constraint, no forward modelling of the radiance field isapplied in this method. Nevertheless, one a priori assumption
cannot be avoided – the use of spectral extinction propertiesof the observed aerosol (volcanic ash). For the observationof mineral dust over desert areas, extinction spectra of dustcomponents measured in the laboratory by FTIR are used(Kl user et al., 2012; measurements of spectra described inHudson et al., 2008a, b).
Instead of pre-calculating look-up tables generated by ra-diative transfer forward modelling, mineral aerosol relatedequivalent optical depth spectra are calculated in the 8–12 µm(830–1250 cm−1) window region (Kluser et al., 2011). Formathematical details of the retrieval algorithm the reader isreferred to Kluser et al. (2011).
The IASI radiance spectra of the window region (830–1250 cm−1) are compiled into 42 bins with 10 cm−1 binwidth (20 IASI channels each) with maximum brightnesstemperature of each bin being used in order to minimise theabsorption effect of narrow gas absorption lines. Then theequivalent optical depthτeqv is calculated from the observedradianceLobs at wavenumberν, the Planck-functionBν ofTbase, i.e. the maximum brightness temperature within theobservation window (baseline temperature) and the cosine ofthe viewing zenith angle (2v):
Lobs= e−τeqv/cos(θv)Bν (Tbase) . (1)
Singular vectors decomposed from IASI spectra of a seven-day period reflect the dominating modes of spectral variabil-ity in IASI spectra (Kluser et al., 2011).
The leading two singular vectors account for most vari-ability in the IASI spectra and can be attributed to surfaceemissivity and broad gas absorption (O3, H2O, CO2). Con-sequently, the ash signal is carried mainly by the higher or-der singular vectors (numbers three to six). Projection of thenormalised ash extinction spectrum onto the ash related spec-tral extinction signal, i.e. the linear combination of weightedhigher order singular vectors, provides an estimate of the in-frared optical depth of volcanic ash at 1000 cm−1 representedby the respective ash component (done for each componentseparately). The weighting of the different components is ob-tained from a least-squares fit between the theoretical AODspectrum and the singular vector linear combination. Fromthe AOD estimate the effective ash emission temperature canbe estimated (Ackerman, 1997; Kluser et al., 2011). The ob-served radiance spectra are then corrected for the contribu-tion of aerosol emission and a second iteration of the retrievalyields ash infrared AOD.
The validation of IASI derived desert dust AOD could belargely improved by the use of measured extinction spec-tra for different dust components compared to using OPACspectra (Kluser et al., 2012). One of the major advantagesof the singular vector-based un-mixing approach is that min-eral aerosol can also be observed above land, where surfaceemissivity is unknown. Moreover, silicate aerosols can alsobe detected above underlying clouds.
Extinction spectra of desert dust and volcanic ash in the8–12 µm range have large similarity, as both are mainly
L. Kl user et al.: Observation of volcanic ash from Puyehue–Cordon Caulle 37
composed of silicate materials (e.g. Volz, 1973). Never-theless, mineralogy and particle sizes of volcanic ash maystrongly differ from dust assumptions (Volz, 1973), espe-cially regarding the apparent absence of clays and the higherfeldspar abundance as well as the presence of mafic minerals(Pettijohn et al., 1972). Moreover, Hudson et al. (2008a, b)showed that the extinction spectra obtained from Mie calcu-lations are significantly blue-shifted when compared to mea-sured extinction spectra.
The continuous distribution of ellipsoids (CDE) approachfor modelling the spectral absorption of aerosols (e.g. Hud-son et al., 2008b) shows the best representation of spectralcharacteristics of the extinction spectra. Yet the approachonly accounts for absorption and neglects scattering by theaerosol. While for small particles (D � λ) this assumptiondoes not result in large errors (see Yang et al., 2007; Laksinaet al., 2012), for larger particles the single scattering albedoincreases and the assumption breaks down. Nevertheless,Ackerman (1997) analysed the sensitivity of spectral varia-tion of total extinction to scattering effects for desert dustunder different conditions and also for volcanic ash. Scatter-ing by volcanic ash was found to be spectrally invariant. Inaddition, Thomas and Gautier (2009) show for a quartz-richdust storm over Africa that spectral variability of IR AOD isdominated by absorption. It is not clear if this is generally thecase in volcanic ash (refractive indices of different ash com-ponents show rather large variability also of the real part forvolcanic ash components, e.g. Pollack et al., 1973). Figure 1shows the single-scattering albedo for plagioclase and ortho-clase feldspars to be exemplarily. For both feldspars, threedifferent size distributions inspired by the OPAC dust modes(Hess et al., 1998) are presented and single scattering albedois calculated with Mie theory. As outlined above, for smallparticles single scattering albedo is very small (solid lines)and scattering effects can be neglected. For coarser particlesscattering becomes more important and causes the broaden-ing of the extinction peaks.
The eight mineral components used for ash retrieval to-gether with their source of optical constants are presented inTable 1, while the resulting extinction spectra are depicted inFig. 1. The selection of minerals is based on reports of min-eralogical composition for Andean volcanoes indicating thattheir ash contains high fractions of quartz or silicate glass(like obsidian) and feldspars (e.g. Watt et al., 2009; Alfanoet al., 2011). In contrast to many previous studies (e.g. Prata,1989; Wen and Rose, 1994; Clarisse et al., 2010), no min-eral spectra of “bulk ash compositions” have been used herein order to (be generally able to) account for variable frac-tions of distinct mineral components. The spectra of the dif-ferent components are normalized by the integrated extinc-tion over the retrieval domain (833 cm−1–1250 cm−1, equals8 µm–12 µm in wavelength space) in Fig. 1 for visualisationpurposes.
The list of components is definitely not complete to con-sider all volcanic minerals. Due to the different mineralogies
of volcanic ash from different regions or geological processes(e.g. subduction zones or mid-ocean ridges), it is not clear ifone list of useful mineral components can be applied glob-ally. However, eight components are sufficient for the re-trieval of volcanic ash in reasonable computing time. Theyalso provide enough spectral variability to search for the bestfit in the observations. Apart from that, these spectra repre-sent a selection of minerals with rather strong deviations inspectral features between each other compared to other min-erals. Nevertheless, it is not envisaged or suggested that theretrieval components cover the full mineralogy of volcanicash.
Furthermore, it is not claimed that the resulting mineralog-ical composition as calculated in the retrieval represents thetrue composition of the volcanic ash. As has been outlinedabove, the role of particle size on scattering properties of theash has not been analysed in detail. Since no explicit forwardmodelling is used in the retrieval, it is difficult to performan information content analysis by calculating averaging ker-nels (see e.g. Rodgers, 2000). The role of particle scatteringon composition information content has to be investigated inmore detail in the future. Gangale et al. (2010) conclude thatash retrievals from TIR sounders are sensitive to compositionand particle size of the ash besides optical depth due to thereasons outlined above. Consequently, the best fit of compo-nents with variable extinction spectra can also be affected bythe particle size distribution, representing scattering effectsof larger ash particles (see also Salisbury and Wald, 1992).Although the mineral extinction models are selected to fitvolcanic ash plumes, they also have to include silicates whichare also abundant in desert dust (e.g. SiO2, feldspars). Thus,the retrieval will also be sensitive to airborne mineral dust.
Ice clouds can also be detected from IASI with the samemethod as the ash retrieval run with ice cloud optical proper-ties (Warren, 1984). Information on ice clouds is used quali-tatively only due to lacking validation.
3 Observation and analysis of the ash plume
Figure 2 shows the evolution of the PCCE ash plume duringthe initial phase of the eruption as seen in IASI AOD. Thevolcano is indicated in the maps by the white triangle near theplume origin in Chile. The plume evolution is depicted foreach overpass of the MetOp satellite, i.e. at about 09:45 localtime in the morning (descending orbits) and about 21:45 lo-cal time in the evening (ascending orbits). The retrieval hasbeen limited to latitudes between 20◦ S and 60◦ S in order toreduce processing costs. Ash optical depth at 10 µm reachesvalues of more than 1.5 in the plume center. The plume iscovered very well by the IASI observations, although thereare hardly any observations directly above the volcano. Itis obvious that some lower mineral AOD observations overnorthern parts of Chile are not related to the PCCE plume
38 L. Kl user et al.: Observation of volcanic ash from Puyehue–Cordon Caulle
Fig. 1. Left: Extinction spectra of volcanic minerals in wavenumber (ν) space. The vertical dashed black lines delimit the ozone absorptionband not used by the retrieval (see Kluser et al., 2011). Right: Single scattering albedo of the feldspars (plagioclase in red and orthoclase inblue) for three different size distributions inspired from OPAC dust modes (solid: nucleation mode, dashed: accumulation mode, dash-dot:coarse mode).
Fig. 2.Ash Optical Depth at 10 µm of the PCCE plume for 5 through6 June. Descending (desc.) orbits represent morning observations,ascending (asc.) orbits are from local evening. The black triangleindicates the position of the volcano.
Table 1. Mineral components used in the retrieval and source ofoptical constants.
Mineral Source
Obsidian Koike et al. (1989)Palagonite Roush et al. (1991)Bytownite (Plagioclase) Aronson et al. (1979)Orthoclase Aronson (1986)Saponite Roush et al. (1991)Forsterite (Olivine) Servoin and Pirou (1973)Augite (Clinopyroxene) Aronson et al. (1979)Orthopyroxene Roush et al. (1991)
(especially on 6 June). These may well be observations ofairborne desert dust.
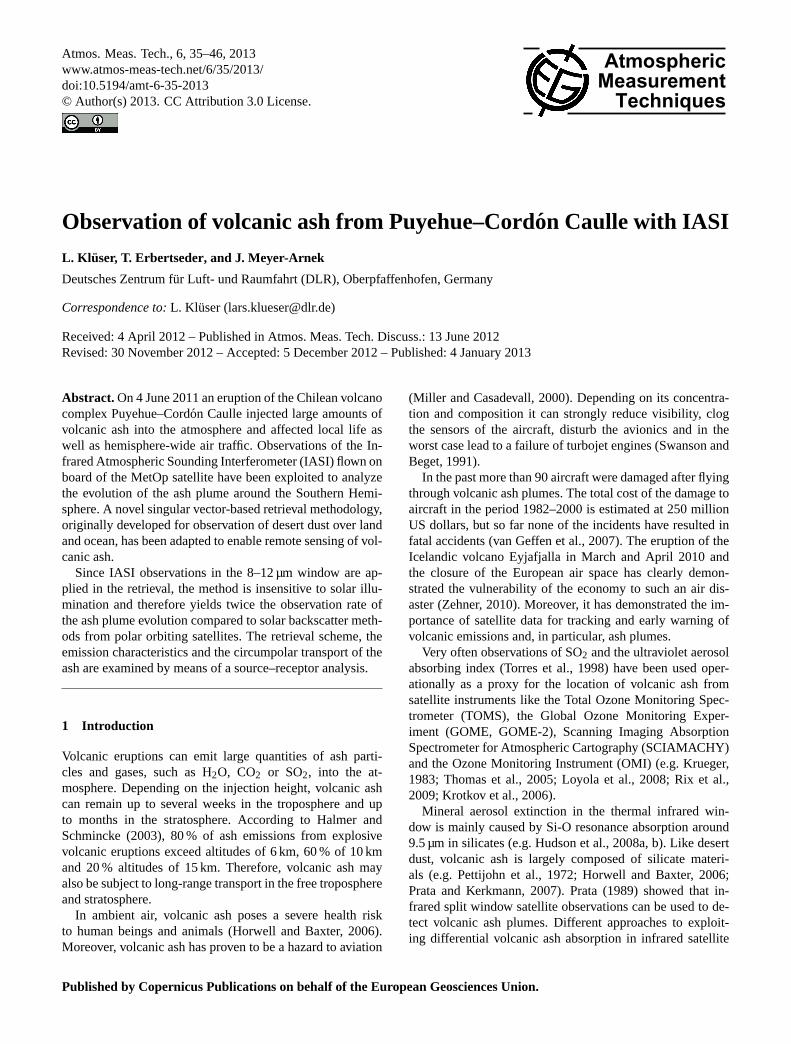
Figure 3 shows the volcanic ash plume through the sub-sequent days (7 and 8 June). On 7 June, parts of the plumedirectly above the volcanic source and also north of 30◦ Sare missed due to orbit gaps and ice clouds (see Fig. 4).The missed ash is advected further east and again detectedat the Atlantic Ocean coast in the evening (visible on 8 Junein Fig. 3).
With IASI it is not possible to retrieve volcanic ash AODbelow or within ice clouds. Moreover, within the 12 km IASIpixels mixtures of ice and ash or ice coatings on ash parti-cles may occur. Thus, one is also interested in the positionand opacity of ice clouds. As a first assessment, resulting ex-tinction spectra of the ash plume are mixed with ice cloudextinction spectra (Warren, 1984) for ice cloud contributionsof 0 %, 25 %, 50 %, 75 % and pure ice cloud. For each ash-ice mixture the correlation coefficient between composedash-ice extinction spectrum and observed linear combination
L. Kl user et al.: Observation of volcanic ash from Puyehue–Cordon Caulle 39
Fig. 3.The PCCE ash plume on its way around the Southern Hemi-sphere for descending MetOp orbits from 7, 8, 12 and 13 June.
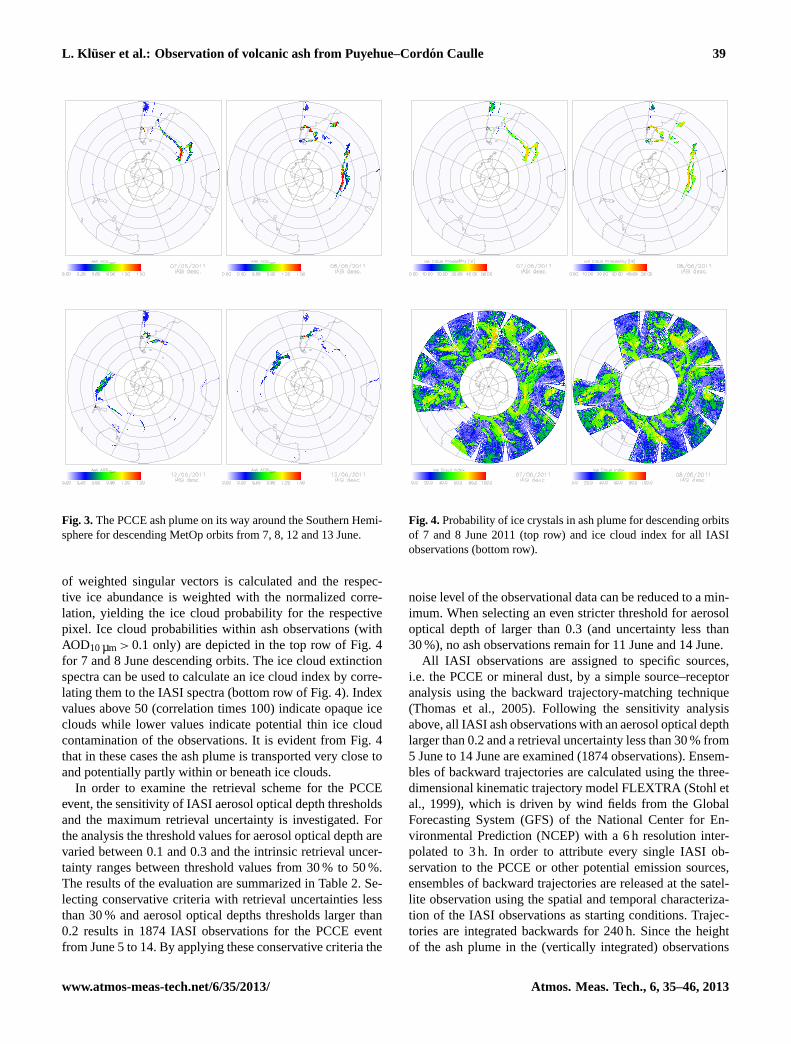
of weighted singular vectors is calculated and the respec-tive ice abundance is weighted with the normalized corre-lation, yielding the ice cloud probability for the respectivepixel. Ice cloud probabilities within ash observations (withAOD10µm > 0.1 only) are depicted in the top row of Fig. 4for 7 and 8 June descending orbits. The ice cloud extinctionspectra can be used to calculate an ice cloud index by corre-lating them to the IASI spectra (bottom row of Fig. 4). Indexvalues above 50 (correlation times 100) indicate opaque iceclouds while lower values indicate potential thin ice cloudcontamination of the observations. It is evident from Fig. 4that in these cases the ash plume is transported very close toand potentially partly within or beneath ice clouds.
In order to examine the retrieval scheme for the PCCEevent, the sensitivity of IASI aerosol optical depth thresholdsand the maximum retrieval uncertainty is investigated. Forthe analysis the threshold values for aerosol optical depth arevaried between 0.1 and 0.3 and the intrinsic retrieval uncer-tainty ranges between threshold values from 30 % to 50 %.The results of the evaluation are summarized in Table 2. Se-lecting conservative criteria with retrieval uncertainties lessthan 30 % and aerosol optical depths thresholds larger than0.2 results in 1874 IASI observations for the PCCE eventfrom June 5 to 14. By applying these conservative criteria the
Fig. 4.Probability of ice crystals in ash plume for descending orbitsof 7 and 8 June 2011 (top row) and ice cloud index for all IASIobservations (bottom row).
noise level of the observational data can be reduced to a min-imum. When selecting an even stricter threshold for aerosoloptical depth of larger than 0.3 (and uncertainty less than30 %), no ash observations remain for 11 June and 14 June.
All IASI observations are assigned to specific sources,i.e. the PCCE or mineral dust, by a simple source–receptoranalysis using the backward trajectory-matching technique(Thomas et al., 2005). Following the sensitivity analysisabove, all IASI ash observations with an aerosol optical depthlarger than 0.2 and a retrieval uncertainty less than 30 % from5 June to 14 June are examined (1874 observations). Ensem-bles of backward trajectories are calculated using the three-dimensional kinematic trajectory model FLEXTRA (Stohl etal., 1999), which is driven by wind fields from the GlobalForecasting System (GFS) of the National Center for En-vironmental Prediction (NCEP) with a 6 h resolution inter-polated to 3 h. In order to attribute every single IASI ob-servation to the PCCE or other potential emission sources,ensembles of backward trajectories are released at the satel-lite observation using the spatial and temporal characteriza-tion of the IASI observations as starting conditions. Trajec-tories are integrated backwards for 240 h. Since the heightof the ash plume in the (vertically integrated) observations
40 L. Kl user et al.: Observation of volcanic ash from Puyehue–Cordon Caulle
Fig. 5.Backward trajectories released for the IASI observations on 11 June (left) and 13 June (right) filtered for PCCE depicting the source–receptor relationship. In the bottom panel the matching backward trajectories are plotted as a function of height. The triangle symbolizesthe volcano (source), the cross the observation (receptor where the backward trajectory was initialized). The observation time follows twogroups, the ascending and descending orbit.
Table 2.Sensitivity of the number of IASI observations to aerosol optical depth thresholds (AOD) and maximum retrieval uncertainty (ERR)for the eruptive period from 5 June to 14 June 2011. For the analysis the threshold values for aerosol optical depth vary between 0.1 and 0.3and the retrieval uncertainty between threshold values ranging from 30 % to 50 %.
L. Kl user et al.: Observation of volcanic ash from Puyehue–Cordon Caulle 41
is unknown, the trajectories are initialized every 250 m from1 km to 15 km altitude. Filtering the resulting ensemble oftrajectories for the PCCE source allows confirming the vol-canic origin of the detected (ash) particles and excludingother sources. It enables estimation of the effective emis-sion height over the volcano as well as the effective height ofthe ash plume using the vertical wind shear. The accuracy ofthe trajectory-matching approach was evaluated in Thomaset al. (2005) using ground-based measurements of SO2 andaerosols.
Figure 5 shows the backward trajectories released forall IASI observations as described above on 11 June and13 June, filtered for PCCE. Please note that the highest tra-jectories are plotted on top. Despite a transport time of partlyover 192 h, ash observations can be assigned to the PCCE.The altitude range of the trajectories that can be traced backto an emission on 4 June and 5 June varies from 6 to 16 km.The effective emission height for the initial eruption basedon these selected observation dates can be assigned to 9 to16 km. Using the observations on 13 June, for the subsequenteruption on 11 June, altitude levels of the plume between 4and 7 km are exhibited, while the effective emission heightcan be confined from 5 to 7 km. The ash observations at45◦ W/40◦ S on 13 June originate from a repeat minor erup-tion on 12 June and can be assigned to altitude levels between9 and 11 km.
Coherent long-range transport of the ash plume can beseen for the whole period. The source–receptor analysis for11 June still represents well the pronounced wind shear tothe east of Chile that could be observed by IASI (see Fig. 2).Ensembles of trajectories stay coherent depending on the ef-fective emission height.
Evaluating the results of the trajectory analysis describedabove, Fig. 6 shows the percentage of IASI observations perday that can be assigned to the PCCE source. The given datesrefer to the date of observation. Despite the application ofa simple source–receptor analysis and global wind fields itcan be demonstrated that the majority of observations from5 June to 12 June can be assigned to the PCCE. It is also ev-ident that the numbers decrease with increasing travel timeup to 216 h taking into account that the majority of ash wasreleased on 5 to 6 June. However, the result is somewhatdisturbed as such that continued ash emissions prevail till13 June.
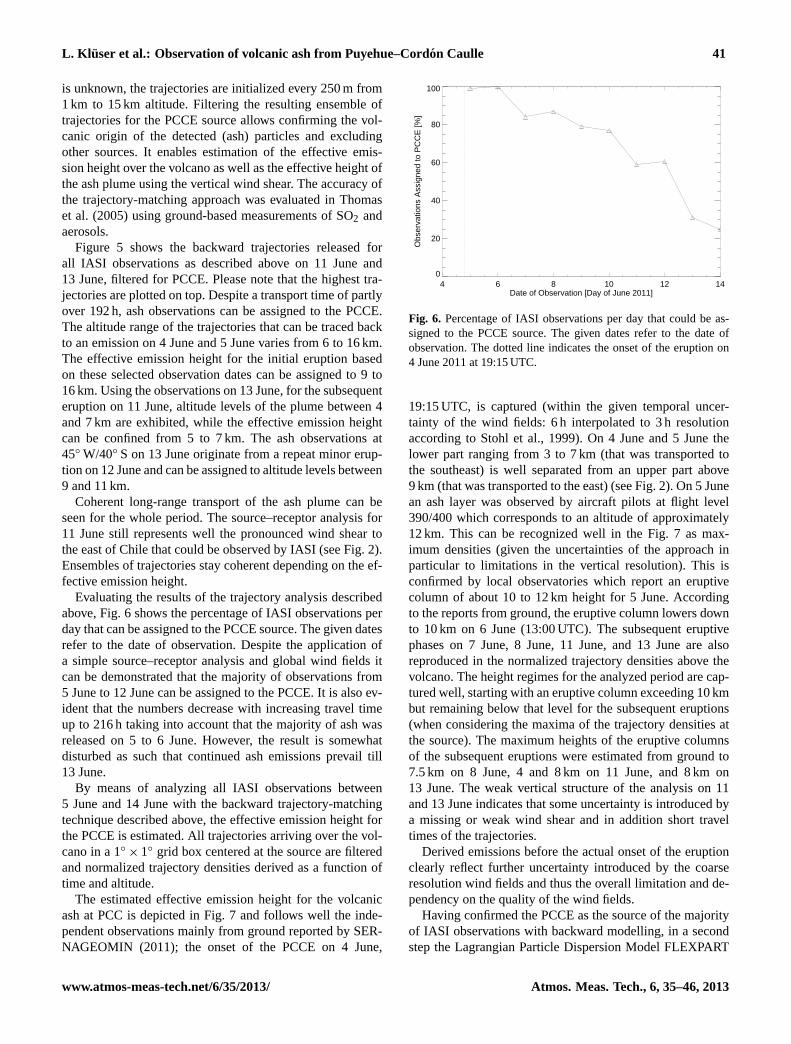
By means of analyzing all IASI observations between5 June and 14 June with the backward trajectory-matchingtechnique described above, the effective emission height forthe PCCE is estimated. All trajectories arriving over the vol-cano in a 1◦ × 1◦ grid box centered at the source are filteredand normalized trajectory densities derived as a function oftime and altitude.
The estimated effective emission height for the volcanicash at PCC is depicted in Fig. 7 and follows well the inde-pendent observations mainly from ground reported by SER-NAGEOMIN (2011); the onset of the PCCE on 4 June,
4 6 8 10 12 14Date of Observation [Day of June 2011]
0
20
40
60
80
100
Obs
erva
tions
Ass
igne
d to
PC
CE
[%]
Fig. 6. Percentage of IASI observations per day that could be as-signed to the PCCE source. The given dates refer to the date ofobservation. The dotted line indicates the onset of the eruption on4 June 2011 at 19:15 UTC.
19:15 UTC, is captured (within the given temporal uncer-tainty of the wind fields: 6 h interpolated to 3 h resolutionaccording to Stohl et al., 1999). On 4 June and 5 June thelower part ranging from 3 to 7 km (that was transported tothe southeast) is well separated from an upper part above9 km (that was transported to the east) (see Fig. 2). On 5 Junean ash layer was observed by aircraft pilots at flight level390/400 which corresponds to an altitude of approximately12 km. This can be recognized well in the Fig. 7 as max-imum densities (given the uncertainties of the approach inparticular to limitations in the vertical resolution). This isconfirmed by local observatories which report an eruptivecolumn of about 10 to 12 km height for 5 June. Accordingto the reports from ground, the eruptive column lowers downto 10 km on 6 June (13:00 UTC). The subsequent eruptivephases on 7 June, 8 June, 11 June, and 13 June are alsoreproduced in the normalized trajectory densities above thevolcano. The height regimes for the analyzed period are cap-tured well, starting with an eruptive column exceeding 10 kmbut remaining below that level for the subsequent eruptions(when considering the maxima of the trajectory densities atthe source). The maximum heights of the eruptive columnsof the subsequent eruptions were estimated from ground to7.5 km on 8 June, 4 and 8 km on 11 June, and 8 km on13 June. The weak vertical structure of the analysis on 11and 13 June indicates that some uncertainty is introduced bya missing or weak wind shear and in addition short traveltimes of the trajectories.
Derived emissions before the actual onset of the eruptionclearly reflect further uncertainty introduced by the coarseresolution wind fields and thus the overall limitation and de-pendency on the quality of the wind fields.
Having confirmed the PCCE as the source of the majorityof IASI observations with backward modelling, in a secondstep the Lagrangian Particle Dispersion Model FLEXPART
42 L. Kl user et al.: Observation of volcanic ash from Puyehue–Cordon Caulle
Fig. 7. Normalized trajectory density above PCC from 1 June to15 June as indicator for the effective emission height of the volcanicash derived by applying a source–receptor analysis using ensemblesof backward trajectories.
(Stohl et al., 2005) has been applied to perform forward cal-culations. In contrast to the FLEXTRA model used for thebackward trajectory analysis, the particle dispersion modelFLEXPART is applied for forward calculations of air traceradvection. Moreover, sub-scale processes introducing in-creased dispersion as well as particle removal are considered.In our study, the particles are regarded as passive tracers;hence no chemical conversion takes place. Applying bothFLEXTRA and FLEXPART can be used to prove the source–receptor relationship, including diffusion, and to derive a sec-ond estimate for the effective emission height, indicating un-certainties inherent in the trajectory modelling approaches.
For this study no a priori information is used for the FLEX-PART simulations. Large amounts of particles with a unitmass were simulated to be emitted above Puyehue–CordonCaulle from 2 to 14 km above ground in height level slices of1000 m. They are continuously released at a frequency of 6 hfrom 4 June to 13 June (the same time range covered by theFLEXTRA analysis). Such an approach has been introducedto study SO2 emission profiles of the Jebel at-Taır eruptionin 2007 (Eckhardt et al., 2008).
The dispersion model simulation is driven by the identicalGFS forecasts which have been applied by the FLEXTRAanalysis (already discussed above).
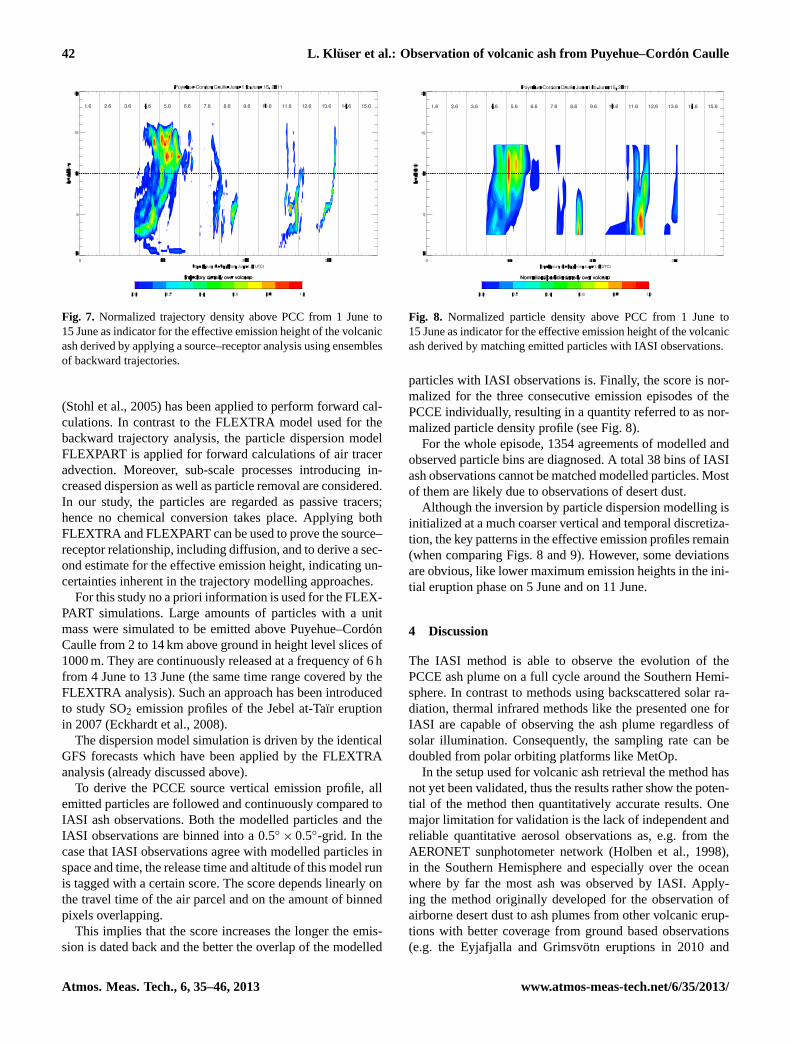
To derive the PCCE source vertical emission profile, allemitted particles are followed and continuously compared toIASI ash observations. Both the modelled particles and theIASI observations are binned into a 0.5◦
× 0.5◦-grid. In thecase that IASI observations agree with modelled particles inspace and time, the release time and altitude of this model runis tagged with a certain score. The score depends linearly onthe travel time of the air parcel and on the amount of binnedpixels overlapping.
This implies that the score increases the longer the emis-sion is dated back and the better the overlap of the modelled
Fig. 8. Normalized particle density above PCC from 1 June to15 June as indicator for the effective emission height of the volcanicash derived by matching emitted particles with IASI observations.
particles with IASI observations is. Finally, the score is nor-malized for the three consecutive emission episodes of thePCCE individually, resulting in a quantity referred to as nor-malized particle density profile (see Fig. 8).
For the whole episode, 1354 agreements of modelled andobserved particle bins are diagnosed. A total 38 bins of IASIash observations cannot be matched modelled particles. Mostof them are likely due to observations of desert dust.
Although the inversion by particle dispersion modelling isinitialized at a much coarser vertical and temporal discretiza-tion, the key patterns in the effective emission profiles remain(when comparing Figs. 8 and 9). However, some deviationsare obvious, like lower maximum emission heights in the ini-tial eruption phase on 5 June and on 11 June.
4 Discussion
The IASI method is able to observe the evolution of thePCCE ash plume on a full cycle around the Southern Hemi-sphere. In contrast to methods using backscattered solar ra-diation, thermal infrared methods like the presented one forIASI are capable of observing the ash plume regardless ofsolar illumination. Consequently, the sampling rate can bedoubled from polar orbiting platforms like MetOp.
In the setup used for volcanic ash retrieval the method hasnot yet been validated, thus the results rather show the poten-tial of the method then quantitatively accurate results. Onemajor limitation for validation is the lack of independent andreliable quantitative aerosol observations as, e.g. from theAERONET sunphotometer network (Holben et al., 1998),in the Southern Hemisphere and especially over the oceanwhere by far the most ash was observed by IASI. Apply-ing the method originally developed for the observation ofairborne desert dust to ash plumes from other volcanic erup-tions with better coverage from ground based observations(e.g. the Eyjafjalla and Grimsvotn eruptions in 2010 and
L. Kl user et al.: Observation of volcanic ash from Puyehue–Cordon Caulle 43
2011, respectively) will result in a quantitative evaluation ofthe application to volcanic ash in the future. Distinguishingvolcanic ash from other aerosols remains an unsolved prob-lem, especially for monitoring and alerting purposes. TheIASI method has been shown to be sensitive to coarse mode,mainly silicate, aerosol particles only in the desert dust setup(Kl user et al., 2012). Thus, it can be assumed that the vol-canic ash setup is also insensitive to other aerosol types suchas industrial aerosols, biomass burning aerosol and sea salt.Nevertheless, it is not yet clear if a distinction between vol-canic ash and desert dust will be possible with this method.
The current setup of the volcanic ash retrieval uses mod-elled extinction spectra. Hudson et al. (2008a, b) clearlyshowed that modelling extinction spectra, also with methodsbetter suited than Mie theory, does not fully represent spec-tral variability of mineral extinction. Moreover, the role ofscattering impacts on the extinction spectra is currently notfully addressed.
By means of ensemble backward trajectory-matching andforward Lagrangian particle dispersion modelling withoutusing a priori information, the source–receptor relationshipcould be analyzed and the volcanic origin of the majority ofthe IASI observations proven. In doing so the effective emis-sion height of the ash at PCC was estimated and an indica-tion of the plume height could be derived. Therefore theseapproaches add information content to the vertically inte-grated IASI ash observations, which is very relevant for avi-ation safety and studies of stratospheric injections. A com-parison with observations mainly from ground shows goodagreement, given the use of global wind field at 6 h resolu-tion.
Despite the existence of more sophisticated inversionschemes as applied in Stohl et al. (2011) for the eruption ofEyjafjalla in Iceland, these simple approaches have proven tobe robust and efficient for the purpose of analyzing a qualita-tive source–receptor relationship in a near-real-time environ-ment. Ensemble backward trajectory-matching and forwardLagrangian particle dispersion modelling methods are sim-ple compared to a full inversion of the Lagrangian transport(Seibert et al., 2011) or adjoint retroplume approaches (Is-sartel and Baverel, 2003), which are still among the suite ofapplied methods (Baklanov et al., 2011).
However, all methods strongly rely on the vertical windshear and depend on the quality of the wind fields. In thisstudy, global wind fields from the Global Forecasting System(NCEP) at 6 h resolution interpolated to 3 h have been used.Kristiansen et al. (2012) have compared these wind fields toalternative data from the European Center for Medium RangeWeather Forecast (ECMWF) and found that the source termswere robust to which meteorological data was used. Still theglobal data sets exhibit a coarse resolution compared to thepronounced orography in the Andes and the volcanic fissureof PCC in particular. Furthermore, micro- and meso-scaleprocesses triggered by the eruption significantly influence thelocal meteorology. Seibert et al. (2011) conclude, however,
that eruption column models are not a good alternative. Es-pecially in near-real time and for volcanoes that are not moni-tored well, detailed knowledge of eruption source parametersis lacking. Since the focus in this study is on examining thehemispheric transport local effects at the volcano are not con-sidered and global wind fields justified. As can be inferredfrom Figs. 6 and 7, however, the derived emission profilesprior to the actual onset of the eruption clearly reflect the un-certainty introduced by the coarse resolution wind fields andthus the overall limitation of the inversion methods.
5 Conclusion and outlook
A method previously developed for desert dust remote sens-ing with IASI has been adapted for retrieving infrared opticaldepth of volcanic ash plumes. The presented application ofthermal infrared observations enables to observe ash plumestwice daily over land, over ocean and also above low-levelclouds. The volcanic ash retrieval method uses extinctionspectra of different mineral components found in volcanicash rather than fixed “bulk-ash” refractive indices. As spher-ical Mie calculations cause significant errors in positions andstrengths of Si-O resonance peaks the extinction spectra aremodelled with non-spherical approximations. The differentmineralogical components are weighted by a Singular Vectorbased projection scheme also accounting for surface emissiv-ity effects in the observed radiance.
By applying the novel IASI retrieval scheme the plumeof the 2011 Puyehue–Cordon Caulle eruption (PCCE) couldbe tracked along its circum-polar transport in the SouthernHemisphere from 5 June to 14 June. On 14 June parts of theash emitted by PCCE arrived again at the source region fromwesterly directions. The IASI observations were examinedby means of ensembles of backward trajectories and forwardparticle dispersion modelling without using a priori infor-mation. In doing so, the source–receptor relationship couldbe analyzed and the volcanic origin of the majority of theIASI observations proven. In addition, the effective emissionheight of the ash at the volcano through the different eruptionphases was estimated and an indication of the plume heightcould be derived. A comparison with observations mainlyfrom ground, as reported by SERNAGEOMIN (2011), showsfairly good agreement, given the use of global winds fieldsat 6 h resolution and the dependency on vertical wind shear.While the ash was repeatedly emitted into the troposphereat height levels between 3 km and 9 km, during the peak ofthe eruption on 5 June the ash was possibly emitted up to15 km. Both methods clearly indicate an emission peak be-tween 9 km and 14 km. Observations from aircraft report ashat flight levels around 12 km (SERNAGEOMIN, 2011). Al-though two simple modelling approaches were applied, in-formation content is added to the vertically integrated IASIash observations, which is very relevant for aviation safetyand studies of stratospheric injections.
44 L. Kl user et al.: Observation of volcanic ash from Puyehue–Cordon Caulle
The focus of the source–receptor analyses performed herehas been to examine the IASI retrievals qualitatively with re-spect to distinguishing between mineral dust and volcanicash. Supplementary, the potential of retrieving additionalcharacteristics of the eruption like effective emission heightand plume height has been demonstrated without addressingash concentrations.
In general, more quantitative methods to better considerand evaluate ash concentrations and their uncertainty areneeded. A close collaboration between remote sensing andatmospheric modelling is essential to further characterize andelaborate the uncertainties in both observations and analy-sis, and to improve the derivation of the source function forvolcanic ash. It is expected that the presented ash retrievalfrom IASI in combination with inversion modelling and dataassimilation will significantly improve the reliability of ashplume forecasts for aviation safety.
The IASI ash retrieval presented here has been developedbased on a scheme successfully used for remote sensing ofmineral (desert) dust. Although desert dust and volcanic ashhave large similarities insofar as they both are mainly com-posed of silicate minerals and occupy more or less the sameparticle size range, there are also differences like the specificmineralogy impacting on the refractive indices in the thermalinfrared. Consequently, the evaluation results for desert dustcannot be regarded as being representative for the retrieval ofvolcanic ash AOD with IASI. Therefore a larger evaluationstudy of the method with respect to volcanic ash is envisaged,which will use observations of different volcanic eruptionsand will exploit independent space-borne and ground-basedobservation capabilities. For example, independent informa-tion on the plume height, e.g. from space-borne LIDAR in-struments will be applied to verify the height range obtainedfrom the combination of IASI observations with Lagrangianmodelling.
It will be investigated in the future if information on theseparation between aeolian or volcanic origin of the aerosolcan be derived from the satellite observations reliably. More-over, in a subsequent evaluation study it will be investigatedin detail how well optical depth and plume height (see Ack-erman, 1997) are represented by a method which so far isonly quantitatively evaluated for desert dust, and if visibleoptical depth can be derived reliably, which is largely con-trolled by particle size (e.g. Gangale et al., 2010) besides in-frared optical depth. Generally, the interdependence of spec-tral extinction caused by particle size and by mineralogicalcomposition has to be addressed further. A detailed infor-mation content analysis of the retrieval method consideringits assumptions and the single scattering properties of ashparticles needs to be performed at least over ocean, wheresurface emissivity can be assumed to be spectrally homo-geneous. Such an analysis will contribute to proving if thesignals resulting from particle size and composition can bedistinguished by this retrieval method.
Acknowledgements.We are thankful to EUMETSAT and theEUMETSAT Data Centre (UMARF) for providing the IASIobservations from METOP. We kindly acknowledge Andreas Stohland all contributing colleagues for providing the models FLEX-TRA and FLEXPART. Further thanks to the National Centerfor Environmental Prediction (NCEP) for making available themeteorological data of the Global Forecasting System (GFS).Moreover, we express our thanks to two anonymous reviewers andF. Prata for their very constructive comments, which helped toincrease the quality of this paper.
Edited by: R. Schofield
References
Ackerman, S. A.: Remote sensing of aerosol using satellite infraredobservations, J. Geophys. Res., 102, 17069–17079, 1997.
Alfano, F., Bonadonna, C., Volentik., A. C. M., Connor, C. B., Watt,S. F. L., Pyle, D. M., and Connor, L. J.: Tephra stratigraphy amderuptive volume of the May, 2008, Chaiten eruption, Chile, B.Volcanol., 73, 613–630, 2011.
Aronson, J. R.: Optical constants of monoclinic anisotropic crystals:orthoclase, Spectrochim. Acta A, 42, 187–190, 1986.
Aronson, J. R., Emslie, A. G., Smith, E. M., and Strong, P. F.: In-frared spectra of lunar soils and related optical constants, Proc.Lunar Planet. Sci. Conf., 10, 1787–1795, 1979.
Baklanov, A., Aloyan, A., Mahura, A., Arutyunyan, V., and Luzan,P.: Evaluation of source receptor relationship for atmosphericpollutants using approaches of trajectory modelling, cluster,probability fields analyses and adjoint equations, AtmosphericPollution Research, 2, 400–408,doi:10.5094/APR.2011.045,2011.
Clarisse, L., Coheur, P. F., Prata, A. J., Hurtmans, D., Razavi,A., Phulpin, T., Hadji-Lazaro, J., and Clerbaux, C.: Trackingand quantifying volcanic SO2 with IASI, the September 2007eruption at Jebel at Tair, Atmos. Chem. Phys., 8, 7723–7734,doi:10.5194/acp-8-7723-2008, 2008.
Clarisse, L., Hurtmans, D., Prata, A. J. Karagulian, F., Clerbaux, C.,Maziere, M. D., and Coheur, P.-F.: Retrieving radius, concentra-tion, optical depth, and mass of different types of aerosols fromhigh-resolution infrared nadir spectra, Appl. Optics, 49, 3713–3722, 2010.
Clarisse, L., Coheur, P.-F., Prata, F., Hadji-Lazaro, J., Hurtmans,D., and Clerbaux, C.: A unified approach to aerosol remote sens-ing and type specification in the infrared, Atmos. Chem. Phys.Discuss., 12, 26871–26928,doi:10.5194/acpd-12-26871-2012,2012.
Corradini, S., Merucci, L., and Prata, A. J.: Retrieval of SO2 fromthermal infrared satellite measurements: correction proceduresfor the effects of volcanic ash, Atmos. Meas. Tech., 2, 177–191,doi:10.5194/amt-2-177-2009, 2009.
Eckhardt, S., Prata, A. J., Seibert, P., Stebel, K., and Stohl, A.: Esti-mation of the vertical profile of sulfur dioxide injection into theatmosphere by a volcanic eruption using satellite column mea-surements and inverse transport modeling, Atmos. Chem. Phys.,8, 3881–3897,doi:10.5194/acp-8-3881-2008, 2008.
Gangale, G., Prata, A. J., and Clarisse, L.: The infrared spectral sig-nature of volcanic ash determined from high-spectral resolution
Halmer, M. M. and Schmincke, H.-U.: The impact of moderate-scale explosive eruptions on stratospheric gas injections, B. Vol-canol., 65, 433–440, 2003.
Hess, M., Koepke, P., and Schult, I.: Optical Properties of Aerosolsand Clouds: The Software Package OPAC, B. Am. Meteorol.Soc., 79, 831–844, 1998.
Hilger, D. W. and Clarke, J. D.: Prinicipal Component Analysis ofMODIS for volcanic ash Part most important bands and implica-tions for future GOES campaigns, J. Appl. Meteorol., 41, 985–1001, 2002.
Holben, B. N., Eck, T. F., Slutsker, I., Tandre, D., Buis, J. P., Set-zer, A., Vermote, E., Reagan, J. A., Kaufman, Y. J., Nakajima,T., Lavenu, F., Jankowiak, I., and Smirnov, A.: AERONET – afederated instrument network and data archive for aerosol char-acterization, Remote Sens. Environ., 66, 1–16, 1998.
Horwell, C. J. and Baxter, P. J.: The respiratory health hazards ofvolcanic ash: a review for volcanic risk mitigation, B. Volcanol.,69, 1–24, 2006.
Hudson, P. K., Young, M. A., Kleiber, P. D., and Grassian, V.H.: Coupled infrared extinction spectra and size distributionmeasurements for several non-clay components of mineral dustaerosol (quartz, calcite and dolomite), Atmos. Environ., 42,5991–5999, 2008a.
Hudson, P. K., Gibson, E. R., Young, M. A., Kleiber, P.D., and Grassian, V. H.: Coupled infrared extinction andsize distribution measurements for several clay componentsof mineral dust aerosol, J. Geophys. Res., 113, D01201,doi:10.1029/2007JD008791, 2008b.
Issartel, J.-P. and Baverel, J.: Inverse transport for the verificationof the Comprehensive Nuclear Test Ban Treaty, Atmos. Chem.Phys., 3, 475–486,doi:10.5194/acp-3-475-2003, 2003.
Karagulian, F., Clarisse, L., Clerbaux, C., Prata, A. J., Hurtmans,D., and Coheur, P. F.: Detection of volcanic SO2, ash and H2SO4using the Infrared Atmospheric Sounding Interferometer (IASI),J. Geophys. Res., 115, D00L02,doi:10.1029/2009JD012786,2010.
Kl user, L., Martynenko, D., and Holzer-Popp, T.: Thermal infraredremote sensing of mineral dust over land and ocean: a spectralSVD based retrieval approach for IASI, Atmos. Meas. Tech., 4,757–773,doi:10.5194/amt-4-757-2011, 2011.
Kl user, L., Kleiber, P., Holzer-Popp, T., and Grassian, V. H.: Desertdust observation from space – application of measured min-eral component infrared extinction spectra, Atmos. Environ., 54,419–427,doi:10.1016/j.atmosenv.2012.02.011, 2012.
Koike, C., Hasegawa, H., Asada, N., and Komatuzaki, T.: Opticalconstants of fine particles for the infrared region, Mon. Not. R.Astron. Soc., 239, 127–137, 1989.
Kristiansen, N. I., Stohl, A., Prata, A. J., Bukowiecki, N., Dacre, H.,Eckhardt, S., Henne, S., Hort, M. C., Johnson, B. T., Marenco, F.,Neininger, B., Reitebuch, O., Seibert, P., Thomson, D. J., Web-ster, H. N., and Weinzierl, B.: Performance assessment of a vol-canic ash transport model mini-ensemble used for inverse model-ing of the 2010 Eyjafjallajokull eruption, J. Geophys. Res., 117,D00U11,doi:10.1029/2011JD016844, 2012.
Krotkov, N. A., Carn, S. A., Krueger, A. J., Bhartia, P. K., andYang, K.: Band Residual Difference algorithm for retrievalof SO2 from the Aura Ozone Monitoring Instrument (OMI),
IEEE T. Geosci. Remote, AURA Special Issue, 44, 1259–1266,doi:10.1109/TGRS.2005.861932, 2006.
Krueger, A. J.: Sighting of El Chichon sulfur dioxide clouds withthe Nimbus 7 total ozone mapping spectrometer, Science, 220,1377–1379, 1983.
Larar, A. M., Smith, W. L., Zhou, D. K., Liu, X., Revercomb, H.,Taylor, J. P., Newman, S. M., and Schlussel, P.: IASI spectral ra-diance validation inter-comparisons: case study assessment fromthe JAIVEx field campaign, Atmos. Chem. Phys., 10, 411–430,doi:10.5194/acp-10-411-2010, 2010.
Laksina, O., Young, M. A., Kleiber, P. D., and Grassian, V. H.:Infrared extinction spectra of mineral dust aerosol: Single com-ponents and complex mixtures, J. Geophys. Res., 117, D18210,doi:10.1029/2012JD017756, 2012.
Loyola, D., van Geffen, J., Valks, P., Erbertseder, T., Van Roozen-dael, M., Thomas, W., Zimmer, W., and Wißkirchen, K.:Satellite-based detection of volcanic sulphur dioxide from recenteruptions in Central and South America, Adv. Geosci., 14, 35–40,doi:10.5194/adgeo-14-35-2008, 2008.
Miller, T. P. und Casadevall, T.: Volcanic ash hazards to aviation, in:Encyclopedia of volcanoes, edited by: Sigurdsson, H., AcademicPress, San Diego, California, USA, 2000.
Pettijohn, F. J., Potter, P. E., and Siever, R.: Sand and Sandstone,Springer Verlag, New York, USA, 1972.
Pollack, J. B., Toon, O. B., and Khare, B. N.: Optical properties ofsome terrestrial rocks and glasses, Icarus, 19, 372–389, 1973.
Prata, A. J.: Observations of volcanic ash clouds in the 10–12 µmwindow using AVHRR/2 data, Int. J. Remote Sens., 10, 751–761,1989.
Prata, A. J. and Kerkmann, J.: Simultaneous retrieval of volcanicash and SO2 using MSG-SEVIRI measurements, Geophys. Res.Lett., 34, L05813,doi:10.1029/2006GL028691, 2007.
Rix, M., Valks, P., Hao, N., van Geffen, J., Clerbaux, C., Clarisse,L., Coheur, P.-F., Loyola, D., Erbertseder, T., Zimmer, W., andEmmadi, S.: Satellite monitoring of volcanic sulfur dioxide emis-sions for early warning of volcanic hazards, IEEE J. Sel. TopAppl., 2, 196–206, 2009.
Rodgers, C. D.: Inverse methods for atmospheric sounding, Theoryand practice, in: Series on Atmospheric, Oceanic and PlanetaryPhysics, Vol. 2, World Scientific Publishing, Singapore, 2000.
Roush, T., Pollack, J., and Orenberg, J.: Derivation of Midinfrared(5–25 µm) optical constants of some silicates and palagonite,Icarus, 94, 191–208, 1991.
Salisbury, J. W. and Wald, A.: The role of volume scattering in re-ducing spectral contrast of reststrahlen bands in spectra of pow-dered minerals, Icarus, 96, 121–128, 1992.
Seibert, P., Kristiansen, N. I., Richter, A., Eckhardt, S., Prata, A. J.,and Stohl, A.: Uncertainties in the inverse modelling of sulphurdioxide eruption profiles, Geomatics, Natural Hazards and Risk,2, 201–216, 2011.
SERNAGEOMIN (Servicio Nacional de Geologia y Mineria): Re-portes Escpeciales de Actividad Volcanica No. 27–39, Ob-servatorio Volcanologico des los Andes del Sur (OVDAS),Red Nacional de Vigilancia Volcanica (RNVV), available at:http://www.sernageomin.cl/volcan.php?iId=38(last access: June2012), 2011.
Servoin, J. L. and Piriou, B.: Infrared reflectivity and raman scatter-ing of Mg2SiO4 single crystal, Phys. Status Solidi. B, 55, 677–686, 1973.
46 L. Kl user et al.: Observation of volcanic ash from Puyehue–Cordon Caulle
Stohl, A., Haimberger, L., Scheele, M., and Wernli, H.: An inter-comparison of results from three trajectory models, Meteorol.Appl., 8, 127–135, 1999.
Stohl, A., Forster, C., Frank, A., Seibert, P., and Wotawa, G.:Technical note: The Lagrangian particle dispersion modelFLEXPART version 6.2, Atmos. Chem. Phys., 5, 2461–2474,doi:10.5194/acp-5-2461-2005, 2005.
Stohl, A., Prata, A. J., Eckhardt, S., Clarisse, L., Durant, A., Henne,S., Kristiansen, N. I., Minikin, A., Schumann, U., Seibert, P.,Stebel, K., Thomas, H. E., Thorsteinsson, T., Tørseth, K., andWeinzierl, B.: Determination of time- and height-resolved vol-canic ash emissions and their use for quantitative ash disper-sion modeling: the 2010 Eyjafjallajokull eruption, Atmos. Chem.Phys., 11, 4333–4351,doi:10.5194/acp-11-4333-2011, 2011.
Swanson, S. E. and Beget, J.: Melting properties of volcanic ash,in: Volcanic ash and aviation safety – Proceedings of the FirstInternational Symposium on Volcanic Ash and Aviation Safety,US Geological Survey Bulletin 2047, Seattle, Washington, USA.,1991.
Thomas, M. and Gautier, C.: Investigations of the March 2006Africa dust storm using ground-based column-integrated highspectral resolution infrared (8–13 µm) and visible aerosol opticalthickness measurements: 2. Mineral aerosol mixture analysis, J.Geophys. Res., 114, D14209,doi:10.1029/2008JD010931, 2009.
Thomas, W., Erbertseder, T., Ruppert, T., van Roozendael, M.,Verdebout, J., Meleti, C., Balis, D., and Zerefos, C.: On theretrieval of Volcanic Sulfur Dioxide Emissions from GOMEbackscatter measurements, J. Atmos. Chem., 50, 295–320, 2005.
Torres, O., Bhartia, P. K., Herman, J. R., Ahmad, Z., and Gleason, J.:Derivation of aerosol properties from satellite measurements ofbackscattered ultraviolet radiation, Theoretical basis, J. Geophys.Res., 103, 17099–17110, 1998.
van Geffen, J., van Roozendael, M., Di Nicolantonio, W., Tam-pellini, L., Valks, P., Erbertseder, T., and van der A, R.: Moni-toring of volcanic activity from satellites as part of the GMESService Element Atmosphere (PROMOTE), Proceedings of theENVISAT Symposium, 23–27 April 2007, Montreux, Switzer-land, ESA publication SP-636, 2007.
Volz, F. E.: Infrared optical constants of ammonium sulphate, Sa-hara dust, volcanic pumice, and flyash, Appl. Optics, 12, 564–568, 1973.
Warren, S. G.: Optical constants of ice from the ultraviolet to themicrowave, Appl. Optics, 23, 1206–1225, 1984.
Watt, S. F. L., Pyle, D. M., Mather, T. A., Martin, R. S.,and Matthews, N. E.: Fallout and distribution of volcanicash over Argentina following the May 2008 explosive erup-tion of Chaiten, Chile, J. Geophys. Res., 114, B04207,doi:10.1029/2008JB006219, 2009.
Wen, S. and Rose, W. I.: Retrieval of sizes and total masses of par-ticles in volcanic clouds using AVHRR channels 4 and 5, J. Geo-phys. Res., 99, 5421–5431, 1994.
Yang, P., Feng, Q., Hong, G., Kattawar, G. W., Wiscombe, W. J.,Mishchenko, M. I., Dubovik, O., Laszlo, I., and Sokolik, I. N.:Modelling of the scattering and radiative properties of nonspher-ical dust-like aerosols, J. Aerosol Sci., 28, 995–1014, 2007.
Zehner, C. (Ed.): Monitoring Volcanic Ash from Space, ESA-EUMETSAT Workshop on the 14 April to 23 May 2010 eruptionat the Eyjafjoll volcano, South Iceland, ESA/ESRIN, STM-280,2010.