45
Observational Surveys: Implementation and Analysis
| Date post: | 30-Dec-2015 |
| Category: |
Documents |
| Upload: | ava-norman |
| View: | 35 times |
| Download: | 0 times |

Observational Surveys: Implementation and
Analysis
2
Observational Surveys - Speakers
William W. Stenzel, D.Sc.– Associate Director, Center for Public Safety
(Management Consulting)
Roy E. Lucke– Director, Research and Development for the
Center for Public Safety

3
Notebook Materials
A hardcopy of all of the PowerPoint slides for this session (“Observational Surveys”) can be found in the seminar notebook.

4
Why Use Observational Surveys?
For the Illinois Traffic Stop Statistics Study, “disparities” are going to be calculated by comparing:– the racial composition of traffic stops– the racial composition of the driver population.
The racial composition of the driver population is going to estimated by using “adjusted census data” at the city and county level.
5
Why Use Observational Surveys?
What options does an agency have if there is concern that the adjusted census data will not provide accurate information about the racial composition of the driver population in its jurisdiction?
One option is to obtain a better estimate of the racial composition of the driver population with the use of observational surveys.
6
Center for Public Safety Experience with Observational Surveys
The Center for Public Safety has conducted three observational surveys for agencies in Illinois:
– Highland Park (Sept-Oct 2001 – Stenzel)– Hinsdale (May 2004 – Lucke)– Schaumburg (August 2004 – Lucke)
7
Observational Survey Topics
Observational Surveys:
– Topic 1: Data Collection the nuts and bolts of how to conduct a survey
– Topic 2: Data Summarization putting the survey data into a format suitable for
review and analysis
– Topic 3: Data Analysis comparing and assessing the survey and traffic
stop data

8
Observational Surveys - Topic 1
Topic 1: Data Collection
The nuts and bolts of how to conduct a survey

9
Conducting Observational Studies
Once the decision is made to do an observation
study, there are three major tasks:
Determining what data to collect Identifying data collection sites Recruiting and training observers
10
Conducting Observational Studies
In addition to the three major tasks, other steps include:
Scheduling data collection Equipping the data collectors Developing forms, data entry and data
analysis procedures

11
Preliminary Information
It is only possible to obtain good driver demographic information from stopped vehicles
Observations can only be made at intersections with traffic signals or stop signs– Efforts to observe drivers on controlled-access
roadways were not successful
12
Site Selection
Primary Criteria
– Conduct observations at or near intersections that are among the agency’s high traffic stop locations.
– Agency should try to identify locations for all stops, not just where citations are issued
– Also identify times of day and days of week for stops so observation times can be matched as well as possible

13
Site Selection, Continued
Site must provide a good view of stopped vehicles– Steep shoulders may raise observers too high– “Sweeping” right turn lanes might keep observers
too far from lanes to see– No limit on number of lanes – observers need only
check lanes they can clearly see Site must be safe for observers
– There must be a shoulder or sidewalk – curbs are desirable
– Observers must be free from potential harassment

14
Survey Sessions
Session is a 2 or 3 hour observation period Sessions should be distributed across all days of
the week, according to traffic stop information Sessions can be done
– Mornings– Afternoons– Early evenings– Again, dependent on stop information and available
daylight Surveys should be done in both directions of
travel
15
The Survey Team
Three individuals are needed for each session– Observer– Recorder– Counter

16
The Survey Team, Continued
Team members can be recruited from a number of possible sources. – Agency volunteers or auxiliaries– College students (e.g., criminal justice students)– Crossing guards– Temporary labor pools– Etc.

17
The Survey Team, Continued
Training must be provided to survey team members– Classroom instruction covering the nature of the
project and what they will be expected to do– Practice sessions under guidance of project leaders
Team members must be scheduled in groups of threes at dates and times identified for surveys. – Have substitutes available– Project leaders should oversee all observation sessions

18
Sample Agenda for Observer Training
Agenda Review Agenda Complete Forms Driver Survey Vehicle Counter Field Work Schedule/Signups
19
Survey Team Equipment
Safety vests
Traffic counting devices (or digital cameras)
Clipboards and pencils
Rain gear (ponchos, umbrellas, “writing pouches”)
20
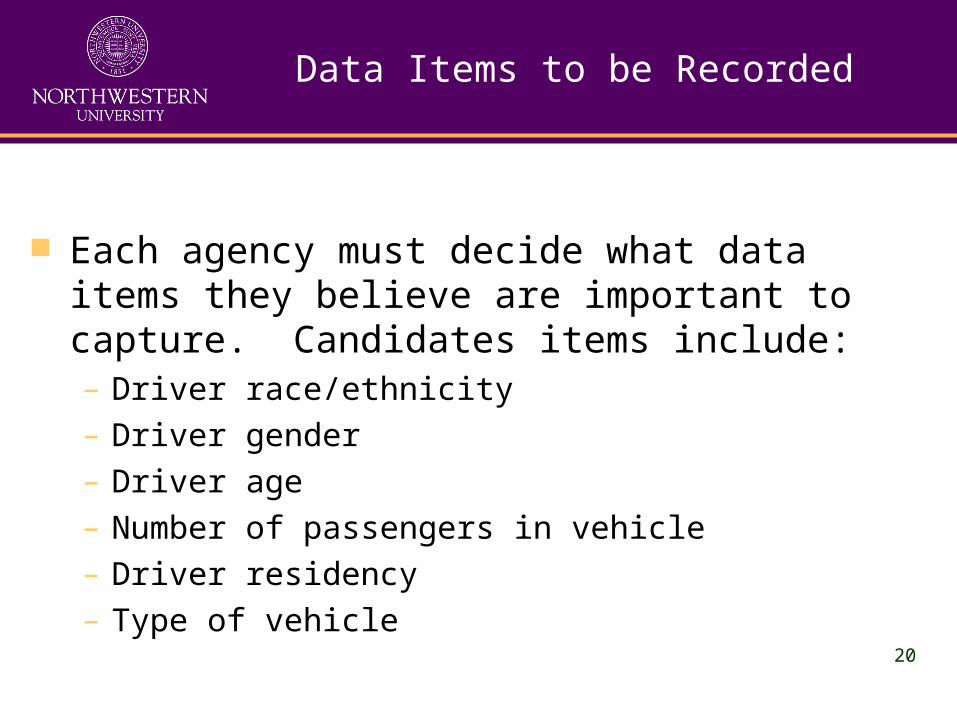
Data Items to be Recorded
Each agency must decide what data items they believe are important to capture. Candidates items include:– Driver race/ethnicity– Driver gender– Driver age– Number of passengers in vehicle– Driver residency– Type of vehicle

21
Data Collection
Paper “check mark” form Scantron form Palm or other hand-held device Tablet-type personal computer
Each session should be stored as a separate file, either in a physical packet or data file
22
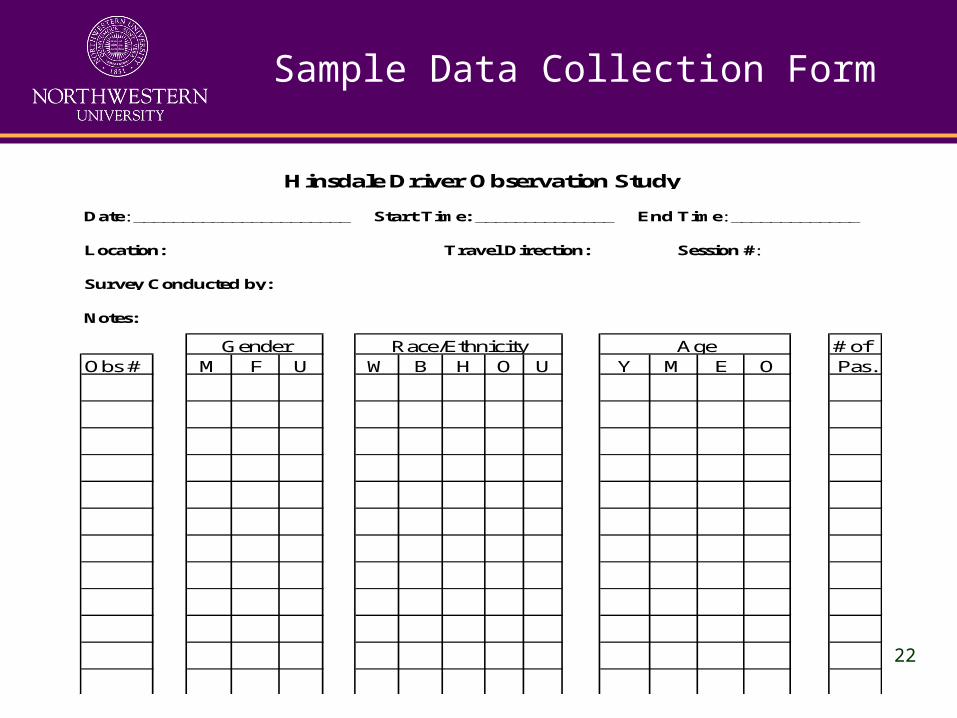
Sample Data Collection Form
Date: ______________________ Start Time: ______________ End Time: _____________
Location: ____________________________Travel Direction: _______ Session #: __________
Survey Conducted by: ____________________________________________________________
Notes: _________________________________________________________________________
# ofObs # M F U W B H O U Y M E O Pas.
Sheet No. ___________ of ____________
Gender Race/Ethnicity Age
Hinsdale Driver Observation Study

23
Number of Observations
The number of data collection sessions can be affected by:– Traffic volume– Roadway configuration (number of lanes)– Stop signs or traffic signals– Number of data items to be collected
General observations:– Higher capture rates (75% - 100% of drivers) at
stop signs, but usually lower traffic volumes– Lower capture rates (20% - 75%) at signalized
intersection depending on volume, number of lanes, and signal timing

24
Observation Limitations
Can be done only during daylight hours Glare from windows (or window tinting) can
affect observation Weather (rain, snow, excessive heat) Subjective decisions be observers Cost of doing surveys (labor intensive
activity)
25
Topic 2: Data Summarization
Data Summarization:– Recordkeeping – Data Entry – Data Base Software

26
Topic 2: Data Summarization
Recordkeeping - additional information that should/can be added to each observation (record):– Location (should)– Day of the week (should)– Time of day (should)– Direction of traffic (optional)– Data collectors (optional)

27
Topic 2: Data Summarization
Data Entry - getting the data into an electronic format– “The old fashion way” – keying the data in– Use machine-readable data collection forms
(e.g., Scantron)– Download from a file created at the time of
data collection (e.g., from a Palm Pilot or a PC tablet)
28
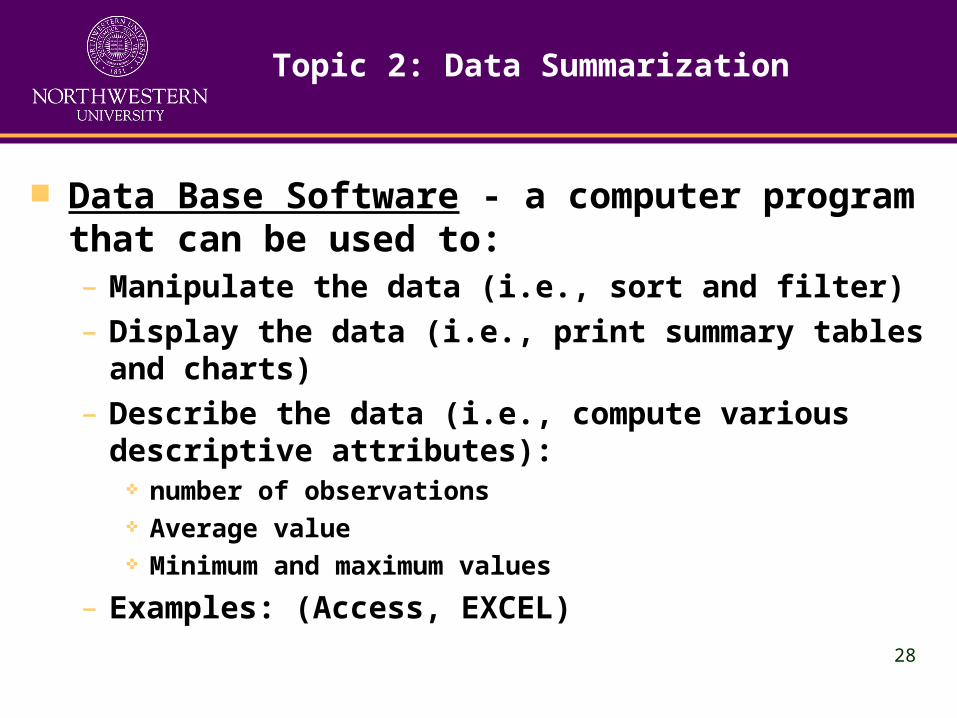
Topic 2: Data Summarization
Data Base Software - a computer program that can be used to:– Manipulate the data (i.e., sort and filter)– Display the data (i.e., print summary tables
and charts)– Describe the data (i.e., compute various
descriptive attributes): number of observations Average value Minimum and maximum values
– Examples: (Access, EXCEL)
29
Topic 2: Data Summarization
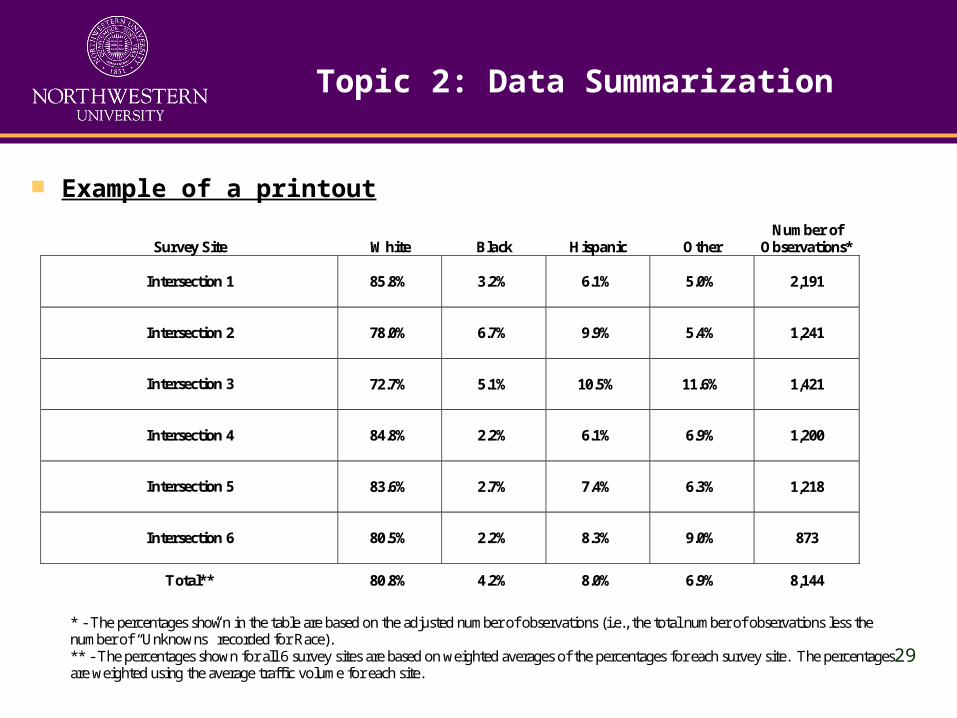
Example of a printout
Survey Site
White
Black
Hispanic
Other
Number of Observations*
Intersection 1
85.8% 3.2% 6.1% 5.0% 2,191
Intersection 2
78.0% 6.7% 9.9% 5.4% 1,241
Intersection 3
72.7% 5.1% 10.5% 11.6% 1,421
Intersection 4
84.8% 2.2% 6.1% 6.9% 1,200
Intersection 5
83.6% 2.7% 7.4% 6.3% 1,218
Intersection 6
80.5% 2.2% 8.3% 9.0% 873
Total** 80.8% 4.2% 8.0% 6.9% 8,144
* - The percentages shown in the table are based on the adjusted number of observations (i.e., the total number of observations less the number of “Unknowns” recorded for Race). ** - The percentages shown for all 6 survey sites are based on weighted averages of the percentages for each survey site. The percentages are weighted using the average traffic volume for each site.

30
Observational Surveys - Topic 3
Topic 3: Data Analysis
Comparing and assessing the survey and traffic stop data
31
Topic 3: Data Analysis
Data analysis consists of comparing two sets of data:– Traffic stop data – Driver survey data
And addressing the question: Are differences between the two sets of data important?
32
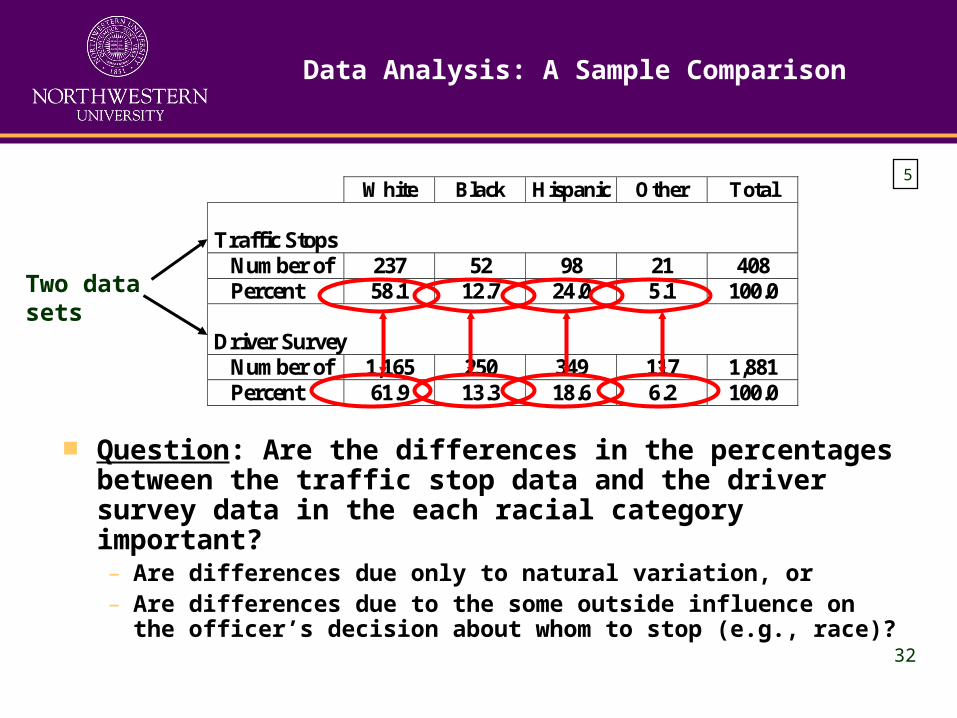
Data Analysis: A Sample Comparison
White Black Hispanic Other Total Traffic Stops Number of 237 52 98 21 408 Percent 58.1 12.7 24.0 5.1 100.0 Driver Survey Number of 1,165 250 349 117 1,881 Percent 61.9 13.3 18.6 6.2 100.0
Question: Are the differences in the percentages between the traffic stop data and the driver survey data in the each racial category important?– Are differences due only to natural variation, or– Are differences due to the some outside influence on
the officer’s decision about whom to stop (e.g., race)?
Two data sets
5

33
Statistical Benchmarking
Statistical benchmarking consists of:
1. Comparing two sets of data: Encounter data: the racial composition
of drivers in traffic stops, and Survey data: the racial composition of
drivers who are potential participants in a traffic stop
2. A procedure for assessing the significance of differences in the percentages between the two data sets
and
34
Statistical Benchmarking
Highland Park
– Statistical benchmarks were used to assess the importance of the differences in the percentages in the driver survey and traffic stop data.
– The benchmarks were determined using a statistical procedure called “confidence intervals.”

35
Confidence Interval Example
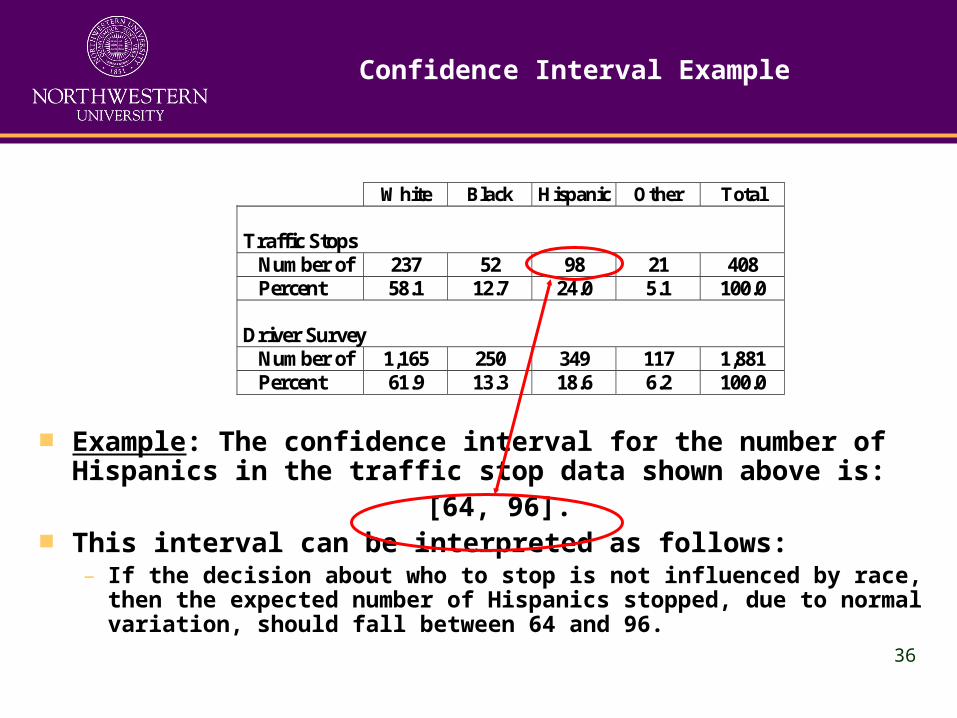
White Black Hispanic Other Total Traffic Stops Number of 237 52 98 21 408 Percent 58.1 12.7 24.0 5.1 100.0 Driver Survey Number of 1,165 250 349 117 1,881 Percent 61.9 13.3 18.6 6.2 100.0
Example: Is the difference between the two percentages for Hispanics (i.e., 24.0% and 18.6%) important?
One way to address this is to determine a range of values (i.e., a confidence interval) for the expected number of traffic stops involving Hispanic drivers.
36
Confidence Interval Example
White Black Hispanic Other Total Traffic Stops Number of 237 52 98 21 408 Percent 58.1 12.7 24.0 5.1 100.0 Driver Survey Number of 1,165 250 349 117 1,881 Percent 61.9 13.3 18.6 6.2 100.0
Example: The confidence interval for the number of Hispanics in the traffic stop data shown above is:
[64, 96]. This interval can be interpreted as follows:
– If the decision about who to stop is not influenced by race, then the expected number of Hispanics stopped, due to normal variation, should fall between 64 and 96.
37
Confidence Intervals Example
The upper and lower limits for the confidence interval can be interpreted as statistical benchmarks for the number of Hispanics stopped.
The limits are determined based on:– Total number of traffic stops (408)– Estimated number of Hispanics in the driver
population– Selected confidence level

38
Confidence Interval Example
White Black Hispanic Other Total Traffic Stops Number of 237 52 98 21 408 Percent 58.1 12.7 24.0 5.1 100.0 Driver Survey Number of 1,165 250 349 117 1,881 Percent 61.9 13.3 18.6 6.2 100.0
Example: The statistical benchmarks for the expected number of Hispanics, [64, 96], is based on a confidence level of 95%.
The 95% confidence level means the margin of error is 5%. A 5% margin of error means that there is 5% chance that
even with normal statistical variation the number of Hispanics stopped could fall below 64 or above 96.
1
39
Statistical Benchmark Example
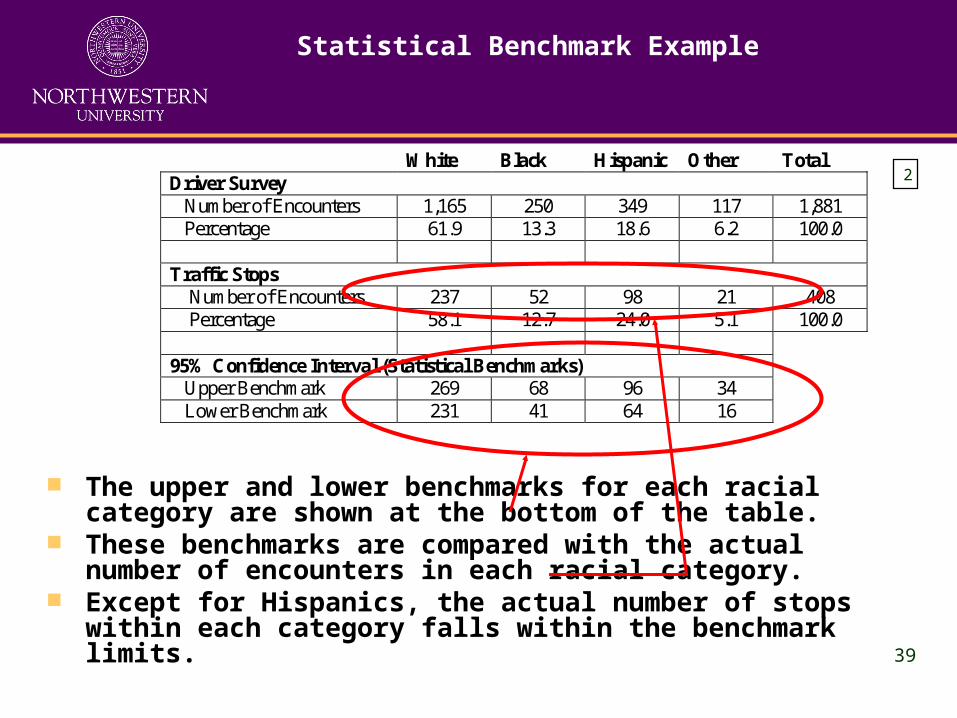
The upper and lower benchmarks for each racial category are shown at the bottom of the table.
These benchmarks are compared with the actual number of encounters in each racial category.
Except for Hispanics, the actual number of stops within each category falls within the benchmark limits.
White Black Hispanic Other Total Driver Survey Number of Encounters 1,165 250 349 117 1,881 Percentage 61.9 13.3 18.6 6.2 100.0 Traffic Stops Number of Encounters 237 52 98 21 408 Percentage 58.1 12.7 24.0 5.1 100.0 95% Confidence Interval (Statistical Benchmarks) Upper Benchmark 269 68 96 34 Lower Benchmark 231 41 64 16
2
40
Statistical Benchmark Example
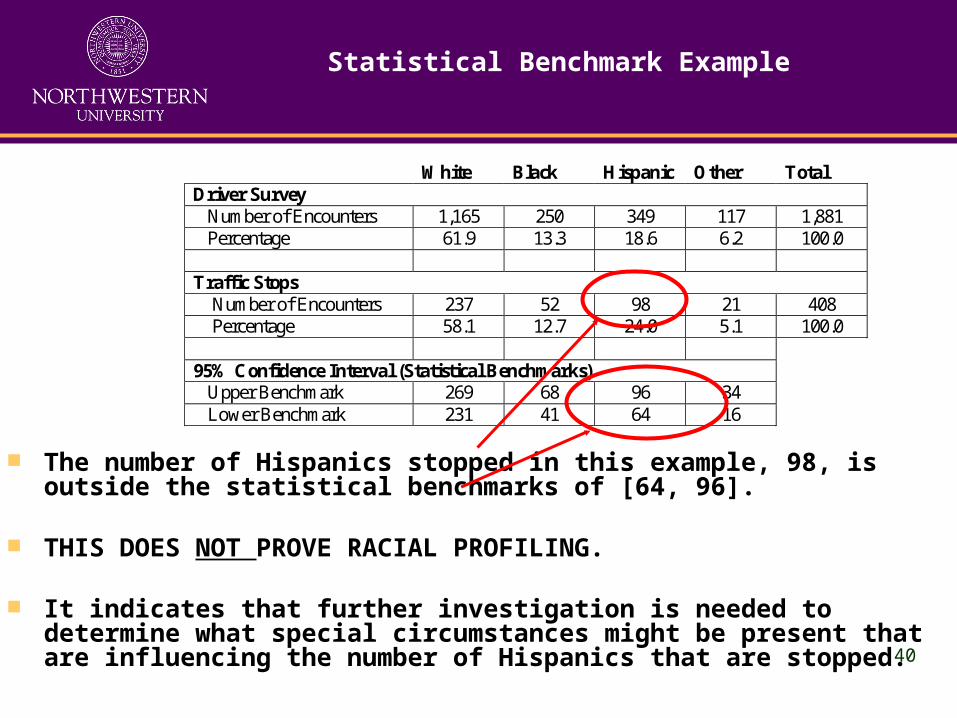
The number of Hispanics stopped in this example, 98, is outside the statistical benchmarks of [64, 96].
THIS DOES NOT PROVE RACIAL PROFILING.
It indicates that further investigation is needed to determine what special circumstances might be present that are influencing the number of Hispanics that are stopped.
White Black Hispanic Other Total Driver Survey Number of Encounters 1,165 250 349 117 1,881 Percentage 61.9 13.3 18.6 6.2 100.0 Traffic Stops Number of Encounters 237 52 98 21 408 Percentage 58.1 12.7 24.0 5.1 100.0 95% Confidence Interval (Statistical Benchmarks) Upper Benchmark 269 68 96 34 Lower Benchmark 231 41 64 16
41
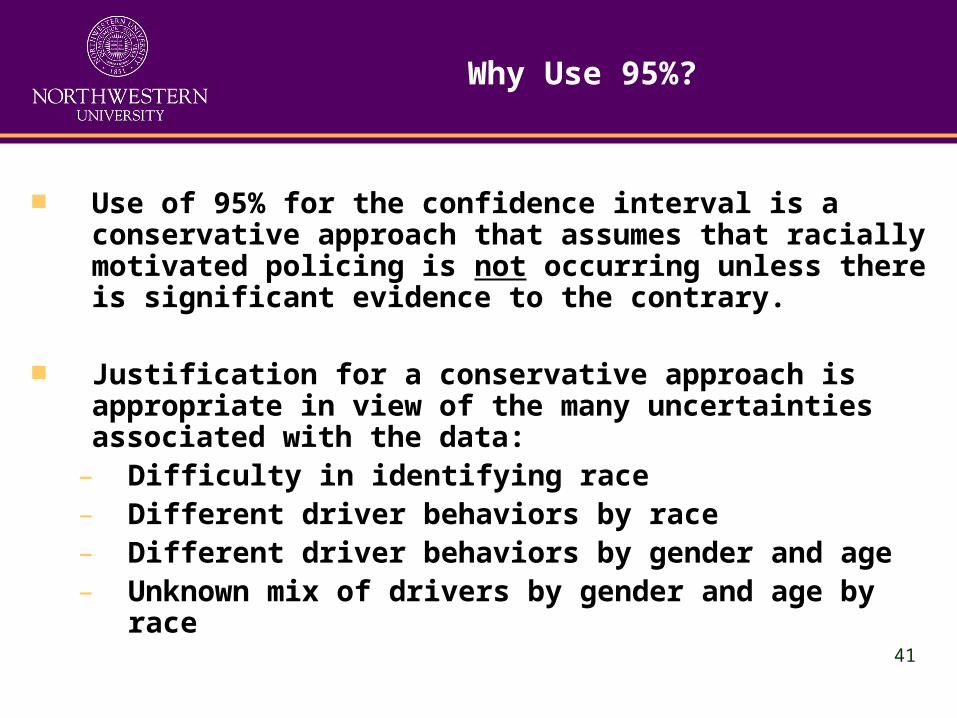
Why Use 95%?
Use of 95% for the confidence interval is a conservative approach that assumes that racially motivated policing is not occurring unless there is significant evidence to the contrary.
Justification for a conservative approach is appropriate in view of the many uncertainties associated with the data:
– Difficulty in identifying race– Different driver behaviors by race– Different driver behaviors by gender and age– Unknown mix of drivers by gender and age by
race

42
How Can I Use Statistical Benchmarks?
The benchmarking procedure described is based on statistical procedure called the “two-sample test for proportions.”
Its use requires a basic understanding of applied statistics. (Note: “Statistical Benchmarks for Police Traffic Stops” in seminar notebook.)
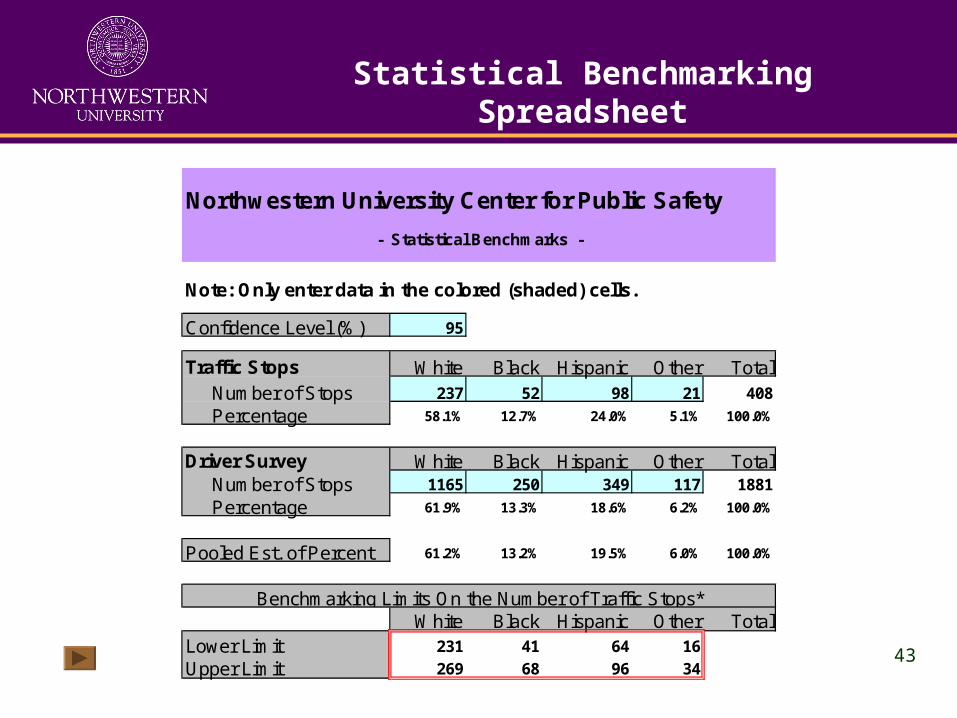
To help departments that may want to use statistical benchmarking based on this procedure, the Center for Public Program has put an easy-to-use spreadsheet on its website that can be used to find statistical benchmarks.
43
Statistical Benchmarking Spreadsheet
Northwestern University Center for Public Safety
Note: Only enter data in the colored (shaded) cells.
Confidence Level (%) 95
Traffic Stops White Black Hispanic Other Total Number of Stops 237 52 98 21 408
Percentage 58.1% 12.7% 24.0% 5.1% 100.0%
Driver Survey White Black Hispanic Other Total Number of Stops 1165 250 349 117 1881
Percentage 61.9% 13.3% 18.6% 6.2% 100.0%
Pooled Est. of Percent 61.2% 13.2% 19.5% 6.0% 100.0%
White Black Hispanic Other TotalLower Limit 231 41 64 16
Upper Limit 269 68 96 34
Benchmarking Limits On the Number of Traffic Stops*
- Statistical Benchmarks -

44
Statistical Benchmark Spreadsheet
The statistical benchmarking spreadsheet can be found on the website for the Center for Public Safety:
www.northwestern.edu/nucps
Select “Links”Select “Racial Profiling”At bottom of page under “Recent Articles” find:
“Benchmarking Spreadsheet”

45
Contact Information
William Stenzel– 847/491-8995– [email protected]
Roy Lucke– 847/491-3469– [email protected]


