21
Observations on the iron ore market Huw McKay Vice President, Market Analysis & Economics 17 Nov 2016

Observations on the iron ore market
Huw McKay
Vice President, Market Analysis & Economics
17 Nov 2016

DisclaimerForward-looking statements
• This release contains forward-looking statements, including statements regarding: trends in commodity prices and currency exchange rates; demand for commodities; plans, strategies and objectives of management;
closure or divestment of certain operations or facilities (including associated costs); anticipated production or construction commencement dates; capital costs and scheduling; operating costs and shortages of
materials and skilled employees; anticipated productive lives of projects, mines and facilities; provisions and contingent liabilities; tax and regulatory developments.
• Forward-looking statements can be identified by the use of terminology such as ‘intend’, ‘aim’, ‘project’, ‘anticipate’, ‘estimate’, ‘plan’, ‘believe’, ‘expect’, ‘may’, ‘should’, ‘will’, ‘continue’, ‘annualised’ or similar words.
These statements discuss future expectations concerning the results of operations or financial condition, or provide other forward-looking statements.
• These forward-looking statements are not guarantees or predictions of future performance, and involve known and unknown risks, uncertainties and other factors, many of which are beyond our control, and which
may cause actual results to differ materially from those expressed in the statements contained in this release. Readers are cautioned not to put undue reliance on forward-looking statements.
• For example, our future revenues from our operations, projects or mines described in this release will be based, in part, upon the market price of the minerals, metals or petroleum produced, which may vary
significantly from current levels. These variations, if materially adverse, may affect the timing or the feasibility of the development of a particular project, the expansion of certain facilities or mines, or the continuation
of existing operations.
• Other factors that may affect the actual construction or production commencement dates, costs or production output and anticipated lives of operations, mines or facilities include our ability to profitably produce and
transport the minerals, petroleum and/or metals extracted to applicable markets; the impact of foreign currency exchange rates on the market prices of the minerals, petroleum or metals we produce; activities of
government authorities in some of the countries where we are exploring or developing these projects, facilities or mines, including increases in taxes, changes in environmental and other regulations and political
uncertainty; labour unrest; and other factors identified in the risk factors discussed in BHP Billiton’s filings with the U.S. Securities and Exchange Commission (the “SEC”) (including in Annual Reports on Form 20-F)
which are available on the SEC’s website at www.sec.gov.
• Except as required by applicable regulations or by law, the Group does not undertake any obligation to publicly update or review any forward-looking statements, whether as a result of new information or future
events.
Non-IFRS financial information
• BHP Billiton results are reported under International Financial Reporting Standards (IFRS) including Underlying EBIT and Underlying EBITDA which are used to measure segment performance. This release may also
include certain non-IFRS measures including Underlying attributable profit, Underlying basic earnings per share, Underlying EBITDA interest coverage, Adjusted effective tax rate, Underlying EBIT margin, Underlying
EBITDA margin, Underlying return on capital, Free cash flow, Net debt and Net operating assets. These measures are used internally by management to assess the performance of our business, make decisions on
the allocation of our resources and assess operational management. Non-IFRS measures have not been subject to audit or review and should not be considered as an indication of or alternative to an IFRS measure
of profitability, financial performance or liquidity.
No offer of securities
• Nothing in this presentation should be construed as either an offer to sell or a solicitation of an offer to buy or sell BHP Billiton securities in any jurisdiction, or be treated or relied upon as a recommendation or advice
by BHP Billiton.
• Reliance on third-party information
• The views expressed in this release contain information that has been derived from publicly available sources that have not been independently verified. No representation or warranty is made as to the accuracy,
completeness or reliability of the information. This release should not be relied upon as a recommendation or forecast by BHP Billiton.
2Huw McKay, Vice President, Market Analysis & Economics

Summary
3
• Global macro economic outlook
• Global steel and Iron ore supply & demand
• Strategy in an evolving market
Huw McKay, Vice President, Market Analysis & Economics

The global macro & commodity price outlook
4
• World GDP expected to be contained to a 3% to 3½% range in the near term.
• World trade expected to recover a little, establishing a more normal relativity to GDP.
• Unilateral tightening of monetary policy in the US should keep the US dollar firm.
• Commodity prices to remain volatile, but contained within recent ranges.
• Fundamentals to re-assert themselves as our portfolio rebalances at different speeds.
• End-use demand for steel to rebalance.
Huw McKay, Vice President, Market Analysis & Economics

Around the world
5
• Chinese headline growth to be similar next year, but less dependent on construction.
• India to remain the standout emerging market, but domestic investment needs to lift.
• Non-Asian emerging markets exiting recession should remove a key drag.
• Europe and Japan reaching the limits of monetary policy effectiveness.
• US illustrates the consumer versus business dichotomy.
• Global move towards more assertive fiscal policy?
Huw McKay, Vice President, Market Analysis & Economics

Summary
6
• Global Macro economic Outlook
• Global steel and Iron ore supply & demand
• Strategy in an evolving market
Huw McKay, Vice President, Market Analysis & Economics

Global steel output per capita
Global steel output (demand) per capita
(kg crude steel equivalent)
50
70
90
110
130
150
170
190
210
230
250
2000 4000 6000 8000 10000 12000 14000 16000
19742009
1950
19991983
2016
Asian &
Emerging
Market
Crises
1st
Oil
Crisis
Reconstruction
in Europe
& Japan
Consumer
durables
revolutionLong global
boom
2nd
Oil
CrisisPlaza
Accord
Collapse
of Bretton
Woods
Global
Credit
Bubble
Global
Recession
US Tech
BubbleGlobal
Recession
China
Enters
WTOGlobal
Credit
Bubble
Global
Financial
Crisis
China-led
rebound
through
stimulusQE era in
The West
Emerging
Market
Stress
Huw McKay, Vice President, Market Analysis & Economics 7
Source: World Steel Association, UN

New growth drivers to emerge within Asia
Crude steel production
Source: World Steel Association, BHP Billiton
8
• Emerging Asian markets have been the key
driver for global steel industry, contributing over
90% of growth to global steel production over the
past two decades, driven by China’s rapid
urbanisation and industrialisation
• Following a significant growth trajectory, China
accounted for about half of world’s total steel
production in 2015
• Recently India has been a bright spot and is
expected to maintain a strong growth, lifting its
share in global steel over the long run
• As China’s growth moderates, India and
Southeast Asia are expected to support long-
term demand growth
0%
10%
20%
30%
40%
50%
60%
70%
80%
90%
100%
1995 2005 2015 2025 2035
Emerging Asia JKTEurope and CIS North/Central AmericaOthers
CAGR%
1995-2005 2005-15
3% 1%
0% -1%
2% -1%
2% 1%
12% 8%
Huw McKay, Vice President, Market Analysis & Economics
World total 4% 4%

Steel stock in Emerging Asia needs to grow
9
• India and South East Asian economies
have strong growth potential that should
bode well for long term steel demand
• China accumulated steel stock per capita
still lagging developed economies
• Despite an expected moderation in the
rate of demand growth, upside still exists
for the Chinese steel industry
Source: World Steel Association; BHP Billiton analysis.
1. Emerging Asia includes India and countries in South Asia and North Asia, excluding China, Japan and South Korea.
0
5
10
15
2000 2015 2020e 2025e 2030e 2035e
Emerging Asia (excl. China)¹ China US Europe
Gap to close in emerging market steel stock
(finished steel per capita, t)
Huw McKay, Vice President, Market Analysis & Economics
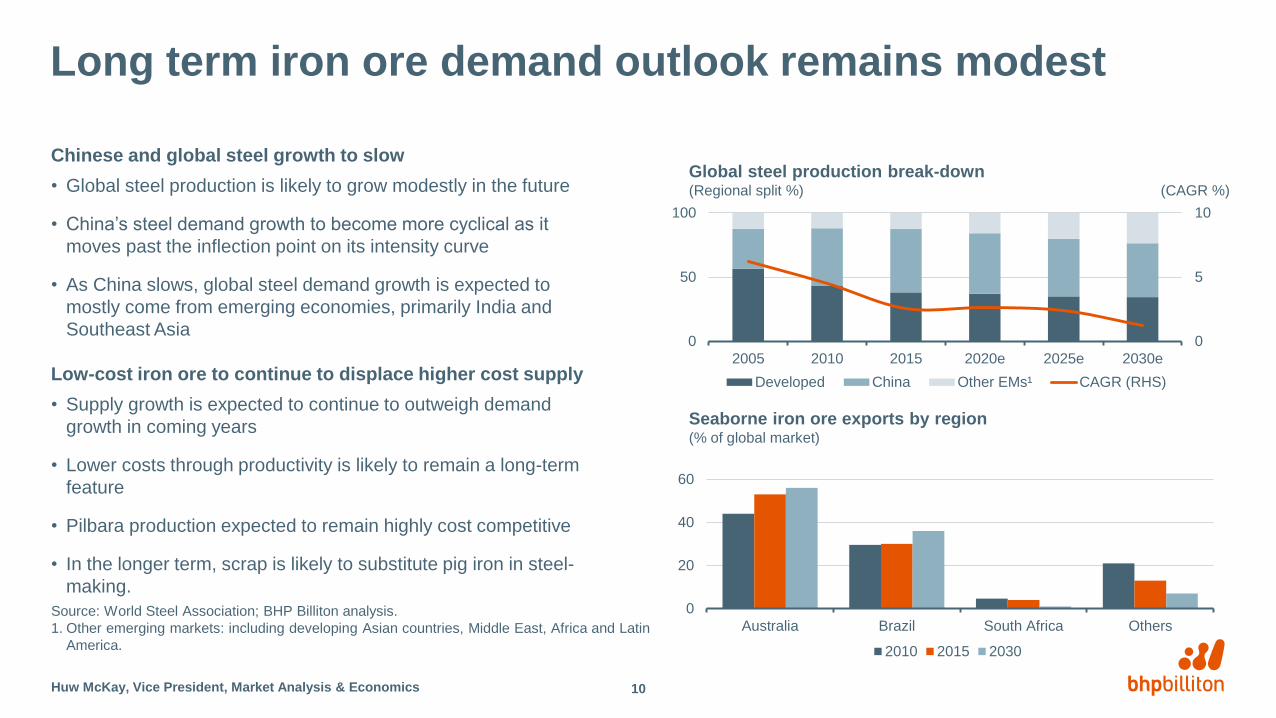
Long term iron ore demand outlook remains modest
Chinese and global steel growth to slow
• Global steel production is likely to grow modestly in the future
• China’s steel demand growth to become more cyclical as it
moves past the inflection point on its intensity curve
• As China slows, global steel demand growth is expected to
mostly come from emerging economies, primarily India and
Southeast Asia
Low-cost iron ore to continue to displace higher cost supply
• Supply growth is expected to continue to outweigh demand
growth in coming years
• Lower costs through productivity is likely to remain a long-term
feature
• Pilbara production expected to remain highly cost competitive
• In the longer term, scrap is likely to substitute pig iron in steel-
making.
10
Seaborne iron ore exports by region (% of global market)
0
20
40
60
Australia Brazil South Africa Others
2010 2015 2030
0
5
10
0
50
100
2005 2010 2015 2020e 2025e 2030e
Developed China Other EMs¹ CAGR (RHS)
Global steel production break-down(Regional split %) (CAGR %)
Source: World Steel Association; BHP Billiton analysis.
1. Other emerging markets: including developing Asian countries, Middle East, Africa and Latin
America.
Huw McKay, Vice President, Market Analysis & Economics

-10%
-5%
0%
5%
10%
15%
20%
Sep-11 Sep-12 Sep-13 Sep-14 Sep-15 Sep-16
China India Rest of world
Recent trends in steel output growth
11
Source: World Steel Association, BHPB
Steel production growth by region YoY
(%)
Huw McKay, Vice President, Market Analysis & Economics
(20.00)
(15.00)
(10.00)
(5.00)
-
5.00
10.00
15.00
720
740
760
780
800
820
840
860
Jan-13 May-13 Sep-13 Jan-14 May-14 Sep-14 Jan-15 May-15 Sep-15 Jan-16 May-16 Sep-16
Th
ou
sa
nd
s
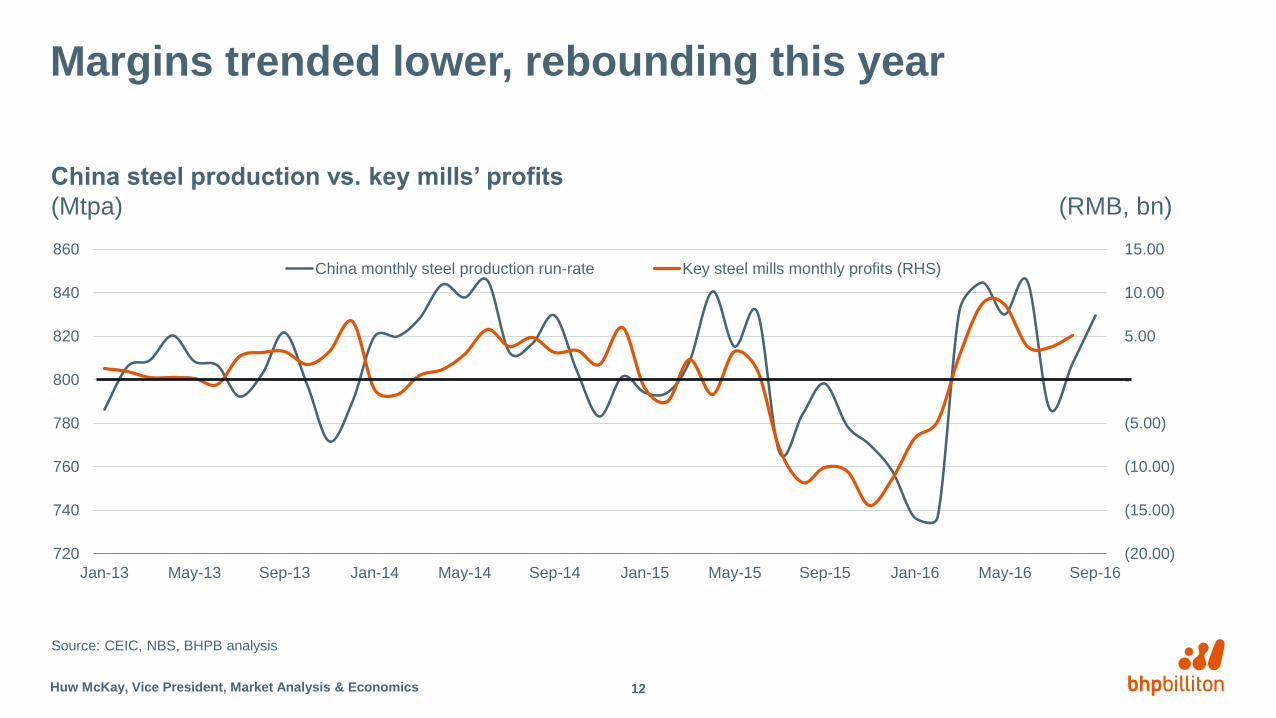
China monthly steel production run-rate Key steel mills monthly profits (RHS)
Margins trended lower, rebounding this year
12
Source: CEIC, NBS, BHPB analysis
China steel production vs. key mills’ profits
(Mtpa) (RMB, bn)
Huw McKay, Vice President, Market Analysis & Economics
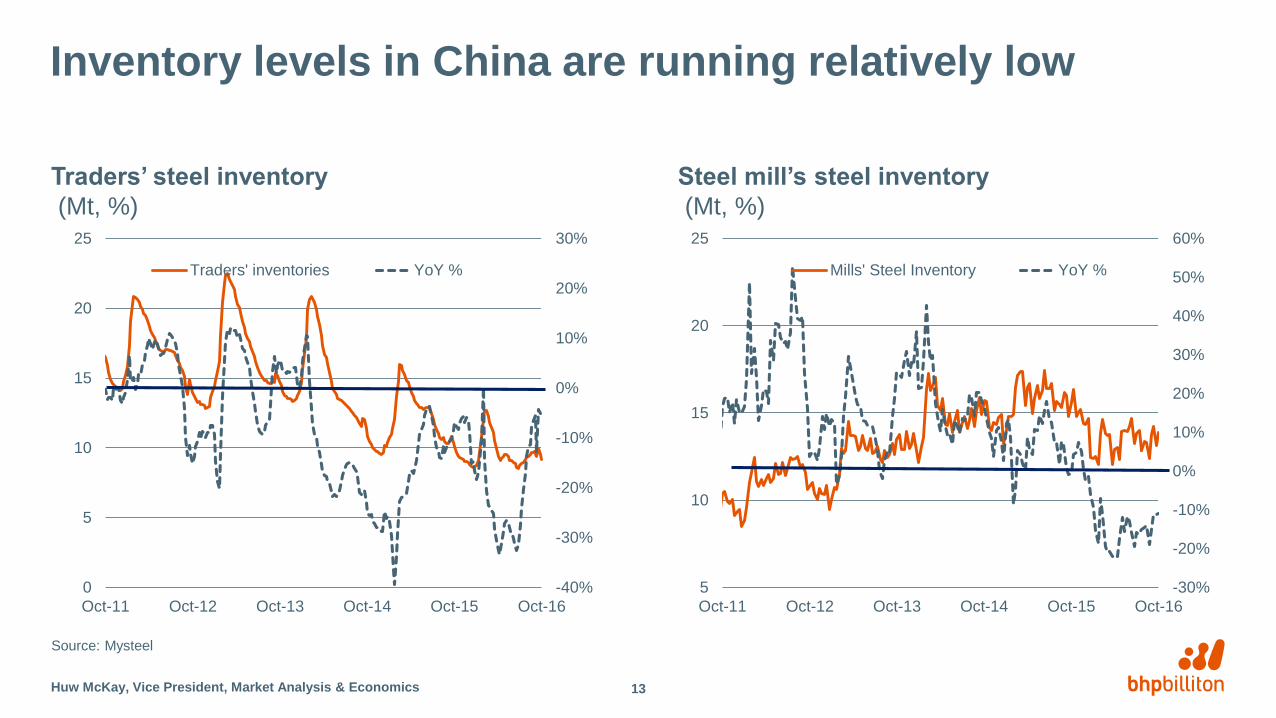
Inventory levels in China are running relatively low
13
Source: Mysteel
-40%
-30%
-20%
-10%
0%
10%
20%
30%
0
5
10
15
20
25
Oct-11 Oct-12 Oct-13 Oct-14 Oct-15 Oct-16
Traders' inventories YoY %
Traders’ steel inventory
(Mt, %)
Huw McKay, Vice President, Market Analysis & Economics
-30%
-20%
-10%
0%
10%
20%
30%
40%
50%
60%
5
10
15
20
25
Oct-11 Oct-12 Oct-13 Oct-14 Oct-15 Oct-16
Mills' Steel Inventory YoY %
Steel mill’s steel inventory
(Mt, %)
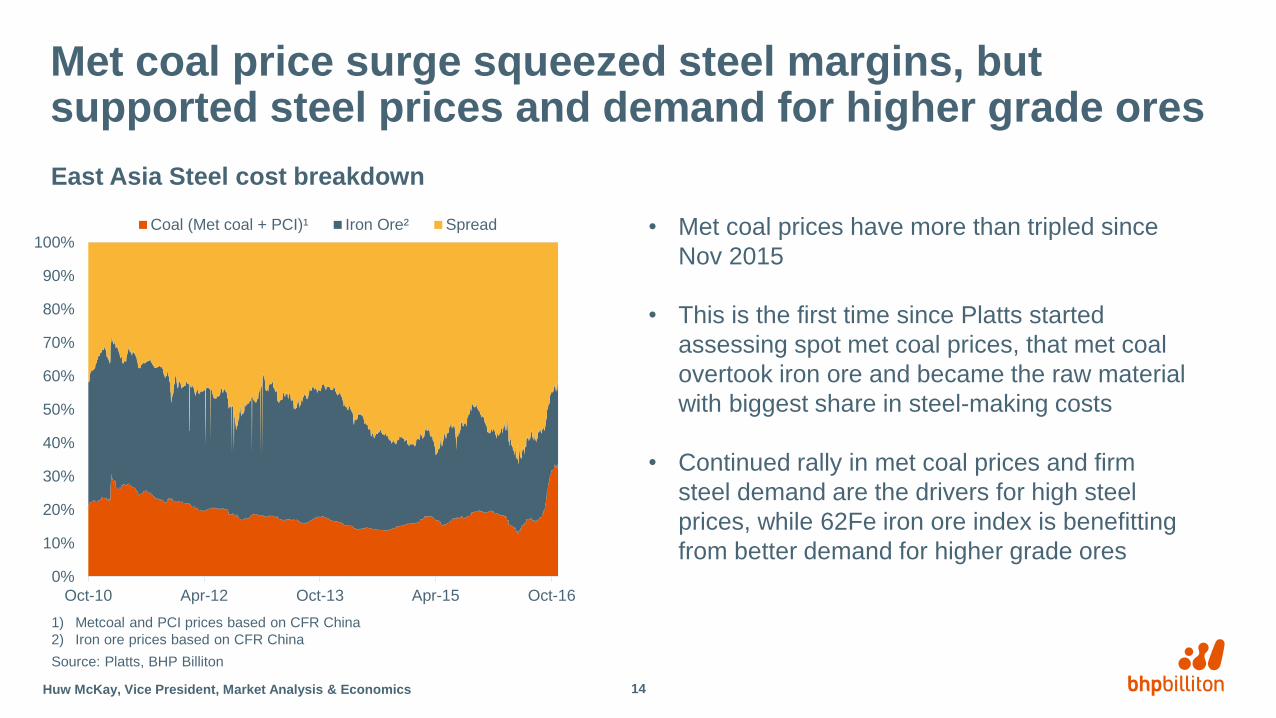
Met coal price surge squeezed steel margins, but supported steel prices and demand for higher grade ores
East Asia Steel cost breakdown
Source: Platts, BHP Billiton
1) Metcoal and PCI prices based on CFR China
2) Iron ore prices based on CFR China
14
0%
10%
20%
30%
40%
50%
60%
70%
80%
90%
100%
Oct-10 Apr-12 Oct-13 Apr-15 Oct-16
Coal (Met coal + PCI)¹ Iron Ore² Spread
Huw McKay, Vice President, Market Analysis & Economics
• Met coal prices have more than tripled since
Nov 2015
• This is the first time since Platts started
assessing spot met coal prices, that met coal
overtook iron ore and became the raw material
with biggest share in steel-making costs
• Continued rally in met coal prices and firm
steel demand are the drivers for high steel
prices, while 62Fe iron ore index is benefitting
from better demand for higher grade ores

Summary
15
• Global Macro economic Outlook
• Global Steel and Iron ore supply & demand
• Strategy in an evolving market
Huw McKay, Vice President, Market Analysis & Economics
Key strategic industry considerations
16
• Chinese supply side reform (100-150 Mtpa capacity closures by 2020, M&A) is expected to raise long run steel capacity utilization and profitability.
• End-use expected to evolve away from construction and towards higher end (machinery, auto).
• Spatial factors as they pertain to contestable demand.
• Better profitability to create a push for productivity and thereby favour high-quality iron ore.
• BHP Billiton's lump product is well suited to cater to those needs. This will be one factor that we consider as we assess long run options for the portfolio.
• Technological change driving ongoing productivity improvements on the producer side.
• Financialization is a reality.
• Seaborne producer in Australia or Brazil expected to be the long run marginal producer.
Huw McKay, Vice President, Market Analysis & Economics

l
Steel projects being commissioned or planned along the Asian coasts
Source: Platts, BHPB analysis
Notes:- New integrated steel projects (each >2 Mtpa), commissioned since 2015 or being planned in the future
• Capacity in China is shifting towards the
coast, with a few new integrated projects
recently commissioned, or planned for
upgrade and relocation
• Large steel projects are being built in
ASEAN to enhance cost competitiveness of
local steel industry
• Expansions in India to meet increasing local
demand
• These will support demand for seaborne
materials going forward
Huw McKay, Vice President, Market Analysis & Economics 17

BHP Billiton is responding to global demand in a responsible way
0
200
400
600
800
1,000
1,200
0
60
120
180
240
300
FY
01
FY
02
FY
03
FY
04
FY
05
FY
06
FY
07
FY
08
FY
09
FY
10
FY
11
FY
12
FY
13
FY
14
FY
15
FY
16
BHP Billiton Pilbara (100% basis) China imports Note: All iron ore products including lump, fines, pellet feed and pellets, 100%.
Global iron ore export share
(%)
0
20
40
60
80
100
CY
00
CY
01
CY
02
CY
03
CY
04
CY
05
CY
06
CY
07
CY
08
CY
09
CY
10
CY
11
CY
12
CY
13
CY
14
CY
15e
Vale
BHP Billiton WAIO
Rio Tinto
Rest of World
FMG
Australia others
BHP Billiton WAIO production
(Mt wet, 100% basis)
Source: NBS; Wood Mackenzie 2015; BHP Billiton.
18Huw McKay, Vice President, Market Analysis & Economics
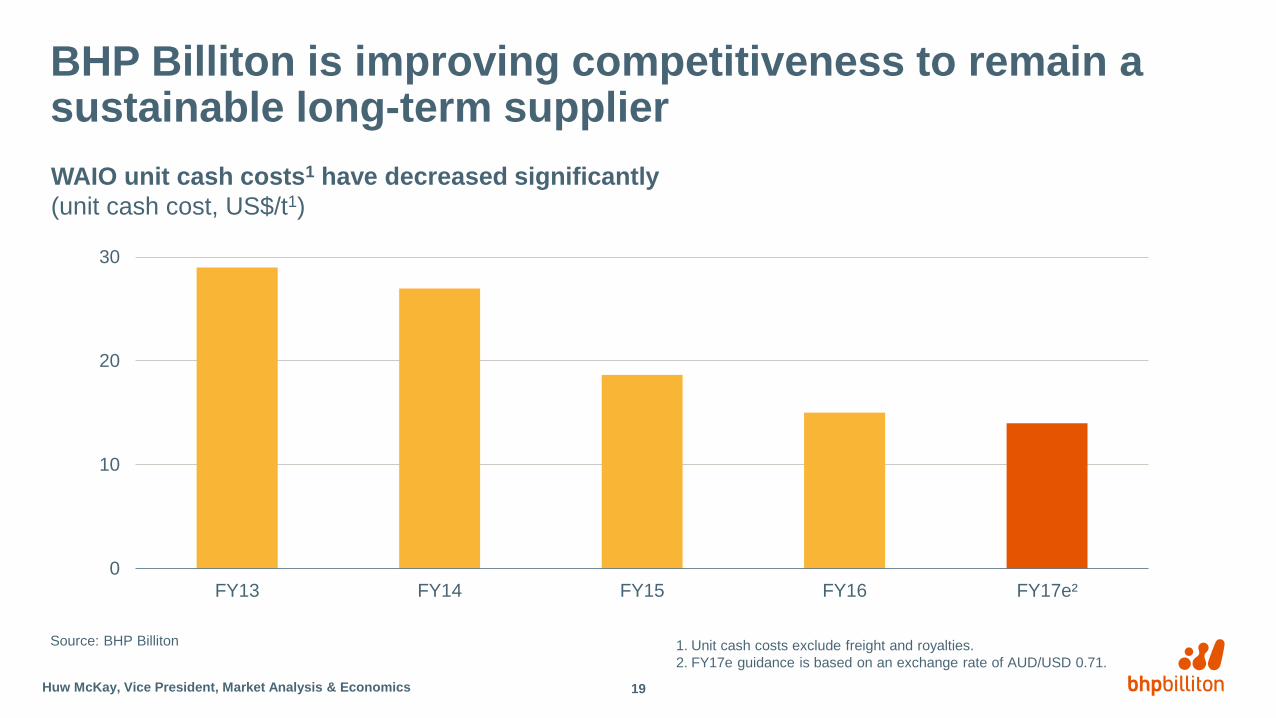
BHP Billiton is improving competitiveness to remain a sustainable long-term supplier
WAIO unit cash costs1 have decreased significantly
(unit cash cost, US$/t1)
0
10
20
30
FY13 FY14 FY15 FY16 FY17e²
Source: BHP Billiton 1. Unit cash costs exclude freight and royalties.
2. FY17e guidance is based on an exchange rate of AUD/USD 0.71.
19Huw McKay, Vice President, Market Analysis & Economics

20
BHP Billiton/Prospects
Huw McKay, Vice President, Market Analysis & Economics
BHPB website Investors & Media BHPB Prospects

21
Summary
Huw McKay, Vice President, Market Analysis & Economics
• Commodity prices are likely to remain volatile, but contained within recent ranges.
• China and global steel growth to slow with demand growth mostly coming from emerging economies,
primarily India and Southeast Asia.
• End-use demand for steel is expected to rebalance, away from construction and towards higher end
(machinery, auto).
• Low cost iron ore to continue to displace higher cost supply with productivity being a key feature in the
long term.
• BHP Billiton is responding to global demand in a responsible way by focussing on enhanced productivity
and improved competitiveness.


