Page 1
Observed and Projected Changes in United States Tornado Exposure
STEPHEN M. STRADER
Department of Geography and the Environment, Villanova University, Villanova, Pennsylvania
WALKER S. ASHLEY, THOMAS J. PINGEL, AND ANDREW J. KRMENEC
Department of Geography, Northern Illinois University, DeKalb, Illinois
(Manuscript received 1 April 2016, in final form 6 September 2016)
ABSTRACT
This study examines how tornado risk and societal exposure interact to create tornado disaster potential in
the United States. Finescale historical and projected demographic data are used in a set of region-specific
Monte Carlo tornado simulations to reveal how societal development has shaped, and will continue to shape,
tornado disaster frequency and consequences. Results illustrate that although the U.S. Midwest contains the
greatest built-environment exposure and the central plains experience the most significant tornadoes, the
midsouth contains the greatest tornado disaster potential. This finding is attributed to the relatively elevated
tornado risk and accelerated growth in developed land area that characterizes the midsouth region. Disaster
potential is projected to amplify in theUnited States due to increasing built-environment development and its
spatial footprint in at-risk regions. In the four regions examined, both average annual tornado impacts and
associated impact variability are projected to be as much as 6 to 36 times greater in 2100 than 1940. Extreme
annual tornado impacts for all at-risk regions are also projected to nearly double during the twenty-first
century, signifying the potential for greater tornado disaster potential in the future. The key lesson is that it is
the juxtaposition of both risk and societal exposure that drive disaster potential. Mitigation efforts should
evaluate changes in tornado hazard risk and societal exposure in light of land-use planning, building codes,
and warning dissemination strategies in order to reduce the effects of tornadoes and other environmental
hazards.
1. Introduction
Increasing trends in weather-related disasters and
losses are a function of climate and society (Changnon
et al. 2000; Bouwer 2011; IPCC 2012). Much of the re-
search investigating the amplification in disaster conse-
quences has focused on possible changes in hazard risk
resulting from anthropogenic climate change [Peterson
et al. 2013; Kunkel et al. 2013; National Academies of
Science Engineering and Medicine 2016]. While hazard
risk is an important component of disasters, the sus-
tained increase in hazard consequences is thought to be
driven principally by the growth in underlying human
and built-environment vulnerabilities and increasing
wealth (Pielke 2005; Höppe and Pielke 2006; Bouwer
2011; IPCC 2012; Preston 2013; IPCC 2014; Mohleji
and Pielke 2014; Ashley et al. 2014; Strader and
Ashley 2015).
Many studies have focused on the spatiotemporal
characteristics of tornado risk and/or vulnerability
(Brooks et al. 2003a; Dixon et al. 2011; Ashley et al.
2014; etc.). Early research (Finley 1887; Wolford 1960;
Thom 1963) on tornado risk was created without regard
to tornado intensity and seasonality (Brooks et al.
2003a), but, in the 1970s and 1980s, major changes in
tornado climatology research—such as the inclusion of
damage magnitude and spatial attributes of paths—
permitted a broader assessment of tornado characteris-
tics and their climate (e.g., Abbey and Fujita 1975, 1979;
Fujita 1981; Schaefer et al. 1986). More recent research
(e.g., Brooks et al. 2003a; Dixon et al. 2011; Elsner et al.
2014; Brooks et al. 2014; Farney and Dixon 2015) ana-
lyzing tornado risk has used Storm Data, which is a
Supplemental information related to this paper is avail-
able at the Journals Online website: http://dx.doi.org/10.1175/
WCAS-D-16-0041.s1.
Corresponding author e-mail: Stephen M. Strader, stephen.
[email protected]
VOLUME 9 WEATHER , C L IMATE , AND SOC I ETY APRIL 2017
DOI: 10.1175/WCAS-D-16-0041.1
� 2017 American Meteorological Society. For information regarding reuse of this content and general copyright information, consult the AMS CopyrightPolicy (www.ametsoc.org/PUBSReuseLicenses).
109
Page 2
database developed by the National Climatic Data
Center and the National Weather Service that contains
attribute information on pathlength, width, and the
maximum damage rating for every tornado segment
within a county (Edwards et al. 2013). These studies
have examined a spectrum of tornado risk attributes
such as tornado occurrence (Brooks et al. 2003a; Dixon
et al. 2011; Elsner et al. 2014), economic impact
(Daneshvaran and Morden 2007; Simmons et al. 2013),
and daily or seasonal timing (Brooks et al. 2003a; Dixon
et al. 2011).
Additional research (e.g., Rae and Stefkovich 2000;
Wurman et al. 2007; Hall and Ashley 2008; Paulikas and
Ashley 2011; Ashley et al. 2014; Rosencrants andAshley
2015; Ashley and Strader 2016) has focused on societal
exposure to tornadoes (hereafter, tornado exposure)
rather than tornado risk. These studies often use enu-
merations of people and/or the built environment
(number of homes, structures, etc.) to evaluate the po-
tential effects of a tornado hazard. Results from these
studies demonstrate that ever-increasing population
growth leads to the more frequent placement of people
and their assets in harm’s way (Changnon and
Burroughs 2003;Wilson and Fischetti 2010; Paulikas and
Ashley 2011; Burkett and Davidson 2012; Ashley et al.
2014; Ashley and Strader 2016). Because of advance-
ments in computing technology and software, method-
ologies and models have been developed to estimate
potential impacts and losses from tornadoes in popu-
lated locations (Rae and Stefkovich 2000;Wurman et al.
2007; Ashley et al. 2014; Strader et al. 2016). Using
geographic information systems (GIS), these studies
often place highly detailed, damage-surveyed tornado
paths or their likeness (e.g., Wurman et al. 2007; Ashley
et al. 2014; Strader et al. 2015, 2016) atop developed
areas to estimate potential hazard effects and disaster
potential. Additional research has attempted tomeasure
the change in tornado exposure through time using a
variety of statistical and spatial techniques (Hall and
Ashley 2008; Paulikas and Ashley 2011; Ashley et al.
2014; Ashley and Strader 2016; Strader et al. 2016). To
date, only a handful of studies have examined changes in
future tornado risk (Trapp et al. 2007, 2011;
Diffenbaugh et al. 2013; Robinson et al. 2013; Gensini
and Mote 2015; Trapp and Hoogewind 2016) or expo-
sure (Preston 2013; Rosencrants and Ashley 2015),
employing a variety of projected climate, environmen-
tal, population, and socioeconomic data.
In this investigation, we seek to further research on
U.S. tornado exposure by evaluating how human devel-
opment has augmented disaster potential and, moreover,
how projected changes in housing units (HUs) and
developed land area may influence disaster frequency
and consequences in the future. Although disasters are
social phenomena and largely driven by extreme events
interacting with human, social, and physical vulnerabil-
ities, the study defines disaster potential as a quantita-
tive measure of the number of HUs potentially damaged
or destroyed by a tornado (Ashley and Strader 2016;
Strader et al. 2016). The study makes the assumption
that the greater the number of homes potentially af-
fected by a tornado, the greater the tornado disaster
probability and magnitude.
The tornado hazard and regional tornado risk are
used in conjunction with historical and projected built-
environment data in a new statistical resampling
framework to assess changing disaster potential. Be-
cause many terms (risk, vulnerability, etc.) in hazard
science contain a multitude of designations and mean-
ings (Paul 2011), we employ the basic climatological
definition of risk that represents the probability of a
hazard occurring in space and time with varying char-
acteristics (tornado width, length, magnitude, direction,
etc.). This study also focuses on residential built-
environment (i.e., HU) exposure. Vulnerability is multi-
faceted and often includes physical and human exposure
elements (e.g., built environment, population, and other
demographics), adaptive capacities (i.e., how an entity
copes or adapts to a hazard), and sensitivities (i.e., the
degree to which an entity is affected by a hazard; Cutter
et al. 2009; Morss et al. 2011). While the focal point of this
study is narrow within a complex, multilayered vulnera-
bility framework, residential built-environment data
provide a tangible and robust marker for assessing how
societal development has evolved and will evolve in areas
prone to tornadoes.
2. Data and methodology
a. Spatially Explicit Regional Growth Model data
Previous studies have primarily used U.S. decennial
census data to investigate tornado exposure (e.g.,
Wurman et al. 2007; Hall and Ashley 2008; Ashley et al.
2014). Because U.S. decennial census’ geographical units
of aggregation vary from one census to another at fine
spatial scales (e.g., block-level data; Cai et al. 2006), results
from previous investigations have been temporally and
spatially restricted. However, these issues have been ad-
dressed and controlled for by the Spatially Explicit Re-
gional Growth Model (SERGoM; Theobald 2005). The
SERGoM model produces gridded, decadal, finescale
(100-m resolution) historical HU density estimates across
the conterminous United States. Model accuracy was
measured by employing a hindcast technique in conjunc-
tion with U.S. Census Bureau historical population and
HU metrics (Theobald 2005). Cross-validation results
110 WEATHER , CL IMATE , AND SOC IETY VOLUME 9
Page 3
between the hindcast and U.S. Census Bureau metrics
indicated that SERGoM HU estimations performed
well with accuracies ranging from 80% to 91%
(Theobald 2005).
b. Integrated Climate and Land-Use Scenarios andSpecial Report Emissions Scenarios data
More recently, the Integrated Climate and Land-Use
Scenarios (ICLUS) research group has coupled the In-
tergovernmental Panel on Climate Change (IPCC)
Special Report on Emissions Scenarios (SRES) A1, A2,
B1, and B2 projections with the SERGoM model to
estimate future HU density and population (Bierwagen
et al. 2010). The ICLUS group modified HU projections
by varying the SERGoM baseline county population
growth rates, household size (i.e., the number of people
in a single HU), and travel time to urban centers by the
four primary SRES storylines (EPA 2009; Bierwagen
et al. 2010). The A1 storyline comprises rapid economic
development, low population growth, and global in-
tegration. Housing growth rates in the A1 SRES are
limited due to low fertility and smaller household size
(EPA 2009). The A2 SRES scenario is the most ag-
gressive HU and population projection where steadily
increasing development rates drive twenty-first-century
economic regional growth. The B1 scenario is similar to
the A1 storyline but with a greater emphasis on the
environment and sustainable economic growth with
slowly decreasing growth rates. The B2 storyline
illustrates a regionally oriented landscape with moder-
ate population growth as well as a focus on local solu-
tions to environment and economic issues and consistent
growth rates. A fifth, base case (BC), scenario sets all
model parameters (travel time, migration, etc.) to me-
dium. The study places an emphasis on the A2 and BC
SRES storylines because the A2 represents a worst-case
projection and the BC highlights a ‘‘middle-of-the-
road’’ HU growth scenario.
Our research utilizes the HU as the principal measure
of residential tornado exposure because it is the primary
underlying metric derived in the SERGoM–ICLUS
model. Additionally, the HU provides a reasonable
measure of tornado exposure given that HU counts
are temporally more stable than population counts
(Theobald 2005), and more than 75% of all tornado
deaths (2003–15) occur in residential housing (Ashley
and Strader 2016).
c. Tornado Impact Monte Carlo model
Properly examining tornado exposure is often prob-
lematic because of small sample size (i.e., approximately
65 yr of observed tornado data), data inaccuracy and
bias, and relatively rare event occurrence in the
observed tornado record (Brooks et al. 2003a; Doswell
2007). In addition, historical extremes in tornado char-
acteristics (length, width, counts, etc.) may not have
been observed, or sampled, during the last 65 yr of re-
corded data (Meyer et al. 2002; Doswell 2007; Strader
et al. 2016). Nonetheless, a potential solution, or control
for some of these issues, is to utilize Monte Carlo sim-
ulation.Monte Carlo simulation is a numerical modeling
method that utilizes repeated random sampling to ob-
tain the distribution of an unknown probabilistic entity
(Mooney 1997). Monte Carlo simulation comprises two
unique attributes: iteration and randomness. These two
characteristics allow Monte Carlo simulations to pro-
vide probabilistic solutions about likely best-case and
worst-case outcomes. Monte Carlo simulation yields a
larger ‘‘window’’ of tornado event outcomes based on
the historically observed tornado data (Meyer et al.
2002; Strader et al. 2016). This study employs the Tor-
nado Impact Monte Carlo (TorMC) model (Strader
et al. 2016), which can simulate thousands of tornado
paths and estimate their potential impacts on an un-
derlying HU cost surface. For this particular research,
we define HU or tornado ‘‘impact’’ as the sum num-
ber of housing units that a simulated tornado inter-
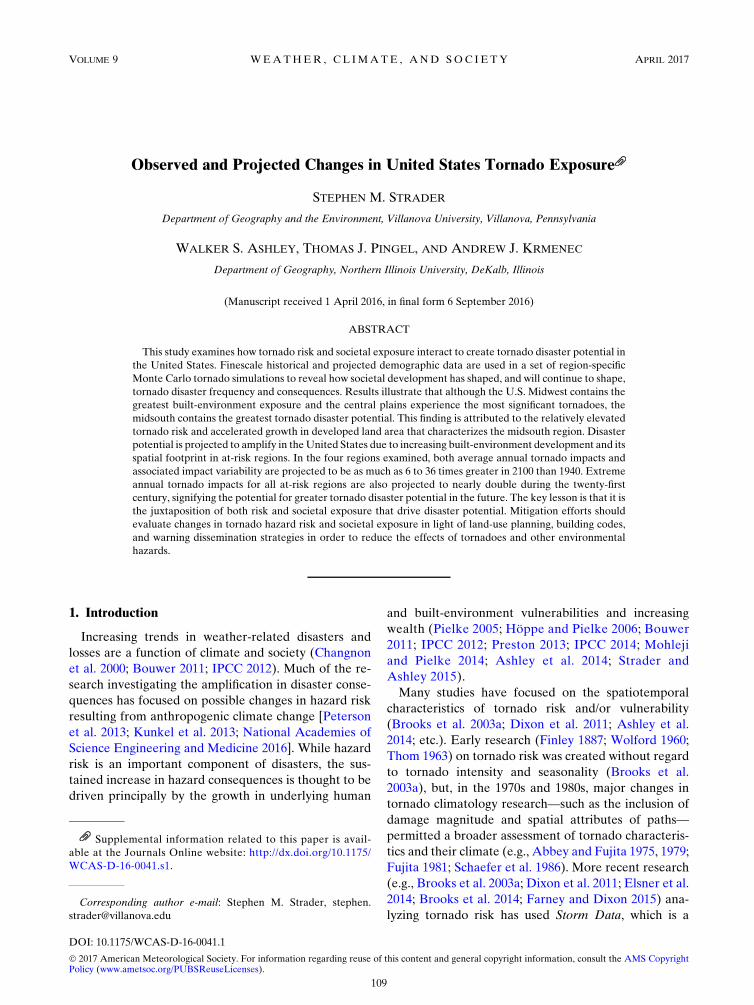
sects. Specifically, the individual conterminous U.S.
SERGoM–ICLUS HU decadal surfaces from 1940 to
2100 are used in conjunction with the spatially explicit
TorMC model to estimate changes in tornado impact
potential and exposure from 1940 to 2100 for all sce-
narios in equal-area, at-risk tornado regions in the
United States (central plains, high plains, midsouth, and
Midwest; Fig. 1). Two of these regions, the central plains
and high plains, were chosen because they are geo-
graphically positioned in an area that that contains some
of the highest mesocyclone supportive environments
and tornado frequencies in the world (cf. Brooks et al.
2003a; Gagan et al. 2010; Dixon et al. 2011; Marsh and
Brooks 2012; Dixon and Mercer 2012; Smith et al. 2012;
Tippett et al. 2015). In addition, the central and high
plains domains are characterized as largely rural land-
scapes with few highly developed urban areas. The
midsouth was selected because it represents an area that
contains a relatively high tornado frequency (Ashley
2007; Coleman and Dixon 2014; Ashley and Strader
2016) intersecting a comparatively developed landscape
and, in addition, is an area that has high tornado vul-
nerability and mortality (Ashley 2007; Ashley and
Strader 2016). Last, the Midwest domain was chosen
because it signifies a geographic region that is highly
populated but contains a slightly lower tornado fre-
quency compared to the other three regions. Overall, by
examining alterations in tornado impact metrics from
each simulation over time and across geographic space,
APRIL 2017 S TRADER ET AL . 111
Page 4
changes in tornado exposure and disaster potential for
the regions can be approximated.
A detailed description of the TorMC model methods,
steps, and verification is discussed in Strader et al. (2016)
and summarized in Table S1. In general, the TorMC
model encompasses four steps: 1) study region and
model parameter definition, 2) tornado footprint gen-
eration, 3) tornado path cost calculation, and 4) output
production (Strader et al. 2016). For this specific ex-
amination, the TorMC model was used to simulate
10 000 replicate years of significant—that is, EF2 or
greater magnitude—tornado footprints (i.e., tornado
pathlength by path width, which represents the hypo-
thetical maximum extent of tornadic winds) within each
study region. The simulation epoch of 10 000 replicate
years represents a trade-off of computational efficiency
with precision (distributional smoothness) in modeled
output. Significant tornadoes were selected because they
have been responsible for 99% of all tornado fatalities
and 75% of the reported damage since 1950 (Ashley
2007; Simmons and Sutter 2011). Moreover, significant
tornado frequency has remained relatively consistent
since 1950, while nonsignificant annual tornado
frequency continues to increase due to non-
meteorological influences (e.g., population-influenced
reporting biases; Verbout et al. 2006; Brooks et al.
2003a; Doswell 2007).
The TorMC model requires some additional param-
eter choices prior to simulation (Strader et al. 2016). For
this study, only those historical observed tornado counts
from 1954 to 2014 in each corresponding region are
sampled due to the underreporting of tornadoes prior to
the establishment of National Severe Storms Forecast
Center in the early part of the 1950s (Agee and Childs
2014). Weibull parameters from Brooks (2004) are used
to simulate significant tornado widths by EF-scale
magnitude, while lengths, azimuths, and magnitudes
are selected using a bootstrap, or random sampling with
replacement, technique on each region’s observed his-
torical tornado data from 1954 to 2014.
This study uses the TorMC’s random tornado touch-
down probability method to determine tornado place-
ment and costs. The random tornado touchdownmethod
ensures that the tornado starting point likelihood or
probability is equal for all locations within the simula-
tion study region [see Fig. 5b in Strader et al. (2016)].
FIG. 1. The total number of HU per hectare for 1940, 2000, 2050 (usingA2 SRES scenario), and 2100 (A2) for the
central plains (CP), high plains (HP), midsouth (MS), and Midwest (MW) with color denoting land-use classifi-
cation defined as rural (.16.18 haHU21), exurban (0.68–16.18 haHU21), suburban (0.1–0.68 haHU21), and urban
[,0.1 ha HU21; after Theobald (2005)].
112 WEATHER , CL IMATE , AND SOC IETY VOLUME 9
Page 5
Although this random tornado touchdown technique
removes any potential climatological and/or environ-
mental patterns in regional tornado occurrence, it does
help avoid population density–induced reporting bias
often found in historical tornado data (e.g., Grazulis
1993; Brooks et al. 2003a; Doswell et al. 2005; Elsner
et al. 2013; Strader et al. 2015). Once 10 000 replicate
years of significant tornado footprints have been simu-
lated atop the region of interest, the TorMC model as-
sesses each tornado footprint’s HU impact on the
underlying HU cost surface. An ‘‘intersect’’ cost-
extraction technique was employed to calculate
tornado–HU impacts by including all cost surface grid
cells that are intersected by simulated tornado footprints
[see Fig. 4 in Strader et al. (2016)]. The TorMC model
output provides the unique tornado field identifier
(FID), footprint polygon geometry, starting latitude and
longitude, ending latitude and longitude, pathlength
(km) and width (km), azimuth (8), magnitude (0–5),
simulation year, and HU impacts. Last, each simulated
tornado–HU impact value is grouped by its simulation
year and summed to provide a regional estimate of an-
nual HU impacts by significant tornadoes. This method
provides a robust approximation of regional tornado
disaster potential and tornado exposure.
It should be noted that although recent studies have
suggested that future severe weather environments may
alter the spatiotemporal characteristics of tornadoes
during the twenty-first century (Trapp et al. 2007;
Diffenbaugh et al. 2013; Gensini and Mote 2015), this
study assumes no future change in significant tornado
risk in order to isolate the influence changing tornado
exposure has on future tornado disaster potential.
d. Probability of exceedance and descriptive statistics
To illustrate changes in regional tornado exposure
and disaster potential, we employ probability of
exceedance (POE) curves and descriptive annual tor-
nado impact statistics. In general, four primary de-
scriptive metrics (median, mean, standard deviation,
and 95th percentile) are employed to characterize
changes in regional tornado exposure, disaster potential,
and annual impact POE. Given the rare occurrence of
tornadoes and associated disasters, POE curves and the
impacts associated with tornado events resemble an
extreme value distribution (Weibull, Gamma, etc.).
While the mean is commonly used to highlight a distri-
bution’s central tendency, the median serves as a stan-
dard measure of central tendency that is most useful
when there are extreme outliers within the distribution.
The standard deviation is used as a mechanism for de-
termining annual tornado impact variability, and the
95th percentile of annual tornado impacts are used to
examine high-end tornado impact years and disaster
potential. Last, the POE curve shape and scale
provides a graphical representation of annual tornado
impact statistics for each at-risk region. Relative dif-
ferences in tornado impact descriptive statistics and
POE curve characteristics capture changes in tornado
exposure, estimated impacts, and disaster potential
across spatiotemporal extents (Strader et al. 2016).
POE curves represent the total number of HUs im-
pacted by significant tornadoes in a given simulation
year for a particular SERGoM–ICLUS decadal cost
surface ranging from 1940 to 2100 (by SRES and BC
scenarios). The primary reason for generating annual
HU impact POE curves per cost surface is to provide
insight on how the distribution of HU impacts has
changed and may change in the future based on a range
of twenty-first century HU growth scenarios. This study
considers historical time periods as the decades of 1940
through 2000 and projected time periods to be those
years from 2010 to 2100. This approach was chosen be-
cause the ICLUS twenty-first century HU projection
model was initialized with 2000 census and other physical
attribute data (EPA 2009); thereafter, the ICLUS-
modeled local growth rates, accessibility to urban cen-
ters, travel time, household size, and so on, weremodified
consistently with the SRES projections.
3. Results
a. Tornado impact measures of central tendency
Tornado impact measures of central tendency repre-
sent the expected regional total number of HUs affected
by tornadoes in a given simulation year for a particular
decadal cost surface. As expected, all at-risk U.S. re-
gions are projected to undergo an increase in tornado
exposure and impact potential in the future century
(Table 1; Figs. 3, S1–S3). The midsouth has the greatest
absolute and relative change in the number of HUs
potentially impacted for a majority of the past (1940–
2000) and future (2010–2100) periods (Table 1; Fig. 2c).
From 1940 to 2000, the median number of midsouth
HUs impacted by significant tornadoes per simulation
year grew by 2185 HUs, or a 1543% increase, whereas
across the entire 160-yr study period, median HU im-
pacts are projected to increase by as much as 2867%
under the A2 scenario (Table 1). Projected HU impacts
in the midsouth are influenced largely by the A2 story-
line’s high domestic migration from the northern United
States to the midsouth (i.e., coastal area, mountainous
areas, and warmer climates are attracting affluent and/or
retired individuals; Manson and Groop 2000). This ef-
fect results in higher midsouth population growth rates
and an overall greater change in the region’s HUs
APRIL 2017 S TRADER ET AL . 113
Page 6
throughout the twenty-first century compared to all other
domains (Table 2). Contributing to this rapid change in
tornado impacts are the notable losses in rural land area
and corresponding growth in sprawling exurban and sub-
urban land development morphologies that have charac-
terized, and will continue to characterize, the midsouth.
TheMidwest exemplifies the second greatest absolute
change in estimated tornado impacts from 1940 to 2100
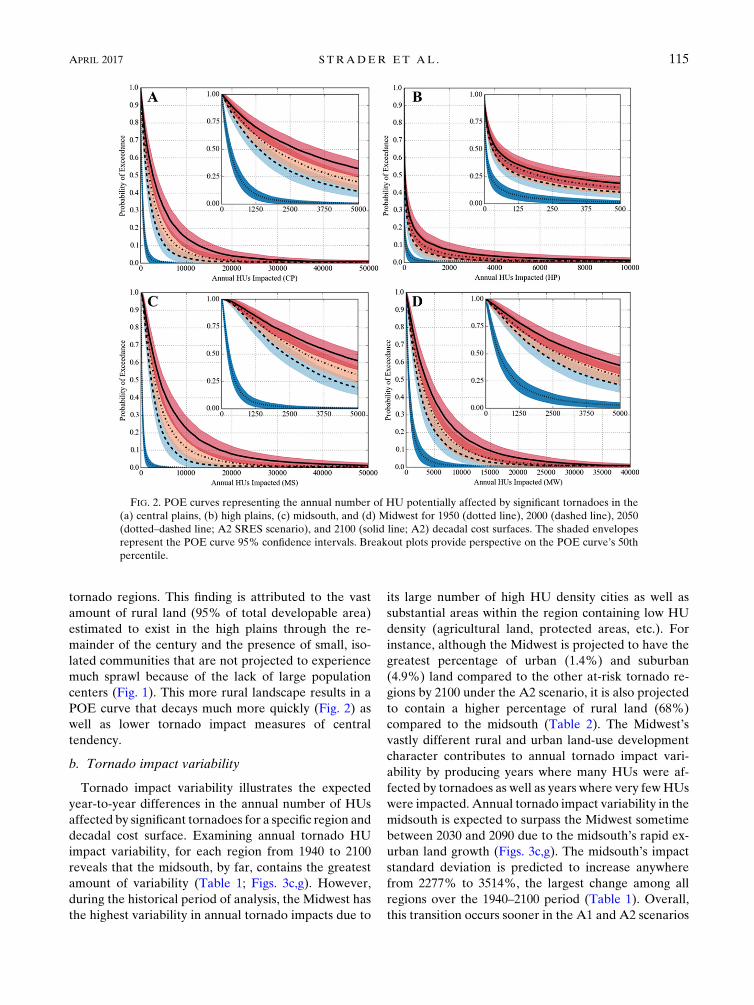
(Table 1). The Midwest’s median (mean) annual num-
ber of HUs impacted is expected to increase as much as
918% (779%), or 3258 (5400) HUs, during the 160-yr
study period (Table 1; Figs. 3a,b). A majority of the
growth in Midwest HU impacts occurred during the
historical portion of analysis where the median number
of HUs affected by significant tornadoes inflated 493%
(Fig. 3a). This rapid change in tornado impact potential
is a result of enhanced population and HU growth that
characterized the United States following World War II
(i.e., ‘‘Baby Boom’’ and post-1940s suburbanization).
Although the Midwest contains a greater number of
large population centers and the central plains
experience a greater frequency of significant (enhanced
Fujita scale 21 or EF21) tornadoes per year on average
compared to the midsouth, the collective midsouth
median and mean impacts are projected to outpace the
central plains andMidwest (Figs. 3a,b). This result is due
to the midsouth’s elevated tornado risk juxtaposed with
high HU density and more rapid development. While
differences in regional tornado risk play a role, the pri-
mary cause for the disparity between historical midsouth
and Midwest tornado impacts can be attributed to
changes inHU counts and land use (Tables 2 and 3). The
Midwest is projected to add as many as 1.5 million more
HUs than the midsouth during the 160-yr period, yet the
relative HU growth (3242%) in the midsouth is much
larger than the Midwest (768%) for the same period
(Table 3). In addition, the percentage of developable
land in the Midwest classified as rural is projected to
decrease as much as 27% by 2100, while in the midsouth
rural land percentage is projected to be reduced by up to
33% (Table 2). During this same period, midsouth ex-
urban land area is estimated to increase as much as
1488%, and Midwest exurban land is expected to in-
crease as much as 457%. These changes indicate that the
relatively higher conversion rates of rural land to exur-
ban, suburban, and urban land use in the midsouth will
lead to more substantial tornado impacts during the
twenty-first century compared to the Midwest.
The central plains are expected to experience as much
as a 1213% (1400%) change in median (mean) HU im-
pacts during the 160-yr study period (Table 1; Figs. 2a,b,
S1–S3). The difference between central plains and
midsouth annual median and mean tornado impacts can
be attributed, at least in part, to the contrasting HU
growth rates in the central plains and midsouth. The
central plains are projected to gain as many as 14.8
million HUs by 2100, acquiring 5.7 million fewer HUs
than themidsouth (Table 3). This difference is a result of
the lower (765%) projected central plains exurban
growth from 1940 to 2100 compared to the midsouth
(1488%; Table 2). Although the central plains and
midsouth contained similar median and mean annual
tornado impacts in 1940, by 2000 the midsouth median
and mean impact values had inflated to 2327 and 3366
HUs, respectively, surpassing the central plains’ impacts
by nearly 160% (Table 1; Figs. 3a,b).
The high plains contain the lowest change in tornado
impacts from 1940 to 2100 compared to all at-risk
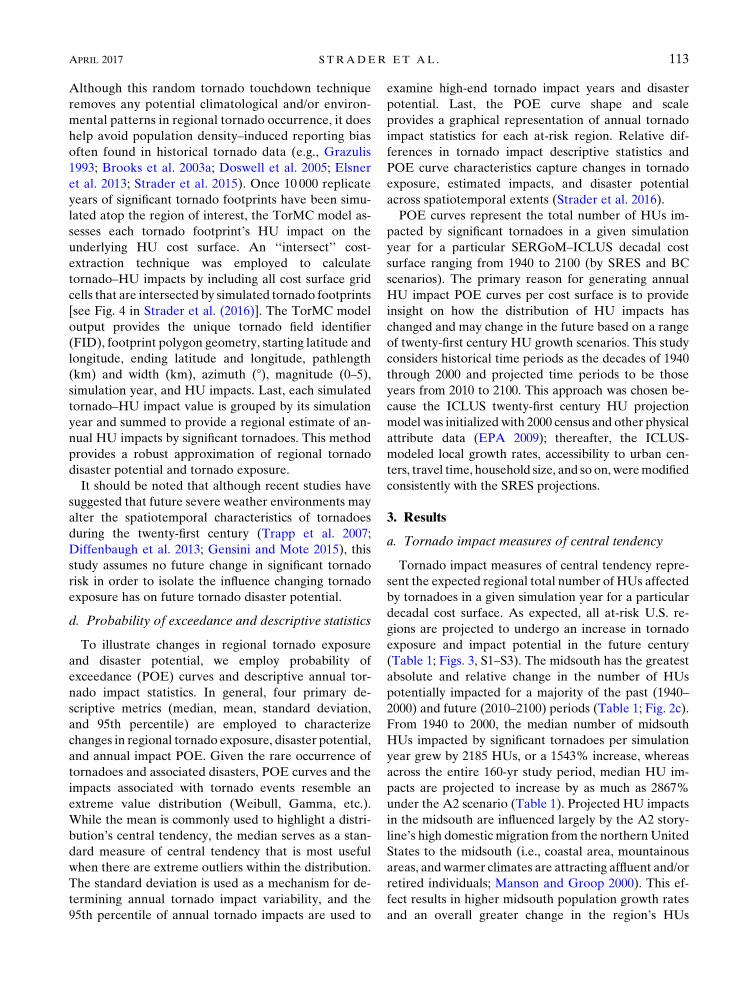
TABLE 1.Absolute and percentage change in tornado impact descriptive statistics (median,mean, standard deviation, and 95th percentile)
from 1940 to 2100 by region.
Descriptive statistic 1940 2100 (A2) Absolute change % change
Central plains Median 208.9 2742.4 2534 1213
Mean 354.2 5314.6 4960 1400
Std dev 515.0 8128.8 7614 1478
95th percentile 1154.9 18 242.8 17 088 1480
High plains Median 3.8 46.0 42 1101
Mean 29.0 648.3 619 2139
Std dev 158.2 2470.5 2312 1462
95th percentile 107.1 2900.0 2793 2608
Midsouth Median 141.7 4203.2 4062 2867
Mean 233.4 7744.4 7511 3219
Std dev 327.5 11 834.8 11 507 3514
95th percentile 722.1 25 762.0 25 040 3468
Midwest Median 355.0 3612.6 3258 918
Mean 692.9 6092.4 5400 779
Std dev 1137.1 7417.0 6280 552
95th percentile 2392.6 20 507.8 18 115 757
114 WEATHER , CL IMATE , AND SOC IETY VOLUME 9
Page 7
tornado regions. This finding is attributed to the vast
amount of rural land (95% of total developable area)
estimated to exist in the high plains through the re-
mainder of the century and the presence of small, iso-
lated communities that are not projected to experience
much sprawl because of the lack of large population
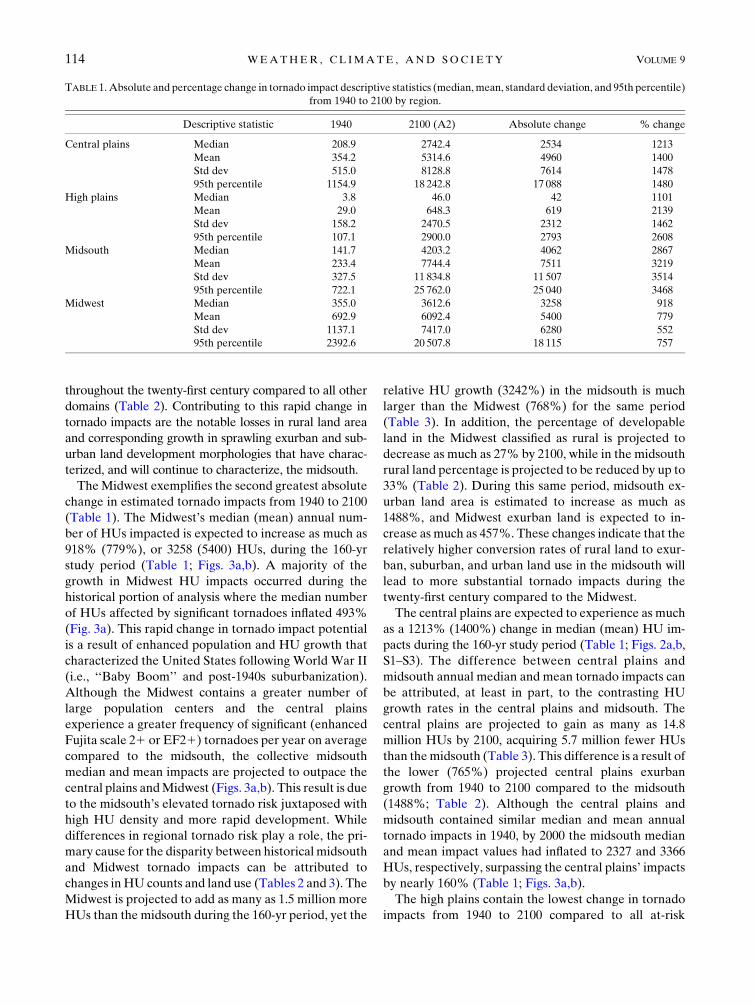
centers (Fig. 1). This more rural landscape results in a
POE curve that decays much more quickly (Fig. 2) as
well as lower tornado impact measures of central
tendency.
b. Tornado impact variability
Tornado impact variability illustrates the expected
year-to-year differences in the annual number of HUs
affected by significant tornadoes for a specific region and
decadal cost surface. Examining annual tornado HU
impact variability, for each region from 1940 to 2100
reveals that the midsouth, by far, contains the greatest
amount of variability (Table 1; Figs. 3c,g). However,
during the historical period of analysis, the Midwest has
the highest variability in annual tornado impacts due to
its large number of high HU density cities as well as
substantial areas within the region containing low HU
density (agricultural land, protected areas, etc.). For
instance, although the Midwest is projected to have the
greatest percentage of urban (1.4%) and suburban
(4.9%) land compared to the other at-risk tornado re-
gions by 2100 under the A2 scenario, it is also projected
to contain a higher percentage of rural land (68%)
compared to the midsouth (Table 2). The Midwest’s
vastly different rural and urban land-use development
character contributes to annual tornado impact vari-
ability by producing years where many HUs were af-
fected by tornadoes as well as years where very fewHUs
were impacted. Annual tornado impact variability in the
midsouth is expected to surpass the Midwest sometime
between 2030 and 2090 due to the midsouth’s rapid ex-
urban land growth (Figs. 3c,g). The midsouth’s impact
standard deviation is predicted to increase anywhere
from 2277% to 3514%, the largest change among all
regions over the 1940–2100 period (Table 1). Overall,
this transition occurs sooner in the A1 and A2 scenarios
FIG. 2. POE curves representing the annual number of HU potentially affected by significant tornadoes in the
(a) central plains, (b) high plains, (c) midsouth, and (d) Midwest for 1950 (dotted line), 2000 (dashed line), 2050
(dotted–dashed line; A2 SRES scenario), and 2100 (solid line; A2) decadal cost surfaces. The shaded envelopes
represent the POE curve 95% confidence intervals. Breakout plots provide perspective on the POE curve’s 50th
percentile.
APRIL 2017 S TRADER ET AL . 115
Page 8
as these are based on more rapid economic
progression, a highly mobile workforce, and strong do-
mestic and international migration (EPA 2009).
Because of the effects of decreasing HU growth rates
in the Midwest and slowly increasing growth rates in the
central plains during the twenty-first century, the central
plains and Midwest projected annual impact variability
trends follow similar trajectories. The central plains’
impact standard deviation is estimated to increase up to
7613% from 1940 to 2100; the Midwest’s impact vari-
ability is expected to change by as much as 6280%
(Table 1). The central plains annual tornado impact
variability is constrained because of the paucity of the
large population centers necessary for rapid HU growth,
and the Midwest variability is restricted because vast
amount of agricultural and protected land that tends to
limit HU growth and sprawl (Brown et al. 2005). The
high plains contain the least amount of annual HU im-
pact variability compared to all other regions due to the
paucity of large population centers, high proportion of
rural land, and lower development growth rates
(EPA 2009).
c. Tornado impact 95th percentile
The 95th percentile of annual impacts highlights the
probability of high-end years where the number of HUs
impacted by significant tornadoes would be considered
either rare or relatively extreme by meteorologists and
risk analysts (Figs. 3d,h, S1–S3). The potential for a
high-end tornado impact year may be the result of a
large number of tornadoes accompanying a severe
weather outbreak (e.g., 3–4 April 1974 and 27 April 2011
outbreaks) or a year where a single large tornado
traversed a highly populated area resulting in thousands
of HUs affected. From 1940 to 2000, the Midwest had the
greatest absolute change in the 95th percentile, increasing
by 9426HUs, or 394% (Table 1; Figs. 3d,h). Themidsouth
is projected to overtake the Midwest during the twenty-
first century for all projected ICLUS storylines except for
B2. Annual HU impacts associated with the midsouth’s
95th percentile may increase asmuch as 3468% from 1940
to 2100, while the Midwest may amplify up to 757%
(Table 1). The more substantial growth in exurban land,
higher domestic migration, and larger population growth
rates found in the midsouth yield greater changes in 95th
percentile tornado impacts compared to all other regions.
Although less than the midsouth, the central plains’ and
high plains’ 95th percentile annual HU impact values are
expected to increase throughout the century, increasing
by as much as 1480% and 2608%, respectively (Table 1;
Figs. 3d,h). These comparisons indicate that although the
Midwest contains a greater number of HUs today, high-
end tornado impact probabilities for the other regions
may increase at a much faster pace during the twenty-first
century.
d. Observed versus uniform development types
To assess the relative influences of HU growth and
spatial distribution on annual tornado impact probabil-
ities, the TorMC was used to generate four 10 000-yr
tornado simulations [two per decadal cost surface (1950
and 2100) over each region (Fig. 4)]. Simulations are
TABLE 2. Total number of housing units and percentage of developable area in the at-risk regions for 1940 and 2100 (by the A2 SRES
scenario). Land-use type was defined after Theobald (2005) as rural (.16.18 ha HU21); exurban (0.68–16.18 ha HU21); suburban (0.1–
0.68 ha HU21); and urban (,0.1 ha HU21). The percentage change in total HUs and percentage of total developable area from 1940 to
2100 by regional study area and LU classification is also provided.
Housing units % of total developable area
Region Land-use class 1940 2100 % change 1940–2100 1940 2100 % change 1940–2100
Central plains Rural 225 151 463 303 105.8 97.9 79.7 218.6
Exurban 209 650 2 110 166 906.5 1.9 16.1 764.5
Suburban 445 246 6 725 928 1410.6 0.3 3.4 1215.9
Urban 172 994 6 550 397 3686.5 0.01 0.8 3341.7
High plains Rural 38 557 140 059 263.3 99.5 95.3 24.3
Exurban 51 746 577 692 1016.4 0.4 3.5 803.9
Suburban 110 795 1 448 352 1207.2 0.1 0.7 801.6
Urban 37 055 3 969 748 10 613.2 0.01 0.5 9903.0
Midsouth Rural 189 375 564 958 198.3 98.0 65.0 233.6
Exurban 205 999 3 485 395 1591.9 1.9 30.1 1487.7
Suburban 194 055 7 396 803 3711.7 0.1 3.6 2439.3
Urban 42 538 9 675 024 22 644.5 0.01 1.3 22 917.4
Midwest Rural 386 297 629 393 62.9 94.5 67.9 228.1
Exurban 537 898 2 791 839 419.0 4.6 25.8 456.6
Suburban 1 235 604 10 796 096 773.8 0.8 4.9 526.9
Urban 703 094 10 644 427 1413.9 0.1 1.4 1522.5
116 WEATHER , CL IMATE , AND SOC IETY VOLUME 9
Page 9
conducted over two types of hazard costs surfaces: ob-
served and uniform. The observed cost surfaces are
based on historical development and land-use patterns
in each region. The uniform cost surfaces represent an
extremely sprawled and theoretical HU density land-
scape, where the total number of HUs within the region
for a given decade surface is distributed uniformly across
the region’s spatial domain. Although the uniform cost
surface is an unrealistic and theoretical land-use pattern,
it does provide insight into how urban sprawl influences
tornado impacts and disaster probability. POE curves
generated from the observed cost surface simulations
capture both the effects of HUmagnitude and sprawling
development on tornado impact probability, while the
uniform cost surface simulations highlight the effects of
sprawl on tornado disaster potential. The differences
between the 1950 and 2100 POE curves indicate the
importance of HU magnitude growth during the 150-yr
period, and the disparity in POE shapes portend the
consequences of development and land-use differences.
FIG. 3. Annual significant tornado impact descriptive statistics, including (a) median (A2), (b) median (BC),
(c) mean (A2), (d) mean (BC), (e) standard deviation (A2), (f) standard deviation (BC), (g) 95th percentile (A2),
and (h) 95th percentile (BC) for the central plains (squares), high plains (circles), midsouth (triangles), andMidwest
(diamonds) from 1940 to 2100.
APRIL 2017 S TRADER ET AL . 117
Page 10
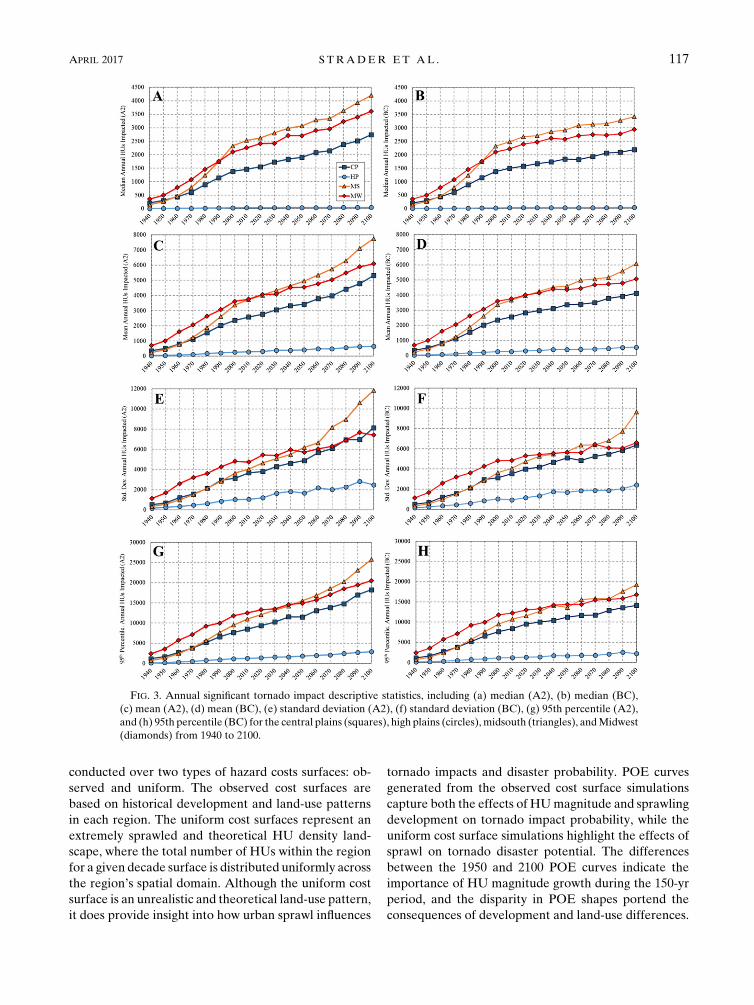
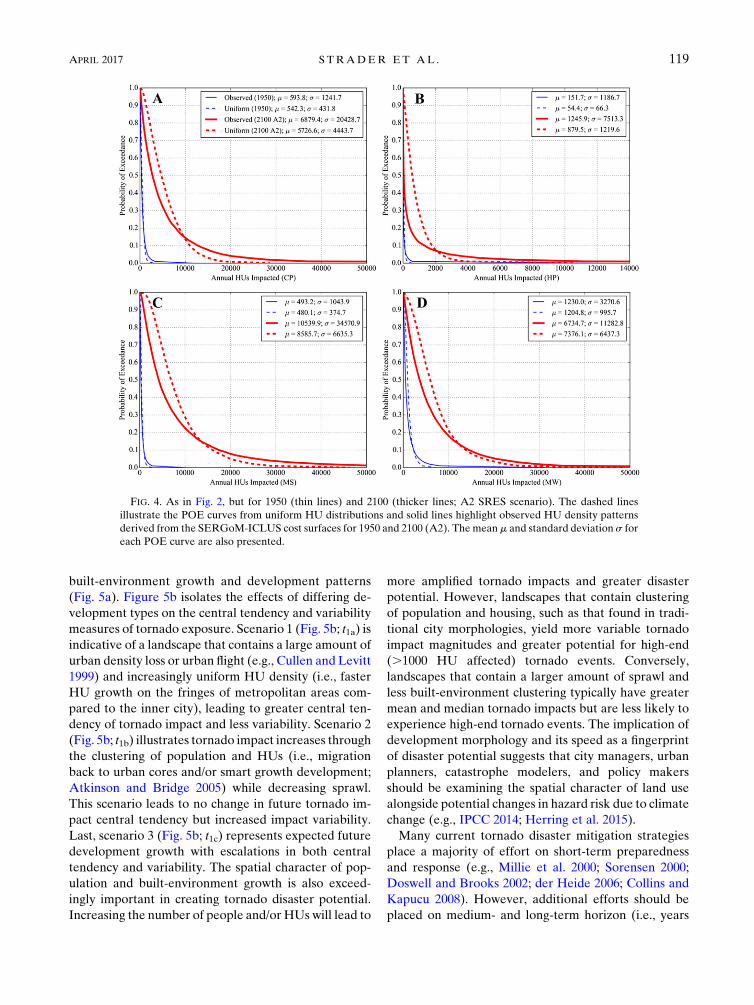
Comparing tornado impact statistics (Fig. 4) and POE
curve shapes associated with each simulation reveals that
the uniform cost surfaces contain greater mean annual
tornado impacts compared to the observed cost surfaces.
This suggests that although the total number of HUs in
each region is equal in both the observed and uniform
simulation scenarios, the uniform HU density pattern
results in a greater number of HUs affected per year on
average. Concurrently, high-impact years (POE, 0.1) in
the uniform simulations are restricted due to the lack of
clustered development (towns, cities, etc.). The total
number of HUs affected by a single tornado on the uni-
form cost surface is related to tornado footprint areal
coverage (i.e., the longer and wider simulated tornado,
the greater the HU impact magnitude). The differences
between observed and uniform high-impact years are
revealed by comparing their standard deviations. The
variability in annual tornado impacts is greater in ob-
served simulations compared to the uniform simulations
in all regions. In general, solely increasing HUs through
time will lead to greater median and mean tornado–HU
impacts, but incorporating clustered HU growth com-
bined with sprawling development increases impact var-
iability and high-impact event probability.
4. Discussion and conclusions
While the findings presented reveal the potential for
more and greater tornado disasters in the future, disaster
risk probability is not uniform across space and time. In
general, comparative results across at-risk regions reveal
that future tornado disaster potential will be greatest in
the midsouth because of this region’s elevated tornado
risk intersecting heightened exposure rates because of
existing and projected built-environment development
in and around metropolitan areas. The south contains a
large number of physical and social vulnerabilities—
from a high rate of nighttime tornadoes and fast storm
speeds to substantial mobile home density and elevated
poverty rates (Ashley 2007; Simmons and Sutter 2007;
Ashley et al. 2008). Any increase in residential built
environment and affiliated population will amplify these
vulnerabilities, portending greater disaster frequency
and magnitude in the future. While this potential is
greatest in the midsouth, the other at-risk regions in-
vestigated reveal similar trends in disaster likelihood as
varying—but generally increasing—rates of exposure
interact with some of the highest tornado risks anywhere
in the world (Brooks et al. 2003b; Tippett et al. 2015).
Understanding how disasters are being altered is
complex because of changes in vulnerability and risk
(Meehl et al. 2000; IPCC 2001, 2012). The relationship
between these disaster constituents is best illustrated
by examining their respective statistical distributions
rather than just central tendency and variability (e.g.,
IPCC 2001, their Fig. 2.32). A simple conceptual model
highlights how tornado impact POE may change
under future development regimes (Fig. 5). Within
each curve, there are individual shifts in tornado cen-
tral tendency and variability, all related to residential
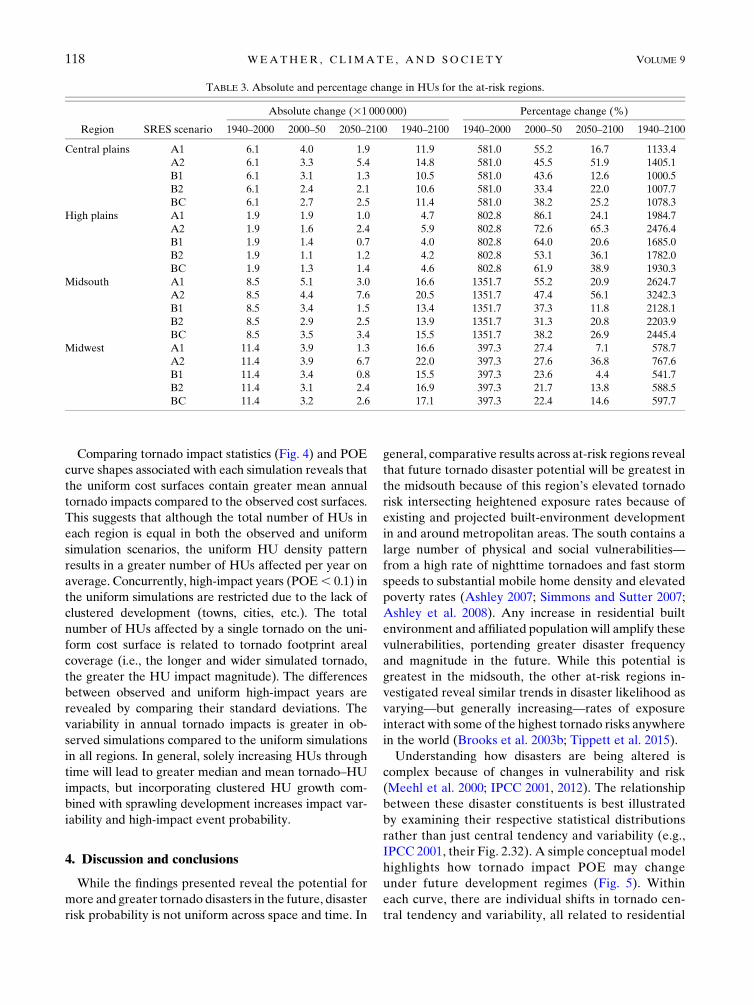
TABLE 3. Absolute and percentage change in HUs for the at-risk regions.
Region
Absolute change (31 000 000) Percentage change (%)
SRES scenario 1940–2000 2000–50 2050–2100 1940–2100 1940–2000 2000–50 2050–2100 1940–2100
Central plains A1 6.1 4.0 1.9 11.9 581.0 55.2 16.7 1133.4
A2 6.1 3.3 5.4 14.8 581.0 45.5 51.9 1405.1
B1 6.1 3.1 1.3 10.5 581.0 43.6 12.6 1000.5
B2 6.1 2.4 2.1 10.6 581.0 33.4 22.0 1007.7
BC 6.1 2.7 2.5 11.4 581.0 38.2 25.2 1078.3
High plains A1 1.9 1.9 1.0 4.7 802.8 86.1 24.1 1984.7
A2 1.9 1.6 2.4 5.9 802.8 72.6 65.3 2476.4
B1 1.9 1.4 0.7 4.0 802.8 64.0 20.6 1685.0
B2 1.9 1.1 1.2 4.2 802.8 53.1 36.1 1782.0
BC 1.9 1.3 1.4 4.6 802.8 61.9 38.9 1930.3
Midsouth A1 8.5 5.1 3.0 16.6 1351.7 55.2 20.9 2624.7
A2 8.5 4.4 7.6 20.5 1351.7 47.4 56.1 3242.3
B1 8.5 3.4 1.5 13.4 1351.7 37.3 11.8 2128.1
B2 8.5 2.9 2.5 13.9 1351.7 31.3 20.8 2203.9
BC 8.5 3.5 3.4 15.5 1351.7 38.2 26.9 2445.4
Midwest A1 11.4 3.9 1.3 16.6 397.3 27.4 7.1 578.7
A2 11.4 3.9 6.7 22.0 397.3 27.6 36.8 767.6
B1 11.4 3.4 0.8 15.5 397.3 23.6 4.4 541.7
B2 11.4 3.1 2.4 16.9 397.3 21.7 13.8 588.5
BC 11.4 3.2 2.6 17.1 397.3 22.4 14.6 597.7
118 WEATHER , CL IMATE , AND SOC IETY VOLUME 9
Page 11
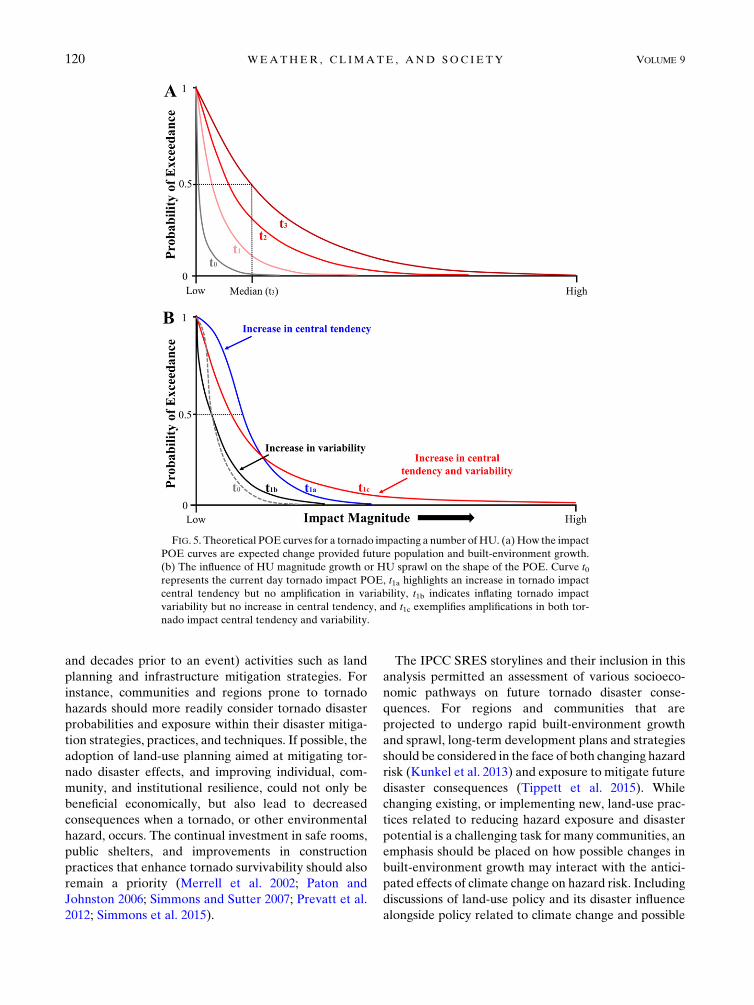
built-environment growth and development patterns
(Fig. 5a). Figure 5b isolates the effects of differing de-
velopment types on the central tendency and variability
measures of tornado exposure. Scenario 1 (Fig. 5b; t1a) is
indicative of a landscape that contains a large amount of
urban density loss or urban flight (e.g., Cullen and Levitt
1999) and increasingly uniform HU density (i.e., faster
HU growth on the fringes of metropolitan areas com-
pared to the inner city), leading to greater central ten-
dency of tornado impact and less variability. Scenario 2
(Fig. 5b; t1b) illustrates tornado impact increases through
the clustering of population and HUs (i.e., migration
back to urban cores and/or smart growth development;
Atkinson and Bridge 2005) while decreasing sprawl.
This scenario leads to no change in future tornado im-
pact central tendency but increased impact variability.
Last, scenario 3 (Fig. 5b; t1c) represents expected future
development growth with escalations in both central
tendency and variability. The spatial character of pop-
ulation and built-environment growth is also exceed-
ingly important in creating tornado disaster potential.
Increasing the number of people and/or HUs will lead to
more amplified tornado impacts and greater disaster
potential. However, landscapes that contain clustering
of population and housing, such as that found in tradi-
tional city morphologies, yield more variable tornado
impact magnitudes and greater potential for high-end
(.1000 HU affected) tornado events. Conversely,
landscapes that contain a larger amount of sprawl and
less built-environment clustering typically have greater
mean and median tornado impacts but are less likely to
experience high-end tornado events. The implication of
development morphology and its speed as a fingerprint
of disaster potential suggests that city managers, urban
planners, catastrophe modelers, and policy makers
should be examining the spatial character of land use
alongside potential changes in hazard risk due to climate
change (e.g., IPCC 2014; Herring et al. 2015).
Many current tornado disaster mitigation strategies
place a majority of effort on short-term preparedness
and response (e.g., Millie et al. 2000; Sorensen 2000;
Doswell and Brooks 2002; der Heide 2006; Collins and
Kapucu 2008). However, additional efforts should be
placed on medium- and long-term horizon (i.e., years
FIG. 4. As in Fig. 2, but for 1950 (thin lines) and 2100 (thicker lines; A2 SRES scenario). The dashed lines
illustrate the POE curves from uniform HU distributions and solid lines highlight observed HU density patterns
derived from the SERGoM-ICLUS cost surfaces for 1950 and 2100 (A2). The mean m and standard deviation s for
each POE curve are also presented.
APRIL 2017 S TRADER ET AL . 119
Page 12
and decades prior to an event) activities such as land
planning and infrastructure mitigation strategies. For
instance, communities and regions prone to tornado
hazards should more readily consider tornado disaster
probabilities and exposure within their disaster mitiga-
tion strategies, practices, and techniques. If possible, the
adoption of land-use planning aimed at mitigating tor-
nado disaster effects, and improving individual, com-
munity, and institutional resilience, could not only be
beneficial economically, but also lead to decreased
consequences when a tornado, or other environmental
hazard, occurs. The continual investment in safe rooms,
public shelters, and improvements in construction
practices that enhance tornado survivability should also
remain a priority (Merrell et al. 2002; Paton and
Johnston 2006; Simmons and Sutter 2007; Prevatt et al.
2012; Simmons et al. 2015).
The IPCC SRES storylines and their inclusion in this
analysis permitted an assessment of various socioeco-
nomic pathways on future tornado disaster conse-
quences. For regions and communities that are
projected to undergo rapid built-environment growth
and sprawl, long-term development plans and strategies
should be considered in the face of both changing hazard
risk (Kunkel et al. 2013) and exposure to mitigate future
disaster consequences (Tippett et al. 2015). While
changing existing, or implementing new, land-use prac-
tices related to reducing hazard exposure and disaster
potential is a challenging task for many communities, an
emphasis should be placed on how possible changes in
built-environment growth may interact with the antici-
pated effects of climate change on hazard risk. Including
discussions of land-use policy and its disaster influence
alongside policy related to climate change and possible
FIG. 5. Theoretical POE curves for a tornado impacting a number of HU. (a)How the impact
POE curves are expected change provided future population and built-environment growth.
(b) The influence of HU magnitude growth or HU sprawl on the shape of the POE. Curve t0represents the current day tornado impact POE, t1a highlights an increase in tornado impact
central tendency but no amplification in variability, t1b indicates inflating tornado impact
variability but no increase in central tendency, and t1c exemplifies amplifications in both tor-
nado impact central tendency and variability.
120 WEATHER , CL IMATE , AND SOC IETY VOLUME 9
Page 13
shifts in hazard risk will permit decision-makers and
elected officials to make more informed decisions about
how to better prepare for and mitigate future disasters.
Acknowledgments. The authors thank Dr. David
Theobald (Conservation Science Partners) for providing
the historical SERGoM model output. We also thank
the anonymous reviewers whose recommendations and
feedback greatly strengthened the manuscript.
REFERENCES
Abbey, R., Jr., and T. Fujita, 1975: Use of tornado path lengths and
gradations of damage to assess tornado intensity probabilities.
Preprints, Ninth Conf. on Severe Local Storms, Norman, OK,
Amer. Meteor. Soc., 286–293.
——, and ——, 1979: The DAPPLE method for computing tor-
nado hazard probabilities: Refinements and theoretical con-
siderations. Preprints, 11th Conf. on Severe Local Storms,
Kansas City, MO, Amer. Meteor. Soc., 241–248.
Agee, E., and S. Childs, 2014: Adjustments in tornado counts,
F-scale intensity, and path width for assessing significant tor-
nado destruction. J. Appl. Meteor. Climatol., 53, 1494–1505,
doi:10.1175/JAMC-D-13-0235.1.
Ashley, W., 2007: Spatial and temporal analysis of tornado fatali-
ties in the United States: 1880–2005. Wea. Forecasting, 22,
1214–1228, doi:10.1175/2007WAF2007004.1.
——, and S. Strader, 2016: Recipe for disaster: How the dynamic
ingredients of risk and exposure are changing the tornado
disaster landscape. Bull. Amer. Meteor. Soc., 767–786,
doi:10.1175/BAMS-D-15-00150.1.
——, A. Krmenec, and R. Schwantes, 2008: Vulnerability due to
nocturnal tornadoes. Wea. Forecasting, 23, 795–807,
doi:10.1175/2008WAF2222132.1.
——, S. Strader, T. Rosencrants, and A. Krmenec, 2014: Spatio-
temporal changes in tornado hazard exposure: The case of the
expanding bull’s eye effect in Chicago, IL. Wea. Climate Soc.,
6, 175–193, doi:10.1175/WCAS-D-13-00047.1.
Atkinson, R., and G. Bridge, 2005: Gentrification in a Global
Context. Routledge, 320 pp.
Bierwagen, B., D. Theobald, C. Pyke, A. Choate, P. Groth,
J. Thomas, and P. Morefield, 2010: National housing and im-
pervious surface scenarios for integrated climate impact as-
sessments. Proc. Natl. Acad. Sci. USA, 107, 20 887–20 892,
doi:10.1073/pnas.1002096107.
Bouwer, L., 2011: Have disaster losses increased due to anthro-
pogenic climate change? Bull. Amer. Meteor. Soc., 92, 39–46,
doi:10.1175/2010BAMS3092.1.
Brooks, H., 2004: On the relationship of tornado path length and
width to intensity.Wea. Forecasting, 19, 310–319, doi:10.1175/
1520-0434(2004)019,0310:OTROTP.2.0.CO;2.
——, C. Doswell III, andM. Kay, 2003a: Climatological estimates of
local daily tornado probability. Wea. Forecasting, 18, 626–640,
doi:10.1175/1520-0434(2003)018,0626:CEOLDT.2.0.CO;2.
——, J. Lee, and J. Craven, 2003b: The spatial distribution of se-
vere thunderstorm and tornado environments from global
reanalysis data. Atmos. Res., 67–68, 73–94, doi:10.1016/
S0169-8095(03)00045-0.
——, G. Carbin, and P. Marsh, 2014: Increased variability of tor-
nado occurrence in the United States. Science, 346, 349–352,
doi:10.1126/science.1257460.
Brown, D., K. Johnson, T. Loveland, andD. Theobald, 2005: Rural
land-use trends in the conterminous United States, 1950–2000.
Ecol. Appl., 15, 1851–1863, doi:10.1890/03-5220.
Burkett, V., and M. Davidson, 2012: Coastal impacts, adaptation
and vulnerability: A technical input to the 2012 National Cli-
mate Assessment. Cooperative Rep. to the 2013 National
Climate Assessment, 150 pp.
Cai, Q., G. Rushton, B. Bhaduri, E. Bright, and P. Coleman, 2006:
Estimating small-area populations by age and sex using spatial
interpolation and statistical inference methods. Trans. GIS,
10, 577–598, doi:10.1111/j.1467-9671.2006.01013.x.
Changnon, S., and J. Burroughs, 2003: The tristate hailstorm: The
most costly on record. Mon. Wea. Rev., 131, 1734–1739,
doi:10.1175//2549.1.
——, R. Pielke Jr., D. Changnon, R. Sylves, and R. Pulwarty, 2000:
Human factors explain the increased losses from weather and
climate extremes. Bull. Amer. Meteor. Soc., 81, 437–442,
doi:10.1175/1520-0477(2000)081,0437:HFETIL.2.3.CO;2.
Coleman, T., and P. Dixon, 2014: An objective analysis of tornado
risk in the United States. Wea. Forecasting, 29, 366–376,
doi:10.1175/WAF-D-13-00057.1.
Collins, M., and N. Kapucu, 2008: Early warning systems and di-
saster preparedness and response in local government. Di-
saster Prev. Manage., 17, 587–600, doi:10.1108/
09653560810918621.
Cullen, J. B., and S. D. Levitt, 1999: Crime, urban flight, and the
consequences for cities. Rev. Econ. Stat., 81, 159–169,
doi:10.1162/003465399558030.
Cutter, S., C. Emrich, J. Webb, and D. Morath, 2009: Social vul-
nerability to climate variability hazards: A review of the lit-
erature. Final Rep. to Oxfam America, 44 pp.
Daneshvaran, S., andR.Morden, 2007: Tornado risk analysis in the
United States. J. Risk Finance, 8, 97–111, doi:10.1108/
15265940710732314.
der Heide, E. A., 2006: The importance of evidence-based disaster
planning. Ann. Emerg. Med., 47, 34–49, doi:10.1016/
j.annemergmed.2005.05.009.
Diffenbaugh, N., M. Scherer, and R. Trapp, 2013: Robust increases
in severe thunderstorm environments in response to green-
house forcing. Proc. Natl. Acad. Sci. USA, 110, 16 361–16 366,
doi:10.1073/pnas.1307758110.
Dixon, P., and A. Mercer, 2012: Reply to ‘‘Comments on ‘Tornado
risk analysis: Is Dixie Alley an extension of Tornado Alley?’’’
Bull. Amer. Meteor. Soc., 93, 408–410, doi:10.1175/
BAMS-D-11-00219.1.
——, ——, J. Choi, and J. Allen, 2011: Tornado risk analysis: Is
Dixie Alley an extension of Tornado Alley? Bull. Amer.
Meteor. Soc., 92, 433–441, doi:10.1175/2010BAMS3102.1.
Doswell, C., III, 2007: Small sample size and data quality issues
illustrated using tornado occurrence data. Electron. J. Severe
Storms Meteor., 2, 1–16.——, and H. Brooks, 2002: Lessons learned from the damage
produced by the tornadoes of 3 May 1999. Wea. Fore-
casting, 17, 611–618, doi:10.1175/1520-0434(2002)017,0611:
LLFTDP.2.0.CO;2.
——, ——, and M. Kay, 2005: Climatological estimates of daily
local nontornadic severe thunderstorm probability for the
United States. Wea. Forecasting, 20, 577–595, doi:10.1175/
WAF866.1.
Edwards, R., J. LaDue, J. Ferree, K. Scharfenberg, C. Maier, and
W. Coulbourne, 2013: Tornado intensity estimation: Past,
present, and future. Bull. Amer. Meteor. Soc., 94, 641–653,
doi:10.1175/BAMS-D-11-00006.1.
APRIL 2017 S TRADER ET AL . 121
Page 14
Elsner, J., L. Michaels, K. Scheitlin, and I. Elsner, 2013: The de-
creasing population bias in tornado reports across the central
plains. Wea. Climate Soc., 5, 221–232, doi:10.1175/
WCAS-D-12-00040.1.
——, T. Jagger, H. Widen, and D. Chavas, 2014: Daily tornado
frequency distributions in the United States. Environ. Res.
Lett., 9, 024018, doi:10.1088/1748-9326/9/2/024018.
EPA, 2009: Land-use scenarios: National-scale housing-density
scenarios consistent with climate change storylines. EPAFinal
Rep. EPA/600/R-08/076F, 137 pp.
Farney, T. J., and P. G. Dixon, 2015: Variability of tornado cli-
matology across the continental United States. Int.
J. Climatol., 35, 2993–3006, doi:10.1002/joc.4188.Finley, J., 1887: Tornadoes: What They Are and How to Observe
Them. Insurance Monitor Press, 196 pp.
Fujita, T. T., 1981: Tornadoes and downbursts in the context
of generalized planetary scales. J. Atmos. Sci., 38, 1511–1534,
doi: 10.1175/1520-0469(1981)038,1511:TADITC.2.0.CO;2.
Gagan, J., A. Gerard, and J. Gordon, 2010: A historical and sta-
tistical comparison of ‘‘Tornado Alley’’ to ‘‘Dixie Alley.’’
Natl. Wea. Dig., 34, 145–155.
Gensini, V., and T. Mote, 2015: Downscaled estimates of late 21st
century severe weather from CCSM3. Climatic Change, 129,
307–321, doi:10.1007/s10584-014-1320-z.
Grazulis, T., 1993: Significant Tornadoes, 1680-1991. Environ-
mental Films, 1340 pp.
Hall, S., andW. Ashley, 2008: The effects of urban sprawl on the
vulnerability to a significant tornado impact in northeast-
ern Illinois. Nat. Hazards Rev., 9, 209–219, doi:10.1061/
(ASCE)1527-6988(2008)9:4(209).
Herring, S., M. Hoerling, J. Kossin, T. Peterson, and P. Scott, 2015:
Explaining extreme events of 2014 from a climate perspective.
Bull. Amer. Meteor. Soc., 96 (12), S1–S172.
Höppe, P., and R. Pielke Jr., Eds., 2006: Workshop on climate
change and disaster losses: Understanding and attributing
trends and projections. Final workshop report, 270 pp.
IPCC, 2001: Climate Change 2001: The Scientific Basis. Cambridge
University Press, 881 pp.
——, 2012:Managing the Risks of Extreme Events and Disasters to
Advance Climate Change Adaptation. Cambridge University
Press, 582 pp.
——, 2014: Climate Change 2014: Mitigation of Climate Change.
Cambridge University Press, 1465 pp. [Available online at
http://www.ipcc.ch/pdf/assessment-report/ar5/wg3/ipcc_wg3_
ar5_full.pdf.]
Kunkel, K., and Coauthors, 2013: Monitoring and understanding
trends in extreme storms: State of knowledge. Bull. Amer.
Meteor. Soc., 94, 499–514, doi:10.1175/BAMS-D-11-00262.1.
Manson, G. A., and R. E. Groop, 2000: U.S. intercounty migration
in the 1990s: People and income move down the urban hier-
archy.Prof. Geogr., 52, 493–504, doi:10.1111/0033-0124.00241.Marsh, P., andH.Brooks, 2012:Comments on ‘‘Tornado risk analysis:
Is Dixie Alley an extension of Tornado Alley?’’ Bull. Amer.
Meteor. Soc., 93, 405–407, doi:10.1175/BAMS-D-11-00200.1.
Meehl, G., F. Zwiers, J. Evans, T. Knutson, L. Mearns, and
P. Whetton, 2000: Trends in extreme weather and climate
events: Issues related to modeling extremes in projections of
future climate change. Bull. Amer. Meteor. Soc., 81, 427–436,
doi:10.1175/1520-0477(2000)081,0427:TIEWAC.2.3.CO;2.
Merrell, D., K. Simmons, and D. Sutter, 2002: Taking shelter: Esti-
mating the safety benefits of tornado safe rooms. Wea. Fore-
casting, 17, 619–625, doi:10.1175/1520-0434(2002)017,0619:
TSETSB.2.0.CO;2.
Meyer, C., H. Brooks, and M. Kay, 2002: A hazard model for
tornado occurrence in the United States. Preprints, 16th Conf.
on Probability and Statistics, Orlando, FL, Amer. Meteor.
Soc., J3.6. [Available online at https://ams.confex.com/ams/
annual2002/techprogram/paper_27595.htm.]
Millie, M., C. Senkowski, L. Stuart, and F. Davis, 2000: Tornado
disaster in rural Georgia: Triage response, injury patterns,
lessons learned. Amer. Surg., 66, 223–228.
Mohleji, S., and R. Pielke Jr., 2014: Reconciliation of trends in global
and regional economic losses fromweather events: 1980–2008.Nat.
Hazards Rev., 15, doi:10.1061/(ASCE)NH.1527-6996.0000141.
Mooney, C., 1997: Monte Carlo Simulation. Sage Publications,
112 pp.
Morss, R., O. Wilhelmi, G. Meehl, and L. Dilling, 2011: Improving
societal outcomes of extreme weather in a changing climate:
An integrated perspective. Annu. Rev. Environ. Resour., 36,
1–25, doi:10.1146/annurev-environ-060809-100145.
National Academies of Science Engineering and Medicine, 2016:
Attribution of Extreme Weather Events in the Context of Cli-
mate Change. National Academies Press, 186 pp.
Paton, D., and D. Johnston, 2006: Disaster Resilience: An In-
tegrated Approach. Thomas Books, 320 pp.
Paul, B., 2011: Environmental Hazards and Disasters: Contexts,
Perspectives and Management. John Wiley & Sons, 334 pp.
Paulikas, M. J., and W. S. Ashley, 2011: Thunderstorm hazard
vulnerability for the Atlanta, Georgia metropolitan region.
Nat. Hazards, 58, 1077–1092, doi:10.1007/s11069-010-9712-5.
Peterson, T., and Coauthors, 2013: Monitoring and understanding
changes in heat waves, cold waves, floods, and droughts in the
United States: State of knowledge. Bull. Amer. Meteor. Soc.,
94, 821–834, doi:10.1175/BAMS-D-12-00066.1.
Pielke, R., Jr., 2005: Attribution of disaster losses. Science, 310,
1615–1616, doi:10.1126/science.310.5754.1615c.
Preston, B., 2013: Local path dependence of U.S. socioeconomic expo-
sure to climate extremes and the vulnerability commitment.Global
Environ. Change, 23, 719–732, doi:10.1016/j.gloenvcha.2013.02.009.
Prevatt, D., and Coauthors, 2012: Making the case for improved
structural design: Tornadooutbreaks of 2011.LeadershipManage.
Eng., 12, 254–270, doi:10.1061/(ASCE)LM.1943-5630.0000192.
Rae, S., and J. Stefkovich, 2000: The tornado damage risk assess-
ment predicting the impact of a big outbreak in Dallas–Fort
Worth, Texas. Preprints, 20th Conf. on Severe Locals Storms,
Orlando, FL, Amer. Meteor. Soc., 295–296. [Available online
at https://ams.confex.com/ams/Sept2000/techprogram/paper_
16405.htm.]
Robinson, E., R. Trapp, and M. Baldwin, 2013: The geospatial and
temporal distributions of severe thunderstorms from high-
resolution dynamical downscaling. J. Appl. Meteor. Climatol.,
52, 2147–2161, doi:10.1175/JAMC-D-12-0131.1.
Rosencrants, T., and W. Ashley, 2015: Spatiotemporal analysis of
tornado exposure in fiveUSmetropolitan areas.Nat. Hazards,
78, 121–140, doi:10.1007/s11069-015-1704-z.Schaefer, J., D. Kelly, and R. Abbey, 1986: A minimum assumption
tornado-hazard probabilitymodel. J. Appl.Meteor., 25, 1934–1945,
doi:10.1175/1520-0450(1986)025,1934:AMATHP.2.0.CO;2.
Simmons, K., and D. Sutter, 2007: Tornado shelters and the
housing market. Constr. Manage. Econ., 25, 1119–1126,
doi:10.1080/01446190701618299.
——, and——, 2011:Economic and Societal Impacts of Tornadoes.
Amer. Meteor. Soc., 282 pp.
——,——, and R. Pielke, 2013: Normalized tornado damage in the
United States: 1950–2011. Environ. Hazards, 12, 132–147,
doi:10.1080/17477891.2012.738642.
122 WEATHER , CL IMATE , AND SOC IETY VOLUME 9
Page 15
——,——,P.Kovacs, andG.Kopp, 2015:Tornadodamagemitigation:
Benefit–cost analysis of enhanced building codes in Oklahoma.
Wea. Climate Soc., 7, 169–178, doi:10.1175/WCAS-D-14-00032.1.
Smith, B., R. Thompson, J. Grams, C. Broyles, and H. Brooks,
2012: Convective modes for significant severe thunderstorms
in the contiguous United States. Part I: Storm classification
and climatology.Wea. Forecasting, 27, 1114–1135, doi:10.1175/
WAF-D-11-00115.1.
Sorensen, J., 2000: Hazard warning systems: Review of 20 years
of progress. Nat. Hazards Rev., 1, 119–125, doi:10.1061/
(ASCE)1527-6988(2000)1:2(119).
Strader, S., and W. Ashley, 2015: The expanding bull’s eye effect.
Weatherwise, 68, 23–29, doi:10.1080/00431672.2015.1067108.
——,——, A. Irizarry, and S. Hall, 2015: A climatology of tornado
intensity assessments.Meteor. Appl., 22, 513–524, doi:10.1002/met.1482.
——, T. Pingel, and W. Ashley, 2016: A Monte Carlo model for
estimating tornado impacts. Meteor. Appl., 23, 269–281,
doi:10.1002/met.1552.
Theobald, D., 2005: Landscape patterns of exurban growth in the
USA from 1980 to 2020.Ecol. Soc., 10, 32. [Available online at
http://www.ecologyandsociety.org/vol10/iss1/art32.]
Thom, H. C. S., 1963: Tornado probabilities. Mon. Wea. Rev., 91,730–736, doi:10.1175/1520-0493(1963)091,0730:TP.2.3.CO;2.
Tippett,M., J. Allen, V. Gensini, andH. Brooks, 2015: Climate and
hazardous convective weather. Curr. Climate Change Rep., 1,60–73, doi:10.1007/s40641-015-0006-6.
Trapp, R., and K. Hoogewind, 2016: The realization of extreme
tornadic events under future anthropogenic climate change.
J. Climate, 29, 5251–5265, doi:10.1175/JCLI-D-15-0623.1.
——, N. Diffenbaugh, H. Brooks, M. Baldwin, E. Robinson, and
J. Pal, 2007: Changes in severe thunderstorm environment
frequency during the 21st century caused by anthropogeni-
cally enhanced global radiative forcing. Proc. Natl. Acad. Sci.
USA, 104, 19 719–19 723, doi:10.1073/pnas.0705494104.——,E. Robinson,M. Baldwin, N. Diffenbaugh, and B. Schwedler,
2011: Regional climate of hazardous convective weather
through high-resolution dynamical downscaling. Climate
Dyn., 37, 677–688, doi:10.1007/s00382-010-0826-y.Verbout, S., H. Brooks, L. Leslie, and D. Schultz, 2006: Evolution
of theU.S. tornado database: 1954–2003.Wea. Forecasting, 21,
86–93, doi:10.1175/WAF910.1.
Wilson, S., and T. Fischetti, 2010: Coastline population trends in
theUnited States: 1960 to 2008. U.S. Census Bureau P25-1139,
27 pp. [Available online at https://www.census.gov/prod/
2010pubs/p25-1139.pdf.]
Wolford, L. V., 1960: Tornado occurrence in the United States.
U.S. Weather Bureau Tech. Paper 20, 71 pp. [Available from
NOAACentral Library, Second Floor, 1315 East–West Hwy.,
Silver Spring, MD 20910.]
Wurman, J., C. Alexander, P. Robinson, and Y. Richardson, 2007:
Low-level winds in tornadoes and potential catastrophic tornado
impacts in urban areas. Bull. Amer. Meteor. Soc., 88, 31–46,doi:10.1175/BAMS-88-1-31.
APRIL 2017 S TRADER ET AL . 123