Page 1
Observed Synoptic-Scale Variability during the Developing Phaseof an ISO over the Indian Ocean during MISMO
MASAKI KATSUMATA
Research Institute for Global Change, Japan Agency for Marine-Earth Science and Technology, Yokosuka,
Japan, and Department of Atmospheric Science, Colorado State University, Fort Collins, Colorado
RICHARD H. JOHNSON AND PAUL E. CIESIELSKI
Department of Atmospheric Science, Colorado State University, Fort Collins, Colorado
(Manuscript received 4 November 2008, in final form 1 June 2009)
ABSTRACT
A case study of an intraseasonal oscillation (ISO) is investigated in the period leading up to its convectively
active phase during the Mirai Indian Ocean Cruise for the Study of the MJO-Convection Onset (MISMO),
which was conducted during boreal autumn 2006. Detailed observations, including apparent heat and
moisture analyses, reveal that synoptic-scale variability of heat and moisture sources and sinks associated with
the passage of three eastward-propagating cloud systems (EPCSs) was prominent during this period. These
systems with periods of ;6 days propagated through the MISMO domain, priming the atmosphere for
a convectively active phase of the ISO. The prominent shallow heating during this period may explain the
rather slow (8 m s21) propagation speed for EPCSs. The zonal structure and sign of the frictional convergence
show that these EPCSs have common characteristics to the frictional Kelvin mode studied by Ohuchi and
Yamasaki. With the analyses of the period-averaged vertical profiles, the EPCSs were identified as the
principal mechanism to moisten the atmosphere prior to the ISO convectively active phase.
1. Introduction
The Madden–Julian oscillation (MJO; Madden and
Julian 1972) is the one of the most dominant modes of
intraseasonal variability in the tropics. Although numer-
ous studies have examined various aspects of the MJO
(Zhang 2005), fundamental questions still remain as to
the mechanisms for 1) initiating an MJO convectively
active phase (hereafter ‘‘MJO active phase’’) in the
Indian Ocean and 2) its slow propagation speed, espe-
cially in the eastern hemisphere (from the Indian Ocean
to the western Pacific). Both questions have been dis-
cussed with the various hypotheses (e.g., Zhang 2005).
On the other hand, key features of the MJO are its
multiscale convective structure (e.g., Nakazawa 1988)
and the essential role of moist convection (e.g., Hayashi
and Sumi 1986). Although the internal structure of the
MJO has been linked to convectively coupled equatorial
waves (e.g., Masunaga et al. 2006) and to convective
systems (e.g., Chen et al. 1996; Mori 1995), these rela-
tionships and interactions are still uncertain and require
further study if we are to better understand the nature
and characteristics of the MJO.
To understand the complicated internal structure of
the MJO, a detailed dataset is needed to resolve its
components (e.g., convective systems, tropical waves,
and diabatic heating fields that link convection and
waves). Generally such datasets are obtained primarily
with special ground-based observations, although sat-
ellite observations and model reanalyses are becoming
increasingly valuable in this regard as their quality and
quantity continue to increase and improve. In the west-
ern Pacific, the Tropical Ocean Global Atmosphere
Coupled Ocean–Atmosphere Response Experiment
(TOGA COARE; Webster and Lukas 1992) was able to
capture an MJO in its mature stage (Lin and Johnson
1996). However, until recently no ground-based dataset
was available to study the onset stage of the MJO in the
Corresponding author address: Masaki Katsumata, Research
Institute for Global Change, Japan Agency for Marine-Earth Sci-
ence and Technology (JAMSTEC/RIGC), Natsushima-cho 2-15,
Yokosuka 237-0061, Japan.
E-mail: [email protected]
3434 J O U R N A L O F T H E A T M O S P H E R I C S C I E N C E S VOLUME 66
DOI: 10.1175/2009JAS3003.1
� 2009 American Meteorological Society
Page 2
Indian Ocean. In the autumn of 2006, the Mirai Indian
Ocean Cruise for the Study of the MJO-Convection On-
set (MISMO) project was carried out in the central Indian
Ocean (Yoneyama et al. 2008b, hereafter Y08). The
MISMO project successfully captured the onset of the
convectively active phase of the intraseasonal oscillation
(ISO).
Preliminary analyses from MISMO in Y08 suggest
that convective systems with 5–7-day periods gradually
moisten the middle and upper troposphere, and thus
may play a role in preconditioning the atmosphere for
deep convection. The preconditioning prior to the MJO
active phase has been observed in previous studies (e.g.,
Kemball-Cook and Weare 2001), and the accumulation
of the humidity is the process proposed in the MJO
‘‘recharge–discharge’’ theory of Blade and Hartmann
(1993). The roles and mechanisms of the convective
systems in the preconditioning process have been dis-
cussed in previous studies (e.g., Lin and Johnson 1996;
Johnson et al. 1999; Kikuchi and Takayabu 2004) in
which the importance of shallow convection (cumulus
and/or congestus) in moistening the free troposphere
was noted. Although variability in time scales shorter
than intraseasonal (e.g., synoptic-scale disturbances
with time scales of a few to several days) has been re-
ported in previous studies, this has not been their pri-
mary focus. For example, hypotheses on the MJO
initialization over the Indian Ocean typically assume
that the local forcing is ‘‘stochastic’’ (e.g., Yu and Neelin
1994). Recently, Maloney (2009), using a climate model,
has shown that synoptic-scale variability in the western
Pacific was suppressed before the convectively active
phase of the intraseasonal oscillation. This study, as in
previous ones, was focused on observations over the
western Pacific, not over the Indian Ocean where MJO
onset is typically observed.
The ultimate objective of the MISMO project is to
reveal the mechanisms for onset of the MJO con-
vectively active phase in the Indian Ocean. With this
goal in mind, this study uses in situ observations over
the Indian Ocean from MISMO to examine the synoptic-
scale variability of the observed parameters, especially
on the apparent heat and moisture fields in the period
leading up to the ISO convectively active phase. In
section 2, the MISMO analysis domain, observed data-
sets, and analysis methods used in this study are de-
scribed. An overview of the convective activity during
the observation period is presented in section 3. Then,
temporal evolution of various fields over the MISMO
domain is examined in section 4, with a focus on synoptic-
scale variability. Possible mechanisms for these synoptic
disturbances are investigated in section 5. In section 6,
the synoptic-scale variability is related to ISO-scale var-
iability. Summary and concluding remarks are given in
section 7.
2. Data and analysis method
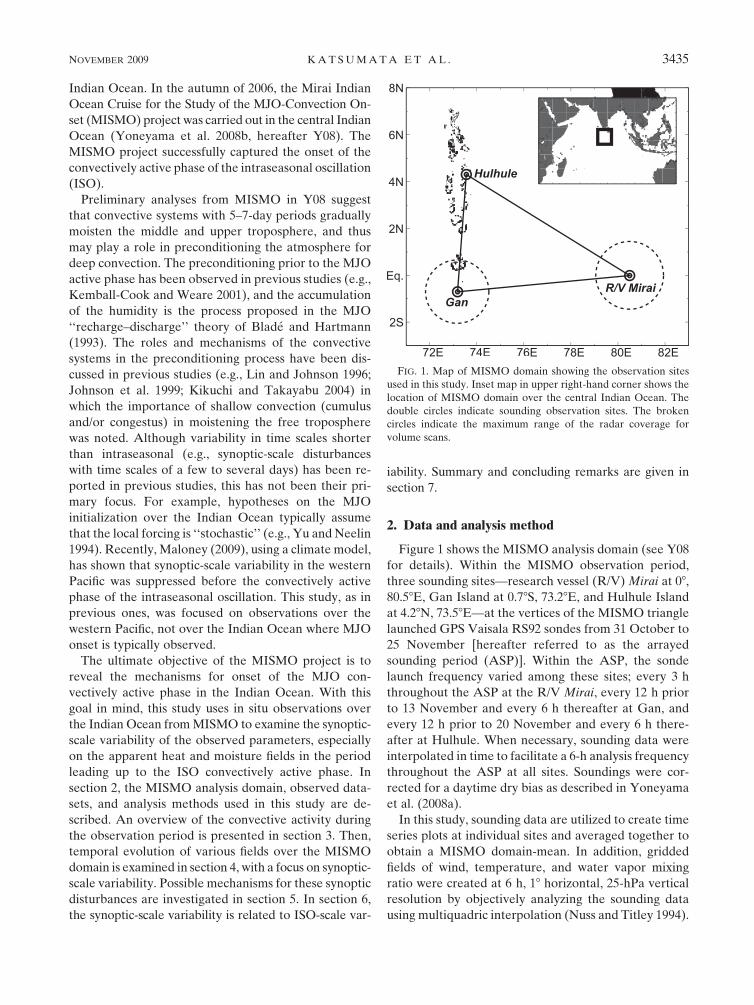
Figure 1 shows the MISMO analysis domain (see Y08
for details). Within the MISMO observation period,
three sounding sites—research vessel (R/V) Mirai at 08,
80.58E, Gan Island at 0.78S, 73.28E, and Hulhule Island
at 4.28N, 73.58E—at the vertices of the MISMO triangle
launched GPS Vaisala RS92 sondes from 31 October to
25 November [hereafter referred to as the arrayed
sounding period (ASP)]. Within the ASP, the sonde
launch frequency varied among these sites; every 3 h
throughout the ASP at the R/V Mirai, every 12 h prior
to 13 November and every 6 h thereafter at Gan, and
every 12 h prior to 20 November and every 6 h there-
after at Hulhule. When necessary, sounding data were
interpolated in time to facilitate a 6-h analysis frequency
throughout the ASP at all sites. Soundings were cor-
rected for a daytime dry bias as described in Yoneyama
et al. (2008a).
In this study, sounding data are utilized to create time
series plots at individual sites and averaged together to
obtain a MISMO domain-mean. In addition, gridded
fields of wind, temperature, and water vapor mixing
ratio were created at 6 h, 18 horizontal, 25-hPa vertical
resolution by objectively analyzing the sounding data
using multiquadric interpolation (Nuss and Titley 1994).
FIG. 1. Map of MISMO domain showing the observation sites
used in this study. Inset map in upper right-hand corner shows the
location of MISMO domain over the central Indian Ocean. The
double circles indicate sounding observation sites. The broken
circles indicate the maximum range of the radar coverage for
volume scans.
NOVEMBER 2009 K A T S U M A T A E T A L . 3435
Page 3
These gridded fields were then used to diagnose di-
vergence and vertical motion and to compute apparent
heating (Q1) and apparent drying (Q2) following Yanai
et al. (1973). In this study, area-averaged Q1 and Q2 are
shown by averaging their gridded values within the
MISMO triangle domain. This method of obtaining Q1
and Q2 is the same as in Johnson and Ciesielski (2000).
Along with the budget analyses, supplemental pa-
rameters are used. Latent (LE) and sensible heat (S)
fluxes from the sea surface are obtained from the Woods
Hole Oceanographic Institution (WHOI) objectively
analyzed the air–sea fluxes (OAFlux) dataset, which is at
18 horizontal resolution (Yu et al. 2008). The dataset is
averaged for the MISMO domain first, then it is adjusted
by the ratio of the observed eddy fluxes at the R/V Mirai
(Takahashi et al. 2005) to the OAFlux at the grid point
closest to the R/V Mirai. The ASP mean adjustment
ratio was 0.80 and 0.73 for latent and sensible heat flux,
respectively. With this procedure, the OAFlux provides
the temporal variation of the fluxes averaged over the
MISMO domain, while their magnitude is adjusted to in
situ observations from the R/V Mirai.
Tropical Rainfall Measuring Mission (TRMM) satellite-
based estimates of radiative heating rate QR were ob-
tained at 0.58 horizontal and 1-km vertical resolution
from a product described in L’Ecuyer and Stephens
(2003). The value is also used by averaging for the
MISMO domain. A column-integrated QR can also be
computed as a budget residual, hQRi 5 hQ1i 2 hQ2i 2
LE 2 S, where the angle brackets represent the vertical
integral over the depth of the troposphere. In a fashion
similar to the surface heat flux adjustment described
above, the TRMM estimate of QR was adjusted to that
of the budget-estimated QR. In this case, the ASP mean
adjustment ratio was 0.86, and the ASP mean values of
hQRi were 20.57 and 20.66 K day21 for the budget
residual and TRMM estimate, respectively. These esti-
mates compare quite favorably to the TOGA COARE
intensive flux array (IFA)–intensive observation period
(IOP) mean hQRi value of 20.55 K day21 (Ciesielski
et al. 2003). Using these TRMM-adjusted estimates of
QR, vertical divergence of the moist static energy (MSE)
is derived as Q1 2 Q2 2 QR 5 2›(v9h9)/›p, where
2›(v9h9)/›p represents the vertical convergence of MSE
due to unresolved vertical eddies as in Yanai et al. (1973).
Two radars, a C band on the R/V Mirai and an X band
at Gan Island were operated to obtain volume scans
every 10 min throughout the IOP. The reflectivity data
are corrected as discussed in Katsumata et al. (2008a).
To facilitate their use in various statistical analyses, the
radar data are converted to a Cartesian coordinate with
a resolution of 1 and 0.5 km in horizontal and vertical,
respectively. Convective/stratiform flagging for each ver-
tical column is determined by the method of Yuter et al.
(2005) with classification parameters tuned accordingly
for the radars used in MISMO.
Satellite-derived data are also used. Brightness tem-
perature data from the infrared channel (IR-TB) was
obtained from Meteosat-5. These data covered the entire
equatorial Indian Ocean during the MISMO IOP. Data
from the Quick Scatterometer (QuikSCAT) satellite,
produced by Remote Sensing Systems (http://www.remss.
com), are used to derive surface wind analyses over the
oceans.
3. Overview of convection during the arrayedsounding period
Whereas Y08 describes the temporal evolution of
various fields during the MISMO IOP, the Hovmoller
diagram of IR-TB and the averaged IR-TB over MISMO
triangle, shown in Fig. 2, present an overview of convec-
tive activity during the ASP. Convection gradually in-
creased over the MISMO domain through mid-November
at which time convection became more intense and
widespread. The lowest IR-TB over the MISMO domain
occurred around 19 November (18 November in 5-day
running mean; 20 November in 1-day running mean).
Convection after 16 November was identified as an MJO
active phase by the method of Wheeler and Weickmann
(2001) using filtered outgoing longwave radiation (OLR),
as in Fig. 5 of Y08. Since the convection did not propa-
gate across the Maritime Continent to the western Pa-
cific, this event could be regarded as an aborted MJO. In
this study, however, we will simply refer to this con-
vective event as an ISO and investigate the period
leading up to its active phase, focusing on the synoptic-
scale variability and its contribution to the initialization
process of the ISO-scale active convection.
4. Synoptic-scale variability prior to active period
a. Evidence from Y08
Using data primarily from the R/V Mirai, Y08 de-
scribed significant variability on a 5–7-day time scale,
which was suggested to play an important role in pre-
conditioning the environment for deep convection. As
shown in Y08, evidence for this synoptic-scale vari-
ability was found in 1) modulation of the SST diurnal
cycle; 2) the number of congesti; 3) breaks in the mid-
to upper-tropospheric divergence peak, the level of which
continuously rose leading up to the convectively active
period; and 4) the appearance of the widespread con-
vective rain. On the other hand, the corresponding cloud
activities are not determined in Y08 using OLR and
wavenumber-frequency filter by the method of Wheeler
and Weickmann (2001), as shown in Fig. 5 of Y08.
3436 J O U R N A L O F T H E A T M O S P H E R I C S C I E N C E S VOLUME 66
Page 4
b. Clouds and precipitation
In the present study, the Hovmoller diagram of the
hourly IR-TB data from Meteosat-5 (Fig. 2) can be used
to help identify the disturbances that resulted in the
synoptic-scale variability found in Y08. For example,
there are many short-lived westward-propagating cloud
packets that lasted only one day or so. Closer inspection
reveals that the location of the appearance of these
packets propagated eastward and passed over the MISMO
domain. Y08 stated that widespread convective rain ac-
companied this eastward-propagating signal. These cloud
systems are more readily seen when the strong negative
anomaly (,10 K) of the eastward-propagating component
is highlighted, as shown by the contours in Fig. 2. These
eastward-propagating cloud systems (EPCSs) prop-
agate with the speed of about 8 m s21. The speed and
period (5–7 days) of the EPCS are slightly outside the
range of the moist Kelvin wave used in the method of
Wheeler and Weickmann (2001); thus, Fig. 5 of Y08 did
not capture the EPCSs.
The EPCSs passed over the MISMO domain on 3, 9,
and 16 November. Although Y08 did not mention the
first one on 3 November (hereafter EPCS1), the con-
toured signal propagated eastward over Gan Island
(73.28E) but did not reach the R/V Mirai (80.58E).
The radar echo area around Gan Island (Fig. 3) indicates
enhanced convective activity with all EPCSs, including
EPCS1. This clearly shows that the EPCSs are more than
just regions of enhanced cloudiness, but in fact contain
precipitating convective clouds, even in EPCS1, which
dissipated between Gan Island and R/V Mirai.
FIG. 2. (left) Hovmoller diagram of the IR-TB averaged from 58S to 58N. The vertical solid
lines indicate the longitudinal position of Gan Island (73.28E) and R/V Mirai (80.58E) for the
analyses period. The contours are 210-K anomaly of eastward-propagating component (i.e.,
wavenumber .0) of the IR-TB for all frequency range. (right) The IR-TB averaged for over the
MISMO triangle in Fig. 1. The solid and broken lines indicate the 5- and 1-day running means,
respectively. The horizontal broken lines indicate the times when the EPCSs passed over the
center of the MISMO triangle.
NOVEMBER 2009 K A T S U M A T A E T A L . 3437
Page 5
c. Moisture and heat variability
The time–height plot of moist static energy (MSE)
averaged over the MISMO domain is shown in Fig. 4b;
here MSE 5 cpT 1 gz 1 Lyr, where cp is the specific heat
of air, T is temperature, Ly is the latent heat of con-
densation, z is geopotential height, g is the gravitational
constant, and r is the water vapor mixing ratio. The
vertical growth of the high MSE layer leading up to the
convectively active phase is readily seen. A close inspec-
tion of this plot shows that the vertical growth of the
high MSE layer occurs in stepwise fashion. The days
with significant vertical deepening of MSE are 3, 9, and
16 November, that is, coincident with EPCSs passing
over the MISMO domain.
The effect of convection on the structure of MSE is
shown by 2›(v9h9)/›p in Fig. 5c. With the passage of each
EPCSs, a couplet of 2›(v9h9)/›p appears with large
lower-tropospheric (below 4-km height) divergence and
large middle- and upper-tropospheric convergence. This
vertical couplet suggests a significant vertical transport of
MSE from the lower troposphere to the middle and upper
troposphere by convection associated with the EPCSs.
Since variations in MSE are strongly tied to changes in
the moisture field (see definition of MSE above), one
interpretation of these results is that convection associ-
ated with the synoptic-scale disturbances, especially
EPCSs, is responsible for the moistening of the middle
and upper troposphere leading up to the convectively
active phase. On the other hand, large values of Q2, ap-
parent drying, are observed with the passage of each
EPCS. The precipitable water (Fig. 4a) also decreased
after the passing of EPCSs. These observed facts are not
contradicted because the MSE in the lower troposphere
FIG. 3. Time series of the radar echo area for total, convective, and stratiform precipitation
observed at Gan XDR, given as ratio of coverage to the observed horizontal area. The vertical
broken lines are the same as in Fig. 2 to show the time when EPCSs passed.
FIG. 4. (a) Time series of precipitable water and (b) time–height cross section of the moist
static energy. Both are obtained by averaging three sounding sites. The value in (b) is displayed
as the anomaly from the average for the ASP at each height. The vertical broken lines are the
same as in Fig. 3.
3438 J O U R N A L O F T H E A T M O S P H E R I C S C I E N C E S VOLUME 66
Page 6
decreased after the passing of the EPCSs, as seen in Fig. 4b.
These indicate that the EPCSs work to transport the water
vapor from the lower troposphere to the middle and up-
per troposphere to extend the moist layer, while the total
amount of the water vapor decreases as precipitation.
Finally, we note that the synoptic-scale variation of Q1,
Q2, and 2›(v9h9)/›p (Fig. 5) is more significant in the first
half of the ASP than the second half, though convection
was more intense and widespread in the second half,
as shown in Fig. 2. Temporal variations of precipitation
computed as a Q2 budget residual compare well to es-
timates from rain gauges and satellites prior to the con-
vectively active period, but show less agreement thereafter
(Katsumata et al. 2008b). This suggests that the distur-
bances prior to the convectively active phase were well
captured by the MISMO sounding array, but poorly re-
solved by the sounding network during the active phase.
5. Possible mechanisms for synoptic-scale variability
a. Propagation speed and ambient winds
Figure 2 indicates that the EPCS propagated eastward
with the speed of about 8 m s21. This speed is compa-
rable to that of typical environmental winds in the tropics,
or gust front/gravity currents that are typical propagation
mechanisms for convective systems. To examine whether
the EPCSs motion was determined by advective effects,
Fig. 6 shows the zonal wind profile averaged over the
MISMO triangle using data from the three sounding sites.
This plot clearly shows that the deep-layer wind was
easterly (westward) in both the mean (Fig. 6b) and during
the passage of the EPCSs (Fig. 6a). Therefore, advection
cannot explain the motion of the EPCSs, which is east-
ward at ;8 m s21. Furthermore, given the easterly flow
impeding the eastward progression of the relatively weak
cold pools in this region, it is unlikely that gravity current
dynamics can account for the eastward speed of motion.
Thus, it is concluded that nonadvective effects—that is,
wave dynamics—should be considered as a plausible
propagation mechanism for these signals.
b. Vertical structure and periodicity
With a propagation speed of 8 m s21 and a 6-day
period, the characteristics of the EPCSs are slightly
outside the normal range of the generally observed
characteristics of the Kelvin wave described in Wheeler
FIG. 5. Time height cross section of (a) Q1, (b) Q2, and (c) 2›(v9h9)/›p. The vertical broken
lines are the same as in Fig. 3.
NOVEMBER 2009 K A T S U M A T A E T A L . 3439
Page 7
and Kiladis (1999). On the other hand, if one considers
all convective events in the preactive period (EPCS and
intermediate convection; see Figs. 2 and 5), then the
period could be regarded as 3 days, which accurately
describes a Kelvin wave with the equivalent depth of
about 25 m [which appears frequently in OLR as in
Wheeler and Kiladis (1999)]. To investigate whether
Kelvin wave dynamics can be applied to the present
case, the vertical structure of the atmosphere is exam-
ined. To isolate EPCSs with 3–6-day periods, the ra-
diosonde data are bandpass filtered to extract 1–8-day
variability. Figure 7 shows this analysis using Gan Island
data, since the EPCS signal is somewhat degraded at the
R/V Mirai as described in the previous section.
Comparing the time–height cross sections to that
of the composite analyses of a moist Kelvin wave in
the eastern Pacific by Straub and Kiladis (2003b), we
can find some similarities, especially in moisture and
temperature anomalies. As discussed in the previous
section, the moist region extends upward during the
passage of the EPCS. The temperature anomaly shows
a characteristic ‘‘boomerang’’-like structure with a warm
anomaly below about 5 km and above 13 km prior to
EPCS passage, with warm anomalies between 5 and
13 km during passage. Although the overall vertical
structure of the zonal wind is unclear, the phase re-
lationship between the temperature and zonal wind
anomalies around the tropopause (Fig. 7c for time–
height cross section, or Fig. 7d for time series at 16-km
height) indicates that the westerly peak occurs between
the positive and negative peaks of the temperature
anomaly. This quadrature relationship agrees well with
the theoretical structure of a linear equatorial Kelvin
wave that propagates vertically.
We note that in this filtered view, the 6-day variation
dominates, while the 3-day variation is difficult to see.
Considering that the 6-day variation is more prominent
in the OLR Hovmoller diagram (Fig. 2), in the heat and
moisture budgets (Fig. 5), and the quadrature relation-
ship between temperature and wind at the tropopause,
the significant convection in the 6-day cycle is the pri-
mary mechanism to create the wave response, even
though the 3-day cycle matches better to the frequently
observed moist Kelvin wave (e.g., Takayabu 1994;
Wheeler and Kiladis 1999). This suggests that the pri-
mary equivalent depth in the present case is shallower
than that of the frequently observed moist Kelvin wave.
In other words, shallower displacement might be im-
portant to make the 6-day cycle more significant than
the 3-day cycle.
c. Heating profile
As described in the previous subsection, the EPCS
characteristics do not match those of Kelvin waves
reported in previous observationally based studies. The
theoretical study by Ohuchi and Yamasaki (1997), how-
ever, showed that including the effects of surface friction
in the moist Kelvin wave produces a slower propagation
speed (less than 10 m s21), with slightly preceding mod-
erate heating in the lower troposphere.
Gravity wave dynamics are another possibility for the
propagation mechanism of the EPCSs. Various studies
have shown that simplified convective- and stratiform-
type vertical heating profiles are a source of gravity
waves with much faster speeds than that of the EPCSs
(e.g., Nicholls et al. 1991; Mapes and Houze 1995).
On the other hand, recent numerical simulations by
Tulich et al. (2007) and Tulich and Mapes (2008) found
the existence of the very slow gravity waves with speeds
of 11–12 and 7–8 m s21 (‘‘ultraslow’’ and ‘‘gust front
wave’’ in their papers, respectively) that were emitted
from shallow, or high vertical wavenumber, heating
sources. These later studies are examples of including
‘‘shallow heating’’ effects.
FIG. 6. Zonal wind averaged from three sounding points in MISMO triangle, in the form of
(a) time–height cross section and (b) temporal average for entire period (solid) with a standard
deviation (dotted). The height scale for both plots is to the left of (a). Vertical broken lines in
(a) are the same as in Fig. 3.
3440 J O U R N A L O F T H E A T M O S P H E R I C S C I E N C E S VOLUME 66
Page 8
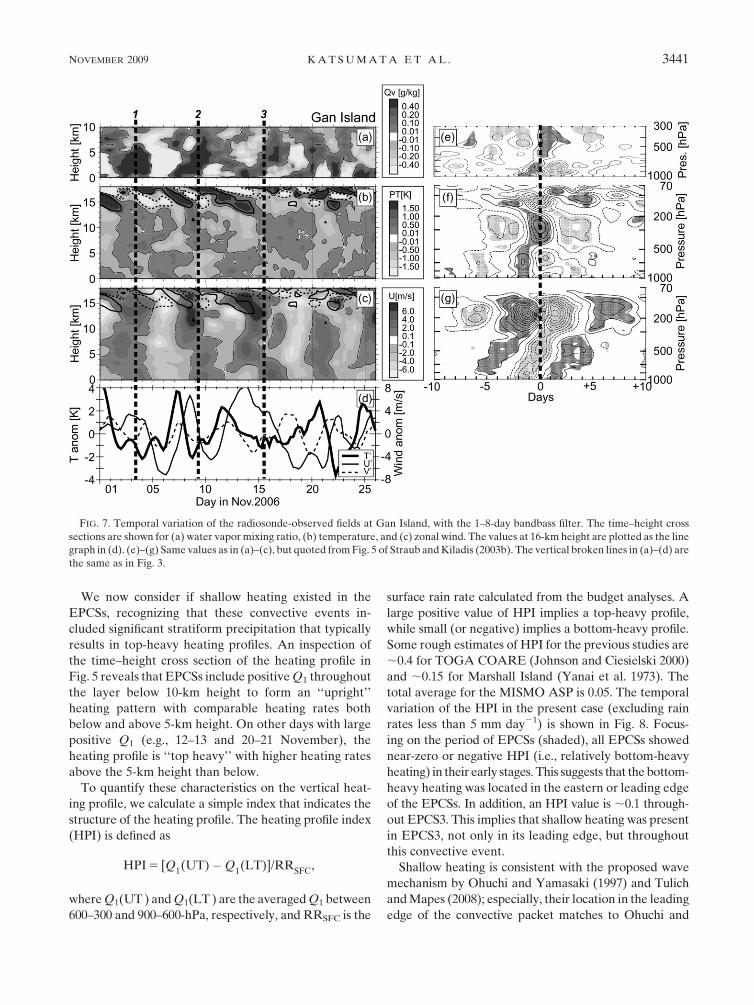
We now consider if shallow heating existed in the
EPCSs, recognizing that these convective events in-
cluded significant stratiform precipitation that typically
results in top-heavy heating profiles. An inspection of
the time–height cross section of the heating profile in
Fig. 5 reveals that EPCSs include positive Q1 throughout
the layer below 10-km height to form an ‘‘upright’’
heating pattern with comparable heating rates both
below and above 5-km height. On other days with large
positive Q1 (e.g., 12–13 and 20–21 November), the
heating profile is ‘‘top heavy’’ with higher heating rates
above the 5-km height than below.
To quantify these characteristics on the vertical heat-
ing profile, we calculate a simple index that indicates the
structure of the heating profile. The heating profile index
(HPI) is defined as
HPI 5 [Q1(UT)�Q
1(LT)]/RR
SFC,
where Q1(UT ) and Q1(LT ) are the averaged Q1 between
600–300 and 900–600-hPa, respectively, and RRSFC is the
surface rain rate calculated from the budget analyses. A
large positive value of HPI implies a top-heavy profile,
while small (or negative) implies a bottom-heavy profile.
Some rough estimates of HPI for the previous studies are
;0.4 for TOGA COARE (Johnson and Ciesielski 2000)
and ;0.15 for Marshall Island (Yanai et al. 1973). The
total average for the MISMO ASP is 0.05. The temporal
variation of the HPI in the present case (excluding rain
rates less than 5 mm day21) is shown in Fig. 8. Focus-
ing on the period of EPCSs (shaded), all EPCSs showed
near-zero or negative HPI (i.e., relatively bottom-heavy
heating) in their early stages. This suggests that the bottom-
heavy heating was located in the eastern or leading edge
of the EPCSs. In addition, an HPI value is ;0.1 through-
out EPCS3. This implies that shallow heating was present
in EPCS3, not only in its leading edge, but throughout
this convective event.
Shallow heating is consistent with the proposed wave
mechanism by Ohuchi and Yamasaki (1997) and Tulich
and Mapes (2008); especially, their location in the leading
edge of the convective packet matches to Ohuchi and
FIG. 7. Temporal variation of the radiosonde-observed fields at Gan Island, with the 1–8-day bandbass filter. The time–height cross
sections are shown for (a) water vapor mixing ratio, (b) temperature, and (c) zonal wind. The values at 16-km height are plotted as the line
graph in (d). (e)–(g) Same values as in (a)–(c), but quoted from Fig. 5 of Straub and Kiladis (2003b). The vertical broken lines in (a)–(d) are
the same as in Fig. 3.
NOVEMBER 2009 K A T S U M A T A E T A L . 3441
Page 9
Yamasaki (1997). In addition, we note that the abundance
of the shallow- and stratiform-type convection and heat-
ing is also compatible with the ‘‘shallow-CISK’’ (condi-
tional instability of the second kind) mechanism (Wu
2003), which could provide the moisture needed to
sustain convection in the EPCS packet.
The corresponding convection can be seen in radar
data. The frequency distribution of echo-top height at
Gan XDR (Fig. 9) indicates that, during EPCS events,
echo tops were more common below 5 km than on other
days. The high frequency below 5 km could be regarded
as a large population of shallow convective clouds (e.g.,
cumulus and congestus) (Johnson et al. 1999), whereas
the peak at 5 km could be also caused by reasons other
than congestus (e.g., bright band and melting effects).
An example of the shallow, eastward-propagating
convection at the leading edge of the EPCSs is shown in
Fig. 10 for the EPCS1. While each precipitating line
developed and dissipated without significant movement,
the new lines developed to the east of the previous ones.
For the other EPCSs, eastward-moving radar echo lines
could be identified with speeds less than that of EPCSs,
while the altering of the line is unclear. These radar echo
images suggest that 1) the shallow convection existed
especially in the leading edge of the EPCSs, and 2) the
EPCS and/or leading shallow convection propagate with
the wave dynamics, not by advection.
Shallow heating was also present in the convective
packets in between the EPCSs, although the shallow
heating source or absolute amount of the heating
was smaller than in the EPCSs. If the convection in
between the EPCSs was also associated with an eastward-
propagating signal, the driving mechanism could be same
as the EPCSs.
d. Frictional convergence
Frictional convergence has been shown as a mecha-
nism to foster moist Kelvin waves. (e.g., Wang and Rui
1990). In particular, the theoretical work by Ohuchi and
Yamasaki (1997) found that slow (,10 m s21) moist
Kelvin waves could result from frictional convergence.
To examine this mechanism, Fig. 11d shows the time
series of the surface divergence decomposed into its
zonal (›u/›x) and meridional (›y/›y) components on
and around the MISMO domain. Preceding each EPCS,
surface convergence increases, dominated by changes in
the meridional component. This suggests that frictional
convergence ahead of each EPCS leads to a favorable
thermodynamic environment for the EPCS. This rela-
tionship between increasing meridional convergence
and decreasing convective inhibition (CIN) is observed
even in the convectively active period (i.e., after mid-
November).
The relationship between CIN and the convective
parameters LCL and LFC can be seen by examining
Figs. 11b and 11c. This comparison shows that changes
in CIN are better correlated to those in the LFC than the
LCL. This would indicate that the cooling (warming) of
the environmental profiles contribute more to decreased
(increased) CIN than the moistening and heating (drying
FIG. 8. The temporal variation of the value HPI. The shaded
period is 3 days centered at the time when EPCS passed, as the
vertical broken lines in Fig. 3. The HPI values are plotted only for
the days with the surface rainfall larger than 5 mm day21.
FIG. 9. Time–height cross sections of the area of the 10-dBZ echo-top height observed at Gan
XDR, expressed as ratio of coverage to the observed horizontal area. The vertical broken lines
are the same as in Fig. 3.
3442 J O U R N A L O F T H E A T M O S P H E R I C S C I E N C E S VOLUME 66
Page 10
and cooling) of the lifted parcel (i.e., the air in the lower
boundary layer). This further suggests that frictional
convergence in the present case is more effective in the
process of lifting the environmental air to decrease its
temperature than the moistening and/or heating of the
boundary layer.
e. Discussion
The above results indicate that the EPCSs 1) propagate
and are not due to advective processes; 2) resemble the
structure of vertically propagating Kelvin waves; 3) have
shallow heating and convection, especially in the leading
part of the convection packet; and 4) have frictional con-
vergence ahead of the convection packet. These charac-
teristics correspond to those of the frictional Kelvin mode
in Ohuchi and Yamasaki (1997). Although their study
relates the frictional Kelvin mode to the super cloud
cluster (SCC) within the convectively active phase of the
MJO, the resemblance of their study to the present case
implies that this mode is important also in the period
leading up to the convectively active phase. The appear-
ance of the moist Kelvin wave prior to the ISO con-
vectively active phase was similar to that in Straub and
Kiladis (2003a), while the propagation speed differs from
theirs. On the other hand, the gravity wave response to
shallow heating, as in Tulich and Mapes (2008), could be
also the driving mechanism of the EPCSs if we regard
the deep convection and Kelvin wave structure in the
EPCSs as a response to the shallow convection.
The convective signals in between the EPCSs are
weaker but are also an important source of synoptic-
scale variability. Like the EPCS, these signals contain
shallow convection and propagate eastward at a similar
speed. If both these signals are considered as a single
wave type, a 3-day cycle with 8 m s21 propagation speed
corresponds well to a Kelvin wave observed ubiqui-
tously over the globe (e.g., 17-m equivalent depth in
Takayabu 1994; 25 m in Wheeler and Kiladis 1999).
However, only the EPCSs with the 6-day cycle have the
clear signal of the shallow convection, Kelvin wave-type
atmospheric response, and frictional convergence. This
also implies that the convective signal in between the
EPCSs is caused by the different mechanism from the
EPCSs. One possibility is the relationship of these con-
vective signals to westward-propagating disturbances.
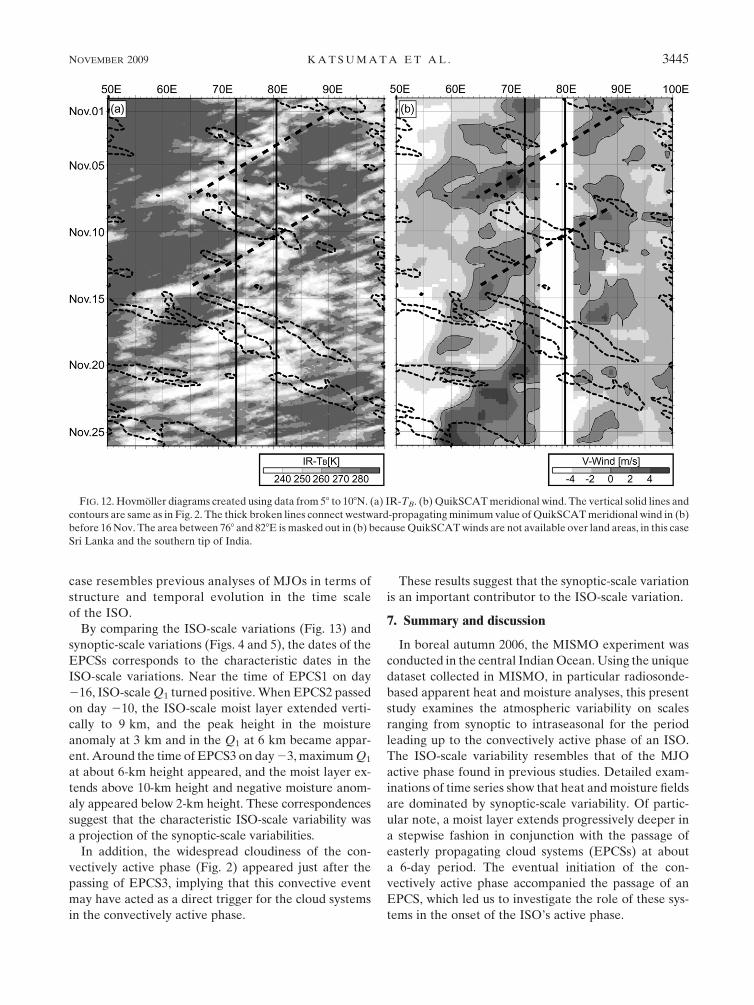
Figure 12 shows that both the signals on 6 and 12 No-
vember appeared when the Northern Hemisphere side
(58–108N) is cloudy, with southerly surface winds, and
convergent to the north of the MISMO domain. The
asymmetry of the convergence along equator, meridio-
nal wind, and their periodicity agrees well with that of
the mixed Rossby–gravity wave, while the propagation
speed is quite slow compared to that found in previous
FIG. 10. Plan position indicator images of the Gan XDR at
the elevation of 1.88, at every 90 min from 2200 UTC 2 Nov to
0200 UTC 3 Nov. The broken envelopes labeled ‘‘A’’ to ‘‘D’’ in-
dicate the lined radar echoes. The shaded area to the southwest
indicates unobservable ‘‘shadow’’ area.
NOVEMBER 2009 K A T S U M A T A E T A L . 3443
Page 11
studies (e.g., Hendon and Liebmann 1991). Further
study is needed to clarify the mechanism for the con-
vective signals that appear between the EPCSs.
6. ISO-scale variability
As discussed in Y08, some controversy exists as to
whether the observed convectively active phase in the
MISMO IOP is in fact an MJO. On the other hand,
the synoptic-scale variance is enhanced leading up to
the convectively active phase. To examine the evolution
of the observed variance on the ISO time scale, the
temporal evolutions of the observed parameters are
displayed with a 5-day running mean, which has typically
been used in previous studies to examine intraseasonal
variation. Here we discuss the temporal variations in
days relative to the minimum IR-TB (19 November),
similar to previous MJO studies that identify the convec-
tive peak with minimum OLR (e.g., Kiladis et al. 2005).
In the MISMO ASP, the moisture anomaly (Fig. 13a)
becomes positive above the boundary layer after day 210.
It gradually deepens to the upper troposphere toward
day 0, with a large positive anomaly around 3-km height.
Around day 0, the positive moisture anomaly reaches its
peak around 6 km with a weak dry anomaly in the lower
troposphere. This temporal evolution is quite similar to
that observed in previous MJO studies (e.g., Kemball-
Cook and Weare 2001).
A similar pattern is seen also in the Q1 time series
(Fig. 11b). The heating becomes positive about day
215 at about 2-km height. The maximum heating
around 6–7 km appears around day 210. The maxi-
mum heating appears from day 25 to day 0 and
weakens thereafter with a slight cooling in the lower
troposphere. This time scale and temporal evolution
of heating are consistent with those found in the
previous MJO studies (e.g., Lin et al. 2004; Kiladis
et al. 2005). These results indicate that the present
FIG. 11. Temporal variation of the (a) CIN, (b) LCL (thin) and LFC (thick), and (c)
QuikSCAT-observed total and decomposed surface divergence. The values in (a) and (b) are
averaged for three soundings in the MISMO array. The thin line in (a) is with 8-day running
mean, while the thick line is with 2–8-day bandpass filter; (b) is applied 2-day running mean; (c)
is averaged for 108 3 108 box centered at 08, 758E and 2-day running mean. The period of
decreasing CIN is shaded.
3444 J O U R N A L O F T H E A T M O S P H E R I C S C I E N C E S VOLUME 66
Page 12
case resembles previous analyses of MJOs in terms of
structure and temporal evolution in the time scale
of the ISO.
By comparing the ISO-scale variations (Fig. 13) and
synoptic-scale variations (Figs. 4 and 5), the dates of the
EPCSs corresponds to the characteristic dates in the
ISO-scale variations. Near the time of EPCS1 on day
216, ISO-scale Q1 turned positive. When EPCS2 passed
on day 210, the ISO-scale moist layer extended verti-
cally to 9 km, and the peak height in the moisture
anomaly at 3 km and in the Q1 at 6 km became appar-
ent. Around the time of EPCS3 on day 23, maximum Q1
at about 6-km height appeared, and the moist layer ex-
tends above 10-km height and negative moisture anom-
aly appeared below 2-km height. These correspondences
suggest that the characteristic ISO-scale variability was
a projection of the synoptic-scale variabilities.
In addition, the widespread cloudiness of the con-
vectively active phase (Fig. 2) appeared just after the
passing of EPCS3, implying that this convective event
may have acted as a direct trigger for the cloud systems
in the convectively active phase.
These results suggest that the synoptic-scale variation
is an important contributor to the ISO-scale variation.
7. Summary and discussion
In boreal autumn 2006, the MISMO experiment was
conducted in the central Indian Ocean. Using the unique
dataset collected in MISMO, in particular radiosonde-
based apparent heat and moisture analyses, this present
study examines the atmospheric variability on scales
ranging from synoptic to intraseasonal for the period
leading up to the convectively active phase of an ISO.
The ISO-scale variability resembles that of the MJO
active phase found in previous studies. Detailed exam-
inations of time series show that heat and moisture fields
are dominated by synoptic-scale variability. Of partic-
ular note, a moist layer extends progressively deeper in
a stepwise fashion in conjunction with the passage of
easterly propagating cloud systems (EPCSs) at about
a 6-day period. The eventual initiation of the con-
vectively active phase accompanied the passage of an
EPCS, which led us to investigate the role of these sys-
tems in the onset of the ISO’s active phase.
FIG. 12. Hovmoller diagrams created using data from 58 to 108N. (a) IR-TB. (b) QuikSCAT meridional wind. The vertical solid lines and
contours are same as in Fig. 2. The thick broken lines connect westward-propagating minimum value of QuikSCAT meridional wind in (b)
before 16 Nov. The area between 768 and 828E is masked out in (b) because QuikSCAT winds are not available over land areas, in this case
Sri Lanka and the southern tip of India.
NOVEMBER 2009 K A T S U M A T A E T A L . 3445
Page 13
This study has revealed several important aspects of
the EPCSs. The EPCSs had a similar structure to that of
moist Kelvin waves found in previous studies. From the
analysis of radar data and Q1, it would appear that the
EPCSs contain abundant shallow precipitation and as-
sociated heating, which would project on high vertical
wavenumber modes and possibly explain their slow pro-
pagation speed (;8 m s21). The analysis also showed
a decreasing CIN makes the possible favorable environ-
ment for convection prior to the EPCS events. Frictional
convergence from Kelvin waves could be effective at
decreasing CIN.
This study focused on the heat and moisture variability
and its processes, especially related to the synoptic-scale
disturbances in the period prior to the onset of the
ISO convectively active phase. The role of the EPCSs in
this preonset is to deepen the moisture layer. A similar
vertical growth of the moist layer was observed in the
previous studies as the ‘‘preconditioning’’ for the MJO
active phase (e.g., Lin and Johnson 1996; Johnson et al.
1999; Kemball-Cook and Weare 2001; Kikuchi and
Takayabu 2004). These earlier studies emphasized the
importance of the shallow convection (cumulus and
congestus) as a vertical transporter of water vapor. In
the present case, the abundance of shallow convection,
especially before the EPCSs—which was shown in Y08
(Fig. 7 in their paper)—implies that shallow convection
also directly acted to moisten the free atmosphere. The
present study, however, emphasizes an alternate role for
shallow convection—the driving force for the EPCSs,
which in turn, transport water vapor. As a result, the
shallow convection indirectly acted to moisten the tro-
posphere. With this new role of shallow convection pro-
posed in this study, we emphasize the importance of the
shallow convection on the onset process of the ISO’s
convectively active phase.
Yet another important role of the EPCSs is the frictional
convergence ahead of the EPCS itself. Previous studies
(e.g., Maloney and Hartmann 1998; Kemball-Cook and
Weare 2001; Seo and Kim 2003) have shown the existence
of moisture convergence preceding the MJO active phase,
with frictional convergence its primary source. Although
these studies focused on the scale of ISO, the present study
implies the frictional convergence also works in the syn-
optic scale as in individual EPCSs. The frictional conver-
gence could also be the accumulator of the moist static
energy in the lower troposphere ahead of the EPCSs.
Finally, we discuss the temporal evolution of the envi-
ronment leading to the ISO convectively active phase. The
deepest moisture was present in the last half of November
FIG. 13. Temporal variation of observed fields averaged over the MISMO triangle in Fig. 1,
for (a) IR-TB (same as in Fig. 2). (b) Time–height cross section Q1, and (c) time–height cross
section of moist static energy. A 5-day running mean is applied to (b) and (c).
3446 J O U R N A L O F T H E A T M O S P H E R I C S C I E N C E S VOLUME 66
Page 14
(see Fig. 4b). In this moisture-rich environment, the third
and final EPCS of this period persisted longer and
propagated farther east (Fig. 2), consisting of more de-
veloped convection (with a higher stratiform fraction;
Fig. 3) and a larger Q1, Q2, and 2›(v9h9)/›p (Fig. 5).
It would appear that the increased moisture allowed
for greater development and organization and, thus,
a longer-lived coupled wave. Conversely, the humidity
in the middle and upper troposphere increased with each
EPCS passage. These results suggest that the EPCSs and
environmental conditions interacted in a favorable way,
which led to the ISO convectively active phase. If the
present case can be viewed as the initialization of the
MJO, then this concept supports the recharge–discharge
mechanism for MJO initiation (e.g., Blade and Hartmann
1993; Hu and Randall 1994). However, the effects of the
EPCSs suggest that the local forcing by the convection is
organized on the synoptic scale rather than stochastically.
The results of the present case study prompt additional
questions that require further analyses. For example, the
behavior of the convective systems within the synoptic
disturbances should be investigated to reveal their de-
tailed nature. The precise mechanism that connects the
shallow convection to drive the EPCSs should be exam-
ined further. The prominence of the 6-day cycle of the
EPCSs over the 3-day cycle or signal in between EPCSs is
also of interest. Although the present study focused on
the local processes in the Indian Ocean, factors from
outside the Indian Ocean that affect the ISO-scale vari-
ability (e.g., Hendon 1988; Hsu et al. 1990; Kikuchi and
Takayabu 2003) should be also examined. Because this
paper presents a case study of a single ISO captured
during MISMO, it is also important to understand to what
degree the results presented here can be generalized to
other ISO cases, including the MJO.
Recent success in reproducing the MJO with high-
resolution global circulation models (e.g., Miura et al.
2007) and increasing observations with the latest satel-
lite and buoy data [e.g., A-Train, Global Precipitation
Measurement (GPM), and Research Moored Array for
African–Asian–Australian Monsoon Analysis and Pre-
diction (RAMA; McPhaden et al. 2009)] will certainly
contribute to further understanding of the ISO, includ-
ing the MJO onset in the Indian Ocean. On the other
hand, ground-based observations are still required to re-
veal the detailed processes in other events. Well-designed
sounding networks are especially useful for accurate
analysis of the heating fields, which must be obtained
if our understanding of the ISO is to be advanced. At
present, detailed temporal variations in atmospheric
fields can best be obtained with these ground-based
sounding networks. Ground-based scanning radars are
still the most useful tool to obtain the details of con-
vective systems. Additional field campaigns over the
Indian Ocean with ground-based sounding and radar
networks, enhanced beyond the configuration used in
MISMO, are still needed to help unravel the complex
interactions between waves and convection in this re-
gion, and their relationship to MJO onset.
Acknowledgments. The authors thank Drs. H. Miura,
E. Maloney, K. Yasunaga, K. Yoneyama, H. Yamada,
J. Suzuki, H. H. Hendon, and an anonymous reviewer
for their comments and suggestions to improve this man-
uscript. All participants of the MISMO project are ac-
knowledged for their effort in obtaining the high-quality
dataset. Dr. T. L’Ecuyer provided the QR dataset.
Dr. K. Yasunaga helped a part of the analyses. The data
of Meteosat-5 is provided by EUMETSAT. Partial sup-
port for this research comes from the JEPP-HARIMAU
project, and from the Joint Research Program of the In-
stitute of Low Temperature Science, Hokkaido Univer-
sity. Richard Johnson and Paul Ciesielski were supported
under NASA Grant NNX07AD35G.
REFERENCES
Blade, I., and D. L. Hartmann, 1993: Tropical intraseasonal oscilla-
tions in a simple nonlinear model. J. Atmos. Sci., 50, 2922–2939.
Chen, S. S., R. A. Houze Jr., and B. E. Mapes, 1996: Multiscale
variability of deep convection in relation to large-scale circu-
lation in TOGA COARE. J. Atmos. Sci., 53, 1380–1409.
Ciesielski, P. E., R. H. Johnson, P. T. Haertel, and J. Wang, 2003:
Corrected TOGA COARE sounding humidity data: Impact
on diagnosed properties of convection and climate over the
warm pool. J. Climate, 16, 2370–2384.
Hayashi, Y.-Y., and A. Sumi, 1986: The 30-40 day oscillations simulated
in an ‘‘aqua planet’’ model. J. Meteor. Soc. Japan, 64, 451–467.
Hendon, H. H., 1988: A simple model of the 40-50 day oscillation.
J. Atmos. Sci., 45, 569–584.
——, and B. Liebmann, 1991: The structure and annual variation of
antisymmetric fluctuations of tropical convection and their
association with Rossby-gravity waves. J. Atmos. Sci., 48,
2127–2140.
Hsu, H., B. Hoskins, and F.-F. Jin, 1990: The 1985/86 intraseasonal
oscillation and the role of the extratropics. J. Atmos. Sci., 47,
2227–2240.
Hu, Q., and D. A. Randall, 1994: Low-frequency oscillations in
radiative-convective systems. J. Atmos. Sci., 51, 1089–1099.
Johnson, R. H., and P. E. Ciesielski, 2000: Rainfall and radiative
heating rates from TOGA COARE atmospheric budgets.
J. Atmos. Sci., 57, 1497–1514.
——, T. M. Rickenbach, S. A. Rutledge, P. E. Ciesielski, and
W. H. Schubert, 1999: Trimodal characteristics of tropical
convection. J. Climate, 12, 2397–2418.
Katsumata, M., T. Ushiyama, K. Yoneyama, and Y. Fujiyoshi,
2008a: Combined use of TRMM/PR and disdrometer data
to correct reflectivity of ground-based radars. SOLA, 4, 101–
104, doi:10.2151/sola.2008-026.
——, and Coauthors, 2008b: Intercomparison between heat and
moisture budget analyses and surface- and satellite-based
observed rainfall during MISMO-IOP (in Japanese). Proc. 2008
NOVEMBER 2009 K A T S U M A T A E T A L . 3447
Page 15
Fall Meeting of Meteorological Society of Japan, Sendai, Japan,
Meteorological Society of Japan, C163.
Kemball-Cook, S., and B. C. Weare, 2001: The onset of convection
in the Madden–Julian oscillation. J. Climate, 14, 780–793.
Kikuchi, K., and Y. N. Takayabu, 2003: Equatorial circumnaviga-
tion of moisture signal associated with the Madden–Julian
oscillation (MJO) during boreal winter. J. Meteor. Soc. Japan,
81, 851–869.
——, and ——, 2004: The development of organized convection
associated with the MJO during TOGA COARE IOP: Tri-
modal characteristics. Geophys. Res. Lett., 31, L10101, doi:
10.1029/2004GL019601.
Kiladis, G. N., K. H. Straub, and P. T. Haertel, 2005: Zonal and
vertical structure of the Madden–Julian oscillation. J. Atmos.
Sci., 62, 2790–2809.
L’Ecuyer, T. S., and G. L. Stephens, 2003: The tropical oceanic
energy budget from the TRMM perspective. Part I: Algorithm
and uncertainties. J. Climate, 16, 1967–1985.
Lin, J., B. Mapes, M. Zhang, and M. Newman, 2004: Stratiform
precipitation, vertical heating profiles, and the Madden–Julian
oscillation. J. Atmos. Sci., 61, 296–309.
Lin, X., and R. H. Johnson, 1996: Heating, moistening, and rainfall
over the western Pacific warm pool during TOGA COARE.
J. Atmos. Sci., 53, 3367–3383.
Madden, R. A., and P. R. Julian, 1972: Description of global-scale
circulation cells in the tropics with a 40-50 day period. J. Atmos.
Sci., 29, 1109–1123.
Maloney, E. D., 2009: The moist static energy budget of a com-
posite tropical intraseasonal oscillation in a climate model.
J. Climate, 22, 711–729.
——, and D. L. Hartmann, 1998: Frictional moisture convergence
in a composite life cycle of the Madden–Julian oscillation.
J. Climate, 11, 2387–2403.
Mapes, B. E., and R. A. Houze Jr., 1995: Diabatic divergence profiles
in western Pacific mesoscale convective systems. J. Atmos. Sci.,
52, 1807–1828.
Masunaga, H., T. S. L’Ecuyer, and C. D. Kummerow, 2006: The
Madden–Julian oscillation recorded in early observations
from the Tropical Rainfall Measuring Mission (TRMM).
J. Atmos. Sci., 63, 2777–2794.
McPhaden, M. J., and Coauthors, 2009: RAMA: The Research
Moored Array for African–Asian–Australian Monsoon Anal-
ysis and Prediction. Bull. Amer. Meteor. Soc., 90, 459–480.
Miura, H., M. Satoh, T. Nasuno, A. Noda, and K. Oouchi, 2007:
A Madden–Julian oscillation event realistically simulated by
using a global cloud-resolving model. Science, 318, 1763–1765.
Mori, K., 1995: Equatorial convection observed by the research
vessel Keifu Maru during the TOGA COARE IOP, Novem-
ber 1992. J. Meteor. Soc. Japan, 73, 491–508.
Nakazawa, T., 1988: Tropical super clusters within intraseasonal
variations over the western Pacific. J. Meteor. Soc. Japan, 66,
823–836.
Nicholls, M. E., R. A. Pielke, and W. R. Cotton, 1991: Thermally
forced gravity waves in an atmosphere at rest. J. Atmos. Sci.,
48, 1869–1884.
Nuss, W. A., and D. W. Titley, 1994: Use of multiquadric in-
terpolation for meterological objective analysis. Mon. Wea.
Rev., 122, 1611–1631.
Ohuchi, K., and M. Yamasaki, 1997: Kelvin wave-CISK controlled
by surface friction: A possible mechanism of super cloud clus-
ter. Part I: Linear theory. J. Meteor. Soc. Japan, 75, 497–511.
Seo, K.-H., and K.-Y. Kim, 2003: Propagation and initiation
mechanisms of the Madden–Julian oscillation. J. Geophys.
Res., 108, 4384, doi:10.1029/2002JD002876.
Straub, K. H., and G. N. Kiladis, 2003a: Interactions between the
boreal summer intraseasonal oscillation and higher-frequency
tropical wave activity. Mon. Wea. Rev., 131, 945–960.
——, and ——, 2003b: The observed structure of convectively
coupled Kelvin waves: Comparison with simple models of
coupled wave instability. J. Atmos. Sci., 60, 1655–1668.
Takahashi, S., F. Kondo, O. Tsukamoto, Y. Ito, S. Hirayama,
and H. Ishida, 2005: On-board automated eddy flux measure-
ment system over open ocean. SOLA, 1, 37–40, doi:10.2151/
sola.2005-011.
Takayabu, Y. N., 1994: Large-scale cloud disturbances associated
with equatorial waves. Part I: Spectral features of the cloud
disturbances. J. Meteor. Soc. Japan, 72, 433–449.
Tulich, S. N., and B. E. Mapes, 2008: Multiscale convective wave
disturbances in the tropics: Insights from a two-dimensional
cloud-resolving model. J. Atmos. Sci., 65, 140–155.
——, D. A. Randall, and B. E. Mapes, 2007: Vertical-mode and
cloud decomposition of large-scale convectively coupled gravity
waves in a two-dimensional cloud-resolving model. J. Atmos.
Sci., 64, 1210–1229.
Wang, B., and H. Rui, 1990: Synoptic climatology of transient tropical
intraseasonal convection anomalies: 1975–1985. Meteor. Atmos.
Phys., 44, 43–61.
Webster, P. J., and R. Lukas, 1992: TOGA COARE: The coupled
ocean-atmosphere response experiment. Bull. Amer. Meteor.
Soc., 73, 1377–1416.
Wheeler, M., and G. N. Kiladis, 1999: Convectively coupled
equatorial waves: Analysis of clouds and temperature in the
wavenumber-frequency domain. J. Atmos. Sci., 56, 374–399.
——, and K. M. Weickmann, 2001: Real-time monitoring and
prediction of modes of coherent synoptic to intraseasonal
tropical variability. Mon. Wea. Rev., 129, 2677–2694.
Wu, Z., 2003: A shallow CISK, deep equilibrium mechanism for the
interaction between large-scale convection and large-scale
circulations in the tropics. J. Atmos. Sci., 60, 377–392.
Yanai, M., S. Esbensen, and J.-H. Chu, 1973: Determination of
bulk properties of tropical cloud clusters from large-scale heat
and moisture budgets. J. Atmos. Sci., 30, 611–627.
Yoneyama, K., M. Fujita, N. Sato, M. Fujiwara, Y. Inai, and
F. Hasebe, 2008a: Correction for radiation dry bias found in
RS92 radiosonde data during the MISMO field experiment.
SOLA, 4, 13–16.
——, and Coauthors, 2008b: MISMO field experiment in the equa-
torial Indian Ocean. Bull. Amer. Meteor. Soc., 89, 1889–1903.
Yu, J.-Y., and J. D. Neelin, 1994: Modes of tropical variability
under convective adjustment and the Madden–Julian oscilla-
tion. Part II: Numerical results. J. Atmos. Sci., 51, 1895.
Yu, L., X. Jin, and R. A. Weller, 2008: Multidecade global flux
datasets from the objectively analyzed air-sea fluxes (OAFlux)
project: Latent and sensible heat fluxes, ocean evaporation,
and related surface meteorological variables. OAFlux Project
Tech. Rep., Woods Hole Oceanographic Institution, 64 pp.
Yuter, S. E., R. A. Houze Jr., E. A. Smith, T. T. Wilheit, and
E. Zipser, 2005: Physical characterization of tropical oceanic
convection observed in KWAJEX. J. Appl. Meteor., 44,
385–415.
Zhang, C., 2005: Madden–Julian oscillation. Rev. Geophys., 43,RG2003, doi:10.1029/2004RG000158.
3448 J O U R N A L O F T H E A T M O S P H E R I C S C I E N C E S VOLUME 66


![Comparing variability and trends in observed and … variability and trends in observed and modelled ... In a recent study some ... biases in the SST record [Thompson et al., 2008].Published](https://static.documents.pub/doc/80x56/5b2da0a67f8b9a55208b6e2f/comparing-variability-and-trends-in-observed-and-variability-and-trends-in-observed.jpg)


