49
OBSERVING THE BEHAVIOUR OF AMOXICILLIN IN PHOSPHATE AND AMMONIUM BUFFERS Juha Le Tortorec Bachelor’s Thesis June 2014 Environmental Engineering

OBSERVING THE BEHAVIOUR OF
AMOXICILLIN IN PHOSPHATE AND
AMMONIUM BUFFERS
Juha Le Tortorec
Bachelor’s Thesis
June 2014
Environmental Engineering

ABSTRACT
Tampereen ammattikorkeakoulu
Tampere University of Applied Sciences
Degree Programme in Environmental Engineering
LE TORTOREC, JUHA:
Observing the Behaviour of Amoxicillin in Phosphate and Ammonium Buffers
Bachelor's thesis 48 pages, out of which appendices 3 pages
June 2014
In modern animal husbandry veterinary medicines are used non therapeutically to
promote the health and growth of animals. While economical losses due to animal
sickness have been reduced this practice has also created problems. As it is generally
known many pharmaceuticals have antibiotic properties and low biodegradability.
Nowadays their behaviour in the environment is a common topic of discussion and
research.
In this study, amoxicillin was added into phosphate and ammonium buffer solutions.
The purpose was to observe how the pharmaceutical is behaving in the presence of
PO43-
and NH4+ ions during time span of approximately 180min. 2% MeOH solutions
was used as control.
Measurements were done with HPLC. Phenomenex Gemini-NX 5µm C18 110A
column was used. Mobile phase was 10mM pH 6,1 KH2PO4 and MeCN (95:5).
Wavelength was set to 227nm and flow rate to 1,5ml/min.
The chromatograms displayed two analyte peaks for each sample. Since no MS was
performed, AMX could not be identified. During method development phase peak 2
displayed signs of molecular changes. However, these were not observed in the final
results, suggesting that no degradation had occurred during the experiment.
Key words: veterinary medicines, amoxicillin, phosphate ion, ammonium ion, HPLC,
two peaks, degradation of pharmaceutical

TIIVISTELMÄ
Tampereen ammattikorkeakoulu
Degree Programme in Environmental Engineering
LE TORTOREC, JUHA:
Observing the Behaviour of Amoxicillin in Phosphate and Ammonium Buffers
Opinnäytetyö 48 sivua, joista liitteitä 3 sivua
Kesäkuu 2014
Nykyaikaisessa maataloudessa tuotantoeläimiä lääkitään ennaltaehkäisevästi
tuottavuuden parantamiseksi. Vaikka eläimien sairastumisesta johtuva hävikki on
vähentynyt, käytäntö voi aiheuttaa myös ongelmia. Kuten on yleisesti tiedossa, monet
lääkeaineet ovat antibakteerisia ja hajoavat siksi hitaammin luonnossa. Aihe on saanut
viime vuosina huomiota niin tutkimuksessa kuin mediassakin.
Tässä tutkimuksessa pyrittiin selvittämään onko fosfaatti- ja ammoniumionien
pitoisuuksilla vaikutusta amoksisilliinin käyttäytymiseen liuoksessa. Työssä
lääkeainetta lisättiin puskuriliuoksiin, joista sen pitoisuus määritettiin tietyin väliajoin
HPLC-laitteella n. 180min ajan. Kontrollinäytteenä käytettiin 2% MeOH liuosta.
Käytettävä kolonni oli Phenomenex Gemini-NX 5µm C18 110A. Eluenttina käytettiin
isokraattista 10mM pH 6,1 KH2PO4 ja MeCN (95:5). UV-lampun aallonpituus
säädettiin 227nm ja järjestelmän virtausnopeus 1,5ml/min.
Lopullisissa mittaustuloksissa esiintyi mahdollisesti kaksi eri ainetta. Näitä ei voitu
tunnistaa, sillä työssä ei käytetty MS-laitetta. Menetelmää kehittäessä toinen aineista
näytti hajoavan, mutta vastaavia havaintoja ei kuitenkaan tehty varsinaisissa
mittauksissa. Vaikka tunnistamattomat aineet eivät pysyneet kokeen aikana täysin
muuttumattomina, tulokset eivät todistettavasti viitanneet lääkeaineen suoranaiseen
hajoamiseen.
Avainsanat: tuotantoeläinten lääkkeet, amoksisilliini, fosfaatti-ioni, ammoniumioni,
HPLC, lääkeaineen hajoaminen
3 (48)
CONTENTS
1 INTRODUCTION ....................................................................................................... 7
2 BACKGROUND ......................................................................................................... 8
3 THEORY ................................................................................................................... 10
3.1 Amoxicillin ........................................................................................................ 10
3.2 Buffers ............................................................................................................... 10
3.3 Chromatography ................................................................................................ 11
3.3.1 Principle .................................................................................................. 11
3.3.2 HPLC ...................................................................................................... 11
4 OBJECTIVE .............................................................................................................. 16
5 METHOD .................................................................................................................. 17
5.1 Stock solution .................................................................................................... 17
5.2 Diluents .............................................................................................................. 18
5.2.1 Methanol solution ................................................................................... 18
5.2.2 Phosphate buffer...................................................................................... 18
5.2.3 Ammonium buffer ................................................................................... 18
5.3 UV spectrum ...................................................................................................... 19
5.4 Sample preparation ............................................................................................ 19
5.5 HPLC method .................................................................................................... 20
5.5.1 Eluent ...................................................................................................... 21
5.5.2 Experimental conditions.......................................................................... 22
5.5.3 Integration settings .................................................................................. 23
5.6 Reporting and data processing ........................................................................... 23
6 RESULTS .................................................................................................................. 24
6.1 UV spectrum ...................................................................................................... 24
6.2 HPLC ................................................................................................................. 25
6.2.1 Chromatograms ....................................................................................... 25
6.2.2 Retention time ......................................................................................... 31
6.2.3 Peak area ................................................................................................. 33
7 DISCUSSION ........................................................................................................... 35
7.1 Separate peaks .................................................................................................... 35
7.1.1 Impurities ................................................................................................ 35
7.1.2 Contamination ......................................................................................... 36
7.1.3 Degradation products .............................................................................. 36
7.1.4 Partial ionisation ..................................................................................... 36
7.2 Peak shape distortions ........................................................................................ 37
4 (48)
7.3 Travelling peaks ................................................................................................. 38
7.4 Peak area ............................................................................................................ 38
7.5 Degradation ........................................................................................................ 39
8 CONCLUSION ......................................................................................................... 40
9 POSSIBILITIES FOR FUTURE WORK ................................................................. 41
10 ACKNOWLEDGEMENTS ...................................................................................... 42
11 REFERENCES .......................................................................................................... 43
11.1 World Wide Web page ...................................................................................... 43
11.2 Literature ............................................................................................................ 45
12 APPENDIX A ........................................................................................................... 46

5 (48)
ABBREVIATIONS AND TERMS
LIST OF ABBREVIATIONS AND SYMBOLS
λ Wavelength (nm)
ADP Amoxicillin diketopiperazine-2´, 5´ (Lamm et al., 2009)
AMX Amoxicillin (Lamm et al., 2009)
Apeak Peak area
Are Relative area
C2H7NO2 Ammonium acetate
CO2 Carbon dioxide
H+ Hydrogen ion
H2O Water
H3O+ Hydronium ion
HPLC High performance liquid chromatography
k Slope
KH2PO4 Potassium dihydrogen phosphate
LC Liquid chromatography
LC/MS Liquid chromatography mass spectrometry
M Molarity (mol/l)
MeOH Methanol
MeCN Acetonitrile
MS Mass spectrometry
NaH2PO4 Sodium dihydrogen phosphate
Na3PO4 Trisodium phosphate
NaOH Sodium hydroxide
NH3 Ammonia
NH4+
Ammonium ion
OH- Hydroxide ion
OTC Oxytetracycline (Chemical Book, 2010)
p Pressure (bar)
pmax Maximum pressure (bar)
PO43-
Phosphate ion
ppm Parts per million (mg/l)
6 (48)
R2 Correlation
RT Retention time (min)
SMZ Sulphamethoxazole (Chemspider, 2014, Sulphamethoxazole)
SPE Solid phase extraction
T Temperature (°C)
t time (min)
TYL Tylosin
UHP Ultra high purified
UV Ultraviolet
V Volume (ml)
Vinjection Injection volume (µl)

7 (48)
1 INTRODUCTION
Usage of veterinary medicines in modern agriculture is common thorough the whole
world. In animal husbandry pharmaceuticals and hormones are non therapeutically
given to livestock in order to improve their health and growth (Animal Health Institute,
2014; Martin et al., 2010; YLE 1, 2013; The Wall Street Journal, 2013).
A study published in Journal of Antimicrobial Chemotherapy shows that in year 2007
18-188mg of veterinary antibacterial agents were sold per a kilogram of meat (swine,
cattle and poultry) produced within 10 selected European countries (Grave et al., 2010).
Netherlands and France had the highest amount, while Norway, Sweden and Finland
had the lowest. Out of the EU countries Sweden had the lowest value (~25mg/kg).
While the modern practice has prevented disease and thus minimised losses (YLE 1,
2013), specialist of different fields criticise the carefree attitude of using livestock
medication for non therapeutic purposes (prevention, growth improvement). Elstrøm
from the Norwegian Public Health Institute stated that ”there is a direct link between the
use of antibiotics in livestock and resistant bacteria in humans” (EurActiv, 2014).
Continuing with the current practices could potentially lead to formation of antibiotic
resistant super bacteria (Mackie, 2011; RT, 2014).
The non metabolised pharmaceuticals are excreted by the animals and can be found in
trace amounts from the faeces and urine. Eventually these will end up into the soil and
natural water bodies.
There is reason to believe that these compounds have certain persistence in the
environment. Biological degradation may occur slowly due to the natural antibiotic
properties of certain compounds. Furthermore, as the molecules are complex, unknown
chemical reactions between different compounds may occur. This way new, potentially
more hazardous substances can be formed (YLE 2, 2013).
While the final fate of these substances in the environment remains unclear (YLE 2,
2013), it is heavily researched on nowadays. During recent years the issue has been
getting more attention in the media, raising public awareness (YLE 3, 2013).

8 (48)
2 BACKGROUND
The basis for this thesis work is laid on two scientific papers. These were Factors
affecting the degradation of amoxicillin in composting toilet by Kakimoto and
Funamizu (2006), and Degradation of veterinary medicines in composting process of
livestock manure by Ishiduka (2013).
Kakimoto and Funamizu had discovered that the degradation of amoxicillin had a
relation to the concentration of phosphate, ammonium and hydroxyl ions in composting
environment. It was concluded that these were factors controlling the degradation
process.
In her work Ishiduka noticed that degradation of the selected veterinary medicines
(including amoxicillin) occurred regardless of biological activity. She concluded that
the cause of degradation was chemical reactions.
During my internship period in Japan in spring 2013, I applied Kakimoto’s and
Funamizu’s method (although modified) on three of Ishiduka’s pharmaceuticals (SMZ,
OTC and TYL). The aim of my work was to find out if phosphate and ammonium ions
had an effect on the degradation rate.
While in Japan, I discussed with Kakimoto, Funamizu and Ishiduka in person. In our
conversation I gained a lot of practical information about the setup of the experiments
itself, knowledge that cannot be found from books or Internet. This was very beneficial
regarding my work. After several trials, I was able to conduct the experiment. Sample
preparation was done by using a SPE method. Analysis was carried out by using
LC/MS.
The results failed to show proper degradation lines for the pharmaceuticals as the level
of detected pharmaceuticals was varying unnaturally. While there had been some issues
with the LC/MS in the past, this was not the probable cause. Mistakes in the SPE
process were suspected.

9 (48)
Regardless of this, I presented my findings in a seminar at the end of my internship
period. After my presentation I received several comments. A Ph.D. candidate in my
laboratory pointed out that it would have been wiser to first see whether I could repeat
Kakimoto’s and Funamizu’s experiment with amoxicillin before applying the method
for any other pharmaceuticals. Realized that this was elementary, I concluded that any
further work should focus on that.
After discussing the continuation of the research with my teachers, I got my Bachelor’s
thesis topic accepted. In January 2014 I started working in the laboratories at Tampere
University of Applied Sciences.
10 (48)
3 THEORY
3.1 Amoxicillin
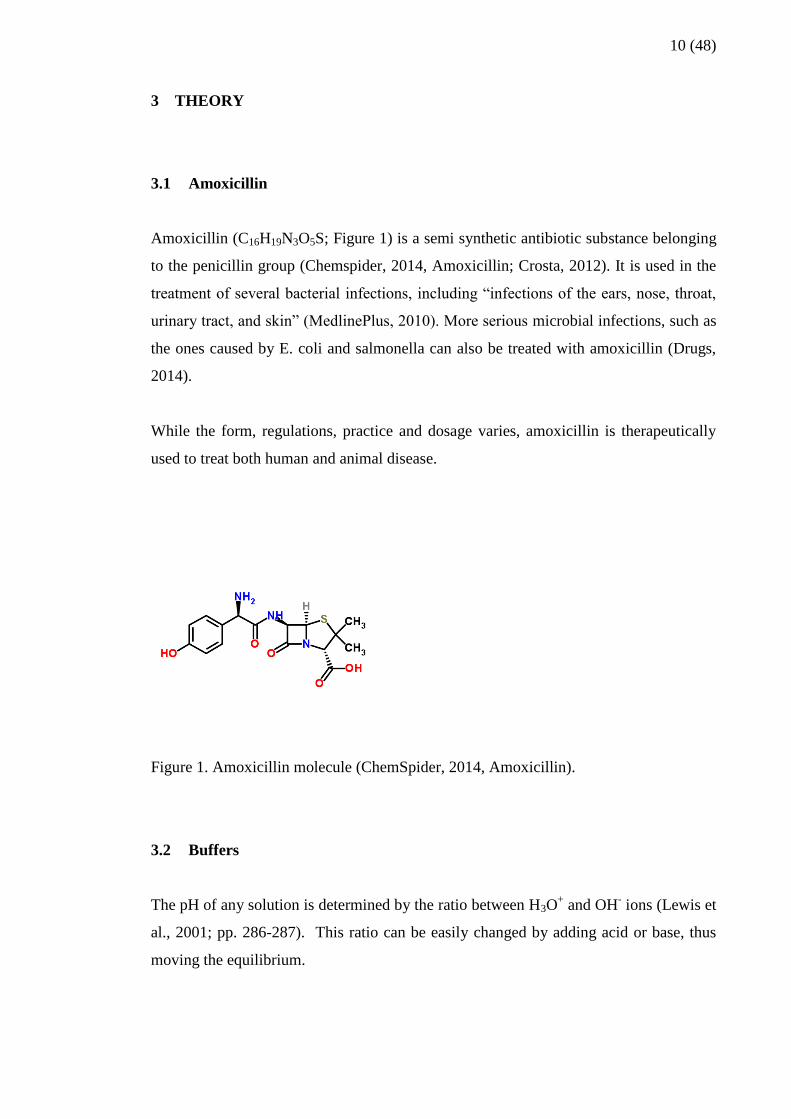
Amoxicillin (C16H19N3O5S; Figure 1) is a semi synthetic antibiotic substance belonging
to the penicillin group (Chemspider, 2014, Amoxicillin; Crosta, 2012). It is used in the
treatment of several bacterial infections, including “infections of the ears, nose, throat,
urinary tract, and skin” (MedlinePlus, 2010). More serious microbial infections, such as
the ones caused by E. coli and salmonella can also be treated with amoxicillin (Drugs,
2014).
While the form, regulations, practice and dosage varies, amoxicillin is therapeutically
used to treat both human and animal disease.
Figure 1. Amoxicillin molecule (ChemSpider, 2014, Amoxicillin).
3.2 Buffers
The pH of any solution is determined by the ratio between H3O+ and OH
- ions (Lewis et
al., 2001; pp. 286-287). This ratio can be easily changed by adding acid or base, thus
moving the equilibrium.

11 (48)
Solutions with the ability to resist this change are called buffers. They contain “a weak
base and one of its salts, or a weak acid and one its salts” (Lewis et al., 2001; p. 298).
These solutions have components capable of binding H+ ions and changing OH
- ions
into water molecules (Clark, 2002, buffer solutions). Naturally, this ability is limited,
and is determined by the capacity of the buffer (Lewis et al., 2001; p. 300).
Buffers are naturally present in soil and water bodies, but also in living cells and body
liquids such as blood, where changes in pH would be catastrophic (terracult; Lewis et
al., 2001, p. 297).
3.3 Chromatography
3.3.1 Principle
Chromatography is a method for separating different components from mixtures (Clark,
2007, thin layer chromatography). While there are several types of chromatographic
applications in use, the operating principle is always the same (Clark, 2007, thin layer
chromatography).
Basically a chromatograph requires two things to function: a mobile phase and a
stationary phase. The purpose of the mobile phase is to transfer the sample through the
stationary phase. The function of the stationary phase is to separate the analytes (target
compounds) from each other utilizing the differences in their chemical properties
(Clark, 2007, thin layer chromatography).
3.3.2 HPLC
High performance liquid chromatography is a sophisticated application of liquid
chromatography. It utilises high pressure (up to 400bar) making the separation process
much faster than in simple chromatographic applications using only gravitational force
12 (48)
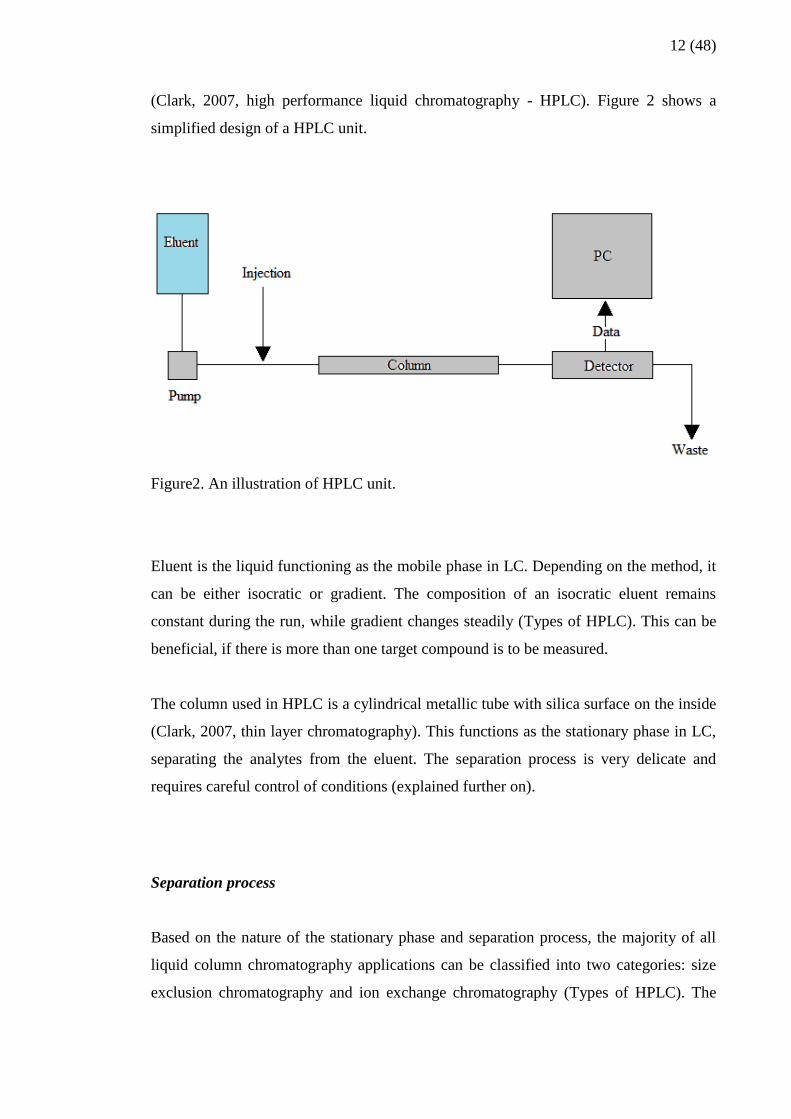
(Clark, 2007, high performance liquid chromatography - HPLC). Figure 2 shows a
simplified design of a HPLC unit.
Figure2. An illustration of HPLC unit.
Eluent is the liquid functioning as the mobile phase in LC. Depending on the method, it
can be either isocratic or gradient. The composition of an isocratic eluent remains
constant during the run, while gradient changes steadily (Types of HPLC). This can be
beneficial, if there is more than one target compound is to be measured.
The column used in HPLC is a cylindrical metallic tube with silica surface on the inside
(Clark, 2007, thin layer chromatography). This functions as the stationary phase in LC,
separating the analytes from the eluent. The separation process is very delicate and
requires careful control of conditions (explained further on).
Separation process
Based on the nature of the stationary phase and separation process, the majority of all
liquid column chromatography applications can be classified into two categories: size
exclusion chromatography and ion exchange chromatography (Types of HPLC). The

13 (48)
latter one is further divided into normal phase and reversed phase chromatography
(Types of HPLC).
Size exclusion chromatography
“In size exclusion chromatography the column is filled with material having precisely
controlled pore sizes” (Types of HPLC). The pores function as filters, controlling the
size of molecules that can travel through them. Larger molecules are rapidly washed
through the column, while the smaller travel through the pores, thus taking longer time
to reach the end of the column (Types of HPLC).
Ion exchange chromatography
The separation process in ion exchange chromatography is based on the opposite
charges between the stationary phase and sample ions (Types of HPLC). “The stronger
the charge on the sample, the stronger it will be attracted to the ionic surface and thus,
the longer it will take to elute” (Types of HPLC).
In normal phase chromatography the stationary phase is polar (e.g. silica) and the
mobile phase non polar. This retains the polar compounds inside the stationary phase,
while the non polar ones will stay in the mobile phase and travel through faster (Clark,
2007, high performance liquid chromatography - HPLC).
Reversed phase chromatography is the exact opposite of normal phase. The stationary
phase is non polar (silica modified with long hydrocarbon chains) and the mobile phase
polar (Clark, 2007, high performance liquid chromatography – HPLC). Reversed phase
chromatography uses either C8 or C18-columns as stationary phase (Clark, 2007, high
performance liquid chromatography – HPLC).
14 (48)
Retention time
The time it takes for a compound to pass through the column and reach the detector is
referred to as retention time. RT for a particular compound will depend on column
temperature, flow rate (affects directly the pressure), how well it is dissolving in the
eluent and how much it is reacting with the surface of the column (Clark, 2007, thin
layer chromatography). If these conditions stay exactly the same, theoretically speaking
no variations in RT for a particular compound should occur.
Detector
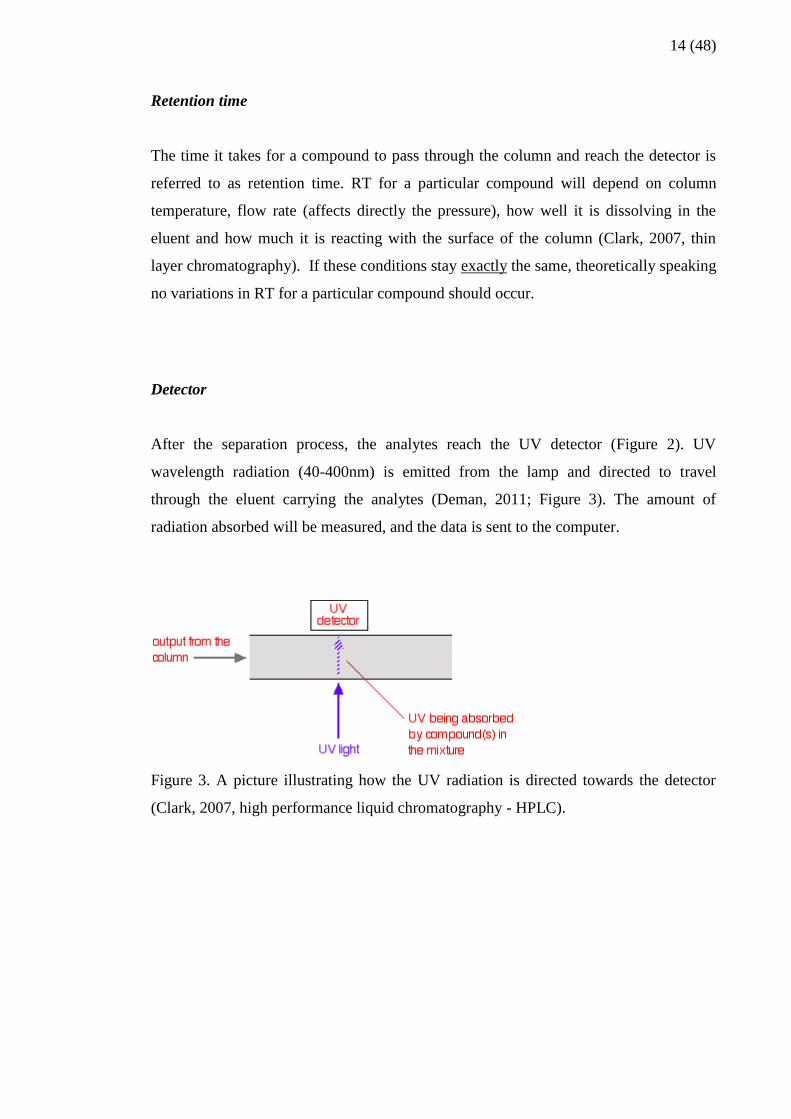
After the separation process, the analytes reach the UV detector (Figure 2). UV
wavelength radiation (40-400nm) is emitted from the lamp and directed to travel
through the eluent carrying the analytes (Deman, 2011; Figure 3). The amount of
radiation absorbed will be measured, and the data is sent to the computer.
Figure 3. A picture illustrating how the UV radiation is directed towards the detector
(Clark, 2007, high performance liquid chromatography - HPLC).
15 (48)
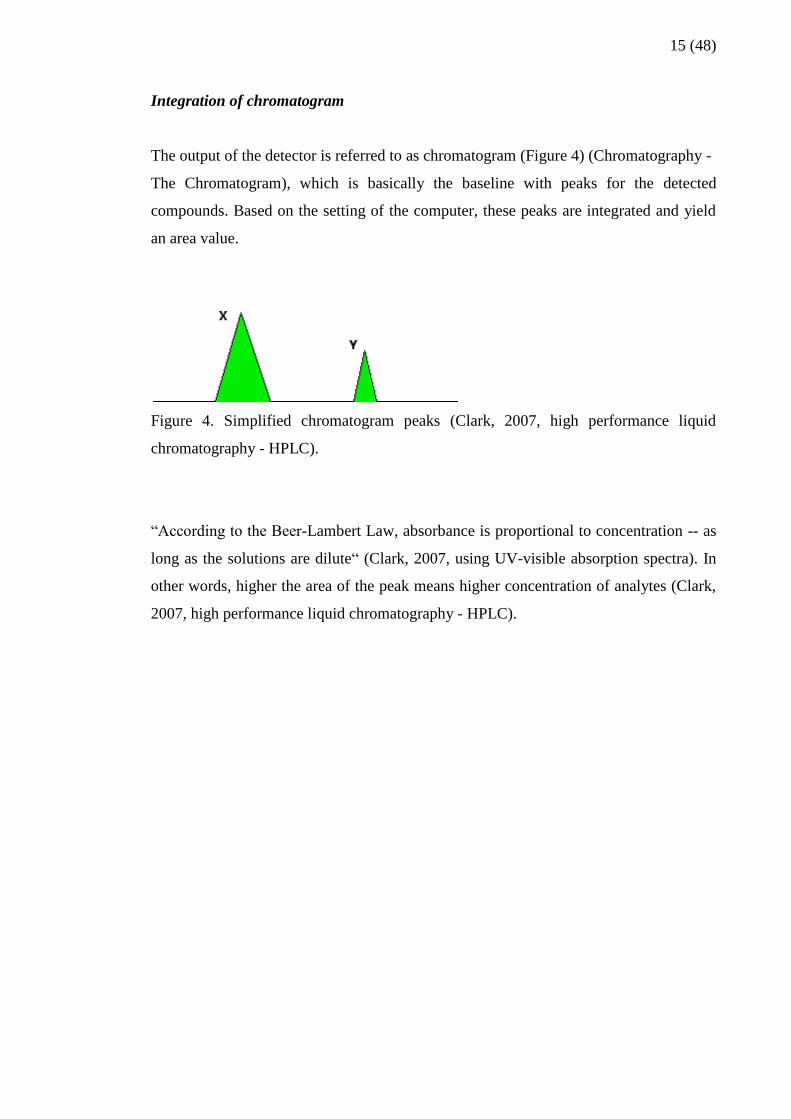
Integration of chromatogram
The output of the detector is referred to as chromatogram (Figure 4) (Chromatography -
The Chromatogram), which is basically the baseline with peaks for the detected
compounds. Based on the setting of the computer, these peaks are integrated and yield
an area value.
Figure 4. Simplified chromatogram peaks (Clark, 2007, high performance liquid
chromatography - HPLC).
“According to the Beer-Lambert Law, absorbance is proportional to concentration -- as
long as the solutions are dilute“ (Clark, 2007, using UV-visible absorption spectra). In
other words, higher the area of the peak means higher concentration of analytes (Clark,
2007, high performance liquid chromatography - HPLC).

16 (48)
4 OBJECTIVE
The objective of this study was to find out whether PO43-
and NH4+ ions have an effect
on the degradation of amoxicillin at constant pH conditions. This was done by
performing a similar experiment to Kakimoto’s and Funamizu’s one.
There were four stages in the work:
The first stage was to plan and develop an experiment where PO43-
and NH4+ ions are
present in a solution at constant pH conditions. After this it was necessary to find a
method capable of measuring the pharmaceutical to be studied from these solutions.
This was applied to the selected pharmaceutical (AMX). Based on the results
conclusions were made.
17 (48)
5 METHOD
The principle of the new method was to spike the pharmaceutical in a solution and make
consecutive injections in HPLC.
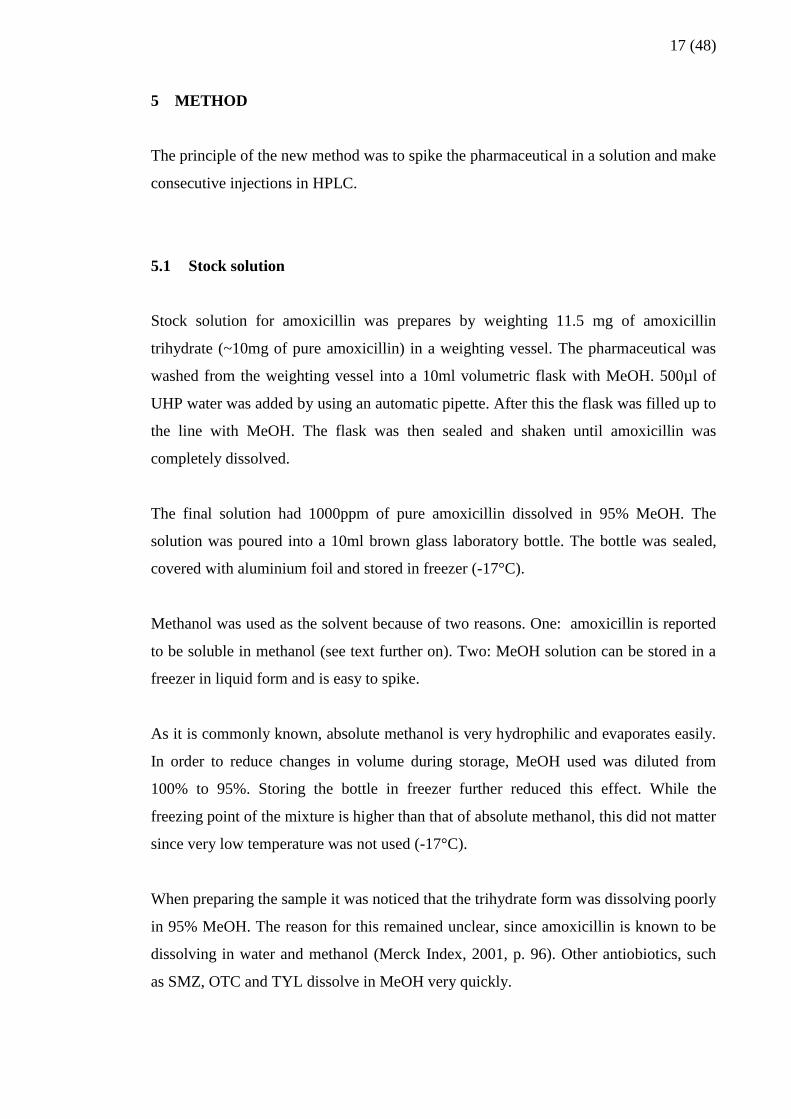
5.1 Stock solution
Stock solution for amoxicillin was prepares by weighting 11.5 mg of amoxicillin
trihydrate (~10mg of pure amoxicillin) in a weighting vessel. The pharmaceutical was
washed from the weighting vessel into a 10ml volumetric flask with MeOH. 500µl of
UHP water was added by using an automatic pipette. After this the flask was filled up to
the line with MeOH. The flask was then sealed and shaken until amoxicillin was
completely dissolved.
The final solution had 1000ppm of pure amoxicillin dissolved in 95% MeOH. The
solution was poured into a 10ml brown glass laboratory bottle. The bottle was sealed,
covered with aluminium foil and stored in freezer (-17°C).
Methanol was used as the solvent because of two reasons. One: amoxicillin is reported
to be soluble in methanol (see text further on). Two: MeOH solution can be stored in a
freezer in liquid form and is easy to spike.
As it is commonly known, absolute methanol is very hydrophilic and evaporates easily.
In order to reduce changes in volume during storage, MeOH used was diluted from
100% to 95%. Storing the bottle in freezer further reduced this effect. While the
freezing point of the mixture is higher than that of absolute methanol, this did not matter
since very low temperature was not used (-17°C).
When preparing the sample it was noticed that the trihydrate form was dissolving poorly
in 95% MeOH. The reason for this remained unclear, since amoxicillin is known to be
dissolving in water and methanol (Merck Index, 2001, p. 96). Other antiobiotics, such
as SMZ, OTC and TYL dissolve in MeOH very quickly.

18 (48)
As the prepared stock solution was very concentrated (1000ppm), it was possible to use
a low spiking volume (200µl per 10ml) and still have a relatively high concentration of
pharmaceuticals in the sample (20ppm). Higher concentration in the sample made
detection easier.
5.2 Diluents
The diluents were prepared in the described manner.
5.2.1 Methanol solution
The 2% MeOH solution was prepared by filling a 10ml volumetric flask with UHP
water almost until the line. 200µl of MeOH was added by using an automatic pipette.
After this the flask was filled until the line with UHP water, sealed and shaken.
5.2.2 Phosphate buffer
50ml of 200mM Na3PO4 solution and 50ml 200mM NaH2PO4 solution were prepared.
NaH2PO4 solution was emptied into a beaker. While constantly stirring and measuring
the pH, Na3PO4 solution was added with pasteur pipette until pH 8,5 was reached.
5.2.3 Ammonium buffer
50ml of 200mM C2H7NO2 solution and 50ml 200mM NH3 solution were prepared.
C2H7NO2 solution was emptied into a beaker. While constantly stirring and measuring
the pH, NH3 solution was added with pasteur pipette until pH 8,5 was reached.
The ammonia calculation was made by using a table found from Internet (Chemistry
Archive). Due to volatilisation of ammonia in basic conditions (Richard, 1996), the
readymade buffer solution was stored in fridge.

19 (48)
5.3 UV spectrum
UV spectrum was determined for AMX by using UV/VIS spectrometer (Figure 5). The
values were measured from 1% MeOH solutions with pharmaceutical concentration of
10ppm. Total of three measurements were done. 1% MeOH solution was used as
control.
Figure 5. PerkinElmer instruments UV/VIS Spectrometer unit.
5.4 Sample preparation
Each sample solution containing pharmaceutical was prepared three minutes before the
injection in order to give accurate result for the initial (0min) measurement.
A 10ml volumetric flask was filled almost until the line with diluent. 200µl of
pharmaceutical stock solution was spiked by using an automatic pipette. The flask was
filled until the line with diluent, sealed and shaken for one minute.

20 (48)
After this, the solution was poured into a small beaker. Some of the solution was
transferred into a syringe (1-2ml). Air was removed by turning the syringe vertically up
and tapping the side lightly so that the air bubble moved to the surface. Some solution
was pressed out from the solution, at the same time removing the air bubble.
Next a syringe filter was placed to the end of the syringe. The solution was lightly
pressed through the filter into a 2ml screw cap via. The vial was sealed and placed on
the autosampler rack, ready to be automatically injected.
5.5 HPLC method
For this work, an existing HPLC method for amoxicillin was modified (Lunn, 2000, p.
385) (see method settings). Analysis was carried out by using Agilent HPLC 1100
Series unit (Figure 7). The separation process was reversed phase chromatography. A
C18 column was used with guard column attached (Figure 6).
Figure 6. Phenomenex Gemini-NX 5µm C18 110A column with a guard column
attached.

21 (48)
Figure 7. Agilent HPLC 1100 Series unit.
5.5.1 Eluent
Eluent A was made by preparing 10mM solution of KH2PO4 solution and setting the pH
to 6,1 with NaOH (Table 1). The solution was filtered by using a vacuum filtration unit
in order to reach HPLC grade (Figure 8). MeCN was used as eluent B.
Table 1. Mobile phase used in amoxicillin measurements (isocratic).
A B
Eluent 10mM KH2PO4 pH 6.1 (NaOH) MeCN
v/v (%) 95 5

22 (48)
Figure 8. Vacuum filtration unit used for preparing eluent A.
5.5.2 Experimental conditions
HPLC method settings can be seen from table 2.
Table 2. Method settings for HPLC. *) Changed from the original method (Lunn, 2000,
V2, p. 385).
Column Phenomenex Gemini-NX 5µm C18 110A *
V (injection) 20µl
Flow rate 1.5ml/min *
T (column) Ambient (~20°C)
t 15min or 17min
p (max) 250bar
23 (48)
5.5.3 Integration settings
The integration settings of the HPLC unit are presented in table 3. The limits were set
quite low on purpose in order to get all peaks integrated.
Table 3. Integration settings for chromatogram analysis.
Slope sensitivity 5
Min. peak width 0.05min
Min. peak height 0.1mAU
Min. peak area 1
5.6 Reporting and data processing
The used HPLC method reported the results of the measurements in PDF and TXT
format. Chromatograms were screen captured from the PDF files. Raw data from TXT
files was used to produce the figures. MO Excel was used for data processing.
24 (48)
6 RESULTS
The results of the experiments are presented in this chapter.
6.1 UV spectrum
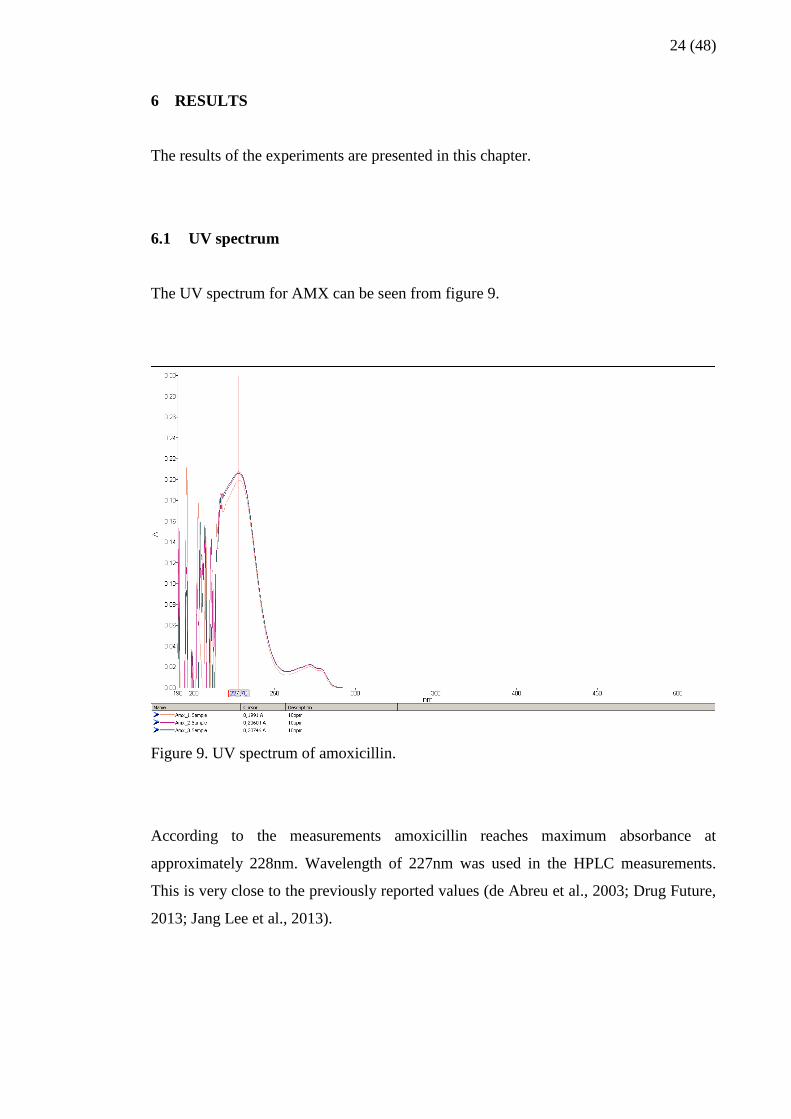
The UV spectrum for AMX can be seen from figure 9.
Figure 9. UV spectrum of amoxicillin.
According to the measurements amoxicillin reaches maximum absorbance at
approximately 228nm. Wavelength of 227nm was used in the HPLC measurements.
This is very close to the previously reported values (de Abreu et al., 2003; Drug Future,
2013; Jang Lee et al., 2013).
25 (48)
6.2 HPLC
The results for the HPLC measurements are presented here. Due to limitations in using
of analytical equipment, some measurements were done with fewer injections than
others. In order to compare the figures better, linear lines estimating the probable
development of the scatter plots were drawn by using k value.
6.2.1 Chromatograms
Every time a new measurement begun the produced chromatogram received some
disturbance. This originated from the injection itself, as well as UV absorbance of
solution the analytes were dissolved in (diluent). This part of the chromatogram was
referred to as noise, and was excluded from the data analysis.
Figures 10, 13 and 16 are examples of chromatograms from injections containing only
the sample diluent without any pharmaceuticals. This information made it possible to
estimate the effect the diluents used had on the AMX measurements, thus improving the
accuracy of the method.
The sample injection was compared against the chromatogram produced by the diluent.
While these could not be overlapped by the program, it still made it possible to identify
the peaks originating from the spiked pharmaceutical. This is true, since (as far as it is
known) only one new substance has been introduced.
The chromatogram in figure 10 is produced by 2% MeOH diluent injection. While the
baseline is not fully stabilised, the peak produced by diluent is visible.

26 (48)
Figure 10. 2% MeOH injection (SIG1026945).
Figure 11 demonstrates the chromatogram in produced by 2% MeOH+20ppm AMX
injection at 0min. Peak 1 is sharp and high, staying nearly constant during the
measurements. Peak 2 on the other hand, is short and wide. Towards the end, the peak is
splitting (Figure 12).
Figure 11. 2% MeOH+20ppm AMX injection (0min) (SIG1026946).

27 (48)
Figure 12. 2% MeOH+20ppm AMX injection (195min) (SIG1026959).
The chromatogram in figure 13 represents 200mM pH 8,5 phosphate buffer+2% MeOH
injection. Baseline is good and diluent peaks clearly visible.
Figure 13. 200mM pH 8,5 phosphate buffer+2% MeOH injection (SIG1026965).
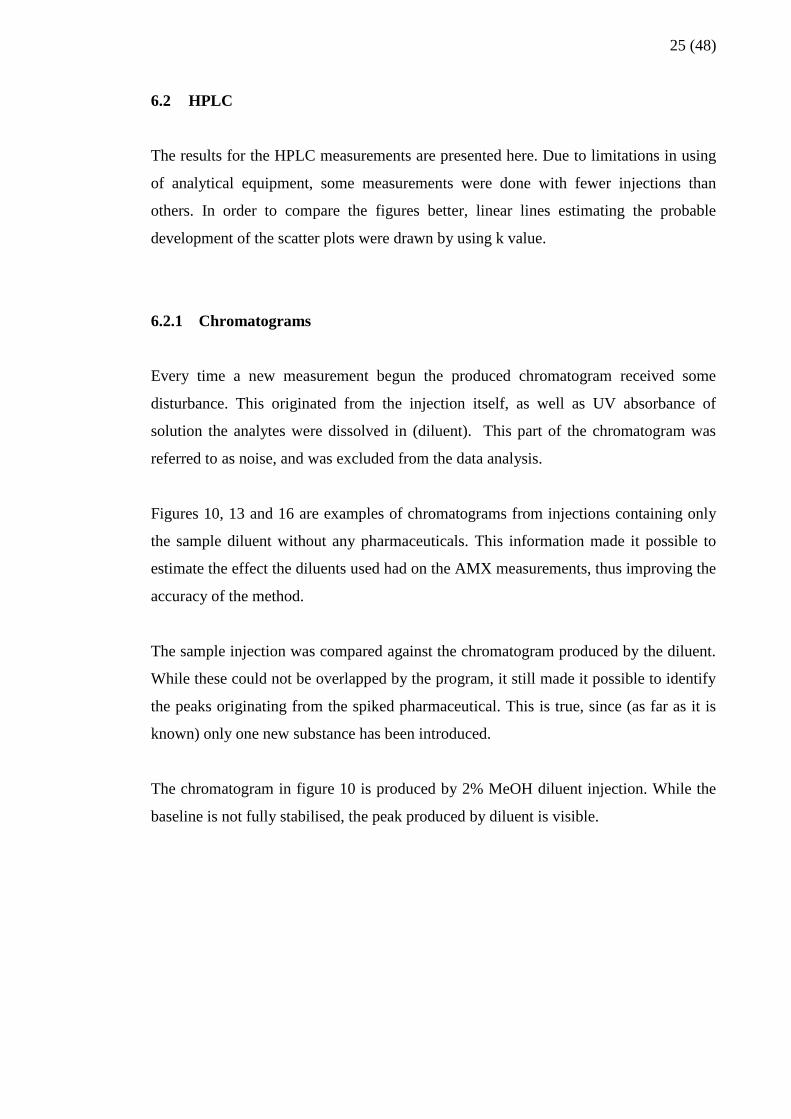
Figure 14 demonstrates the chromatogram produced by 200mM pH 8,5 phosphate
buffer+2% MeOH+20ppm AMX injection at 0min. Again, peak 1 is very sharp, high
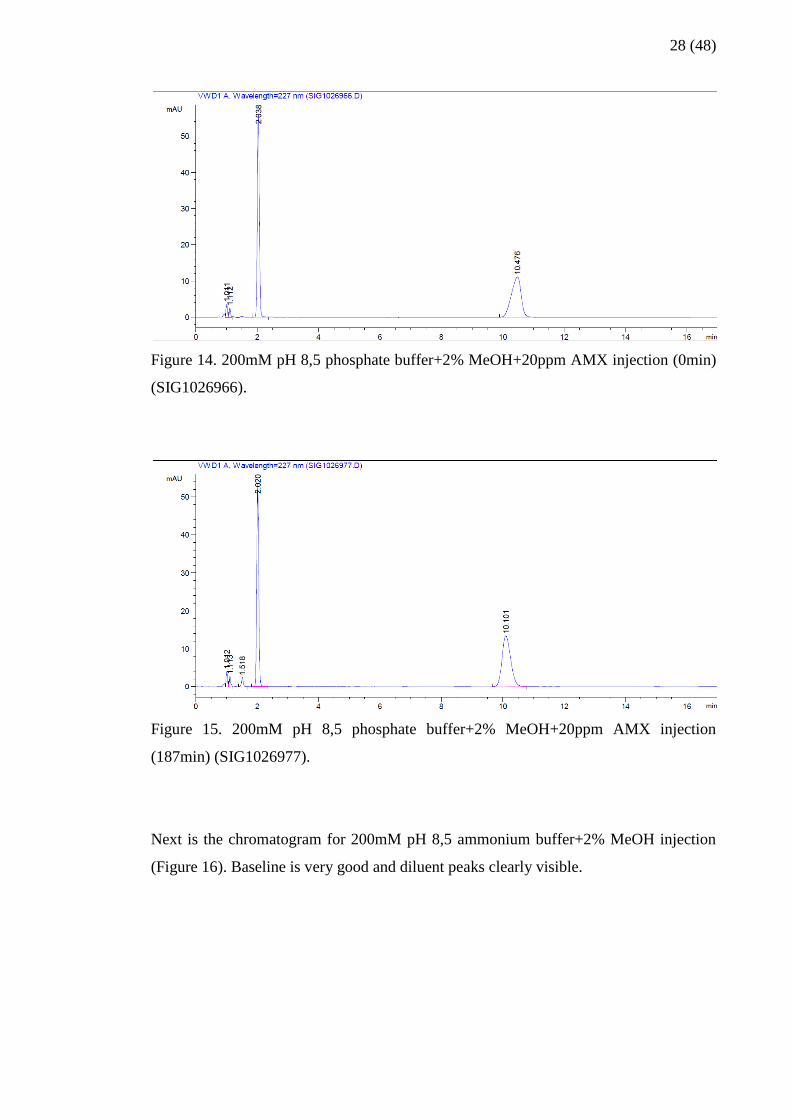
and stays constant. Peak 2 is fronting in the beginning, but seems to turn vertical and
sharpen later on (Figure 15).
28 (48)
Figure 14. 200mM pH 8,5 phosphate buffer+2% MeOH+20ppm AMX injection (0min)
(SIG1026966).
Figure 15. 200mM pH 8,5 phosphate buffer+2% MeOH+20ppm AMX injection
(187min) (SIG1026977).
Next is the chromatogram for 200mM pH 8,5 ammonium buffer+2% MeOH injection
(Figure 16). Baseline is very good and diluent peaks clearly visible.

29 (48)
Figure 16. 200mM pH 8,5 ammonium buffer+2% MeOH injection (SIG1027004).
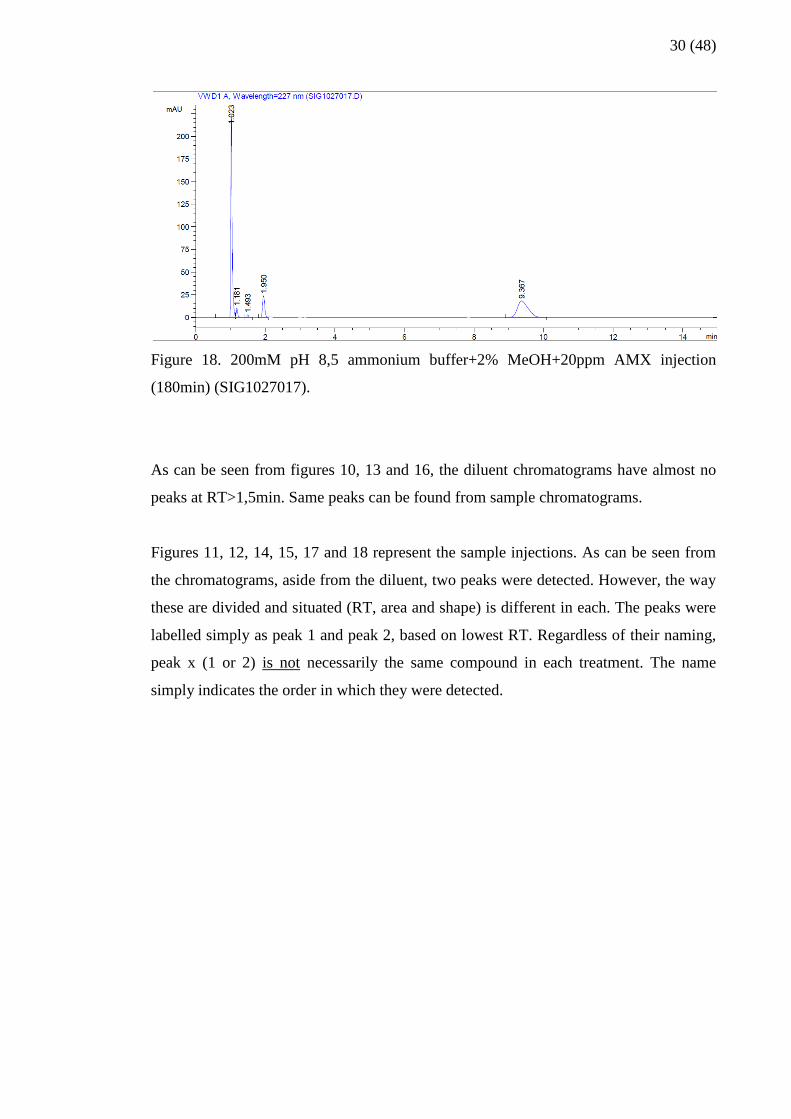
Figure 17 demonstrates the chromatogram produced by 200mM pH 8,5 ammonium
buffer+2% MeOH+20ppm AMX injection at 0min. Surprisingly, peak 1 is clearly
shorter than in other treatments. The peak stays sharp and nearly constant. Peak 2
resembles an equilateral triangle, and seems to be slightly broadening to the right hand
side (Figure 18).
Figure 17. 200mM pH 8,5 ammonium buffer+2% MeOH+20ppm AMX injection
(0min) (SIG1027005).
30 (48)
Figure 18. 200mM pH 8,5 ammonium buffer+2% MeOH+20ppm AMX injection
(180min) (SIG1027017).
As can be seen from figures 10, 13 and 16, the diluent chromatograms have almost no
peaks at RT>1,5min. Same peaks can be found from sample chromatograms.
Figures 11, 12, 14, 15, 17 and 18 represent the sample injections. As can be seen from
the chromatograms, aside from the diluent, two peaks were detected. However, the way
these are divided and situated (RT, area and shape) is different in each. The peaks were
labelled simply as peak 1 and peak 2, based on lowest RT. Regardless of their naming,
peak x (1 or 2) is not necessarily the same compound in each treatment. The name
simply indicates the order in which they were detected.
31 (48)
6.2.2 Retention time
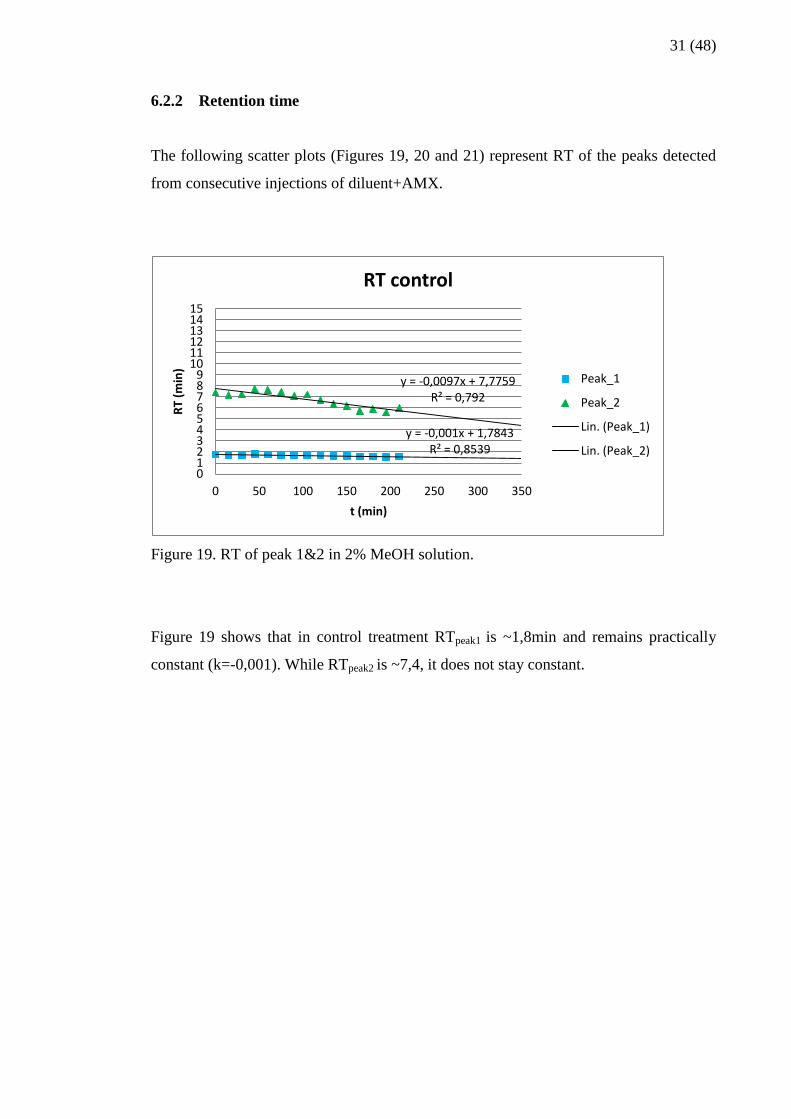
The following scatter plots (Figures 19, 20 and 21) represent RT of the peaks detected
from consecutive injections of diluent+AMX.
Figure 19. RT of peak 1&2 in 2% MeOH solution.
Figure 19 shows that in control treatment RTpeak1 is ~1,8min and remains practically
constant (k=-0,001). While RTpeak2 is ~7,4, it does not stay constant.
y = -0,001x + 1,7843 R² = 0,8539
y = -0,0097x + 7,7759 R² = 0,792
0 1 2 3 4 5 6 7 8 9
10 11 12 13 14 15
0 50 100 150 200 250 300 350
RT
(min
)
t (min)
RT control
Peak_1
Peak_2
Lin. (Peak_1)
Lin. (Peak_2)
32 (48)
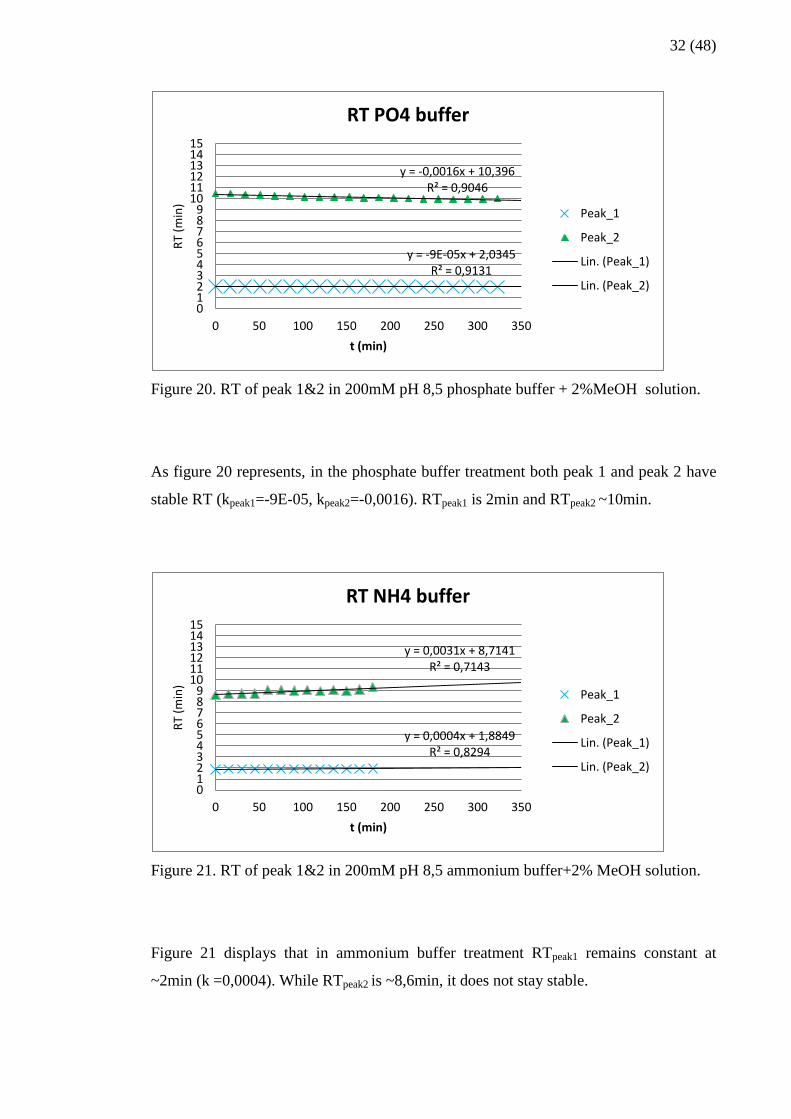
Figure 20. RT of peak 1&2 in 200mM pH 8,5 phosphate buffer + 2%MeOH solution.
As figure 20 represents, in the phosphate buffer treatment both peak 1 and peak 2 have
stable RT (kpeak1=-9E-05, kpeak2=-0,0016). RTpeak1 is 2min and RTpeak2 ~10min.
Figure 21. RT of peak 1&2 in 200mM pH 8,5 ammonium buffer+2% MeOH solution.
Figure 21 displays that in ammonium buffer treatment RTpeak1 remains constant at
~2min (k =0,0004). While RTpeak2 is ~8,6min, it does not stay stable.
y = -9E-05x + 2,0345 R² = 0,9131
y = -0,0016x + 10,396 R² = 0,9046
0 1 2 3 4 5 6 7 8 9
10 11 12 13 14 15
0 50 100 150 200 250 300 350
RT
(min
)
t (min)
RT PO4 buffer
Peak_1
Peak_2
Lin. (Peak_1)
Lin. (Peak_2)
y = 0,0004x + 1,8849 R² = 0,8294
y = 0,0031x + 8,7141 R² = 0,7143
0 1 2 3 4 5 6 7 8 9
10 11 12 13 14 15
0 50 100 150 200 250 300 350
RT
(min
)
t (min)
RT NH4 buffer
Peak_1
Peak_2
Lin. (Peak_1)
Lin. (Peak_2)
33 (48)
6.2.3 Peak area
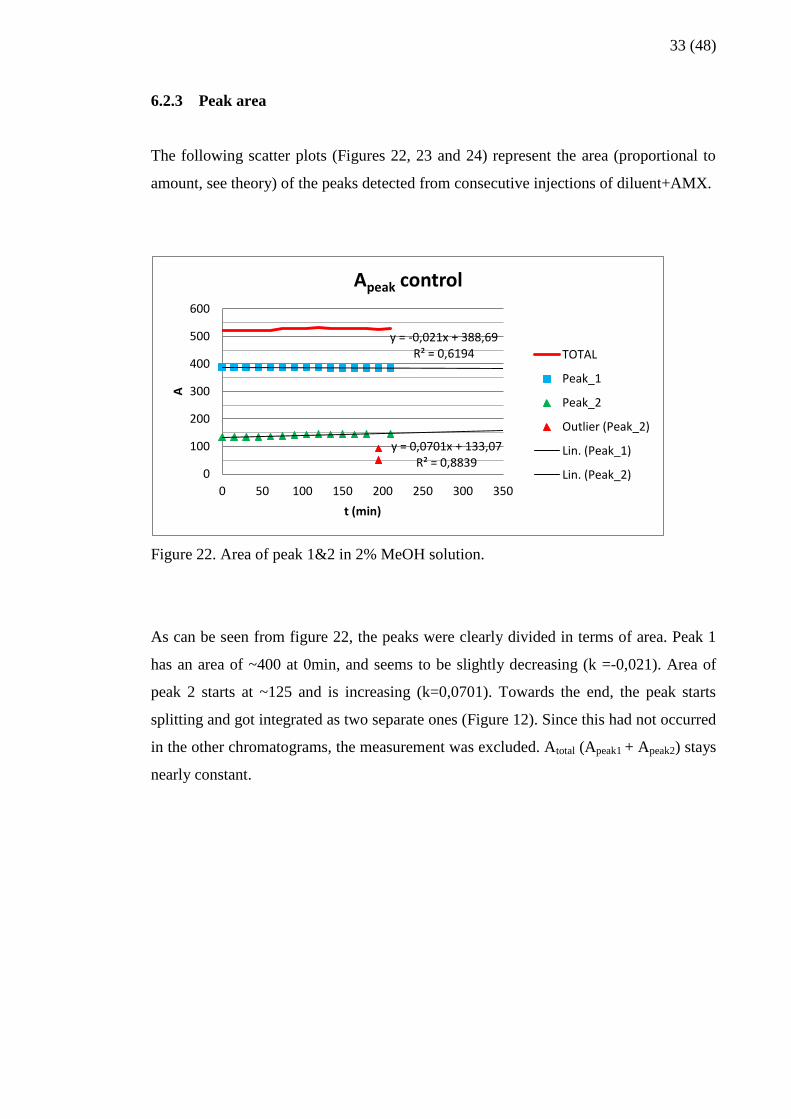
The following scatter plots (Figures 22, 23 and 24) represent the area (proportional to
amount, see theory) of the peaks detected from consecutive injections of diluent+AMX.
Figure 22. Area of peak 1&2 in 2% MeOH solution.
As can be seen from figure 22, the peaks were clearly divided in terms of area. Peak 1
has an area of ~400 at 0min, and seems to be slightly decreasing (k =-0,021). Area of
peak 2 starts at ~125 and is increasing (k=0,0701). Towards the end, the peak starts
splitting and got integrated as two separate ones (Figure 12). Since this had not occurred
in the other chromatograms, the measurement was excluded. Atotal (Apeak1 + Apeak2) stays
nearly constant.
y = -0,021x + 388,69 R² = 0,6194
y = 0,0701x + 133,07 R² = 0,8839
0
100
200
300
400
500
600
0 50 100 150 200 250 300 350
A
t (min)
Apeak control
TOTAL
Peak_1
Peak_2
Outlier (Peak_2)
Lin. (Peak_1)
Lin. (Peak_2)

34 (48)
Figure 23. Area of peak 1&2 in 200mM pH 8,5 phosphate buffer+ 2% MeOH solution.
In figure 23, Apeak1 and Apeak2 are practically the same at 0min. Apeak1 is decreasing (k=-
0.0726) while Apeak2 is increasing (k =0.0611). Atotal stays constant.
Figure 24. Area of peak 1&2 in 200mM pH 8,5 ammonium buffer+2% MeOH solution.
In figure 24, Apeak1 is ~100 at 0min and seems to be slightly decreasing (k =-0,0295).
Apeak2~340 at 0min and is rapidly increasing (k=0,2683). Atotal is increasing, but gets
stabilised at ~500.
y = -0,0726x + 256,19 R² = 0,9951
y = 0,0611x + 250,43 R² = 0,9571
0
100
200
300
400
500
600
0 50 100 150 200 250 300 350
A
t (min)
Apeak PO4 buffer
TOTAL
Peak_1
Peak_2
Lin. (Peak_1)
Lin. (Peak_2)
y = -0,0295x + 109,33 R² = 0,9151
y = 0,2683x + 348,14 R² = 0,8715
0
100
200
300
400
500
600
0 50 100 150 200 250 300 350
A
t (min)
Apeak NH4 buffer
TOTAL
Peak_1
Peak_2
Lin. (Peak_1)
Lin. (Peak_2)
35 (48)
7 DISCUSSION
7.1 Separate peaks
As the chromatograms display, every sample injection produced two peaks. This
suggests one of two things.
Either there are two compounds present in each sample. While one of these might have
been AMX, the other one remains unknown. Since no MS was performed, it was not
possible to verify that AMX was detected in its unchanged form, let alone to identify
the other compound. In this case, the phenomenon could be explained by impurities,
contamination or degradation.
The other possibility is that for some reason AMX appears as two peaks in the
chromatograms. This could be due to partial ionisation of the analyte.
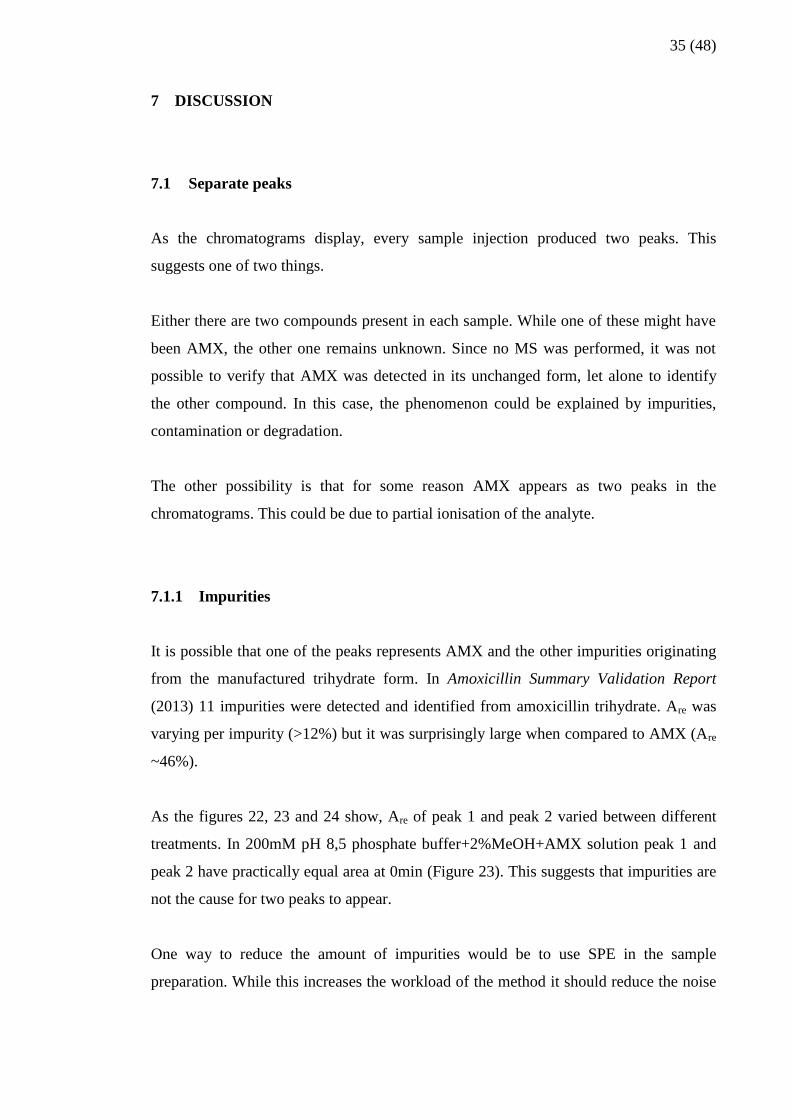
7.1.1 Impurities
It is possible that one of the peaks represents AMX and the other impurities originating
from the manufactured trihydrate form. In Amoxicillin Summary Validation Report
(2013) 11 impurities were detected and identified from amoxicillin trihydrate. Are was
varying per impurity (>12%) but it was surprisingly large when compared to AMX (Are
~46%).
As the figures 22, 23 and 24 show, Are of peak 1 and peak 2 varied between different
treatments. In 200mM pH 8,5 phosphate buffer+2%MeOH+AMX solution peak 1 and
peak 2 have practically equal area at 0min (Figure 23). This suggests that impurities are
not the cause for two peaks to appear.
One way to reduce the amount of impurities would be to use SPE in the sample
preparation. While this increases the workload of the method it should reduce the noise

36 (48)
in the chromatogram and so improve accuracy. However, the usage of automated SPE
system is recommended, since the manual method carries higher risk of human error.
7.1.2 Contamination
Considering the simplicity of sample preparation procedure and the used working
practices, contamination seems a very unlikely cause for separate peaks to appear in the
chromatogram.
7.1.3 Degradation products
On the other hand, there is a possibility that the separate peaks originate from
degradation products of AMX. One pathway of amoxicillin degradation in an aqueous
medium is transformation into AMX-penicilloic acid, and then into ADP (Lamm et al.,
2009). ADP is further divided into two isomers (Lamm et al., 2009). Both AMX and
ADP have similar UV spectrum, meaning that if these were present in the same sample,
both would detected (Lamm et al., 2009). However, in order to verify this MS is
necessary.
7.1.4 Partial ionisation
Another explanation is that the peaks represent the same compound in ionised and non
ionised form. As it is commonly known, ionisation of analyte in the mobile phase can
lead to peak splitting (Basniwal, Jain, 2013). When the ionisation time is considerably
longer than the retention time for the compound, it is possible that two separate peaks
will appear (Dolan, 2013). In reverse phase chromatography, the first peak represents
the ionised part and the second the non ionised part of the compound.
According to Dolan (2013) it is possible to affect the way the molecule is behaving
inside the column by changing the pH of the mobile phase. More acidic eluent forces
the analytes to stay in their non ionised (also non polar) form and thus retain longer in

37 (48)
revered phase separation (Dolan, 2013; Basniwal and Jain, 2013; Nägele and Moritz,
2005). More alkaline eluent increases ionisation and decreases interaction with the
column.
The matter could be verified by trying mobile phase of different pH and see how this
affects the chromatograms. If more acidic eluent produces a single peak for the analyte,
the cause for peak separation was partial ionisation. Trying this is out is encouraged by
other HPLC methods using a more acidic (pH=4,8/5,0) phosphate buffer as mobile
phase (de Abreu et al., 2003; Phenomenex, 2014; Rao et al., 2011).
7.2 Peak shape distortions
Peak 1 did not show signs of distortions in any of the treatments. In all cases, the peak
shape was ideal (Bhanot, 2014). This suggested that the experimental conditions were
optimal for this compound.
Peak 2, on the other hand, behaved very differently in each treatment. Phosphate buffer
had the least distortion out of the three treatments. Ammonium buffer had some, but the
worst distortions were found in control. The mobile phase stayed practically the same,
as did the experimental conditions.
The distortion can be due to incompatibility of the unionized form of amoxicillin (peak
2) with the current mobile phase. Change in eluent pH is not likely, as peak 1 had not
been affected. Change in column temperature is as unlikely for the same reason.
Peak shape distortions may have had some effect on the integration process and the way
RT is determined. If the tip of a peak is split, it gets integrated as two separate peaks.
On the other hand, the middle point of a broadening peak is moving horizontally. This
directly affects RT, but still fails to fully explain the quite strong fluctuations of RTpeak2.
38 (48)
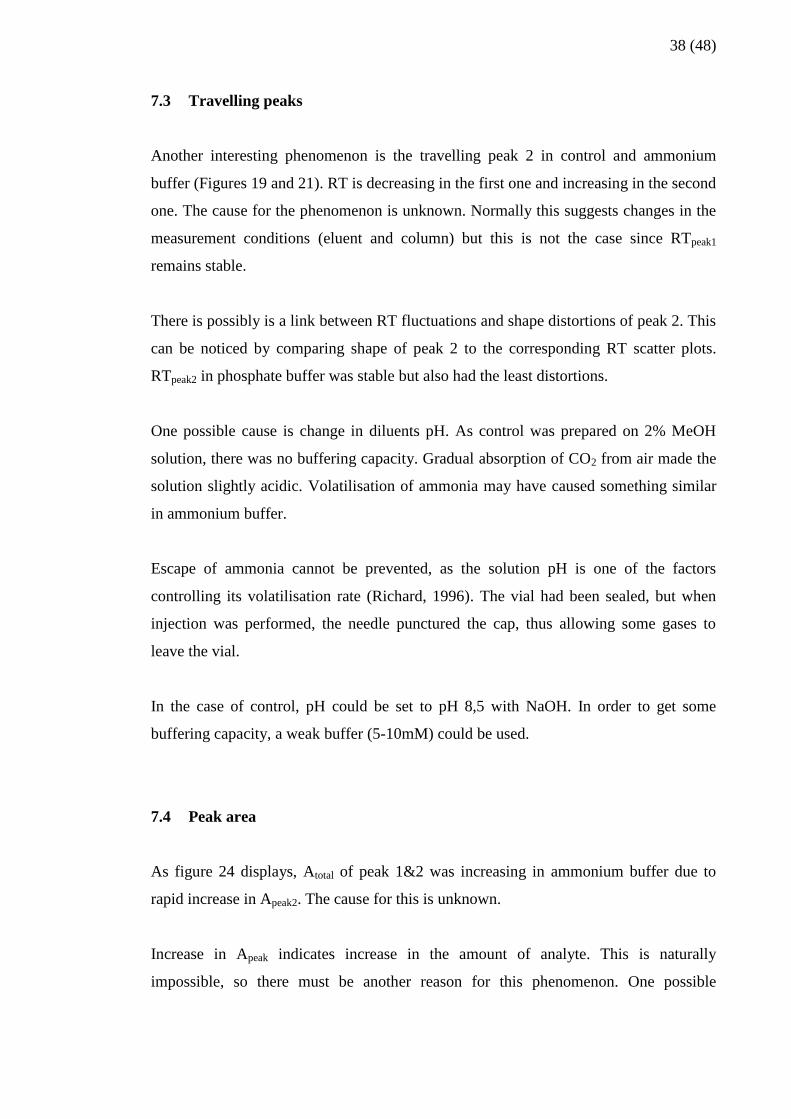
7.3 Travelling peaks
Another interesting phenomenon is the travelling peak 2 in control and ammonium
buffer (Figures 19 and 21). RT is decreasing in the first one and increasing in the second
one. The cause for the phenomenon is unknown. Normally this suggests changes in the
measurement conditions (eluent and column) but this is not the case since RTpeak1
remains stable.
There is possibly is a link between RT fluctuations and shape distortions of peak 2. This
can be noticed by comparing shape of peak 2 to the corresponding RT scatter plots.
RTpeak2 in phosphate buffer was stable but also had the least distortions.
One possible cause is change in diluents pH. As control was prepared on 2% MeOH
solution, there was no buffering capacity. Gradual absorption of CO2 from air made the
solution slightly acidic. Volatilisation of ammonia may have caused something similar
in ammonium buffer.
Escape of ammonia cannot be prevented, as the solution pH is one of the factors
controlling its volatilisation rate (Richard, 1996). The vial had been sealed, but when
injection was performed, the needle punctured the cap, thus allowing some gases to
leave the vial.
In the case of control, pH could be set to pH 8,5 with NaOH. In order to get some
buffering capacity, a weak buffer (5-10mM) could be used.
7.4 Peak area
As figure 24 displays, Atotal of peak 1&2 was increasing in ammonium buffer due to
rapid increase in Apeak2. The cause for this is unknown.
Increase in Apeak indicates increase in the amount of analyte. This is naturally
impossible, so there must be another reason for this phenomenon. One possible

39 (48)
explanation is that the volatilisation of ammonia disturbed the separation process in the
column, thus affecting the results.
Normally Atotal is not a good indicator of degradation, since the degradation products of
the original compound will absorb some UV radiation. Therefore concluding remarks
were not done based on Atotal values.
7.5 Degradation
As the data presented too many uncertainties, it was not possible to observe degradation
of the detected compound(s). While some molecular changes might have occurred,
these could not be identified due to the shape distortions and travelling peaks in the case
of control and ammonium buffer.
It has been reported that “ionic strength is one of the important factors responsible for
amoxicillin degradation” in alkaline solutions (Kakimoto and Funamizu, 2006; Rao et
al., 2011). This had not been controlled in this experiment, which could be one of the
reasons why no degradation was observed.
Another major issue is that MeOH might have been unsuitable to be used as a solvent
for the stock solution of AMX. It is possible that AMX had started to degrade in the
95% MeOH solution during storage. Rao et al. (2011) states that “degradation of
amoxicillin (sodium salt) at higher concentration became faster in the presence of ...
alcohols”. While AMX used in this experiment was trihydrate form, it still might have
behaved in a similar manner in the presence of MeOH.
Appendix A displays an interesting phenomenon, where peak 2 was changing into
another compound in the phosphate and ammonium buffers. This had occurred during
method development. While this could not be reproduced in the actual experiment, it
was an important observation.
40 (48)
8 CONCLUSION
In HPLC measurements two analyte peaks were detected per every injection. One of
these could have been AMX and the other a degradation product. However, as no MS
was performed, it was not possible to identify the compound(s).
Separate peaks might have been caused by partial ionisation of the analyte. On the other
hand, it could be that AMX had started to change in the 95% MeOH stock solution,
therefore having some degradation products already before spiking. This matter requires
confirmation.
While peak 2 displayed molecular changes in phosphate and ammonium buffers during
method development, this phenomenon could not be reproduced in the experiments.

41 (48)
9 POSSIBILITIES FOR FUTURE WORK
The experiments left several issues open.
Firstly, it would be interesting to know how more acidic eluent would affect the way the
peaks are formed. There is also possibility for applying altogether different eluent for
this method. In previous work a 10mM ammonium formate + 0.3% formic acid eluent
(Ishiduka, 2013) was used in a LC/MS method to measure SMZ, AMX, OTC and TYL
from a single injection using multiple channels.
The method of preparing the stock solution needs critical approach. While using the
MeOH solution had its advantages, it is possible that it is unsuitable for this
pharmaceutical due to instability of AMX in the solution. A weak acid or alkaline
solution could be tried.
Future experiments could be performed using a single buffer solution at different
strengths (for example 50mM, 100mM, 400mM). However, there is a possibility that
more peak distortions will occur when using a stronger diluent solution.
Another interesting topic would be to identify the different peaks detected. This
information would be beneficial in determining the cause(s) for separate peaks to appear
in the chromatogram.

42 (48)
10 ACKNOWLEDGEMENTS
This thesis was funded by Tampere University of Applied Sciences.
Regarding my thesis work, I want to thank my thesis supervisor Hilda Szabo and Heli
Knuutila for their support and advice. I also want to thank Professor Naoyuki Funamizu
for taking me under his guidance during my internship in Hokkaido University. Special
thanks belong to my former senior colleagues Sarasa Ishiduka and Sebastian Charchalac
for teaching me the basics of liquid chromatography.

43 (48)
11 REFERENCES
11.1 World Wide Web page
Animal Health Institute (2014) Pharmaceuticals
[Online], Available: http://www.ahi.org/about-animal-medicines/pharmaceuticals/ [17.5.2014]
Basniwal, P. K. and Jain D. (2013) ICH guideline practice: application of validated RP-HPLC-
DAD method for determination of tapentadol hydrochloride in dosage form [Online], Available:
http://www.jast-journal.com/content/4/1/9# [14.4.2014]
Bhanot, D. (2014) Common Peak Shape Distortions in HPLC and their Prevention [Online],
Available: http://lab-training.com/2014/01/17/common-peak-shape-distortions-in-hplc-and-
their-prevention/ [20.5.2014]
Clark, J. (2007) HIGH PERFORMANCE LIQUID CHROMATOGRAPHY - HPLC [Online],
Available: http://www.chemguide.co.uk/analysis/chromatography/hplc.html [19.4.2014]
Clark, J. (2007) COLUMN CHROMATOGRAPHY [Online], Accessed:
http://www.chemguide.co.uk/analysis/chromatography/column.html - top [25.4.2014]
Clark, J. (2007) THIN LAYER CHROMATOGRAPHY [Online], Accessed:
http://www.chemguide.co.uk/analysis/chromatography/thinlayer.html - top [25.4.2014]
Clark, J. (2007) USING UV-VISIBLE ABSORPTION SPECTRA [Online], Available:
http://www.chemguide.co.uk/analysis/uvvisible/analysis.html - top [27.4.2014]
Clark, J. (2002) buffer solutions [Online], Available:
http://www.chemguide.co.uk/physical/acidbaseeqia/buffers.html [22.5.2014]
Types of HPLC [Online],
Available: http://hplc.chem.shu.edu/NEW/HPLC_Book/Introduction/int_typs.html [25.4.2014]
Chemical Book (2010) Oxytetracycline hydrochloride [Online], Available:
http://www.chemicalbook.com/ChemicalProductProperty_EN_CB9311671.htm
[21.4.2014]
Chemistry Archive, Molarity of Concentrated Reagents [Online], Available:
https://www.erowid.org/archive/rhodium/chemistry/equipment/molarity.html [9.4.2014]
ChemSpider (2014) Amoxicillin [Online], Available: http://www.chemspider.com/Chemical-
Structure.31006.html?rid=a4e6e5c1-e961-48fb-b6c3-dd91e91d17eb [21.4.2014]
ChemSpider (2014) Sulfamethoxazole [Online], Available:
http://www.chemspider.com/Chemical-Structure.5138.html?rid=7a2cc612-19ff-4a9a-8198-
e79286cd495a [21.4.2014]
Chromatography - The Chromatogram [Online], Available: http://www.rpi.edu/dept/chem-
eng/Biotech-Environ/CHROMO/chromgram.html [25.4.2014]
Crosta, P. (2012) What Is Amoxicillin? What Does Amoxicillin Treat? [Online], Available:
http://www.medicalnewstoday.com/articles/158481.php [19.5.2014]
44 (48)
de Abreu, L. R. P. et al. (2003) HPLC determination of amoxicillin comparative bioavailability
in healthy volunteers after a single dose administration [Online], Available:
http://www.ualberta.ca/~csps/JPPS6(2)/L.Abreu/amoxicillin.htm - Corresponding%20Author
[29.5.2014]
Deman, G. (2011) Ultraviolet Radiation [Online], Available:
http://hps.org/hpspublications/articles/uv.html [27.4.2014]
Dolan, J. (2013) HPLC Solutions #7: Do I get Two Peaks for Ionic Compounds? [Online],
Available: http://www.sepscience.com/Techniques/LC/Articles/699-/HPLC-Solutions-7-Do-I-
get-Two-Peaks-for-Ionic-Compounds [20.5.2014]
Drug Future (2013) Amoxicillin [Online], Available:
http://www.drugfuture.com/chemdata/amoxicillin.html [29.5.2014]
Drugs (2014) Amoxicillin [Online], Available: http://www.drugs.com/amoxicillin.html
[19.5.2014]
EurActiv (2014) Sweden uses the fewest antibiotics in food production [Online], Available:
http://www.euractiv.com/health/sweden-uses-fewest-antibiotics-f-news-532720 [19.5.2014]
Jang Lee, H. et al. (2013) Comparison of blood concentration for oral administration of
micronized and non-micronized amoxicillin in Sprague-Dawley rats [Online], Available:
http://www.jbr.or.kr/index.php?document_srl=3301&mid=ContentofPastissues [29.5.2014]
Mackie, B. (2011) Lessons from Europe on reducing antibiotic use in livestock [Online],
Available: http://www.bcmj.org/council-health-promotion/lessons-europe-reducing-antibiotic-
use-livestock [18,5.2014]
Martin, D. F., Martin B. B. Ward, D. R. (2010) AGRICULTURAL PHARMACEUTICALS IN
THE ENVIRONMENT: A NEED FOR INVENTIVENESS [Online], Available:
http://chemistry.usf.edu/faculty/data/Martin-Publication2.pdf [17.5.2014]
MedlinePlus (2010) Amoxicillin [Online], Available:
http://www.nlm.nih.gov/medlineplus/druginfo/meds/a685001.html [19.5.2014]
Phenomenex (2014) Phenomenex HPLC Application #3258 Amoxicillin - USP Method
[Online], Available:
http://www.phenomenex.com/Application/Detail/3258?alias=Amoxycillin&returnURL=/Applic
ation/Search [25.3.2014]
Richard, T. (1996) Ammonia Odors [Online], Available:
http://compost.css.cornell.edu/odors/ammonia.html [8,5.2014]
RT (2014) ‘Devastating’ implications of drug-resistant superbugs now a reality – WHO
[Online], Available: http://rt.com/news/155900-superbugs-un-antibiotic-resistance/ [18,5.2014]
terracult, What does "soil buffering" mean? [Online], Available:
http://www.terracult.com/faq/what-does-soil-buffering-mean [25.5.2014]
The Wall Street Journal (2013) The Drugs in Our Beef: Bigger Cows, More Worries [Online],
Available: http://blogs.wsj.com/corporate-intelligence/2013/08/08/the-drugs-in-our-beef-bigger-
cows-more-worries/[18,5.2014]

45 (48)
YLE 1 (2013) Tanskan sioille syötetään antibiootteja - kasvattajat saavat sairaalabakteerin
[Online], Available: http://yle.fi/uutiset/tanskan_sioille_syotetaan_antibiootteja_-
_kasvattajat_saavat_sairaalabakteerin/6559106 [18,5.2014]
YLE 2 (2013) Suomen jokivesiin päätyy makeutusaineita - ympäristövaikutukset epäselvät
[Online], Available:http://yle.fi/uutiset/suomen_jokivesiin_paatyy_makeutusaineita_-
_ymparistovaikutukset_epaselvat/6615743 [18,5.2014]
YLE 3 (2013) "Ympäristön lääkejäämistä kannattaa olla huolissaan" [Online], Available:
http://yle.fi/uutiset/ympariston_laakejaamista_kannattaa_olla_huolissaan/6906755 [12.1.2014]
11.2 Literature
(2001) Merck Index, 13th ed., p. 96, Whitehouse Station, NJ
(2013) AMOXICILLIN Summary Validation Report
Grave, K. et al. (2010) Comparison of the sales of veterinary antibacterial agents between 10
European countries, Journal of Antimicrobial Chemotherapy, London
Ishiduka, S. (2013) Degradation of veterinary medicines in composting process of livestock
manure, Hokkaido University, Japan
Kakimoto, T. and Funamizu, N. (2006) Factors affecting the degradation of amoxicillin in
composting toilet, Hokkaido University, Japan
Lamm, A. et al. (2009) Detection of amoxicillin-diketopiperazine-2´, 5´ in wastewater samples,
Journal of Environmental Science and Health Part A
Lewis, R. and Evans, W. (2001) chemistry, 2nd
ed. Palgrave
Lunn, G. (2000) HPLC Methods for Pharmaceutical Analysis, Vol. 2, p. 385, New York, John
Wiley & Sons, Inc.
Nägele, E. and Moritz, R. (2005) Structure Elucidation of Degradation Products of the
Antibiotic Amoxicillin with Ion Trap MSn and Accurate Mass Determination by ESI TOF
Rao, R. et al. (2011) Amoxicillin: A Broad Spectrum Antibiotic, International Journal of
Pharmacy and Pharmaceutical Sciences
46 (48)
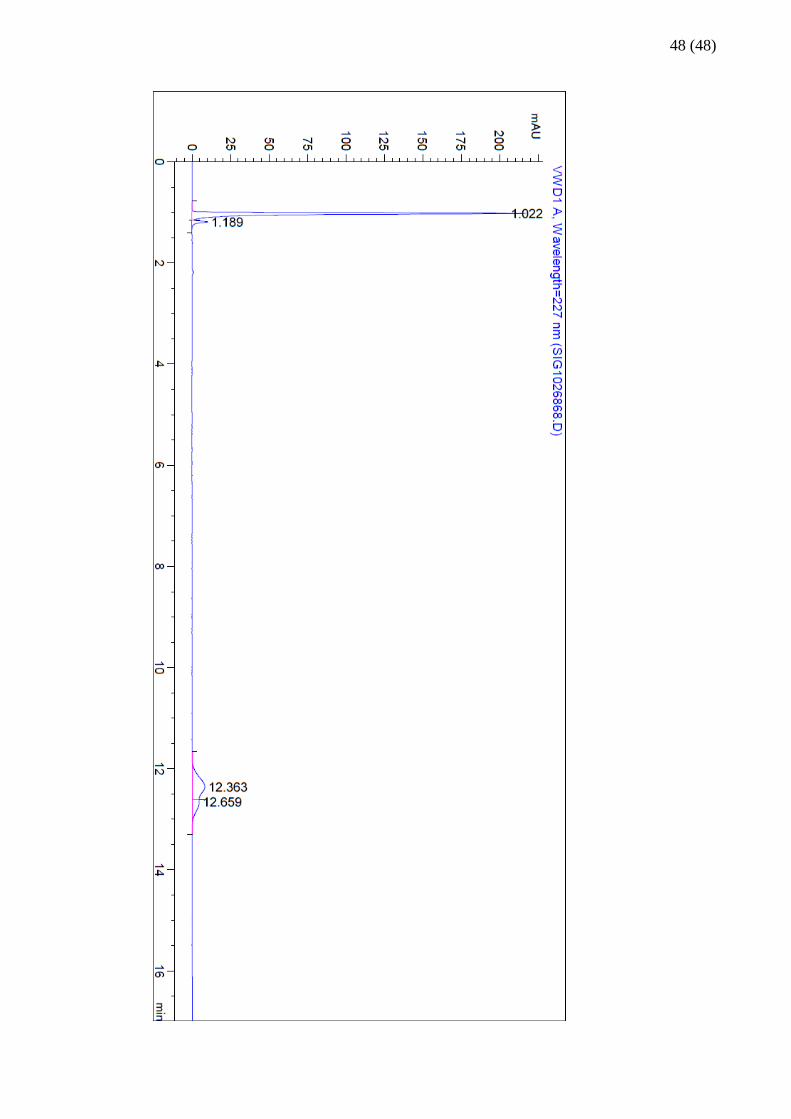
12 APPENDIX A
Chromatogram for 200mM pH 8,5 phosphate buffer+1,5% MeOH+15ppm AMX
injection (45min) (SIG1026833).
Chromatogram for 200mM pH 8,5 ammonium buffer+1,5% MeOH+15ppm AMX
injection (51min) (SIG1026868).

47 (48)
48 (48)


