Occasional Paper Series EU consumers’ quantitative inflation perceptions and expectations: an evaluation Rodolfo Arioli, Colm Bates, Heinz Dieden, Ioana Duca, Roberta Friz, Christian Gayer, Geoff Kenny, Aidan Meyler, Iskra Pavlova Disclaimer: This paper should not be reported as representing the views of the European Central Bank (ECB). The views expressed are those of the authors and do not necessarily reflect those of the ECB. No 186 / April 2017
Transcript
Occasional Paper Series EU consumers’ quantitative inflation perceptions and expectations: an evaluation
Rodolfo Arioli, Colm Bates, Heinz Dieden, Ioana Duca, Roberta Friz, Christian Gayer,
Geoff Kenny, Aidan Meyler, Iskra Pavlova
Disclaimer: This paper should not be reported as representing the views of the European Central Bank (ECB). The views expressed are those of the authors and do not necessarily reflect those of the ECB.
No 186 / April 2017
Occasional Paper Series No 186 / April 2017 1
Contents
Abstract 3
Executive Summary 4
1 Introduction 6
2 The EC Consumer Survey 8
2.1 The dataset on qualitative inflation perceptions and expectations 8
2.2 The dataset on quantitative inflation perceptions and expectations 11
2.3 The dataset used for the current analysis 13
2.4 The aggregation of survey results at euro area and EU level 15
3 Empirical features of the experimental dataset: Consumers’ quantitative estimates of inflation 17
3.1 Consumers’ quantitative inflation estimates and actual HICP 17
3.2 Country results 21
3.3 Does the overestimation bias depend on the design of the survey questions and the methodology used to aggregate results? 25
3.4 Alternative measures of ‘official’ inflation 28
3.5 Different people, different inflation assessments 29
3.6 Cross-checking quantitative and qualitative replies 35
3.7 Business cycle effects 40
4 Comparative assessment of consumers’ quantitative versus qualitative replies in the euro area and the EU 44
4.1 Distribution of replies and outliers 44
4.2 Trimming measures 49
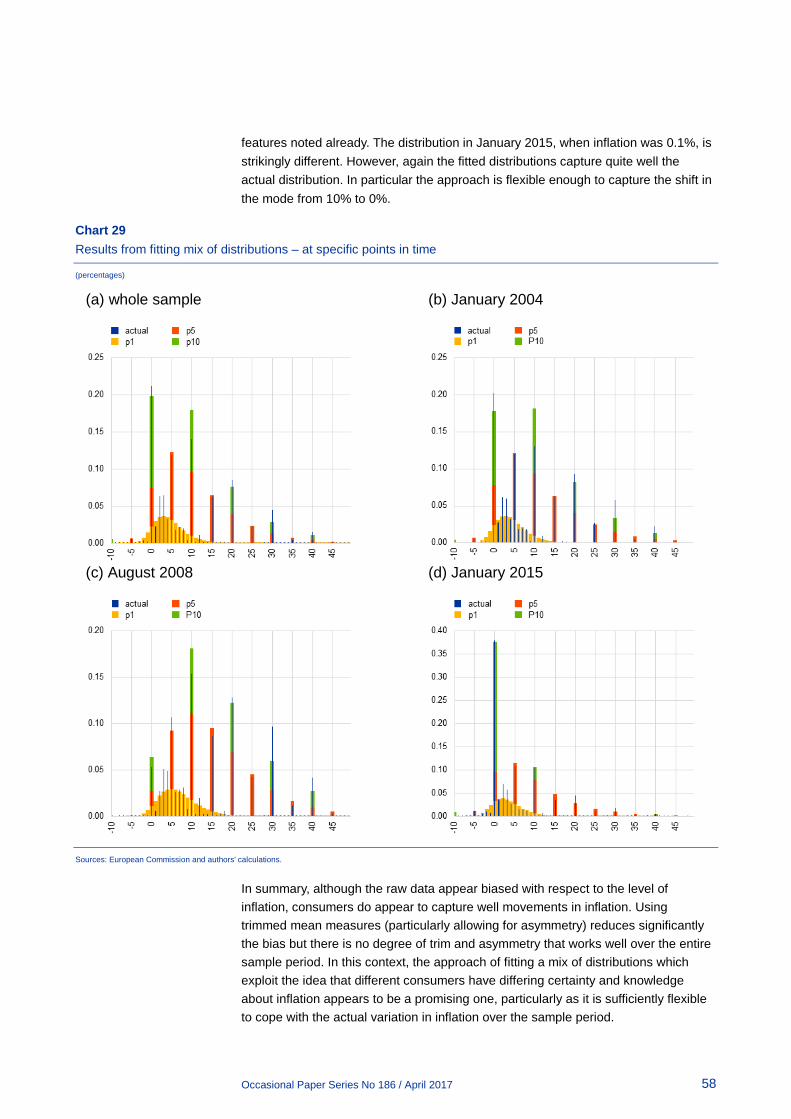
4.3 Fitting distributions to replies 53
5 Quantitative measures of inflation expectations: A review of future research potential 59
5.1 Expectations formation and the Phillips Curve 59
Occasional Paper Series No 186 / April 2017 2
5.2 Cross-sectional analysis of consumer spending and savings behaviour 60
5.3 Monetary policy effectiveness and central bank credibility 62
6 Summary and conclusions 64
Annex 1 Charts on consumers’ quantitative estimates of inflation perceptions and expectations in euro area countries 67
Annex 2 Different people, different inflation assessments – charts for the euro area 70
Annex 3 Quantitative and qualitative inflation – charts for the euro area 73
Annex 4 How do inflation expectations impact on consumer behaviour? 76
References 79
Acknowledgements 82
Occasional Paper Series No 186 / April 2017 3
Abstract
This report updates and extends earlier assessments of quantitative inflation perceptions and expectations of consumers in the euro area and the EU, using an anonymised micro data set collected by the European Commission in the context of the Harmonised EU Programme of Business and Consumer Surveys. Confirming earlier findings, consumers' quantitative estimates of inflation are found to be higher than actual HICP (Harmonised Index of Consumer Prices) inflation over the entire sample period (2004-2015). The analysis shows that European consumers hold different opinions of inflation depending on their income, age, education and gender. Although many of the features highlighted for the EU and the euro area aggregates are valid across individual Member States, differences exist also at the country level. Despite the higher inflation estimates, there is a high level of co-movement between measured and estimated (perceived/expected) inflation. Even respondents providing estimates largely above actual HICP inflation, demonstrate understanding of the relative level of inflation during both high and low inflation periods. Based on these economically plausible results, the report concludes that further work should be devoted to defining concrete aggregate indicators of consumers' quantitative inflation perceptions and expectations on the basis of the dataset used in this study. Moreover, it outlines a number of future research topics that can be addressed by exploiting the enormous potential of the data set.
JEL Classification: D8, D12, E31
Keywords: Harmonised EU Programme of Business and Consumer Surveys, inflation perceptions, inflation expectations, quantitative and qualitative indicators, micro data set, consumers, co-movement, HICP.
Occasional Paper Series No 186 / April 2017 4
Executive Summary
This report updates and extends earlier assessments of quantitative inflation perceptions and expectations of consumers in the euro area and the EU, using an anonymised micro data set collected by the European Commission (EC) in the context of the Harmonised EU Programme of Business and Consumer Surveys. Quantitative inflation perceptions and expectations have been collected since 2003/04. Confirming earlier findings, consumers' quantitative estimates of inflation continue to be higher than actual HICP inflation over the entire sample period, including during the period of the economic crisis, the subsequent recovery and the on-going period of low-inflation.
The analysis also shows that European consumers hold different opinions about inflation depending on their income, age, education and gender. On average, male, high income earners and highly educated individuals tend to provide lower inflation estimates. The higher estimates of inflation by consumers appear to be partly linked to the survey design, in terms of wording of the questions, sample design and interview methodology. Understanding the factors that can explain this heterogeneity and its implications for the functioning of the macroeconomy and the transmission of policies is a key question that warrants further research.
Although many of the features highlighted for the EU and the euro area aggregates are also valid across individual EU Member States, differences exist. For instance, the difference between consumer estimates and official inflation in the group of Nordic countries is generally below the difference for the euro area or EU.
The quantitative inflation estimates are found to be consistent with the results from the corresponding qualitative survey questions, where respondents can simply express if consumer prices have gone up, remained unchanged or have been falling without providing a specific number. Here, respondents who indicate rising inflation for the qualitative questions generally report higher inflation rates also for the quantitative questions.
The analysis establishes a high level of co-movement between measured and estimated (perceived/expected) inflation; thus even where respondents provide estimates largely above actual HICP inflation, they demonstrate understanding of the relative level of inflation during both high and low inflation periods. Moreover, using trimmed mean measures (particularly allowing for asymmetry) proves an effective means to significantly reduce the bias in the data. Alternatively, the approach of fitting a mix of distributions which exploits the idea that different consumers have differing certainty and knowledge about inflation appears to be promising, as it proves sufficiently flexible to cope with the actual variation in inflation over the sample period. Overall, these results suggest that the quantitative measures contain interesting and useful information once account is made for differences across respondents in terms of their certainty regarding quantifying inflation.
Occasional Paper Series No 186 / April 2017 5
Based on these results underlining the quality and usefulness of the micro-data set of European consumer inflation estimates, the report concludes that further work should be devoted to defining aggregate indicators of consumers' quantitative inflation perceptions and expectations from the data. In particular a quantitative indicator on inflation expectations should ideally provide timely information on the consumers’ inflation outlook that could enrich the currently available set of forward-looking inflation estimates from e.g. professional forecasters and capital markets.
Moreover, the analysis in the report highlights a number of research topics that can be addressed using the data; to exploit its full potential for cross-country, EU and euro area-wide research purposes, wider access to the anonymised micro data set would be desirable. As regards the future use for research as well as analytical purposes, the granularity of the EC dataset provides potential to study many issues that, although they are very important for monetary policy, are still not completely understood. This includes understanding the process governing the formation of household inflation expectations and its impact on the Phillips curve, the role of inflation expectations in explaining consumer behaviour at a disaggregated level, as well as the assessment of the effectiveness of central bank policies and their communication to households.
Occasional Paper Series No 186 / April 2017 6
1 Introduction
Since May 2003, the European Commission has been collecting via its consumer opinion survey direct quantitative information on consumers’ inflation perceptions and expectations in the euro area, the European Union (EU) and candidate countries. Two questions were added to the existing, qualitative, monthly questionnaire, which provide a subjective measure of (perceived and expected) inflation as expressed by consumers. These questions convey information about consumers’ opinions of inflation, complementary to those derived from the qualitative measures contained in the harmonised EU survey, and broaden the data set available for the analysis of inflation developments in the euro area. Further, building quantitative measures is relevant for policy purposes because they allow assessing both changes in the level of consumers’ inflation perception/expectations as well as the magnitude of these changes.
However, they do not provide an objective measure of inflation, alternative to that embedded in more formal indices of consumer prices, such as the Harmonised Index of Consumer Prices (HICP).
The results of the questions on consumers’ quantitative inflation perceptions and expectations have so far not been part of the European Commission's comprehensive monthly survey data releases.1 Neither has the (anonymised) micro data set on consumers’ quantitative inflation perceptions and expectations been publicly released. Following the agreement between the European Commission (DG ECFIN) and its EU partner institutes that perform the data collection at national level, the ECB was given access to the (anonymised) micro data set for the purpose of conducting the present evaluation and related future research jointly with DG ECFIN.2
Expectations about future developments of inflation have a central role in many fields of macroeconomic theory. In monetary policymaking, inflation expectations help to gauge the general public’s perception of the central bank’s commitment to maintain stable and low rates of inflation – and hence provide a measure of policy credibility. When inflation is high, monitoring expectations and perceptions provides a tool to assess the risk of second-round effects on inflation. Furthermore, in the current environment of low inflation, where several major central banks have embarked on unconventional policy actions, ensuring that inflation expectations remain well anchored, particularly in the medium to long run, remains a key policy objective.
A preliminary assessment of the EC quantitative dataset was provided by Lindén (2005) and Biau et al. (2010) which highlighted a large difference between inflation estimates by euro area consumers and actual inflation, both in terms of inflation perceptions and expectations, as well as a wide dispersion of results across 1 See DG ECFIN's business and consumer survey (BCS) website at BCS website 2 The consumer micro-data results are not part of the data that the European Commission can release
without consultation of its data-collecting national partner institutes, which remain the data owners.
individual responses.3 Current data cover the period of the economic crisis and the subsequent recovery as well as the ongoing period of low inflation and subdued economic growth thereafter; the aim of the present report is to provide an updated view and evaluation of the data set, focusing in particular on recent developments, and to contribute to the ongoing discussion on the relevance and usefulness of such quantitative measures of inflation sentiment.
For both the euro area and European Union as a whole, also the present findings confirm that consumers generally provide higher inflation estimates when compared with actual inflation developments, particularly in terms of inflation perceptions. While the report presents several promising statistical techniques to significantly reduce the gap, it should be noted that the aim of the quantitative inflation questions is not to mimic actual HICP inflation, which is already a very timely official indicator of inflation itself. There are many reasons why perceived inflation can differ from actual inflation (subjective versus objective consumption weights, non-adjustment for quality changes, etc.).4
Although the raw data are biased with respect to the level of inflation, consumers appear to capture movements in inflation during both high and low inflation periods. Based on this finding, the report outlines several important research directions to be pursued with the data on consumer inflation expectations. Eventually the use of (anonymised) micro data on the quantitative inflation questions may become a valuable source for economic analysis, also as regards socio-demographic results for several groups of consumers.
The paper is structured as follows. Section 2 introduces the main methodological aspects of the EC consumer opinion survey and details the aggregation of survey results at euro area level for qualitative and quantitative replies. Section 3 presents the empirical and statistical features of the experimental data set, highlighting the different approaches to measure qualitative and quantitative price developments in the euro area as a whole, in selected countries and outside the euro area. Furthermore aspects of dispersion between different socio-demographic groups of consumers as well as the distribution of consumers’ replies are also analysed in this section. Section 4 comparatively assesses consumers’ quantitative versus qualitative replies by extracting information from the quantitative measures by (symmetric and asymmetric) trimming and fitting a mix of distributions. Section 5 identifies future research potentials of the quantitative consumer inflation perceptions and expectations; Section 6 summarises and concludes.
3 For a more recent discussion, see also European Commission (2014) European Business Cycle
Indicators, 3, October. (Cycle Indicators) 4 Such questions are typically discussed at psychological science and behavioural economics and are
not addressed in this Report. Bruine de Bruin (2013) argues that “psychological theories suggest that consumers pay more attention to price increases than to price decreases, especially if they are large, frequently experienced, and already a focus of consumers’ concern” (p. 281); further references to respective literature is available in this article as well.
2.1 The dataset on qualitative inflation perceptions and expectations
Consumers’ qualitative opinions on inflation developments in the euro area are polled regularly by national partner institutes in the EU Member States on behalf of the European Commission (DG ECFIN) as part of the “Joint Harmonised EU Programme of Business and Consumer Surveys”.5 The surveys are designed to be representative at the national level. In the EU, every month, around 41,000 randomly selected consumers are asked two questions about inflation.6 The first question refers to consumers’ perceptions of past inflation developments:
Q5 - “How do you think that consumer prices have developed over the last 12 months? They have:
1. risen a lot;
2. risen moderately;
3. risen slightly;
4. stayed about the same;
5. fallen;
6. don’t know.”
The second question polls their expectations about future inflation developments:
Q6 - “By comparison with the past 12 months, how do you expect that consumer prices will develop over the next 12 months? They will:
1. increase more rapidly;
2. increase at the same rate;
5 The consumer survey was integrated in the Joint Harmonised EU Programme in 1971. Its main
purpose is to collect information on households’ spending and savings intentions, and to assess their perception of the factors influencing these decisions. To this end, the questions are organised around four topics: the general economic situation (including views on consumer price developments), households’ financial situation, savings and intentions with regard to major purchases. National partner institutes – statistical offices, central banks, research institutes or private market research companies – conduct the survey using a set of harmonised questions defined by the Commission, which also recommends comparable techniques for the definition of the samples and the calculation of the results. Further information can be found in the Methodological User Guide, which is available for download from DG ECFIN’s website at: Methodological User Guide
6 The survey method is via Computer Assisted Telephone Interviewing (CATI) system in most countries. However, in some countries face-to-face interviews and/or online surveys are conducted. The number surveyed compares with approximately 500 telephone interviews with adults living in households in monthly ‘Michigan’ Survey of Consumers in the United States.
Chart 1 shows the distribution of the various response categories for the two questions in the EU and euro area since 1999.
Chart 1 Consumers’ qualitative opinions on inflation developments in the EU and the euro area: categories of replies
(percentage, not seasonally adjusted)
Source: European Commission
An aggregate measure of consumers’ opinions – the “balance statistic” – is calculated as the difference between the relative frequencies of responses falling in different categories. Answers are weighted using a scheme that attributes to the
(a) euro area - perceptions (b) euro area - expectations
(c) EU - perceptions (d) EU - expectations
Occasional Paper Series No 186 / April 2017 10
answers [1] and [5] twice the weight of the moderate responses [2] and [4]; the middle response [3] and the “don’t know” response [6] are attributed zero weights. The balance statistic is thus computed as:
P[1] + ½ P[2] – ½ P[4] – P[5],
where P[i] is the frequency of response [i] (i = 1, 2, …, 6). The balance statistic ranges between ±100.
Given the qualitative nature of the questions, the series only provide information on the directional change in prices over the past and next 12 months, but with no explicit indication of the magnitude of the perceived and expected rate of inflation.
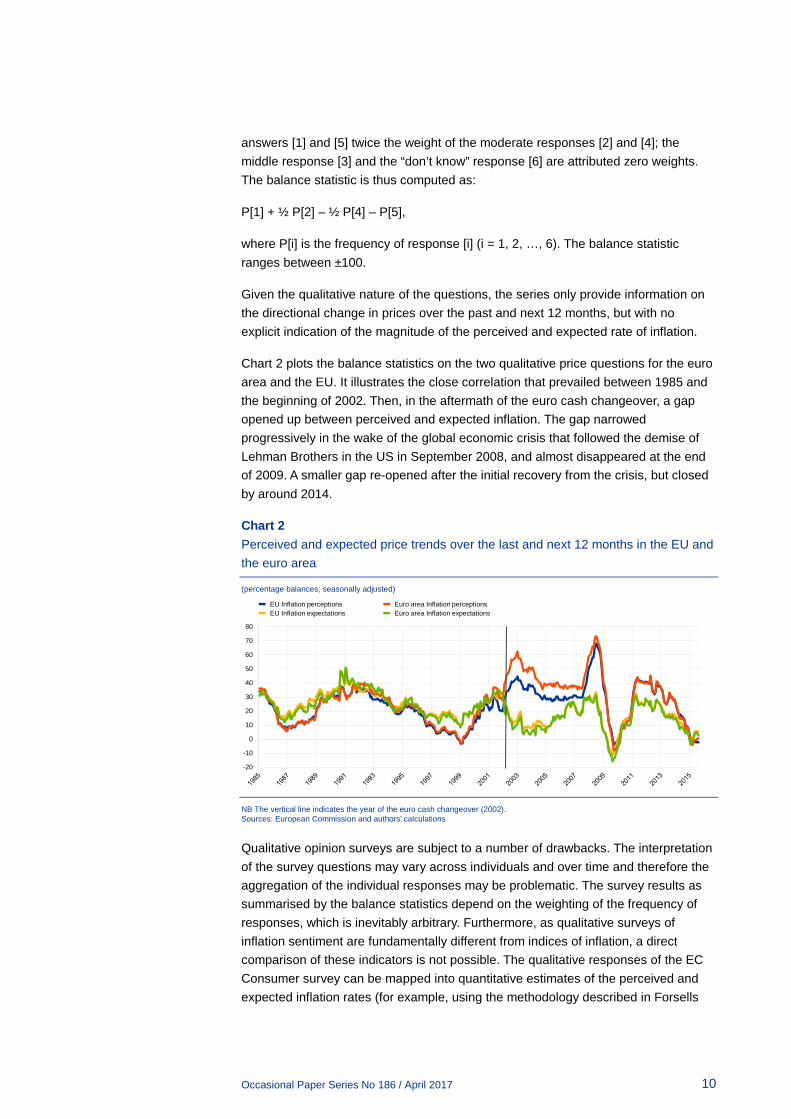
Chart 2 plots the balance statistics on the two qualitative price questions for the euro area and the EU. It illustrates the close correlation that prevailed between 1985 and the beginning of 2002. Then, in the aftermath of the euro cash changeover, a gap opened up between perceived and expected inflation. The gap narrowed progressively in the wake of the global economic crisis that followed the demise of Lehman Brothers in the US in September 2008, and almost disappeared at the end of 2009. A smaller gap re-opened after the initial recovery from the crisis, but closed by around 2014.
Chart 2 Perceived and expected price trends over the last and next 12 months in the EU and the euro area
(percentage balances; seasonally adjusted)
NB The vertical line indicates the year of the euro cash changeover (2002). Sources: European Commission and authors' calculations
Qualitative opinion surveys are subject to a number of drawbacks. The interpretation of the survey questions may vary across individuals and over time and therefore the aggregation of the individual responses may be problematic. The survey results as summarised by the balance statistics depend on the weighting of the frequency of responses, which is inevitably arbitrary. Furthermore, as qualitative surveys of inflation sentiment are fundamentally different from indices of inflation, a direct comparison of these indicators is not possible. The qualitative responses of the EC Consumer survey can be mapped into quantitative estimates of the perceived and expected inflation rates (for example, using the methodology described in Forsells
-20
-10
0
10
20
30
40
50
60
70
80
EU Inflation perceptionsEU Inflation expectations
Euro area Inflation perceptionsEuro area Inflation expectations
Occasional Paper Series No 186 / April 2017 11
and Kenny, 2004), which can be directly compared with the HICP, but the quantification is sensitive to the technical assumptions underlying the mapping.
To overcome these problems, several major countries have introduced quantitative indicators of inflation sentiment, e.g. the University of Michigan survey of consumer attitudes for the United States, the Bank of England/GfK NOP survey of inflation attitudes for the United Kingdom, and the YouGov/Citigroup survey of inflation expectations, also for the United Kingdom. For the EU, a data set consisting of the individual replies at a monthly frequency from all EU Member States7 has been collected by the European Commission since May 2003. The data set has been used for research purposes and has not yet been published.
2.2 The dataset on quantitative inflation perceptions and expectations
Directly collecting quantitative estimates of inflation perceptions and expectations from consumers was first considered by DG ECFIN in 2002, and has been implemented since May 2003 on an experimental basis first and on a regular basis since May 2010. DG ECFIN asked the national institutes carrying out the qualitative survey to add two questions on consumers’ quantitative inflation perceptions and expectations, to be posed whenever a respondent perceives or expects changes in consumer prices.8 Respondents are then confronted with the following two questions:
Q51 - By how many percent do you think that consumer prices have gone up/down over the past 12 months? (Please give a single figure estimate): consumer prices have increased by……,…% / decreased by……,…%.
Q61 - By how many percent do you expect consumer prices to go up/down in the next 12 months? (Please give a single figure estimate): Consumer prices will increase by……,…% / decrease by……,…%.
Respondents have to provide their own quantitative estimate of inflation. They are not "helped" in any way by the interviewer or by the design of the questionnaire, for example by having to select their answer from a number of ranges, as it is done in the Bank of England / GfK NOP survey of inflation attitudes in the United Kingdom, or by probing unusual replies, as in the University of Michigan survey of consumer
7 Some data are missing for some countries in some specific periods. Namely: France and the UK: no
data from May to December 2003. Ireland: no data from May 2005 to April 2009 and from May 2015 onwards. Croatia: data available from January 2006 onwards. Hungary: data available from May 2014 onwards. Netherlands: no data from May 2005 to June 2011. Slovakia: no data from July 2010 to September 2010 and from November 2010 to July 2011.
8 The two questions are not asked if the response to the qualitative questions is “don’t know” or that prices will “stay about the same”, as in this latter case it is assumed that the respondent perceives or expects no change in “consumer prices”. When the respondent says that prices will “stay about the same”, the interviewer is instructed to automatically input a zero inflation rate in response to the quantitative questions.
Occasional Paper Series No 186 / April 2017 12
attitudes for the United States.9 However, there is evidence that the results are sensitive to the formulation of the question: an experiment in Spain in mid-2005 – during which the open-ended question was dropped and a possible choice of answers between 0% and 10% was suggested – introduced a break in the time series, but temporarily provided a range of answers that was much closer to actual inflation developments, without any significant drop in the response rate. By being open-ended, the current wording of the survey questions allows for a more dispersed range of replies.
Moreover, the survey questions are deliberately vague as regards the meaning of prices, implying that respondents are left to make their own interpretation as to what basket of goods to consider. For example, they may interpret the questions as being about the goods they purchase more frequently, a mix of goods and services, or some measure of the cost of living more generally. In 2007, DG ECFIN set up a Task Force to check the respondents’ understanding of the questions, verify their answers, and test alternative wordings of the questions. In this framework, additional questions were included in both the French and the Italian consumer surveys and some laboratory experiments were conducted by Statistics Netherlands in 2008 to study the concept of prices that is actually used by consumers when responding to the surveys. The results showed that consumers rely on various baskets of goods when judging past price developments and when forming their opinions about the future. Furthermore, the results showed that only a minority of people make use of a larger set of products also incorporating irregular purchases. Finally, the Dutch, French and German institutes tested alternative wordings of quantitative questions about perceived and expected inflation, in order to see if asking for price changes in levels instead of percentage changes might provide a "better" representation of consumers' opinions about inflation. To this end, different questions were tested in both a laboratory setting (by Statistics Netherlands), with a small sample of respondents but with a higher degree of control, and in live experiments using the French and German consumer surveys. The results of these tests showed that there seems to be very little scope for improving the results of inflation opinions by changing the wording of the questions; the case is rather the opposite. Changing the wording of the questions to ask respondents to provide specific amounts instead of a percentage change led to an even greater overestimation of inflation, especially for inflation expectations.
Following a common practice in inflation expectation surveys, the survey questions are phrased in terms of ‘consumer prices’, which, taken at face value, implies a reference to price levels and not to inflation rates. However, this is not to say that respondents understand the questions in this way or, indeed, that they all interpret the questions in the same way. In fact, results from probing tests carried out by INSEE in France and ISAE in Italy in 2008 showed that, when answering “stay about the same”, a non-negligible share of respondents in both countries had inflation rates in mind rather than price levels – notwithstanding the wording of the questions. 9 In the University of Michigan survey of consumer attitudes, if the respondent gives an answer to the
quantitative inflation expectations question that is greater than 5%, a further question is asked where the respondent is asked to confirm that he expect prices to go (up/down) by (x) percent during the next 12 months.
Occasional Paper Series No 186 / April 2017 13
Because respondents are not asked to provide a quantitative estimate of inflation when they choose the answer “stay about the same”, but are simply assumed to expect or perceive a zero rate of inflation, this misinterpretation would lead to a downward bias in the response, in case the benchmark inflation rate is positive, and an upward bias in case the recorded inflation rates are negative.
In this respect, it should also be mentioned that in an analysis of the University of Michigan survey of consumer attitudes for the United States, Bruine de Bruin et al. (2008) find that respondents react differently, depending on whether they are asked about expected changes in “prices in general” or about expectations for the “rate of inflation”. In particular, asking for inflation rates yields results that are closer to the Consumer Price Index (CPI). Their interpretation of the difference is that asking about prices in general leads respondents to focus on salient price changes of items that are more relevant for the individual, for example because they are purchased more frequently, while the question about inflation leads respondents to focus on changes in the general price level.
2.3 The dataset used for the current analysis
The full dataset used in this report consists of the individual replies at a monthly frequency from 27 EU Member States. Due to several changes of the data provider and related missing values for long periods, data for Ireland have not been included in the dataset. The sample starts in May 2003 for all countries, except for France and the UK, which first ran the survey in January 2004. Given the important weight of these two countries in the EU and euro area aggregates, the analysis is based on data from January 2004 to July 2015.
Spanish data are missing between April and August 2005 due to the above-mentioned temporary technical changes made by the Spanish partner institute in carrying out the survey. Also German data are missing for July, August and September 2007 for temporary technical reasons. In both cases, and in order to keep a homogenous euro area aggregate, missing data have been calculated on the basis of replies made to the qualitative questions.10 Missing observations (e.g. August 2004, 2005, 2006 and 2007 in France, September 2005 in Spain and October 2005 in Lithuania) are computed by linear interpolation of the previous and the following month.
The data collection for the quantitative questions is embedded in the established framework of the EC consumer survey. The experience of the national institutes, the well-developed survey methodology and the long-standing tradition of this particular survey contribute to the quality and reliability of the dataset. Available metadata, however, are not always detailed enough for a comprehensive analysis of specific issues, e.g. the treatment of non-response and its implications on the overall results. There are also a number of outliers and “implausible” replies, which appear to be
10 Available quantitative estimates were regressed on qualitative estimates summarised by the balance
statistic published by the European Commission.
Occasional Paper Series No 186 / April 2017 14
linked to the deliberately vague wording of the questions and the fact that no probing of answers is carried out (see discussion in Section 3.3).
Several features of the dataset are worth highlighting. First, besides totals, detailed results are available for a number of useful categories: level of income, gender, age, occupation and education. Second, the participation rate varies significantly across countries: consumers who are asked to provide a quantitative estimate of the inflation rate (past or future) have already replied to the qualitative question. They have therefore the opinion that consumer prices have changed or will change. It is, however, remarkable that in some countries, consumers refrain from providing a quantitative estimate more than in other countries. For example, in France and Portugal more than 50% of the surveyed consumers refuse to translate their qualitative assessment of inflation perceptions into a quantitative estimate, whereas nearly all Hungarian, Slovak and Lithuanian consumers provide an estimate (see Chart 3). On average, in the EU and the euro area, around 78% of surveyed consumers articulate the perceived value of the inflation rate (Q51) and around 76% declare a quantitative expectation of inflation (Q61).
Chart 3 Participation rate to quantitative questions
(as a percentage of respondents who believe that the inflation rate has changed or will change) (percentages)
Note: average response rates over the period January 2004 to July 2015. Sources: European Commission and authors' calculations
The interpretation of such participation behaviour across countries can only be speculative. The way the interviewer asks the question (for example, insisting to have a reply) and country-specific factors such as culture and press coverage of price information could impact the response rate. It may also be that, among those who provide a reply, some tell arbitrary numbers rather than admit their inability to complete the survey. Such behaviour could be associated with an increase in the measurement error in the survey, which calls for extra care when interpreting the results. However, it is worth mentioning that according to experiments carried out in France and Italy, respondents who are able to provide a fairly close estimate of the
Occasional Paper Series No 186 / April 2017 15
official rate (around 25% of the total), still perceive inflation to be several percentage points higher than the officially published figure.11
2.4 The aggregation of survey results at euro area and EU level
Since the surveys are conducted on a country basis, a weighting scheme is required to compute aggregate results for the euro area and the EU. There are two different ways to view the data, leading to (at least) two different aggregation schemes, each of them being more suited to a specific purpose. Treating each national dataset as a random sample drawn from an independent country specific distribution allows a comparison with other euro area/EU indicators, while considering all individual observations from all countries as an unbalanced random draw from a single euro area/EU distribution enables to calculate higher moment statistics at EU and euro area aggregate level.
For comparison purposes: independent country distributions
In the method used by the EC to aggregate consumer survey results, each national survey is considered to provide results that are representative for the country, i.e. the individual responses are treated as random draws from independent country distributions. Each country result is assigned a specific country weight, which, given the focus of this paper on inflation, corresponds to the HICP country weight (i.e. it is based on private consumption expenditure).
One issue with this weighing method is that it cannot be used to derive higher moment statistics for the euro area/EU. For example, the aggregate skewness for the euro area cannot be calculated as a weighted sum of the individual countries’ skewness statistics since skewness is not a linear statistic. Consequently, this weighting scheme can only be used to calculate means and standard deviations of perceived and expected inflation, for the total sample and for socio-economic breakdowns considered in the surveys. These calculations are done on a monthly basis and averaged over the available observation period. The monthly means and standard deviations also generate time series of consumers’ inflation perceptions and expectations and their variability.
For statistical analysis: a EU/euro area distribution
An alternative way to consider consumers’ replies is to take the whole sample of individuals across all countries and treat it as a sample from an overall EU/euro area 11 These findings are consistent with those in studies by the Federal Reserve Bank of Cleveland (Bryan
and Venteku, 2001a and 2001b) and the University of Michigan (Curtin, 2007), which show that US consumers are mostly unaware of the official inflation rate, and that those that do have knowledge of it, still perceive inflation to be higher.
Occasional Paper Series No 186 / April 2017 16
distribution. Thereby, the monthly country samples are put together into a single dataset, where individual responses are re-weighted both by the respondent’s corresponding weight in each country sample and by the country weight (which can be based on the total population of the country or the consumption weights – as HICP inflation is calculated using the latter this is the approach taken here).12 This re-weighting is comparable to what many national institutes do when they weight the individual answers by the size of the commune or the region of the country in order to balance the national samples. Keeping in mind a number of caveats13, this aggregation method allows for the provision of more elaborate descriptive statistics, e.g. higher moments, as discussed in the next section.
12 Since the surveys are designed to produce a representative national but not euro area sample, the “ex-
ante stratification” per country results in different selection probabilities for consumers depending on the country they live in. Strictly speaking, the individual results would need to be grossed up by the inverse of these selection probabilities, which is approximated here by the share in the resident population. Refining this grossing-up factor could be considered but might have only a small impact on the final results.
13 First, the survey questions do not specify which economic area respondents should take into account when forming their perceptions and expectations. Second, inflation developments are quite different among Member States, ranging from 1.5 % in the UK to -1.6% in Bulgaria on average in 2014. Third, general economic developments are also different. In 2014, for example, GDP contracted by 2.5% in Cyprus and increased by 5.2% in Ireland. Fourth, business cycles is not fully synchronised across euro area Member States (as argued, for example, by European Central Bank, 2007 and Giannone et al, 2009).
Occasional Paper Series No 186 / April 2017 17
3 Empirical features of the experimental dataset: Consumers’ quantitative estimates of inflation
3.1 Consumers’ quantitative inflation estimates and actual HICP
Chart 4 plots the quantitative inflation perceptions and expectations reported by EU consumers over the period January 2004 to July 2015 together with the official measure of inflation (Harmonised Index of Consumer Prices, HICP.14 For the consumers’ quantitative estimates, the time series are based on aggregated country means, where missing data have been calculated on the basis of the replies to the qualitative questions. The chart confirms that quantitative estimates of inflation sentiment are higher than the official EU/euro area HICP inflation over the entire sample period. However, for perceptions the size of the gap has tended to narrow over time and the differences visible at the beginning of the sample were not repeated, even when actual inflation peaked at the all-time high of 4.4% in July 2008.
Chart 4 EU and euro area consumers’ quantitative estimates of inflation perceptions and expectations
(a) EU (b) euro area (annual percentage changes)
Sources: European Commission, Eurostat and authors' calculations.
14 The HICPs are a set of consumer price indices (CPIs) calculated according to a harmonised approach
and a single set of definitions for all EU Member States; EU and euro area HICPs are calculated by Eurostat, the statistical office of the European Union. The HICPs have a legal basis in that their production, and many elements of the specific methodology to be used, is laid down in a series of legally binding European Union Regulations. Further information is available from Eurostat’s website at: Eurostat’s website
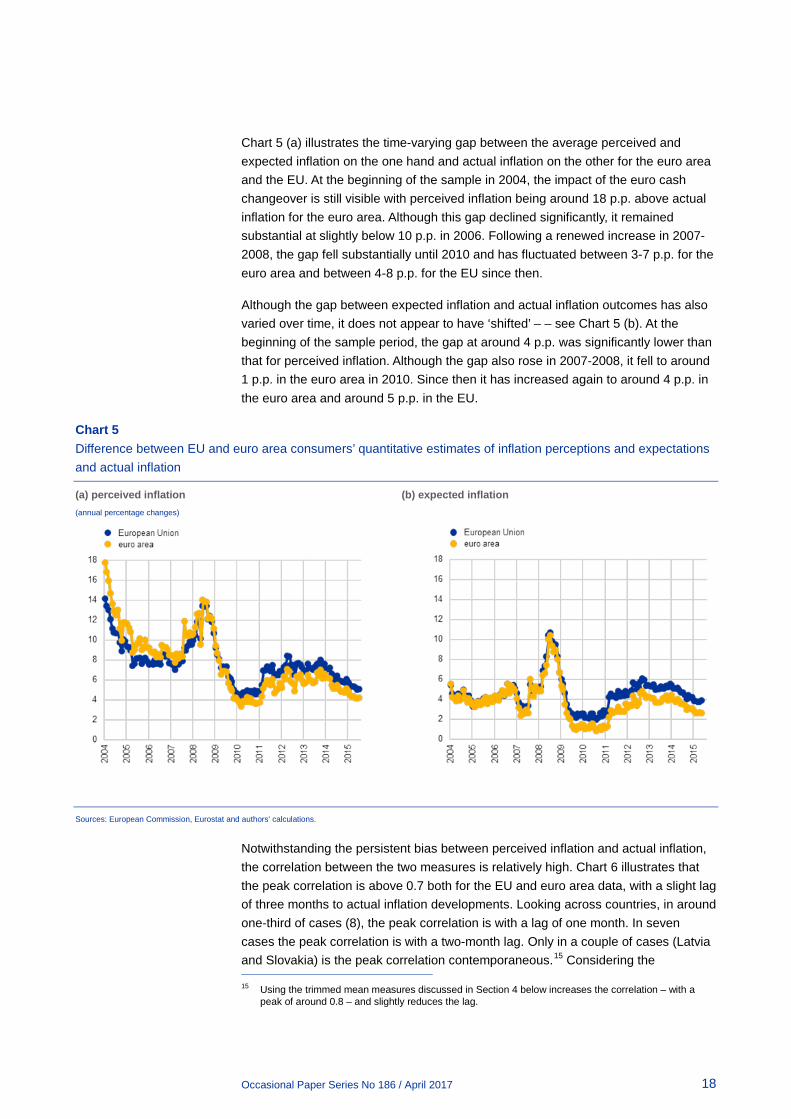
Chart 5 (a) illustrates the time-varying gap between the average perceived and expected inflation on the one hand and actual inflation on the other for the euro area and the EU. At the beginning of the sample in 2004, the impact of the euro cash changeover is still visible with perceived inflation being around 18 p.p. above actual inflation for the euro area. Although this gap declined significantly, it remained substantial at slightly below 10 p.p. in 2006. Following a renewed increase in 2007-2008, the gap fell substantially until 2010 and has fluctuated between 3-7 p.p. for the euro area and between 4-8 p.p. for the EU since then.
Although the gap between expected inflation and actual inflation outcomes has also varied over time, it does not appear to have ‘shifted’ – – see Chart 5 (b). At the beginning of the sample period, the gap at around 4 p.p. was significantly lower than that for perceived inflation. Although the gap also rose in 2007-2008, it fell to around 1 p.p. in the euro area in 2010. Since then it has increased again to around 4 p.p. in the euro area and around 5 p.p. in the EU.
Chart 5 Difference between EU and euro area consumers’ quantitative estimates of inflation perceptions and expectations and actual inflation
Sources: European Commission, Eurostat and authors' calculations.
Notwithstanding the persistent bias between perceived inflation and actual inflation, the correlation between the two measures is relatively high. Chart 6 illustrates that the peak correlation is above 0.7 both for the EU and euro area data, with a slight lag of three months to actual inflation developments. Looking across countries, in around one-third of cases (8), the peak correlation is with a lag of one month. In seven cases the peak correlation is with a two-month lag. Only in a couple of cases (Latvia and Slovakia) is the peak correlation contemporaneous.15 Considering the 15 Using the trimmed mean measures discussed in Section 4 below increases the correlation – with a
peak of around 0.8 – and slightly reduces the lag.
Occasional Paper Series No 186 / April 2017 19
correlation between expected inflation and actual inflation, the peak correlation is slightly higher (at close to 0.8) with a slight lag of one month to actual inflation. Given that the expectation measure refers to 12 months ahead, the slight lag to actual inflation developments suggests a limited information content of expected inflation. However, using a proper econometric set-up embedding both a forward-looking “rational” and a backward-looking component, evidence presented in European Commission (2014) shows that consumers' expectations are not only based on past and current inflation developments but also contain a limited but significant forward-looking component.
In the case of expectations, considering the correlation across countries, the peak correlation is contemporaneous in nine cases and in six cases with a lag of one month. The peak correlation between perceived and expected inflation is contemporaneous with a coefficient of above 0.9. The correlation structure is also somewhat kinked to the right with higher correlations at slight leads rather than at lags.
Occasional Paper Series No 186 / April 2017 20
Chart 6 Correlation measures
(percentage points)
Sources: European Commission and authors' calculations.
Perceived and actual Expected and actual
Perceived and expected Perceived and expected
Occasional Paper Series No 186 / April 2017 21
3.2 Country results
The general features highlighted for the EU and the euro area aggregates tend to be valid also for individual EU Member States. In particular, as illustrated for two groups of countries in Chart 7 below, inflation perceptions and expectations reached a peak around the end of 2008, fell to a local minimum in 2009-2010 and then increased again until around 2012. Since then perceptions and expectations have fallen in most reporting countries. This being said, Table 1 shows that consumers hold rather different opinions of inflation across individual countries, ranging from high, or very high in some cases, to low and close to the official rate of inflation, particularly for inflation expectations in Sweden, Finland, Denmark, France and Belgium. The reasons for such divergences are not well understood and may be worth investigating in depth in future follow-up work.
Considering the gap between perceived inflation and actual inflation across countries shows some noteworthy differences. For instance, in Denmark, Finland and Sweden the gap has generally been below the gap observed for the euro area or EU – see left hand panel of Chart 7. This is particularly true for Finland and Sweden, whereas the gap for Denmark has varied more and has increased more significantly since the crisis. The right hand panel of Chart 7 shows the gap for the four largest euro area economies (as well as for Greece). Whilst a broadly similar pattern is seen across these countries (i.e. high at the beginning of the sample, decreasing, rising again before the crisis, falling over 2008-2010, rising again until around 2012 before falling back to a somewhat lower level towards the end of the sample), there are some differences. Perceptions in Italy, Spain and Greece have generally tended to be above those for the euro area on average. Those for Germany and France have tended to be below the euro area average.
It is interesting to note that the effect of the euro-cash changeover observable for most of the initial "2002-wave"-countries – where inflation perceptions increased strikingly and not in line with observed HICP developments – is not visible for the more recent euro-area joiners (see Charts A.1.2 and A.1.3 in Annex 1). The only two exceptions are Slovenia, where since the euro adoption in 2007 the difference between inflation perceptions and measured inflation (HICP) is higher than before, and Lithuania, where since the euro adoption in January 2015, inflation perceptions and expectations have been increasing markedly despite the fact that measured inflation (HICP) remained low or even decreased in the latest months. In Malta (2008), Cyprus (2008) and Slovakia (2009) the increases in inflation perceptions and expectations visible after the euro introduction mainly reflected corresponding HICP developments. In Estonia (2011) inflation expectations remained broadly stable in line with HICP developments, while in Latvia (2014), inflation perceptions and expectations decreased after the euro-cash changeover despite the HICP remaining broadly stable. This suggests that the communication strategies and accompanying measures put in place by the public authorities during the introduction of the euro in these countries were successful.
Occasional Paper Series No 186 / April 2017 22
Chart 7 Gap between perceptions/expectations and actual inflation for selected countries
(annual percentage changes)
Note: For expected inflation the expectation is matched with the horizon (next 12 months). Therefore the charts in the bottom panel end in May 2015, whereas the data in the upper panel go to July 2015. Sources: European Commission and authors' calculations.
It is also interesting to note that no substantial differences can be found in so called 'distressed' economies (namely Greece, Portugal, Spain, Italy and Cyprus) compared to other countries (see Chart A.1.1 in Annex 1 for the complete set of euro-area countries). As a matter of fact, in most of the countries – independently from the group of countries they belong to – inflation perceptions and expectations developments followed the path of measured inflation (HICP). Only in Portugal can a divergence between inflation perceptions and expectations and HICP be observed. Indeed, measured inflation reached a trough in July 2014 and then showed a timid upward trend, while both perceptions and expectations continued to stay on a downward trend which had started at the beginning of 2012.
(a) Inflation perceptions Low High
(b) Inflation expectations Low High
Occasional Paper Series No 186 / April 2017 23
Thus far we have focused on the broad co-movement of inflation perceptions/expectations and actual inflation. One avenue for future research could be to assess the differences between quantitative estimates and actual inflation with respect to the level and the volatility of actual inflation. For example, it might be that normalising the difference for the level of actual inflation makes countries more comparable.
Occasional Paper Series No 186 / April 2017 24
Table 1 Consumers’ average quantitative estimates of inflation by EU Member States: January 2004 – July 2015
(annual percentage changes)
(1) Due to several changes in the data provider and related missing values for long periods, data for Ireland have not been included in the dataset. (2) Data available from January 2006. (3) Data available from May 2014. (4) No data from May 2005 to June 2011. (5) No data from July 2010 to September 2010 and from November 2010 to July 2011. Sources: European Commission (DG ECFIN, Eurostat) and authors’ calculations
3.3 Does the overestimation bias depend on the design of the survey questions and the methodology used to aggregate results?
The analysis so far confirms that the quantitative inflation sentiment is higher than the HICP over the sample period on average for the euro area and EU. While bearing in mind that exactly mimicking actual HICP inflation is neither necessary nor desirable, there are valid reasons why perceived inflation might differ from actual inflation. One obvious reason is that households are very unlikely to correct their price perceptions and expectations for quality changes in the goods they purchase, contrary to what is done in official inflation measurement. At the same time, the observed overestimation in the EC survey does not necessarily apply to all quantitative inflation perception surveys.
In this section we look at how the design and methodology of similar questions in other surveys elicit varying degrees of bias. For example since it was first launched the Michigan University Survey of Consumer Attitudes in the United States16, which asks questions both on quantitative and qualitative inflation expectations, has provided a range of expectations that have been consistently close to actual inflation rates (Chart 8).
Chart 8 Inflation expectations and measured inflation in the US
(annual percentage changes)
Sources: University of Michigan Survey and US Labour Bureau.
The Michigan Survey is an ongoing monthly representative survey based on approximately 500 telephone interviews with adult men and women in the conterminous United States (i.e. the 48 adjoining U.S. states plus Washington, D.C. (federal district)). The sample design incorporates a rotating panel, wherein 60% of the panel are being interviewed for the first time and 40% are being interviewed for the second time. The time between the first and second interviews is six months. The re-interviewing may introduce panel conditioning, wherein respondents give more accurate answers the second time they are interviewed for any number of factors
16 Further information available at: Michigan University
including, paying more attention to price developments after being interviewed or being able to better estimate the reference period of one year, having a fixed reference of six months previous.
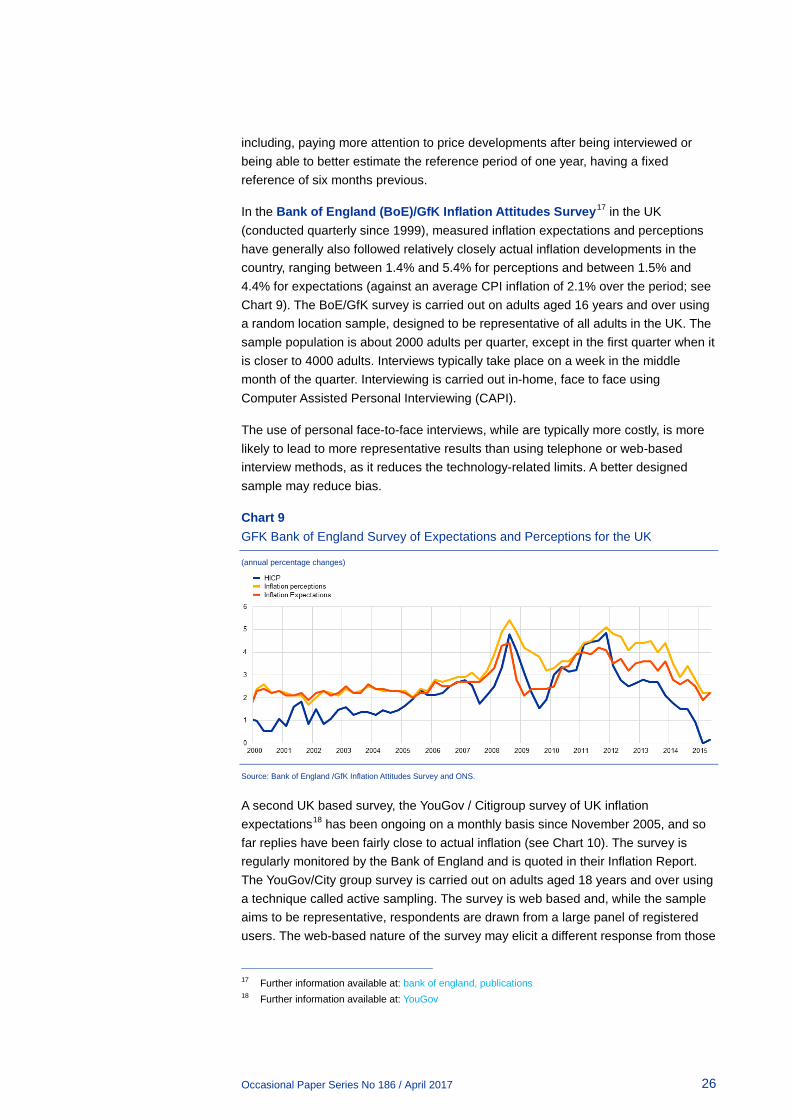
In the Bank of England (BoE)/GfK Inflation Attitudes Survey17 in the UK (conducted quarterly since 1999), measured inflation expectations and perceptions have generally also followed relatively closely actual inflation developments in the country, ranging between 1.4% and 5.4% for perceptions and between 1.5% and 4.4% for expectations (against an average CPI inflation of 2.1% over the period; see Chart 9). The BoE/GfK survey is carried out on adults aged 16 years and over using a random location sample, designed to be representative of all adults in the UK. The sample population is about 2000 adults per quarter, except in the first quarter when it is closer to 4000 adults. Interviews typically take place on a week in the middle month of the quarter. Interviewing is carried out in-home, face to face using Computer Assisted Personal Interviewing (CAPI).
The use of personal face-to-face interviews, while are typically more costly, is more likely to lead to more representative results than using telephone or web-based interview methods, as it reduces the technology-related limits. A better designed sample may reduce bias.
Chart 9 GFK Bank of England Survey of Expectations and Perceptions for the UK
(annual percentage changes)
Source: Bank of England /GfK Inflation Attitudes Survey and ONS.
A second UK based survey, the YouGov / Citigroup survey of UK inflation expectations18 has been ongoing on a monthly basis since November 2005, and so far replies have been fairly close to actual inflation (see Chart 10). The survey is regularly monitored by the Bank of England and is quoted in their Inflation Report. The YouGov/City group survey is carried out on adults aged 18 years and over using a technique called active sampling. The survey is web based and, while the sample aims to be representative, respondents are drawn from a large panel of registered users. The web-based nature of the survey may elicit a different response from those
17 Further information available at: bank of england, publications 18 Further information available at: YouGov
surveyed via telephone. In addition, the same registered users may be drawn upon to complete the survey in different periods, likewise, the registered users may subscribe to a newsletter which informs them of past results of the survey, this may introduce panel conditioning which can reduce the bias.
Chart 10 YouGov-Citygroup Survey of inflation expectations of the UK
(annual percentage changes)
Sources: YouGov/Citigroup and ONS
A common feature of both UK surveys is that respondents are confronted with ranges of price changes, from which they are asked to select the range that best summarises their expectations and/or perceptions. The use of ranges for the replies is also meant to capture the respondents’ uncertainty about future inflation; at the same time, ranges limit the size of extreme values.
In the Michigan survey, respondents providing expectations above 5% face further probing questions and are asked again while respondents who have answered a qualitative question on the movement of prices in general, but reply “Don’t know” to the subsequent quantitative question involving percentages face a question asking for the size of the indicated change in terms of “cents on the dollar”. Such probing and relating mathematical concepts to everyday terms are also likely to reduce the number of discordant values in the sample.
A feature common to both US and UK surveys is that in periods when actual CPI has been close to zero, the respondents’ inflation perceptions and expectations tend to overestimate actual CPI, a feature also observed for the euro area and EU in the EC survey.
It is also important to note that the results of the above mentioned surveys have gone through some statistical processing before publication. This processing typically includes imputing missing values and treatment of outliers including trimming data, whereas both methods of aggregation so far discussed for the EU and euro area have focussed on using the entire data set (see section 2.4). A discussion of the impact of outliers takes place in section 4.1.2, while the effect on the aggregates of applying different trimming methods is investigated in some detail in section 4.2. The findings show that such adjustments significantly reduce the difference between observed inflation and expected/perceived inflation.
Occasional Paper Series No 186 / April 2017 28
To conclude, the differences in survey design, not only in terms of question wording, but also sample design and interview methodology do impact the findings. The deliberately vague nature of the questions on price developments in the EC survey, in combination with the consideration of the complete set of answers (including outliers etc.) thus far can be expected to lead to relatively dispersed results, implying that extreme (high) individual responses can have a disproportionate effect on the aggregate quantitative value.
3.4 Alternative measures of ‘official’ inflation
Bearing in mind that quantitative questions ask about generic movements in consumer prices and that consumers may not refer to the HICP consumption basket, Chart 11 compares consumers’ quantitative inflation sentiment with alternative measures. A 2007 DG ECFIN Task Force tested respondents' understanding of the questions asked and concluded that a broad set of consumer price indices, such as an index of frequently purchased goods, should be used as a benchmark when evaluating this kind of data. The Eurostat index of Frequent out of pocket purchases (FROOP) records the price level for a basket of goods which closer represent those that consumers buy more often. The FROOP has tended to be higher than HICP for the euro area (about 0.45 and 0.56 percentage points on average for the euro area and EU respectively, for the period January 1997 to November 2015). This feature, although in the ‘correct’ direction, only goes a little way to explaining the gap between consumer perceptions and observed HICP. Furthermore, the broad findings with relation to observed HICP are also valid for the FROOP measure. Eurostat does not publish FROOP at the national level. However, a potential avenue for future investigation is to investigate counterfactual exercises where different combinations of HICP-sub item groupings are assessed against the quantitative measure to see whether it is the same or similar components which help explain the wedge.
Occasional Paper Series No 186 / April 2017 29
Chart 11 Developments of the Index of Frequent Out Of Pocket purchases (FROOP) and the HICP
(annual percentage changes)
Source: Eurostat.
3.5 Different people, different inflation assessments
Several studies, using the University of Michigan survey data, have already shown that socio-demographic characteristics play a role for the answers on consumers’ inflation expectations and perceptions (Bryan and Venkatu 2001, Pfajfar and Santoro 2008, Bruine de Bruin et al. 2009, Binder 2015). The results of these studies suggest that women, lower income earners and individuals with lower level of education tend to perceive and expect higher levels of inflation.
The results for the EU consumer survey allow for similar conclusions. The below charts show the mean reply by demographic group for inflation perceptions and expectations. For this purpose, the raw, un-weighted data are used.
On average, women report consistently higher rates for inflation perceptions (by 2.4 percentage points) and expectations (by 1.9 percentage points), compared to male respondents. The inflation perceptions and expectations also tend to decrease with the age of the respondents. However, the gap is smaller with 0.2 percentage points difference between the average inflation perception for the youngest respondents, compared to the oldest respondents and 0.5 percentage points difference for the average inflation expectation. The levels of income and education attainment have a significant impact on the consumer quantitative estimates. The average perceived inflation is 3.2 percentage points higher and the average expected inflation is 2.7 percentage points higher for the low income earners compared to the high income earners. Similarly, respondents with a lower level of education perceive (3.6 percentage points gap) and expect (2.4 percentage points gap) higher inflation, compared to their peers with higher education.
-2
-1
0
1
2
3
4
5
6
7
1997 1999 2001 2003 2005 2007 2009 2011 2013 2015
EU HICP EU FROOP
-2
-1
0
1
2
3
4
5
6
7
1997 1999 2001 2003 2005 2007 2009 2011 2013 2015
EA HICP EA FROOP
Occasional Paper Series No 186 / April 2017 30
Overall, the results of the EU consumer survey confirm the findings for the University of Michigan survey data that socio-demographic characteristics have an impact on the quantitative replies. On average, male, high income earners and highly educated individuals tend to provide lower and hence, more accurate inflation estimates.
Chart 12 below includes data for the EU only; for the euro area, the results are fairly similar and are included in Chart A.2.1 in Annex 2. Exceptions include the mean inflation expectation value by income and education, where the respondents from euro area countries give a lower value. Similarly, the standard deviations of the inflation expectations are fairly close to one another in the gender group among respondents from euro area countries.
Chart 12 Mean inflation expectations and perceptions across different socio-economic groups in the EU
(percentage points)
Sources: European Commission and authors' calculations
Occasional Paper Series No 186 / April 2017 31
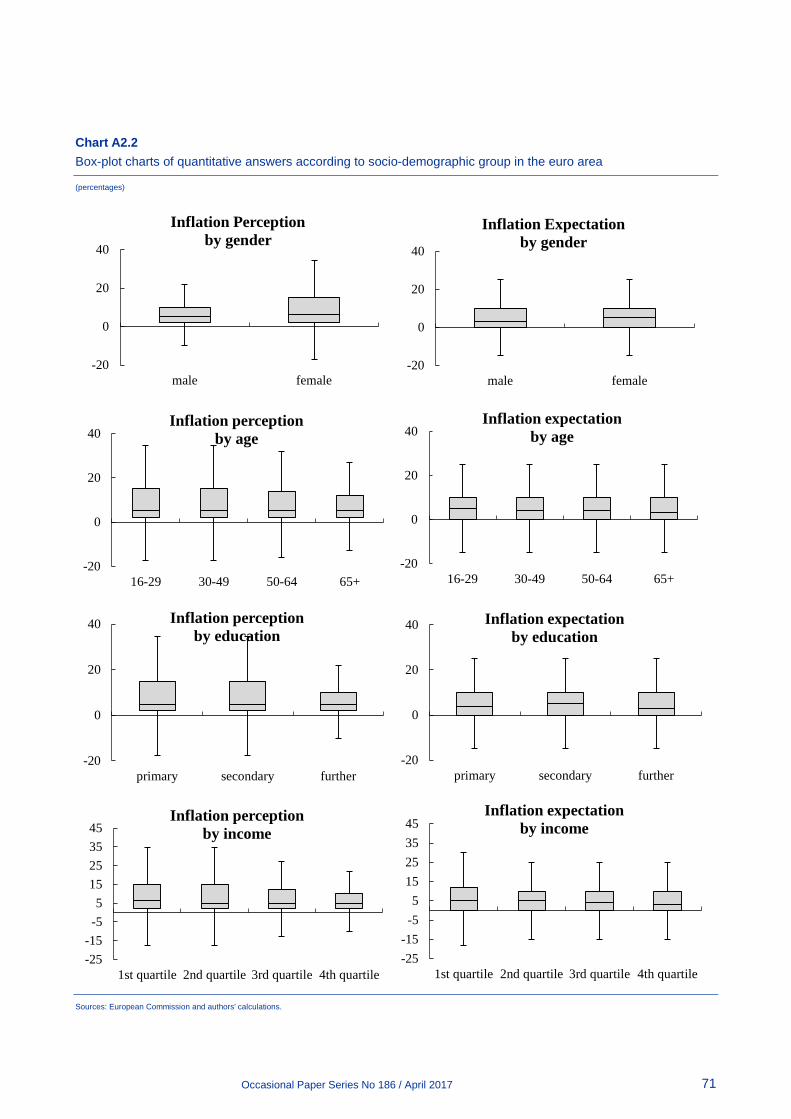
The standard deviations of each socio-demographic group are fairly close to one another, as shown in the below box-and-whiskers charts.19 However, the standard deviation for the male, high income earners and respondents with high level of education is smaller, particularly with respect to inflation perceptions, which indicates that the quantitative replies are not only different on average, but also vary in distribution (Chart 13).
19 The charts do not show the outliers – values, which lie outside of the 1.5 interquartile range of the
nearer quartile.
Occasional Paper Series No 186 / April 2017 32
Chart 13 Distribution of inflation perceptions and expectations according to socio-demographic group in the EU
(annual percentage changes)
Sources: European Commission and authors' calculations.
Chart 13 includes data for the EU only; for the euro area, the results are fairly similar and are included in Chart A2.2 in Annex 2.
It is worthwhile mentioning that not all of the respondents have provided answers with respect to their socio-demographic qualities. These have, naturally, been excluded for the work presented in this section. A closer look at the inflation perceptions and expectations of these respondents reveals that, on average, they provide higher values and more volatile predictions. This holds for those respondents who have not indicated their gender and age group. However, they account in total for only 0.5 per cent of the whole dataset.
Finally, we check whether the socio-demographic characteristics play a role in providing a quantitative answer on inflation perceptions and expectations. For this purpose, we compare the share of respondents who provide a quantitative answer and those who do not provide a quantitative answer by demographic group (Chart 14). Supporting the results above, it emerges that older respondents, women, less educated people and those with lower income are less inclined to provide a quantitative answer. A Chi square test for independence confirms the significant dependent relationship between the socio-demographic characteristics and the answering preference.
Occasional Paper Series No 186 / April 2017 34
Chart 14 Share of quantitative answers according to socio-demographic group in the EU
(percent)
Share of quantitative replies on inflation perception by gender
Share of quantitative replies on inflation expectation by gender
Share of quantitative replies on inflation perception by gender
Share of quantitative replies on inflation expectation by gender
Share of quantitative replies on inflation perception by education
Share of quantitative replies on inflation expectation by education
Share of quantitative replies on inflation perception by income
Share of quantitative replies on inflation expectation by income
0%10%20%30%40%50%60%70%80%90%
100%
male female
no answeranswer
0%10%20%30%40%50%60%70%80%90%
100%
male female
no answeranswer
0%10%20%30%40%50%60%70%80%90%
100%
16-29 30-49 50-64 65+
no answeranswer
0%10%20%30%40%50%60%70%80%90%
100%
16-29 30-49 50-64 65+
no answeranswer
0%10%20%30%40%50%60%70%80%90%
100%
primary secondary further
no answeranswer
0%10%20%30%40%50%60%70%80%90%
100%
primary secondary further
no answeranswer
0%10%20%30%40%50%60%70%80%90%
100%
1st 2nd 3rd 4th no reply
no answeranswer
0%10%20%30%40%50%60%70%80%90%
100%
1st 2nd 3rd 4th no reply
no answeranswer
Occasional Paper Series No 186 / April 2017 35
Chart 14 includes data for the EU only; for the euro area, the results are fairly similar and are included in Chart A2.3 in Annex 2.
Several studies, based on data from the Michigan Consumer Survey data for the US, come to similar findings and try to understand the reason behind the heterogeneity across different socio-demographic groups. While these studies offer explanations for the different education and income groups, there is little support as to why female respondents give higher quantitative estimates than the male respondents.
In the context of the presented results, Pfajfar and Santoro (2008) focus on the process of forming inflation expectations in terms of access to and capabilities of processing information across different demographic groups. Their study suggests that the “worse” performers base their answers on their own consumption basket, whereas the “better” performers focus on the overall inflation dynamics.
Bruine de Bruin et al. (2010) try to explain the heterogeneity across different socio-demographic groups by suggesting that higher quantitative replies are provided by those individuals, who have lower level of financial literacy or who put more thought on how to cover their expenses. Burke and Manz (2011) suggest as well that the level of financial literacy can explain the tendencies across the different socio-demographic groups.
3.6 Cross-checking quantitative and qualitative replies
Generally the quantitative and qualitative are ‘consistent’ – at least on average. The upper left hand panel of Chart 15 shows the average quantitative inflation perceptions for each answer to the qualitative question. The highest average is for those who report that prices have “risen a lot” (pp), followed by “risen moderately” (p) and then risen slightly (s). The quantitative measures for those who report that prices have “stayed about the same” (n) is set to zero. Zooming in in more detail, the remaining five panels show each series individually. From these a couple of features are worth noting.
First, there is some variation over time. Whilst what constitutes “risen a lot” might be expected to vary over time (as it is open ended), there has also been some variation in “risen moderately” and to a lesser extent “risen slightly”. For instance, at the beginning of the sample, the average quantitative response of those replying “risen moderately” was around 20%. It then declined to between 10-15% and since 2010 has fluctuated just below 10%. The average quantitative response of those replying “risen slightly” has fluctuated in a narrower range (5-8%).
Second, the time variation does not seem to be linked to the actual level of inflation. Thus, it does not seem to be the case that respondents have necessarily changed their definition of what constitutes “a lot”, “moderately” and “slightly”, depending on the prevailing inflation level. This is particularly the case for “a lot”, but also for the other answers.
Occasional Paper Series No 186 / April 2017 36
Chart 15 Average quantitative inflation perceptions according to qualitative response - euro area
(annual percentage changes)
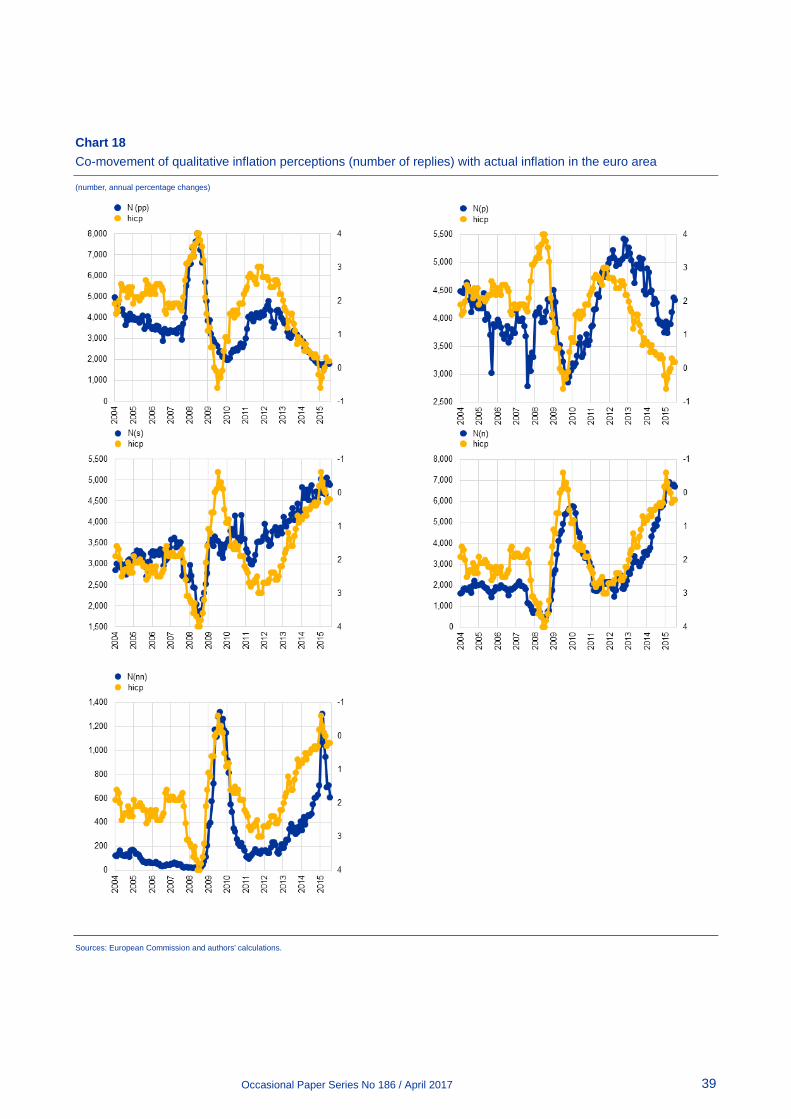
Notes: PP denotes “risen a lot”; P denotes ‘risen moderately’; S denotes ‘risen slightly’; N denotes ‘stayed about the same’; and NN denotes ‘fallen’. Sources: European Commission and authors' calculations.
Although the quantitative and qualitative responses are consistent on average, there is considerable overlap for many respondents. Chart 16 reports the mean
Occasional Paper Series No 186 / April 2017 37
quantitative response as well as the 25th and 75th percentiles for each qualitative answer. The overlap between the replies can be seen by the fact that the 25th percentile from those replying “risen a lot” averages below 10%. This is below the mean response from those replying “risen moderately”. Similarly the mean response from those replying “risen slightly” is above the 25th percentile of those replying “risen moderately”.
Chart 16 Inter-quartile range of quantitative inflation perceptions according to qualitative response in the euro area
(annual percentage changes)
Source: European Commission and authors' calculations.
The overlap of quantitative perceptions across qualitative responses also holds at the country level. Chart 17 illustrates that in most instances the 75th percentile of quantitative response associated with risen ‘moderately’ (‘slightly’) are higher than the 25th percentile of quantitative responses associated with risen ‘a lot’ (‘moderately’). Thus the overlap is not due to cross-country differences in response behaviour.
Occasional Paper Series No 186 / April 2017 38
Chart 17 Overlap of qualitative and quantitative inflation perceptions by country
(annual percentage changes)
Sources: European Commission and authors' calculations.
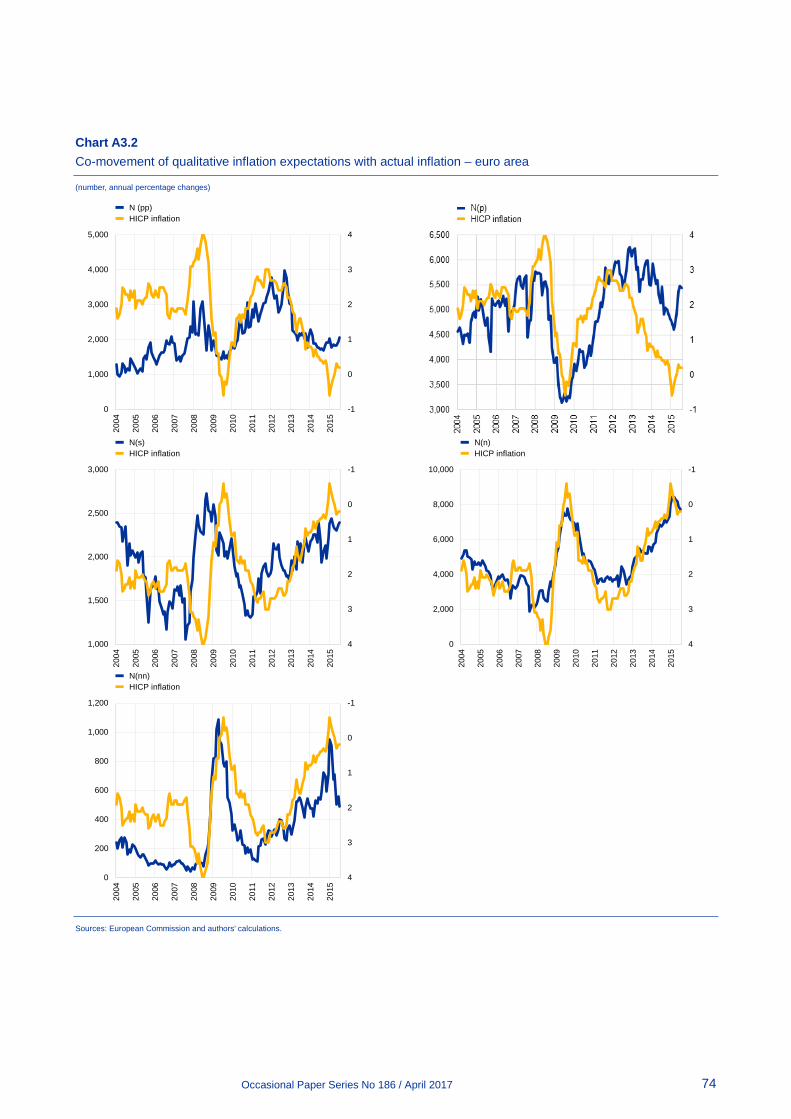
Given that the quantitative interpretation of the qualitative replies does not seem to vary systematically in line with actual inflation, it suggests that the co-movement of the quantitative perceptions with qualitative perception and with actual inflation is driven primarily by respondents moving from group to group. Chart 18 shows that there is a strong positive correlation between actual inflation and the number of respondents reporting that prices have risen either “a lot” or “moderately” and a negative correlation with those reporting that prices have “risen slightly”, “stayed about the same” or “fallen”.
Occasional Paper Series No 186 / April 2017 39
Chart 18 Co-movement of qualitative inflation perceptions (number of replies) with actual inflation in the euro area
(number, annual percentage changes)
Sources: European Commission and authors' calculations.
Occasional Paper Series No 186 / April 2017 40
3.7 Business cycle effects
Consumers' overestimation of inflation in terms of both perceptions and expectations could be influenced by the phase of the business cycle in which the respondent's country is in or by the level of actual inflation.
In order to check for a possible impact of the business cycle on inflation perceptions and expectations, we considered four intervals of time based on the chronology of recessions and expansions established by the Euro Area Business Cycle Dating Committee of the Centre for Economic Policy Research (CEPR).20 In the euro area, since January 2004 there have been three periods of expansion: (a) 2004:01 – 2007:12, (b) 2009:07 – 2011:09 and (c) 2013:04 – now21; and two of recession (d) 2008:01 – 2009:06 and (e) 2011:10 – 2013:03.
Keeping in mind that the period taken into consideration is rather short and that results in the period from 2004 to 2006 have been influenced by the euro-cash changeover, the results suggest that consumers' overestimation is slightly higher during recession periods (see Table 2).
Table 2 Consumers’ quantitative estimates of inflation and HICP in the euro area: January 2004 – July 2015
(annual percentage changes)
Sources: European Commission and authors calculations.
When looking at periods when actual inflation is above or below 1%, the difference on the bias is less important than the differences found considering business cycles. However, as shown in Table 3 – excluding the period Jan 2004 – Feb 2009 when the important overestimation was mainly explained by the euro cash changeover effect – the bias is slightly more important in periods of low inflation.
20 Further information available at: euro-area-business-cycle-dating-committee 21 The peak of the current cycle has not been determined yet.
Table 3 Consumers’ quantitative estimates of inflation and HICP in the euro area: January 2004 – July 2015
(annual percentage changes)
Sources: European Commission and authors calculations.
With the aim of measuring the relationship between inflation perceptions/expectations and the business cycle, we have analysed the correlation of the consumers’ quantitative replies to some selected indicators of real economic activity. In particular, the analysis focused on monthly frequency indicators, such as the European Commission's Economic Sentiment Indicator (ESI), Markit's Composite Purchasing Managers Index (PMI), and the annual percentage change in the unemployment rate.
For both the euro area and the EU, inflation perceptions and expectations are lagging with respect to the selected business cycle indicators. As shown in Chart 19, inflation perceptions and expectations have mainly reached peaks and troughs some months after the selected economic indicators.
Chart 19 Economic indicators and quantitative surveys
(standard deviation)
Notes: All indicators are normalized z=(x-mean(x))/stdev(x). Shaded-areas represent the recession periods of the euro area as defined by the CEPR. Sources: European Commission, Eurostat, Markit and ECB staff calculations.
This is confirmed by the structure of the leading and lagging correlations between the selected economic indicators and the inflation perceptions (and expectations)
presented in Chart 20. Specifically, correlations become positive and stronger when economic indicators are leading the consumers’ quantitative replies.
Chart 20 Leading and lagging correlations
(percentage points)
Euro area European Union
Note: sample 2003m5-2015m7. Sources: European Commission, Eurostat, Markit and ECB staff calculations.
Since 2010, the correlation between the Economic Sentiment Indicator and inflation perceptions and expectations is on a declining trend.22 Additionally, the recent path of inflation perceptions and expectations seems likely not to be related to the business cycle. As shown in Chart 21, the 3-year-window correlations stood mainly in positive territories until the third quarter of 2012 and became persistently negative afterwards. This is also confirmed when considering a longer business cycle as suggested by 5-year-window correlations.
In conclusion, this analysis suggests that consumers are more prone to overestimate inflation during recession periods. Historically, inflation expectations and perceptions seem to be driven by real economy developments. However, this relationship has vanished.
22 The periods before December 2009 for the 3-year-window and January 2012 for the 5-year window
were not plotted because the correlations were affected by the Euro-cash change over.
Q51 vs Economic sentiment indicatorQ61 vs Economic sentiment indicatorQ51 vs Unemployment rate - annual percentage change (inverted)Q61 vs Unemployment rate - annual percentage change (inverted)
Occasional Paper Series No 186 / April 2017 43
Chart 21 Correlation between the Economic Sentiment Indicator and quantitative surveys
(percentage points)
Notes: Shaded-areas represent the recession periods of the euro area has defined by the CEPR. Sources: European Commission, Eurostat, Markit and ECB staff calculations.
4 Comparative assessment of consumers’ quantitative versus qualitative replies in the euro area and the EU
Thus far we have shown that although the quantitative perceptions and expectations appear biased with respect to actual inflation outcomes, they co-move closely and their dynamics are quite consistent with actual inflation movements. Therefore we now turn to consider whether it is possible to extract information from the quantitative measures that reduces the degree of bias whilst maintaining the broad co-movement. However, as already discussed above, it should be noted that the aim is not to replicate the HICP, which is the official (and very timely) indicator of inflation. Nonetheless, substantial bias (discrepancies between 'real' and perceived inflation) on average over time may point to issues in how to interpret the quantitative measures, particularly in terms of levels or direction of movement.
Two possible alternative approaches are tried: the first considers various trimmed mean measures, allowing both the amount of trim as well as the symmetry of trim to vary. The second adapts an approach utilised by Binder (2015) who argues that exploiting the propensity of more uncertain respondents to provide ‘round’ answers, we can distinguish between ‘uncertain’ and ‘more certain’ individuals.
4.1 Distribution of replies and outliers
In this section we consider some of the features of the distribution of the individual replies to the quantitative questions. Unless stated otherwise the results presented refer to the euro area. Generally these results are qualitatively similar to those for the European Union.
4.1.1 Distribution of replies
Chart 22 illustrates the distribution across all countries over the entire sample period with different levels of ‘zoom’. The top left panel presents the uncensored distribution. Two features are noteworthy: first, the distribution is concentrated around and slightly above zero; second, there are a (small) number of extreme outliers ranging from close to -500% to around 1,000%.23 The top right hand panel abstracts from the extreme outliers by (arbitrarily) censoring replies below -20% and above 60%. Some additional features of the distribution now become visible: third, over the entire sample the most common (modal) response is zero; fourth, in
23 Values below -100% are not possible unless prices were to be negative. Whilst possible positive values
are unbounded, it should be borne in mind that the actual average inflation rate over this period was 1.8% for the euro area and 2.0% for the European Union.
Occasional Paper Series No 186 / April 2017 45
addition, there are also clear peaks at multiples of 5, such as 5, 10, 15, etc.); fifth, the distribution is ‘left-truncated’ at zero (i.e. there are relatively few values below zero compared with above zero);
The bottom left hand panel zooms in further to the range -10% to 30%. A sixth feature which becomes more evident is that, in addition to the peaks at multiples of 5 (as noted by Binder, 2015), in between 1-10 there are also peaks at round numbers, such as 1, 2, 3, etc.24
The bottom right hand panel zooms even further to the range 0% to 10%. In addition to the large peaks at multiples of 5 (0, 5 and 10) and the medium peaks at the other round numbers (1, 2, 3, 4, 6, 7, and 8), there are also small peaks at 0.5, 1.5, 2.5, 3.5, etc.).
24 This feature was not noted by Binder (2015) as that paper used data from the Michigan Survey which
are already recorded to the nearest round number.
Occasional Paper Series No 186 / April 2017 46
Chart 22 Zooming in on quantitative inflation perceptions
(percentages, all euro-area countries, whole sample)
Sources: European Commission and authors' calculations.
Moving beyond a graphical analysis, Table 4 reports a numerical summary of key statistics. Considering first the quantitative inflation perceptions (Q51) for the euro area, there were almost 2,000,000 responses, an average of almost 15,000 per month. The mean perceived inflation rate was 9.5%, which is considerably above the actual average inflation rate over the same period of 1.8%. However the mean perceived rate dropped notably in the post-crisis period (2009-15) compared with the pre-crisis period (2004-08), to 6.7% from 13.2% (actual HICP inflation was 1.4% and 2.4% over the same periods).
histogram Q51a if Q51 >= -20 & if Q51 <= 60, width (0.1) - quantitative perceptions
histogram Q51a if Q51 >= -5 & if Q51 <= 30, width (0.1) - quantitative perceptions
histogram Q51a if Q51 >= 0 & if Q51 <= 10, width (0.1) - quantitative perceptions
Occasional Paper Series No 186 / April 2017 47
The largest average value was at the beginning of the sample period (January 2004) at around 20%, whilst the lowest was 4.2% at the beginning of 2015. The standard deviation of replies within each month also declined over the two sub-periods to 11.8 p.p. from 17.5 p.p. The interquartile range (an indicator which can be a more robust measure of dispersion in the presence of extreme outliers) also declined to 7.4 p.p. (period 2009 to 2015) from 14.2 p.p. (period 2004 to 2008).
Table 4 Summary of key statistics - distribution of quantified inflation perceptions (Q51) and inflation expectations (Q61)
Notes: The first column indicates the periods covered: Jan 2004 – July 2015 (04-15), Jan 2004 – Dec 2008 (04-08) and Jan 2009 – July 2015 (09-15). Q51 = Question 5, quantitative estimate on perceived inflation Q61 = Question 6, quantitative estimate on expected inflation N = Number of observations s.d. = Standard deviation P25 – P75 = Interquartile range se(mean) = Standard error of the mean P[x] = Percentile averages[x] Skew = Skewness Kurt = Kurtosis. Sources: European Commission and authors' calculations.
4.1.2 Outliers
The minimum value reported for quantitative inflation perceptions was -400% (in the second period) and the maximum was 900% (also in the second period). However the number of ‘very’ extreme values was relatively limited (particularly on the downside). The 1st, 5th and 10th percentile averages were -3.2%, -0.1% and 0.2% over the whole sample. Outliers on the upper side were larger with the 90th, 95th and 99th percentile averages of 25%, 36.7% and 69.8%, respectively. The interquartile range (25th to 75th percentiles) spanned 1.6% to 11.9% (see Chart 23). The presence of right hand side (upward) skew is confirmed by the average skew statistic 3.8 p.p., and presence of fat tails is confirmed by the kurtosis statistic 61.7 p.p. – although this latter statistic is pushed upward by some very extreme outliers in some months, the median value over the sample period is still large at 24 p.p.
Occasional Paper Series No 186 / April 2017 48
Chart 23 Selected percentiles – euro area aggregate
(annual percentage changes)
Sources: European Commission and authors' calculations.
Regarding the quantitative inflation expectations, whilst the broad characteristics are similar to those for inflation perceptions, there are some noteworthy differences. The mean value (at 5.4%) is almost half that reported for perceptions (9.5%). The standard deviation (10.6 p.p.) and inter-quartile range (6.3 p.p.) are also lower, while the span covered by the interquartile range is more ‘reasonable’ covering 0.0% to 6.3%. On the other hand the extreme outliers cover a similar range (-500% to 899%), and the degree of skew and kurtosis are even slightly more pronounced.
Thus far we have considered the aggregate distribution over the entire sample period. However when considering specific points in time, it becomes clear that, although many of the main features identified above (truncated at zero, skewed to the right, peaks at multiples of 5 and round numbers) still hold, there are also some noteworthy differences.
Chart 24 shows the distribution of quantitative inflation perceptions at two specific months in time (June 2008 when actual HICP inflation was 4.0% and January 2015 when actual inflation -0.6%). %). In June 2008, the most common (modal) reply was actually 10%, followed by 20%, 5% and 30%, while 0% was only the eighth most common reply. In sharp contrast turning to January 2015, 0% was clearly the most common reply followed by 5% and 10%, and thereafter 2% and 3%. In summary although some features of the distribution appear to be prevalent both over time and across countries, the distribution does appear to change reflecting changes in actual inflation.
Chart 24 Histograms of quantified inflation perceptions (selected months)
(annual percentage changes, all euro area countries)
Sources: European Commission and authors' calculations.
All in all, the distribution of individual replies exhibits a number of features that need to be borne in mind when considering average replies. In particular the strong degree of right skew and peaks at multiples of five should be taken into account. In particular, although the average quantitative measures are undoubtedly biased, they appear to co-move quite strongly with actual inflation. Thus it may well be that it is possible to derive more sensible quantitative measures by exploiting some of the stylised facts noted above.
4.2 Trimming measures
Alternative trimmed mean measures: As noted above, the distribution of individual replies exhibits two features relevant for considering trimmed means: first there are a number of extreme outliers and the distribution has ‘fat tails’ (i.e. is leptokurtic); second, the distribution is truncated at zero and is skewed to the right. In this context we consider various degrees of trim including asymmetric trim. An extreme example of a trimmed mean is the median which trims 100% of the distribution (50% from each side).
However this measure has the disadvantage that it ‘throws away’ most of the available information and may be relatively uninformative if replies are clustered (as illustrated above) as large changes may not show up for a while (as the median moves within the cluster) but sudden jumps may appear (as the median moves from one cluster to the next). In some instances a relatively small degree of trim may be sufficient to remove the largest outliers, whereas in other cases more substantial trim might be required. To this end, we consider and report a range of trims (10%, 32%, 50%, 68%, 90% and 100% - where 100% is equivalent to the median). In addition,
Histogram Q51a if Q51 >= -5 & if Q51 <= 30, width (0.1) - quantitative perceptions
Histogram Q51a if Q51 >= -5 & if Q51 <= 30, width (0.1) - quantitative perceptions
Occasional Paper Series No 186 / April 2017 50
as the distribution of individual replies is clearly skewed to the right, we also allow for varying degrees of skew (0.00, 0.50, 0.75 and 1.00 - where 0.00 implies symmetric trim and 1.00 means all the trim comes from the right hand side).25 In practice, the amount trimmed from the left or bottom of the distribution is [(TRIM/2)*(1-SKEW)] and the amount trimmed from the right or top of the distribution is [(TRIM/2)*(1+SKEW)]. For example a trim of 50% with a skew of 0.75 means 6.25% ((50/2)*(1-0.75)) is trimmed from the left and 43.75% ((50/2)*(1+0.75)) is trimmed from the right.
Trimming reduces the amount of bias but with diminishing returns to scale. Chart 25 below shows the quantitative measure of inflation perceptions allowing for different degrees of (symmetric) trim. Even though the trim is symmetric, as the distribution of individual replies is skewed to the right, trimming generally reduces the degree of bias (relative to the untrimmed mean). The average value of the untrimmed mean over the sample period (2004-2015) was 9.5%; a 10% trim reduces this to 7.8%, 20% to 7.1%, 32% to 6.5%, 50% to 6.0%, 68% to 5.7% and 90% to 5.6%. Although the reduction in bias is monotonic with the degree of trim, the marginal improvement tends to diminish with the degree of additional trim – going from 0% trim to 50% trim reduces the bias from 7.7 p.p. (9.5% minus 1.8%) to 4.2 p.p. (6.0% minus 1.8%), but trimming further to 90% only decreases the bias to 3.8 p.p. (5.6% - 1.8%). Given the degree of skew and bias in the distribution, clearly no amount of symmetric trim will fully eliminate the bias.
25 As the distribution is consistently and clearly skewed to the right, we do not calculate for negative (left)
skews.
Occasional Paper Series No 186 / April 2017 51
Chart 25 Quantitative inflation perceptions allowing for differing degrees of trim and skew in the euro area
(annual percentage changes)
Sources: European Commission and authors' calculations.
Allowing for asymmetric skew (and trimming) reduces further the degree of bias and can eliminate it entirely if sufficiently ‘extreme’ values are chosen. The bottom left hand chart shows 50% trim with varying degree of skew (0.00, 0.50 and 0.75). In the pre-crisis period, no measure eliminates the bias entirely although it is further reduced. However, for the period since 2009, allowing for skew succeeds in eliminating most of the bias (compared with the mean of inflation since 2009 which was 1.3%, the untrimmed average yields 6.7%, a 50% trim with 0.00 skew yields 3.8%, a 50% trim with 0.50 skew yields 2.3% and 50% with 0.75 skew yields 1.6%). If more trimming is considered (the bottom right hand chart shows 68% trim) and combined with skew, then the bias in the earlier period can almost be eliminated (see
(a) symmetric trim
(b) asymmetric trim
Occasional Paper Series No 186 / April 2017 52
the measure with 0.75 skew) but this then results in downward bias for much of the later period.26
Table 5 Summary of trimmed mean and skewed measures
(percent)
Note: Red cells signal that the average of trimmed mean measure is below actual HICP inflation – indicating negative bias. Sources: European Commission and authors' calculations.
Table 5 illustrates that combining a large amount of trimming and skew can eliminate the ‘bias’ and even create a downward bias if sufficiently large values are chosen (e.g. 90% trim and 0.75 skew results in downward biased measures both in the pre- and post-crisis periods).
In summary, the two main features of the distribution, strong outliers and asymmetry, imply that trimming the replies reduces the degree of bias. Although there is not a clearly optimal degree of trim or skew, it is evident that (i) some trim, even if symmetric, can substantially reduce the degree of bias, (ii) the returns to scale from trimming are diminishing suggesting that the preferred degree of trim probably lies in the range 32-68%, (iii) allowing for some degree of right sided skew further reduces the bias. In terms of the preferred measure there is little to choose between one with 50% trim and 0.75 skew (means of 3.0%, 4.8%, 1.6%) 26 It should also be considered that the aim is not necessarily to exactly mimic actual HICP inflation.
There are many reasons why even perceived inflation could differ from actual inflation (consumption weights mean inflation measures are plutocratic not democratic, not allowing for quality adjustment, etc.).
against one with 68% and 0.50 skew (means of 3.1%, 5.0%, 1.7%). However on the basis that removing less is preferable, it might be concluded that 50% trim is better.27 Nonetheless, it seems that owing to shifts in the distribution of replies, applying a fixed degree of trim and skew over time may not be the optimal approach.
4.3 Fitting distributions to replies
4.3.1 Aggregate distribution
Another approach could be to fit alternative distributions to the individual replies. For instance, the histograms in Chart 22 above show a couple of features that suggest that a log-normal distribution could be a reasonable approximation.28 First, they tend to drop off very sharply at, or around, zero. Second, they tend to have long tails on the right hand side.
Fitting a log normal distribution results in modal values in line with actual inflation developments. Chart 26 reports the summary results from fitting the log normal distributions. Although the means of the fitted log-normal distributions turn out to be systematically higher than actual inflation (see upper left hand panel), the modes of the fitted log-normal distributions are more in line with actual inflation developments. Furthermore, when considering the ‘location’ parameter of the fitted log-normal distributions, these move very closely with actual inflation (bottom left panel). On the other hand, although the ‘scale’ parameter moved in line with actual inflation developments during the sharp fall and subsequent rebound in inflation in 2008-2011, it has not moved so much during the disinflation period observed since early-2012.
The results from fitting log-normal distributions, at least at the aggregate level, suggest that this functional form could be a useful metric for summarising consumers’ quantitative perceptions, particularly if one focuses on the modal values and on the location parameters. This could owe to the fact that the mode of such a distribution captures the peak of replies and is closer to the actual outcome than the mean, which is excessively influenced by large positive outliers.
27 Curtin (1996) using US data from the University of Michigan Survey of Consumers also focuses on
50% trim and in particular on the use of the interquartile (75-25%) range. 28 Although log-normal distributions may in some instances be justified on theoretical grounds, in this
instance our motivation is primarily to maximise fit rather than to ascribe an underlying data generating process.
Occasional Paper Series No 186 / April 2017 54
Chart 26 Summary statistics of log-normal distributions fitted to consumers’ quantitative inflation perceptions
(annual percentage changes)
Sources: European Commission and authors' calculations.
4.3.2 Mix of distributions
An alternative approach would be to exploit signalling of uncertainty revealed by rounding. Binder (2015), drawing from the communication and cognition literature, argues that the prevalence of round number replies may be informative and seeks to exploit it using the so-called “Round Numbers Suggest Round Interpretation (RNRI)” principle (Krifka, 2009). According to this idea consumers may have a high (H) or low (L) degree of uncertainty regarding their inflation assessment. If consumers are highly uncertain then they are more likely to report round numbers. In this section we apply this approach to our dataset.
-2
0
2
4
6
8
10
12
14
16
2004
2005
2006
2007
2008
2009
2010
2011
2012
2013
2014
2015
meanEU HICP
-4
-2
0
2
4
6
8
2004
2005
2006
2007
2008
2009
2010
2011
2012
2013
2014
2015
modeEU HICP
-1.0
-0.5
0.0
0.5
1.0
1.5
2.0
2.5
3.0
3.5
4.0
4.5
2.5
2.6
2.7
2.8
2.9
3.0
3.1
2004
2005
2006
2007
2008
2009
2010
2011
2012
2013
2014
2015
locationEU HICP (rhs)
-1.0
-0.5
0.0
0.5
1.0
1.5
2.0
2.5
3.0
3.5
4.0
4.50.45
0.50
0.55
0.60
0.65
0.70
0.75
0.80
0.85
2004
2005
2006
2007
2008
2009
2010
2011
2012
2013
2014
2015
scaleEU HICP (rhs, inverted)
Occasional Paper Series No 186 / April 2017 55
A large portion of replies are consistent with rounding. Over half (51.6%) of respondents report inflation perceptions to multiples of 10, a further fifth (20.5%) report to multiples of 5; whilst around one-in-four (22.9) report other multiples of 1 (i.e. not including multiples of 10 or 5), only one-in-twenty (4.9%) report quantitative inflation perceptions with decimal points.29 The corresponding percentages for inflation expectations are very similar at 53.8%, 18.2%, 23.4% and 4.6% respectively. Binder (2015) considers two types of respondents: high uncertainty and low uncertainty. Those who are high uncertainty report to multiples of 5, whilst those who are low uncertainty report integers (which may not or may be multiples of 5).
Given the features reported in Section 4.1, we may have to consider three types of respondents: (1) those who are highly uncertain and report to multiples of 10, (2) those who are highly uncertain (maybe to a lesser extent) and report to multiples of 5 (which can include multiples of 10), and (3) those who are more certain and report integers or decimals. Chart 27 illustrates that the aggregate distribution of replies could be plausibly made up of these three types of respondents.
Chart 27 Possible distributions fitted to actual replies
(percentages)
Source: Authors' calculations.
In what follows we try to estimate the parameters describing the three distributions so as to best fit the actual responses. This implies (a) deciding which distribution best fits (e.g. Normal, Skew Normal, Student’s t, Skew t, log-Normal, log-logarithmic, etc.), (b) estimating appropriate weights for each distribution, and (c) estimating the parameters (such as mean and standard deviation) of these distributions.30 Both for the overall sample but also most periods,
29 Note the so-called Whipple Index for multiples of 5 would equal 3.6 (i.e. 0.72 * 5), where values greater
than 1.75 are considered to indicate prevalent heaping. 30 Outliers below -10% and 50% or above were removed. These accounted for approximately 2.5% of
replies. The mix distribution was fitted using the fminsearchcon procedure written by D'Errico (2012). The sharing of code and advice from Carola Binder is also gratefully acknowledged.
Occasional Paper Series No 186 / April 2017 56
the log-Normal and log-logarithmic distributions fitted the data relatively well. Although some other more general distribution types also performed well (such as the Generalized Extreme Value Distribution) they require three parameters to be estimated. Given that their marginal contribution was relatively limited, these distributions were not considered further.
Most respondents are relatively uncertain about quantitative inflation. The upper left hand panel of Chart 28 indicates that most respondents are quite uncertain when it comes to quantifying inflation. The estimation procedure suggests that, on average, approximately 40% on average report multiples of five (w5), whilst 25-33% report multiples of 10 (w10). A relatively constant portion of around 33% report to integers or lower (w1).
The modal response of those who appear more certain about quantitative inflation is relatively close to actual inflation. The upper right hand panel of Chart 28 shows that the gap between modes of the distribution fitted to those responding to integers or lower (mode1) and actual inflation is generally below 1 percentage point. This is considerably smaller than the gap reported in Section 3.1. The two series also co-move closely illustrating the same peaks (2008 and 2012) and troughs (2009 and 2015).
The modal response of those who appear less certain about quantitative inflation is notably higher than for those who are more certain. The lower left hand panel of Chart 28 shows that the mode of the distribution fitted to replies which are a multiple of 5 (mode5) has varied in the range 4-12%. This represents a gap of about 3 percentage points compared with those reporting to integers or lower (mode1).
Notwithstanding their higher quantification of inflation, the modal response of those who appear less certain about quantitative inflation co-moves very closely with the modal response of those who appear more certain. The lower right hand panel of Chart 28 shows that the correlation between more uncertain (mode5) and more certain (mode1) respondents is very high. This indicates that although more uncertain respondents may have difficulty quantifying inflation, they have a similar understanding as those who are more certain regarding the relative level and direction of movement of inflation over time.
Overall these results suggest that the quantitative measures may contain meaningful information once account is made for different respondents and their certainty regarding quantifying inflation. Furthermore, although the modal responses of those appearing more uncertain about quantitative inflation are systematically and substantially above actual inflation, they co-move closely with those who appear more certain and with actual inflation. Thus, although they may not be able to indicate with precision a quantitative assessment of inflation, they do appear capable of understanding the relative level of inflation during both high and low inflation periods.
Occasional Paper Series No 186 / April 2017 57
Chart 28 Results from fitting mix of distributions to individual replies
(percentages)
Sources: European Commission and authors calculations.
The mix of distributions approach also flexibly captures the significant shifts in the aggregate distribution over time. Chart 29 illustrates the actual distribution of replies and the fitted distributions for the overall samples (panel (a)) and for three specific months – (b) January 2004, (c) August 2008 and (d) January 2015. The distribution in January 2004 (panel (b)), when inflation stood at 1.8%, is broadly similar to the average over the whole sample. The fitted distributions capture the actual distribution relatively well - although the fitted value at 10% is higher than the actual value31, and there is a peak at 2-3% that is not captured by the distribution fitted on the integer scale. The distribution in August 2008, when inflation was 3.8%, is notably different as it is more balanced around the mode at 10%. Nonetheless again the fitted distributions capture quite well the actual distribution with the exception of the two
31 In general the distribution fitted on the 10% support is not fitted very precisely and is quite noisy as
there are only four degrees of freedom (six supports less the two parameter estimates).
features noted already. The distribution in January 2015, when inflation was 0.1%, is strikingly different. However, again the fitted distributions capture quite well the actual distribution. In particular the approach is flexible enough to capture the shift in the mode from 10% to 0%.
Chart 29 Results from fitting mix of distributions – at specific points in time
(percentages)
Sources: European Commission and authors' calculations.
In summary, although the raw data appear biased with respect to the level of inflation, consumers do appear to capture well movements in inflation. Using trimmed mean measures (particularly allowing for asymmetry) reduces significantly the bias but there is no degree of trim and asymmetry that works well over the entire sample period. In this context, the approach of fitting a mix of distributions which exploit the idea that different consumers have differing certainty and knowledge about inflation appears to be a promising one, particularly as it is sufficiently flexible to cope with the actual variation in inflation over the sample period.
(a) whole sample
(b) January 2004
(c) August 2008
(d) January 2015
Occasional Paper Series No 186 / April 2017 59
5 Quantitative measures of inflation expectations: A review of future research potential
As this report has previously highlighted, inflation expectations are a key indicator for macroeconomic policy makers and, in particular, for monetary policy. As a practical follow-up, further work should be devoted to eventually defining aggregate indicators of consumers' quantitative inflation perceptions and expectations from the micro data. Such indicators could usefully be integrated into DG ECFIN’s publication programme of the Joint Harmonised EU Business and Consumer Surveys and could complement the qualitative results from EU consumer surveys.
In the remainder of this section, we outline several important economic research directions that could be pursued with the data on consumer inflation expectations and point to the findings of existing research with equivalent datasets for other economies.32
Research based on micro data collected in consumer surveys can build on existing macroeconomic research along several dimensions. First, the process underpinning the formation of inflation expectations is central to the inflation process and, in particular, to the nature of the likely trade-off between inflation changes and economic activity (the Phillips curve). Second, for achieving a proper understanding of the complex processes governing the spending and savings behaviour of consumers taking a purely aggregated approach (associated with the elusive “representative agent”) has proven to be no longer sufficient. Third, macroeconomists can use such data to derive a better understanding of monetary policy effectiveness, the evaluation of central bank communication strategies and, ultimately, in assessing central bank credibility. In what follows we discuss the relevance of micro data on quantitative household inflation expectations for each of these three areas.
5.1 Expectations formation and the Phillips Curve
Understanding the process governing inflation expectations is essential if one is to assess the overall responsiveness of inflation to real and nominal shocks and to derive a sound specification of the Phillips curve. The Phillips curve lies at the heart of macroeconomics as it provides the conceptual and empirical basis for understanding the link between real and nominal variables in the economy. In the widely used New Keynesian model, inflation is driven by a forward looking 32 We focus on key economic questions that can be explored taking the survey design and methodology
as fixed. Clearly, however, a very active area of ongoing research is in the area of survey design itself and the study of associated measurement error, linked in particular to how different formulations of questions may yield different responses.
Occasional Paper Series No 186 / April 2017 60
component linked to inflation expectations as well as by fluctuations in the real marginal costs of production which vary over the business cycle.
Consumer survey data can be used to reveal the process governing the formation of consumers’ expectations. Carroll (2003) uses the Michigan Consumer Survey data for the US to fit a model of household inflation expectations formation in the spirit of the “sticky information” theory of Mankiw and Reis (2001). In this model, households form their expectations acquiring information slowly based on the forecasts of professional forecasters or by reading newspapers. In any period, households encounter and absorb information with a certain probability, updating their inflation expectations only infrequently. Alternatively, Trehan (2011) argues that household inflation expectations are primarily formed based on past realized inflation. Investigating the role of oil prices, exchange rates, tax regulation changes or central bank communication in the formation of consumer inflation expectations can add substantially to this literature.
More recently, household inflation expectations have been used to address the possible changes in the specification and the slope of the Phillips curve. Following the Great Recession of 2008-2009, macroeconomists have been puzzled by the somewhat sluggish downward adjustment of inflation in both the US and the Euro Area. In the case of the US, quantitative data on household inflation expectations have helped explain this “missing disinflation”. Coibion and Gorodnichenko (2015) exploit household inflation expectations as a proxy for firms’ expectations in estimating the Phillips curve33, instead of the more commonly used Survey of Professional Forecasters. They show that a household inflation expectations augmented Phillips curve does not display any missing disinflation. Binder (2015a) further develops this idea and brings evidence that the expectations of higher-income, higher-educated, male and working-age consumers are a better proxy for the expectations of price-setters in the New Keynesian Phillips curve. Another explanation of the “missing disinflation” puzzle is the anchored inflation expectations hypothesis of Bernanke (2010) which argues that the credibility of central banks has convinced people that neither high inflation nor deflation are likely outcomes, thereby stabilising actual inflation outcomes through expectational effects. Likewise, the EC consumer level data can be used to examine the current “missing inflation” puzzle together with a de-anchoring hypothesis which could shed light on the ongoing debate about low inflation or even deflation risks in the euro area.
5.2 Cross-sectional analysis of consumer spending and savings behaviour
Survey data shed light on many questions which are central to our understanding of consumer behaviour. For example, do consumers take economic decisions in a manner that is consistent with their inflation expectations? To what extent do 33 Based on a new survey of firms’ macroeconomic beliefs in New Zealand, Coibion et al. (2015) report
evidence that firms’ inflation expectations resemble those of households much more than those of professional forecasters.
Occasional Paper Series No 186 / April 2017 61
households or firms incorporate inflation expectations when negotiating their wage contracts? How do financial constraints impact on consumers inflation expectations? Does consumer behaviour change materially when inflation is very low, or even negative, or when monetary policy is constrained by the Zero Lower Bound on nominal interest rates?
Currently, an important relationship that warrants a thorough investigation is the relationship between inflation expectations and overall demand in the economy. Central to this relationship is the sensitivity of household spending to both nominal and real interest rates and whether these relationships are dependent on the state of the economy. To study this, the EC survey data on consumers’ quantitative inflation expectations can be linked to qualitative data on their spending attitudes, such as whether it is the right moment to make major purchases for the household. Unlike what standard macroeconomic theory would imply, based on a micro data empirical study, Bachman et al. (2015) finds for the US that the impact of higher inflation expectations on the reported readiness to spend on durables is generally small and often statistically insignificant in normal times. Moreover, at the zero lower bound it is typically significantly negative implying that higher inflation expectations are associated with a decline in spending. In contrast, D’Acunto et al. (2015) report that German households expecting an increase in inflation have a higher reported readiness to spend on durable goods and are less likely to save. This result is more consistent with the real interest rate channel, which implies that higher inflation expectations might lead to higher overall consumption. As a preliminary illustration, Annex 4, using the quantitative data from the EC Consumer Survey, reports results which also highlight a significant – though quantitatively small – positive relationship between expected inflation and consumers’ willingness to spend for the euro area as a whole. As a flipside of consumption, savings intentions can be also investigated with the EC survey data to find out the reasoning behind this consumer decision: whether it is inflation expectations driven, or whether there are precautionary or discretionary motives behind.34 Moreover, research can also be done around the impact of inflation uncertainty on consumer spending or savings decision, i.e. using the inflation uncertainty measure developed by Binder (2015b) via exploiting micro level survey data.
Another important future area for study with such data is understanding heterogeneity at household level. As shown in Section 3.5 for the EC Consumer Survey, inflation expectations of consumers depend on their education background, occupation, financial situation, labour market status, age or gender.35 Using such sub-groupings it is then possible to test for possible differences in the behaviour of different types of consumers. For example, D’Acunto et al. (2015) and Binder (2015a) find that consumers with higher education, of working-age and with a 34 Such studies can benefit when at least part of the respondents of a round respond in one or more
consecutive rounds. Within the EC survey, only a few of the covered EU countries have this “rotating panel” dimension (as in the Michigan Survey). Such a panel permits a wider range of research strategies that require repeated measurements and reduces the month-to-month variation in responses that stems from random changes in sample composition, making the responses more reflective of actual changes in beliefs.
35 Souleles (2004) also shows that US inflation expectations vary substantially depending on the age profile of different households.
Occasional Paper Series No 186 / April 2017 62
relatively high income tend to act in a way that is more in line with the predictions of economists, while other types of households are less rational in this sense. The EC Consumer Survey provides also an excellent basis for performing a multi-country analysis, in which country divergences of consumer inflation expectations and behaviour can be investigated.
Potentially valuable insights about economic behaviour could also emerge from linking the EC dataset with other micro data sets such as the Household, Finance and Consumption Survey (HFCS) or the Wage Dynamics Survey (WDS). For instance, the role of the financial or balance sheet situation of different households as a determinant of their inflation expectations could potentially be investigated by linking the consumer survey with the HFCS. With respect to the WDS, which relates to firms’ wage setting policies, a potentially insightful area of study follows Coibion et al. (2015). In particular, they extract a proxy of firms’ inflation expectations from a sub-group of the consumer dataset. Such a proxy could then be linked with other replies in the WDS to investigate the role of inflation expectations in shaping wage setting across firms.
5.3 Monetary policy effectiveness and central bank credibility
According to economic theory, the expectations channel is a key determinant of the overall effectiveness of monetary policy. In taking and communicating monetary policy decisions central banks are seeking to influence also expectations about future inflation and guide them in a direction that is compatible with their overall objective. The availability of high frequency quantitative micro data can be used to study the impact of monetary policy decisions on consumers’ inflation expectations, but also to assess central bank credibility. In the standard theory, inflation expectations should be mean-reverting and anchored by the Central Bank’s announced inflation target or price stability objective. Even when such data are measured at short-horizons36, they can help shed light on possible changes in the way consumers assess the overall effectiveness of monetary policy and its communication. For example, a simple way to make use of the Consumer Survey dataset is to exploit its relatively high monthly frequency to conduct event study analysis, through which one could directly investigate consumer reactions to central bank decisions or announcements including announcements about non-standard policies.
In addition to measuring expectations and consumer reactions to central bank decisions, the EC Survey could be used to construct indicators which measure inflation uncertainty. For instance, Binder (2015b) proposes an inflation uncertainty measure that exploits micro level data for the US economy. The measure is built around the idea that round numbers are used by respondents who have high imprecision or uncertainty about inflation. The so-derived inflation uncertainty index is found to be elevated when inflation is very high but also when inflation is very low 36 Nevertheless, extending surveys to ask consumers about their inflation expectations at more medium-
term horizons would link more directly to the objectives of central banks.
Occasional Paper Series No 186 / April 2017 63
compared to the central bank target. The index is also found to be countercyclical and it is correlated with other measures of uncertainty, like inflation volatility and the Economic Policy Uncertainty Index based on Baker et al. (2008).37
37 Binder (2015b) also notes that consumer uncertainty varies more across the cross-section than over
time.
Occasional Paper Series No 186 / April 2017 64
6 Summary and conclusions
This report updates and extends earlier findings on the understanding of quantitative inflation perceptions and expectations of the general public in the euro area and the EU, using an anonymised micro dataset collected by the European Commission in the context of the Harmonised EU Programme of Business and Consumer Surveys.
The response rates to the quantitative questions differ between EU countries, ranging from 41% (France) to almost 100% (e.g. Hungary). On average, in the EU and the euro area, around 78% of surveyed consumers provide the perceived value of the inflation rate and around 76% provide a quantitative expectation of inflation.
Consumers' quantitative estimates of inflation continue to be higher than the official EU/euro area HICP inflation over the entire sample period. For the euro area, over the whole sample period, the mean perceived inflation rate was 9.5%, which is considerably above the actual average inflation rate over the same period of 1.8%. However the mean perceived rate dropped notably in the post-crisis period (2009-2015) compared with the pre-crisis period (2004-2008), to 6.7% from 13.2% (actual HICP inflation was 1.4% and 2.4% over the same periods). For inflation expectations the mean value (at 5.4%) is almost half that reported for perceptions (9.5%) in the euro area; also here, the size of the gap has tended to narrow over time.
The analysis has also shown that European consumers hold different opinions about inflation depending on their income, age, education and gender. On average, male, high income earners and highly educated individuals tend to provide lower inflation estimates. Understanding the factors that can explain this heterogeneity and its implications for the functioning of the macroeconomy and the transmission of policies is a key question that warrants further research.
When compared with official HICP inflation, the provision of higher estimates of inflation by consumers appears to be partly linked to the survey design, not only in terms of wording of the questions, but also sample design and interview methodology appear to have an impact on the findings. This is suggested from a look at similar surveys outside the euro area and the EU, e.g. in the US and the UK, where results are closer to official inflation rates. Statistical processing such as trimming/outlier removal etc. is also likely to contribute to this finding.
Notwithstanding the persistent gap between perceived inflation and actual inflation, the correlation between the two measures is relatively high (above 0.7 both for the EU and euro area with a slight lag of three months to actual inflation developments). The (peak) correlation between expected inflation and actual inflation is slightly higher (at close to 0.8) with a slight lag of one month to actual inflation. While the slight lag to actual inflation developments would suggest a limited information content of expected inflation, econometric evidence in European Commission (2014) shows that consumers' expectations are not only based on past and current inflation developments but also contain a forward-looking component.
Occasional Paper Series No 186 / April 2017 65
Although many of the features highlighted for the EU and the euro area aggregates are also valid across individual EU Member States, differences exist. For instance, the gap in the group of Nordic countries (Denmark, Sweden and Finland) is generally below the gap of the euro area or EU.
Furthermore, the quantitative inflation estimates are consistent with the results from the corresponding qualitative survey questions, where respondents can simply express if consumer prices have gone up, remain unchanged or have been falling without providing a quantitative number. Here, the two sets of responses are highly correlated over time and respondents who indicate rising inflation to the qualitative questions generally report higher inflation rates also to the quantitative questions. There is some time variation in the quantitative level of inflation that respondents appear to associate with the different qualitative categories 'risen a lot', 'risen moderately' etc. This variation does not seem to vary systematically with actual inflation. This suggests that the co-movement of the quantitative perceptions with qualitative perceptions and with actual inflation is primarily driven by respondents moving from one answer category to another.
With regard to the interpretation of the levels and changes in the quantitative measures of inflation perceptions and expectations, it is clear that their level has to be interpreted with caution. However, as there is an observed co-movement between changes in inflation and changes in the quantitative measures, it suggests an information content potentially useful for policy makers. More specifically, the co-movement identified between measured and estimated (perceived/expected) inflation, even where respondents provide estimates largely above actual HICP inflation, points to an understanding of the relative level of inflation during both high and low inflation periods. Moreover, using trimmed mean measures (particularly allowing for asymmetry) proves an effective means to significantly reduce the difference between estimated and HICP inflation in the data. Alternatively, the approach of fitting a mix of distributions which exploits the idea that different consumers have differing certainty and knowledge about inflation appears promising, particularly as it is sufficiently flexible to cope with the actual variation in inflation over the sample period. Overall these results suggest that further investigations taking into account different respondents and their (un)certainty regarding inflation could yield additional meaningful and useful information regarding consumers’ inflation perceptions and expectations.
Based on these results underlining the quality and usefulness of the micro-data set of European consumer inflation estimates, further work should be devoted to defining aggregate indicators of consumers' quantitative inflation perceptions and expectations from the data. In particular a quantitative indicator on inflation expectations could potentially provide very timely information on the consumers’ inflation outlook that could be added to other forward-looking estimates by e.g. professional forecasters or capital markets. However, the design of such quantitative indicators requires careful considerations, substantive testing (in- and out-of-sample)
Occasional Paper Series No 186 / April 2017 66
and might yield considerable communication challenges.38 Follow-up work would have to elaborate on the desired properties of such indicators and develop them.39
Moreover, the report suggests a number of future research topics that can be applied to the data. As regards the future use for research as well as for analytical purposes, the granularity of the EC dataset provides enormous potential to study many issues that, although they are very important for monetary policy, are still not completely understood. This includes understanding the process governing the formation of household inflation expectations and its impact on the Phillips curve, the role of inflation expectations in explaining consumer behaviour at a disaggregated level, as well as the assessment of the effectiveness of central bank policies and their communication to households. While some of the analysis presented in this report has helped to partly shed light on these issues, looking forward much more remains to be done. In this context, public access to the (anonymised) micro data set for cross-country, EU and euro area-wide research purposes would be desirable.40 Clearly, the dataset represents a rich scientific basis, ideally to be exploited by researchers more widely in the academic and policy communities, on which to assess some of the key cross-country, EU and euro-area-wide questions highlighted above.
38 As already highlighted, the purpose of such an indicator would not be to exactly match actual inflation
developments, but it would ideally be broadly congruent with inflation developments. In this regard, key aspects are likely to be the degree (maybe more in relation to direction of change than actual levels) and timing (neither necessarily contemporaneous nor leading but not too much lagging either) of co-movement with actual inflation.
39 Such indicators could also be useful for other purposes such as understanding the degree of uncertainty surrounding consumers’ expectations, investigating the link between inflation expectations and consumption/savings behaviour and analysing more structural factors such as consumers’ economic literacy.
40 As mentioned in the introduction, the consumer micro-data results are not part of the data that the European Commission can release without consultation of its data-collecting national partner institutes, which remain the data owners.
Occasional Paper Series No 186 / April 2017 67
Annex 1 Charts on consumers’ quantitative estimates of inflation perceptions and expectations in euro area countries
Chart A1.1 Quantitative inflation perceptions, expectations and HICP in the "first wave" euro-area countries
(annual percentage changes)
Sources: European Commission and authors' calculations
Occasional Paper Series No 186 / April 2017 68
Chart A1.2 Quantitative inflation perceptions and expectations and HICP in the "second wave" euro-area countries
(annual percentage changes)
Sources: European Commission and authors' calculations
Occasional Paper Series No 186 / April 2017 69
Chart A1.3 Difference between quantitative perceptions/expectations and HICP in the "second wave" euro-area countries
(annual percentage changes)
Sources: European Commission and authors' calculations
Occasional Paper Series No 186 / April 2017 70
Annex 2 Different people, different inflation assessments – charts for the euro area
Chart A2.1 Mean inflation expectations and perceptions across different socio-economic groups in the euro area
(annual percentage changes)
Sources: European Commission and authors' calculations
0
2
4
6
8
10
12
14
16-29 30-49 50-64 65+
Mean inflation perceptiuon by gender and age
male female
0
2
4
6
8
10
16-29 30-49 50-64 65+
Mean inflation expectationby gender and age
male female
0
2
4
6
8
10
12
14
primary secondary further
Mean inflation perception by income and education
1st 2nd 3rd 4th
0
2
4
6
8
10
primary secondary further
Mean inflation expectation by income and education
1st 2nd 3rd 4th
Occasional Paper Series No 186 / April 2017 71
Chart A2.2 Box-plot charts of quantitative answers according to socio-demographic group in the euro area
(percentages)
Sources: European Commission and authors' calculations.
Chart A2.3 Share of quantitative answers according to socio-demographic group in the euro area
(percentages)
Sources: European Commission and authors' calculations.
0%20%40%60%80%
100%
answer no_answer
Share of quantitative replies on inflation perception by gender
male female
0%20%40%60%80%
100%
16-29 30-49 50-64 65+
Share of quantitative replies on inflation perception by age
answer no_answer
00.20.40.60.8
11.2
primary secondary further
Share of quantitative replies on inflation perception by education
answer no_answer
0%
50%
100%
1st 2nd 3rd 4th no reply
Share of quantitative replies on inflation perception by income
answer no_answer
0%
50%
100%
answer no_answer
Share of quantitative replies on inflation expectation by gender
male female
0%
50%
100%
16-29 30-49 50-64 65+
Share of quantitative replies on inflation expectation by age
answer no_answer
00.20.40.60.8
11.2
primary secondary further
Share of quantitative replies on inflation expectation by education
answer no_answer
0%
50%
100%
1st 2nd 3rd 4th no reply
Share of quantitative replies on inflation expectation by income
answer no_answer
Occasional Paper Series No 186 / April 2017 73
Annex 3 Quantitative and qualitative inflation – charts for the euro area
Chart A3.1 Average quantitative inflation expectations according to qualitative response - euro area
(percent)
Sources: European Commission and authors' calculations
Occasional Paper Series No 186 / April 2017 74
Chart A3.2 Co-movement of qualitative inflation expectations with actual inflation – euro area
(number, annual percentage changes)
Sources: European Commission and authors' calculations.
-1
0
1
2
3
4
0
1,000
2,000
3,000
4,000
5,000
2004
2005
2006
2007
2008
2009
2010
2011
2012
2013
2014
2015
N (pp)HICP inflation
-1
0
1
2
3
41,000
1,500
2,000
2,500
3,000
2004
2005
2006
2007
2008
2009
2010
2011
2012
2013
2014
2015
N(s)HICP inflation
-1
0
1
2
3
40
2,000
4,000
6,000
8,000
10,00020
04
2005
2006
2007
2008
2009
2010
2011
2012
2013
2014
2015
N(n)HICP inflation
-1
0
1
2
3
40
200
400
600
800
1,000
1,200
2004
2005
2006
2007
2008
2009
2010
2011
2012
2013
2014
2015
N(nn)HICP inflation
Occasional Paper Series No 186 / April 2017 75
Chart A3.3 Inter-quartile range of quantitative inflation expectations according to qualitative response - euro area
(percentages)
Source: European Commission and authors' calculations
0
5
10
15
20
25
30
35
2004
2005
2006
2007
2008
2009
2010
2011
2012
2013
2014
2015
mean (pp)p25(q61a pp)p75 (q61a pp)
0
5
10
15
20
25
2004
2005
2006
2007
2008
2009
2010
2011
2012
2013
2014
2015
mean (p)p25(q61a p)p75 (q61a p)
0
2
4
6
8
10
12
2004
2005
2006
2007
2008
2009
2010
2011
2012
2013
2014
2015
mean (s)p25(q61a s)p75 (q61a s)
-25
-20
-15
-10
-5
0
2004
2005
2006
2007
2008
2009
2010
2011
2012
2013
2014
2015
mean (nn)p25(q61a nn)p75 (q61a nn)
Occasional Paper Series No 186 / April 2017 76
Annex 4 How do inflation expectations impact on consumer behaviour?
Recent low inflation and declining inflation expectations have been central to concerns about the prospect for the resilience of the Euro Area recovery. This drop in inflation expectations has rightly raised concerns about the Euro Area economy slipping into a deflationary equilibrium of simultaneously weak aggregate demand and low/negative inflation rates. According to mainstream economic theory, an increase in expected inflation should help lower real interest rates (due to the so-called Fisher Effect) and as a result boost consumption or aggregate demand by lowering households’ incentives to save. The relationship between inflation expectations and demand in the economy is potentially even more important when nominal interest rates are close to or constrained by the zero lower bound. In such circumstances, declines in inflation expectations imply a direct increase in the ex ante real interest rate. Hence lower inflation expectations may be associated with a tightening of overall financial conditions and in particular the real cost of servicing existing stock of debt for households and firms will rise accordingly. Such a dynamic risks putting the economy into a downward spiral associated with negative inflation rates, low growth and/or aggregate demand and real interest rates that are too high given the state of the economy. Conversely, the nature of the relationship between inflation expectations and aggregate demand is also central to prevailing knowledge on the transmission of non-standard monetary policies because the latter can be seen as signalling the central bank’s commitment to raising future inflation, lowering ex ante real interest rates and thereby support the recovery in aggregate demand.
In this annex we examine the impact of inflation expectations on consumer’s willingness to spend by exploiting the quantitative data on inflation expectations from the European Commission’s Consumer Survey. The dataset provides information on inflation expectations, perceptions about past inflation developments and other economic conditions (labour market, financial) at the individual consumer level and can be broken down by gender, age, income and other demographic features for all countries in the euro area (except Ireland). Hence it offers the prospect of robust empirical evidence on this key economic relationship and, most importantly, allows controlling for a host of other factors which may drive consumer spending behaviour.
Occasional Paper Series No 186 / April 2017 77
Chart A4.1 Readiness to spend and expected change in inflation (2003-2015)
Notes: One dot represents a country aggregate (weighted by individual weights) at one moment in time (identified by month and year). The expected change inflation is defined as the individual difference between inflation expectations and inflation perceptions. Sources: European Commission and authors' calculations.
A richer probabilistic model of consumer spending attitudes confirms the above graphical evidence that low or declining inflation expectations may weaken consumer spending. In particular, such a model provides more robust evidence on the link between inflation expectations and spending behaviour because it can control for a host of consumer specific and economy wide factors that may jointly impact on both spending and inflation expectations. The model is similar to that used in Bachman et al. (2015) and allows for the estimation of the marginal effects which measure the impact that a given increase in expected inflation will have on the probability that consumers will be willing to make major consumer purchases. In estimating this model, we find strong statistical evidence for the positive effect highlighted above. At the same time, the impact is quantitatively modest in the sense that other variables – such as perceptions about the general business climate, financial conditions or a households’ employment status play a quantitatively much more important role in determining the willingness of consumers to make major purchases.
Table A4.1 Average marginal effects of an expected change inflation on the likelihood of spending
Notes: *** p<0.01, ** p<0.05, * p<0.1. The table shows the average marginal effect (in percentage points) of a unit increase in the expected change in inflation on the probability that consumers are ready to spend given current conditions, estimated by the ordered logit model. “Demographics” group includes age, gender, education, employment status, income; “Other expectations and current financial status” group includes expectations of individual financial situation, general economic and unemployment situation and consumer current financial status, i.e. debtor or non-debtor; “Interactions” group includes pairwise interactions as follows: expected change in inflation - the expected financial situation, expected change in inflation - debt status, expected change in inflation - employment status, expected change in inflation – income, expected change in inflation – education; “Time dummies” group includes year dummies 2004 to 2015;ZLB (Zero Lower Bound) dummy takes value 1 from June 2014 to July 2015. Source: European Commission and authors' calculations.
ZLB=0 ZLB=1 DemographicsOther expectations and current financial status
Interactions Time dummies
0.260*** 0.302***
0.250*** 0.269*** X
0.268*** 0.280*** X X
0.293*** 0.305*** X X X
0.290*** 0.325*** X X X X
Average marginal effects
Expected change in inflation
Occasional Paper Series No 186 / April 2017 78
For example Table A4.1 reports the estimated marginal effects for different model specifications (i.e. control variables) and suggests that a 1.0 pp increase in expected inflation raises the probability of consumers being ready to spend by between 0.25 and 0.33 percentage points. Table A4.1 also distinguishes the estimated marginal effects between the recent period (2014-2015) when the zero lower bound on short-term interest rates has been binding (or close to binding) and the rest of the sample (2003-2014). The results suggest that the relationship between spending and inflation expectations becomes slightly stronger at the zero lower bound.
Occasional Paper Series No 186 / April 2017 79
References
Abe, N. and Ueno, Y. (2016) “The Mechanism of Inflation Expectation Formation among Consumers”, RCESR Discussion Paper Series No. DP16-1 March, Hitotsubashi University
Bachmann, Rüdiger, Tim O. Berg, and Eric R. Sims. (2015) "Inflation expectations and readiness to spend: cross-sectional evidence." American Economic Journal: Economic Policy 7.1: 1-35.
Baker, Scott R., Nicholas Bloom, and Steven J. Davis (2013) "Measuring economic policy uncertainty." Chicago Booth research paper 13-02
Bernanke, Ben S. (2010) "The economic outlook and monetary policy." Speech at the Federal Reserve Bank of Kansas City Economic Symposium, Jackson Hole, Wyoming. Vol. 27.
Biau, O., Dieden, H., Ferrucci G., Friz, R., Lindén, S (2010), “Consumers’ quantitative inflation perceptions and expectations in the euro area: an evaluation”; Conference by the Federal Reserve Bank of New York “Consumer Inflation Expectations”, November 2010.
Binder, C. (2015): "Measuring uncertainty based on rounding: new method and application to inflation expectations”, working paper.
Binder, Carola Conces.(2015b) "Consumer inflation uncertainty and the macroeconomy: evidence from a new micro-level measure." Available at SSRN
Bruine de Bruin, W., Manski, C. F., Topa G. and van der Klaauw, W. (2009): “Measuring consumer uncertainty about future inflation”, Federal Reserve Bank of New York Staff Report, Vol. 415.
Bruine de Bruin, W., Vanderklaauw, W., Downs, J. S., Fischhoff, B., Topa, G., and Armantier, O. (2010): “Expectations of Inflation: The Role of Demographic Variables, Expectation Formation, and Financial Literacy”, Journal of Consumer Affairs 44, No. 2: 381–402.
Bruine de Bruin, W., et al. (2013): “Measuring inflation expectations”, Annual Review of Economics, 2013. 5:273–301.
Bryan, M. and Guhan V. (2001): “The demographics of inflation opinion surveys”, Federal Reserve Bank of Cleveland Economic Commentary, Vol. October.
Burke, M. and Manz, M. (2011): “Economic Literacy and Inflation Expectations: Evidence from a Laboratory Experiment.”, Federal Reserve Bank of Boston Public Policy, Discussion Papers 11 (8): 1–49.
Carroll, Christopher D. (2003) "Macroeconomic expectations of households and professional forecasters." the Quarterly Journal of economics : 269-298.
Coibion, O. and Y. Gorodnichenko, (2012) “What Can Survey Forecasts Tell Us about Information Rigidities?, ” Journal of Political Economy , 120 (1 ) : 116—159.
Coibion, Olivier, and Yuriy Gorodnichenko. (2015)“Is the Phillips curve alive and well after all? Inflation expectations and the missing disinflation.” American Economic Journal: Macroeconomics 7: 197-232
Coibion, Olivier, Yuriy Gorodnichenko, and Saten Kumar, (2015) How Do Firms Form Their Expectations? New Survey Evidence. No. w21092. National Bureau of Economic Research
Curtin R. (2007) What U.S. Consumers Know About Economic Conditions, mimeo, University of Michigan, June.
Curtin R (1996) Procedure to Estimate Price Expectations, mimeo, University of Michigan, January.
D'Acunto, Francesco, Daniel Hoang, and Michael Weber. (2015) "Inflation Expectations and Consumption Expenditure." Available at SSRN 2572034.
European Commission (2014), "Inflation perceptions and expectation dynamics in the EU: evidence -from BCS survey data", European Business Cycle Indicators, 3rd quarter 2014, pp. 7-12: Cycle Indicators
Forsells M., & Kenny G., 2004. "Survey Expectations, Rationality and the Dynamics of Euro Area Inflation," Journal of Business Cycle Measurement and Analysis, OECD, Vol. 2004 (1), pages 13-41.
Giannone D & L. Reichlin & S. Simonelli, 2009. "Nowcasting Euro Area Economic Activity In Real Time: The Role Of Confidence Indicators," National Institute Economic Review, National Institute of Economic and Social Research, vol. 210(1), pages 90-97, October.
Krifka (2009) Approximate interpretations of number words: A case for strategic communication. In Hinrichs, Erhard & John Nerbonne (eds.), Theory and Evidence in Semantics, Stanford: CSLI Publications 2009, 109-132.
Lindén S. (2005), “Quantified perceived and expected inflation in the euro area – how incentives improve consumers’ inflation forecasts”, draft paper presented at the joint European Commission/OECD workshop on international development of business and consumer tendency surveys, 14-15 November.
Mankiw, N. Gregory, and Ricardo Reis. (2001) Sticky information: A model of monetary non-neutrality and structural slumps. No. w8614. National bureau of economic research.
Meyler, A. (1999) “A statistical measure of core inflation” Central Bank of Ireland Research Technical Paper No 2/RT/99.
Pfajfar, D. and Santoro E., (2008): “Asymmetries in inflation expectation formation across demographic groups”, Cambridge Working Papers in Economics, Vol. 0824.
Souleles, Nicholas S. (2004)"Expectations, heterogeneous forecast errors, and consumption: Micro evidence from the Michigan consumer sentiment surveys." Journal of Money, Credit and Banking 39-72.
Trehan, Bharat. (2015) "Survey measures of expected inflation and the inflation process." Journal of Money, Credit and Banking 47.1: 207-222.
Acknowledgements The report benefited from comments by Björn Döhring (DG ECFIN), Luc Laeven, Hans-Joachim Klöckers, Aurel Schubert, Christiane Nickel, Caroline Willeke, Günter Coenen, Thomas Westermann, Henrik Schwartzlose (all ECB) and Carola Binder. Sylvie Bescos (DG ECFIN) provided IT and data support. All remaining errors are under the full responsibility of the authors. The anonymised micro data set on quantitative inflation perceptions and expectations is not regularly published and was provided to the ECB by DG ECFIN for joint research purposes, following the agreement by all national partner institutes in the “Joint Harmonised EU Programme of Business and Consumer Surveys”. The agreements between DG ECFIN and the ECB concerning data access rights, storage, security and dissemination of the data are governed by a Memorandum of Understanding, signed by the Director-Generals of DG ECFIN and the ECB’s DG Statistics in July 2015. This paper should not be reported as representing the views of the European Commission. The views expressed are those of the authors and do not necessarily reflect those of the European Commission. Rodolfo Arioli Directorate-General Economics, European Central Bank; email: [email protected] Colm Bates, Directorate-General Statistics, European Central Bank; email: [email protected] Heinz Dieden Directorate-General Statistics, European Central Bank; email: [email protected] Ioana Duca Directorate-General Research, European Central Bank; email: [email protected] Roberta Friz Directorate-General for Economic and Financial Affairs (DG ECFIN), European Commission; email: [email protected] Christian Gayer Directorate-General for Economic and Financial Affairs (DG ECFIN), European Commission; email: [email protected] Geoff Kenny Directorate-General Research, European Central Bank; email: [email protected] Aidan Meyler Directorate-General Economics, European Central Bank; email: [email protected] Iskra Pavlova Directorate-General Statistics, European Central Bank; email: [email protected]
Postal address 60640 Frankfurt am Main, Germany Telephone +49 69 1344 0 Website www.ecb.europa.eu
All rights reserved. Any reproduction, publication and reprint in the form of a different publication, whether printed or produced electronically, in whole or in part, is permitted only with the explicit written authorisation of the ECB or the authors.
This paper can be downloaded without charge from www.ecb.europa.eu, from the Social Science Research Network electronic library or from RePEc: Research Papers in Economics. Information on all of the papers published in the ECB Occasional Paper Series can be found on the ECB’s website.
ISSN 1725-6534 (pdf) DOI 10.2866/953408 (pdf) ISBN 978-92-899-2848-9 (pdf) EU catalogue No QB-AQ-17-006-EN-N (pdf)