67
May 9, 2018 Occidental Petroleum Corporation First Quarter 2018 Earnings Conference Call

May 9, 2018
Occidental Petroleum Corporation
First Quarter 2018Earnings Conference Call

2
Cautionary Statements
Forward-Looking StatementsThis presentation contains forward-looking statements based on management’s current expectations relating to Occidental’s operations,
liquidity, cash flows, results of operations and business prospects. Words such as “estimate,” “project,” “predict,” “will,” “would,” “should,”
“could,” “may,” “might,” “anticipate,” “plan,” “intend,” “believe,” “expect,” “aim,” “goal,” “target,” “objective,” “likely” or similar expressions that
convey the prospective nature of events or outcomes generally indicate forward-looking statements. You should not place undue reliance on
these forward-looking statements, which speak only as of the date of this presentation. Actual results may differ from anticipated results,
sometimes materially, and reported results should not be considered an indication of future performance. Factors that could cause actual
results to differ include, but are not limited to: global commodity pricing fluctuations; changes in supply and demand for Occidental’s products;
higher-than-expected costs; the regulatory approval environment; not successfully completing, or any material delay of, field developments,
expansion projects, capital expenditures, efficiency projects, acquisitions or dispositions; technological developments; uncertainties about the
estimated quantities of oil and natural gas reserves; lower-than-expected production from operations, development projects or acquisitions;
exploration risks; general economic slowdowns domestically or internationally; political conditions and events; liability under environmental
regulations including remedial actions; litigation; disruption or interruption of production or manufacturing or facility damage due to accidents,
chemical releases, labor unrest, weather, natural disasters, cyber-attacks or insurgent activity; failures in risk management; and the factors set
forth in Part I, Item 1A “Risk Factors” of the 2017 Form 10-K. Unless legally required, Occidental does not undertake any obligation to update
any forward-looking statements, as a result of new information, future events or otherwise.
Use of non-GAAP Financial InformationThis presentation includes non-GAAP financial measures. You can find the reconciliations to comparable GAAP financial measures on the
“Investors” section of our website.

3
Occidental Petroleum
• 1Q18 Highlights
• Breakeven Plan Progress
• Financial Summary and Guidance
• Permian Resources Update
• Closing Remarks

4
First Quarter 2018 Key Takeaways
International
Permian EOR
Chemicals
Midstream
Breakeven Plan
Ahead of schedule
Added 18 Mboed in
Permian Resources
Raised 2018 Guidance
+ 2 Mboed Total Production
+ $100 MM EBIT Chemicals
+ $750 MM EBIT Midstream
Strong FCF
Our differentiated approach is creating significant value for our
shareholders through cash flow generation with growth

5
First Quarter 2018 Highlights
Capital Efficiency
• Aventine online realizing well-cost
savings and reliability of resources
• Increased feet drilled per day in
Permian Resources by 19% from
1H17
CO2-EOR Advancement
• Continued progression in Midland
and Delaware Basins with
unconventional EOR pilots with
CO2 and miscible hydrocarbon gas
Well Productivity Improvement
• Sustained Greater Sand Dunes well
results with 16 wells online
averaging 30D production rates of
3,100 Boed
• Improved current Barilla Draw
development area well
performance by 45% from 2017
Low-Breakeven Inventory Additions
• Successfully appraised three new
Delaware benches and one new
field
Export Facility
• Secured third-party barrels to
enhance value of oil export terminal
Asset Optimization
• Sold non-strategic interest
in Delaware Basin
midstream infrastructure for
$154 MM
Asset Start-ups
• 4CPe Plant began
generating income with
ramp-up through 1H18
Improved Realizations
• Firm oil and gas takeaway
capacity in excess of growth
plans to multiple market
centers
Advanced Technologies and Operations
Increased the Value of our Assets
Enhanced Our Portfolio

6
Oxy’s Unique Value Proposition Returns Focused Growth
Returns Focused Growth
> 5% – 8+% average production growth in oil & gas
> Above cost-of-capital returns
> Return Targets: Domestic – 15+% International – 20+%
Consistent Dividend Growth
Strong Balance Sheet
ROCE Leadership
Executive Compensation Aligned
Growth within Cash Flow
Robust, Low-Cost Inventory
Industry-leading Decline Rate
> Growing dividend with an attractive yield
> Value protection in down cycle
> Promotes capital allocation discipline
> Maintain ample cash balance and sources of liquidity
> Low debt-to-capital ratio
> Income-producing assets

7Subsurface Technical Excellence
Operational Efficiency & Speed
Logistics & Strategic Relationships
Infrastructure Investment
Product Transport & Realizations
Enhanced Recovery
Shaping Oxy’s Competitive Advantage
Subsurface Technical
ExcellenceBasin-leading
Wells
Operational
Efficiency & Speed
New Mexico D&C
Outperformance
Logistics & Strategic
Relationships
Aventine
Logistics Hub
Infrastructure
Investment
Leader in Water
Recycling
Production Transport
& Realizations
Oil Terminal &
Secure Takeaway
Enhanced Oil
Recovery
Unconventional
& CCUS
Leadership
Permian Execution Excellence

8
Exceeding Cash Flow Expectations
1,4751,600
Breakeven Plan
Annual Target
1Q18
Chemicals
450
800
Breakeven Plan
Annual Target
1Q18
Midstream
Market and operational improvements:
• Mid to Gulf Coast Differentials
• Export Margin
• Gas, NGLs and Sulfur Margin
Market improvements:
• Improved Caustic Soda pricing
• Improved PVC pricing
• Lower Ethylene input cost
300 330285 285
Annualized CFFO $ MM1
850
1,365
1Q17 1Q18
430500
Permian EOR
Market and operational improvements:
• Production increased 6%
• Oil price improved 21%
1CFFO excludes working capital changesAnnual Capital $ MM

9
Occidental Petroleum
• 1Q18 Highlights
• Breakeven Plan Progress
• Financial Summary and Guidance
• Permian Resources Update
• Closing Remarks

10
0.0
1.0
2.0
3.0
4.0
5.0
6.0
1Q18 Annualized
CFFO Adjusted to
$40 WTI
Chemicals Midstream &
Marketing
Remaining 32
Mboed Permian
Resources
Production
Cash Flow Neutral
at $40 WTI
Increase in Cash
Flow at $50 WTI
Cash Flow
Breakeven with
5%-8% Growth
at $50 WTI
$4.0
$4.1 $4.2$4.5
Current
Dividend
$2.4
Sustaining
Capital
$2.3
~$120 MM per $1
Change oil price
Current
Dividend
$2.4
Sustaining
Capital
$2.1
Cash Flow Breakeven at $50:
Dividend + 5% – 8% Production Growth $5.7 $5.7
Op
era
tin
g C
ash
Flo
w (
$ B
n)
Growth Capital$1.0
Cash Flow Neutral at $40:
Dividend with Flat Production
Cash Flow Breakeven at Low Oil Prices Achieved in 3Q18
$4.5$4.3 Actual
1Q18 Positive Midstream and
Chemicals Market Above Plan
Net of Middle East Downtime

11
$0.17$0.20
$0.54
$0.47
$0.20
$0.30
$0.91
$0.23
0.0
0.2
0.4
0.6
0.8
1.0
Chemicals Midstream Permian Resources
Production
Other
Improvements
Annualized Cash Flow From Operations Improvements ($ Bn)
Breakeven PlanAchieved since 1Q17
SSAU Synergies and
~$50/ton Caustic
Soda Realizations
Achieved
4CPE Plant
Ramp-up
through 1H18
Al Hosn Optimization
and Crude Terminal
Capacity Upgrade
Remaining
32 Mboed
Growth
Remaining
Achieving Goals to Cash Flow Breakeven at $50
4CPe Plant contributed to cash
flow during 1Q18 and will
achieve peak-rate in 3Q18.
Marketing differential averaged
$3.12 in 1Q18 surpassing our
$2.10 per barrel breakeven
plan assumption
Added 18 Mboed of
Permian Resources
production sequentially and
48 Mboed since 1Q17 net of
~5 Mboed divestment
Midstream and Chemicals
capitalized on improved
market environments
Seasonality/Downtime
1 Downtime includes upstream cash flow for Dolphin and Al Hosn
1Q18 Positive
Midstream and
Chemicals Market Above
Plan Net of Middle East
Downtime1
12
Occidental Petroleum
• 1Q18 Highlights
• Breakeven Plan Progress
• Financial Summary and Guidance
• Permian Resources Update
• Closing Remarks
13
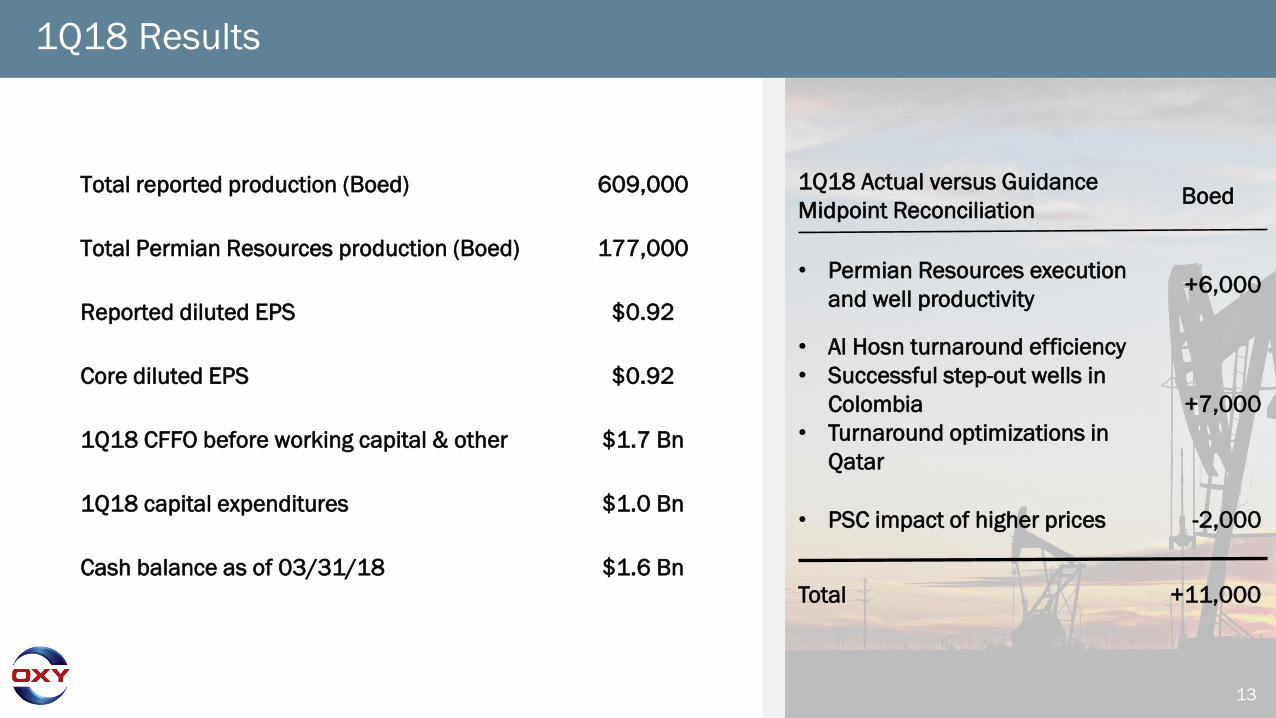
1Q18 Results
Total reported production (Boed) 609,000
Total Permian Resources production (Boed) 177,000
Reported diluted EPS $0.92
Core diluted EPS $0.92
1Q18 CFFO before working capital & other $1.7 Bn
1Q18 capital expenditures $1.0 Bn
Cash balance as of 03/31/18 $1.6 Bn
1Q18 Actual versus Guidance
Midpoint ReconciliationBoed
• Permian Resources execution
and well productivity+6,000
• Al Hosn turnaround efficiency
• Successful step-out wells in
Colombia
• Turnaround optimizations in
Qatar
+7,000
• PSC impact of higher prices -2,000
Total +11,000

14
YTD 2018 Cash Flow and Cash Balance Reconciliation
Beginning Cash
Balance 1/1/18
CFFO Before
Working Capital
Change in
Working Capital
Dividends Capital
Expenditures
A&D/Other
Investing
Debt/Other
Financing
Ending Cash
Balance 3/31/18
$1.6
($0.6)
$1.7
$1.7
($1.0)
($0.7)
$0.1
$0.5
($ in Bn)

15
2018 Guidance
Oil & Gas Segment
• FY 2018E Production
> Total production of 645 – 665 Mboed
> Permian Resources production of 198 – 210 Mboed
> International production of 289 – 295 Mboed
• 2Q18E Production
> Total production of 628 – 648 Mboed
> Permian Resources production of 188 – 198 Mboed
> International production of 281 – 290 Mboed
> Al Hosn Gas production of 66 – 69 Mboed
> Dolphin production of 42 Mboed
> Qatar production of 51 – 53 Mboed
• Commodity Price Assumptions
> 2Q18E– 4Q18E assumes $63 WTI / $67 Brent
Production Costs – FY 2018E
• Domestic Oil & Gas: ~$12.50/ boe
Exploration Expense
• ~$25 MM in 2Q18E
• ~$150 MM in FY 2018E
DD&A – FY 2018E
• Oil & Gas: ~$13.50/ boe
• Chemicals and Midstream: $715 MM
Midstream
• $250 – $300 MM pre-tax income in 2Q18E
> Midland – MEH spread of $7.00 - $8.00 / bpd
• $900 - $1,100 MM pre-tax income in FY 2018E
> Midland – MEH spread of $6.00 - $6.75 / bpd
Chemical Segment
• ~$300 MM pre-tax income in 2Q18E
• ~$1,100 MM pre-tax income in FY 2018E
Corporate
• FY 2018E Total Company tax rate: 32%
• FY 2018E Int'l tax rate: 45%
• Interest expense of $90 MM in 2Q18E

16
Cash Flow Sensitivities in 2Q18
Oil & Gas
> Annualized cash flow changes ~$110 million per ~$1.00 / bbl change in oil prices
• ~$80 million per ~$1.00 / bbl change in WTI prices
• ~$30 million per ~$1.00 / bbl change in Brent prices
> Annualized cash flow changes ~$40 million per ~$0.50 / Mmbtu change in natural gas prices
> Annualized production changes 800 – 1,000 boed per ~$1.00 / bbl change in Brent prices
Chemicals
> Annualized cash flow changes ~$30 million per ~$10 / ton change in realized caustic soda prices
Midstream
> Annualized cash flow changes ~$45 million per ~$0.25 / bbl change in Midland to MEH spread

17
Occidental Petroleum
• 1Q18 Highlights
• Breakeven Plan Progress
• Financial Summary and Guidance
• Permian Resources Update
• Closing Remarks

18
2,883
3,421
3,622
-
50
100
150
200
250
300
350
0 30 60 90 120 150 180
3rd Bone Spring / Wolfcamp XY Performance
-
50
100
150
200
250
300
350
0 30 60 90 120 150 180
2nd Bone Spring Performance
Subsurface Technical Excellence – Basin-leading Wells
Notes: 1Three stream production results.
Productivity
• 1Q18 & 2H17 Peak 30D ~3,100 Boed1
• 2 successful appraisal wells in Red Tank field
• Record 2-well pad in 1Q18 Peak 30 Day
>10,000 BOED1 - Wolfcamp XY ~9,700 ft
Sustainable Step Change in Well Results from 2H17 into 1Q18
2016 Average
10 Wells ~5,000’
2H17 – 10 Wells
~7,200’
2016 Average
6 Wells ~4,800’
2H17 - 14 Wells
~6,200’
Q1 2018 - 13 Wells
~7,300’
Q1 2018 - 3 Wells
~9,600’
Oil (Bod)
Gas (Boed)
NGL (Boed)
2H17 & 1Q18 Wells – Peak 30D Production Rates1
2nd Bone Spring
3rd Bone Spring
Wolfcamp XY
27 Wells ~6,800'
8 Wells ~8,100'
5 Wells ~7,100'
Cu
mu
lati
ve P
rod
ucti
on
(M
bo
e)
Days Online

19
3Q17 4Q17 1Q18 2Q18E 3Q18E 4Q18E
177
188 - 198
208 - 220
220 - 246
159
Permian Resources Production (MBoed)
Increased Total Year Production Guidance 2 MBoedBreakeven Plan Milestone Achieved in 3Q18Q1 production exceeded guidance
Bre
ake
ven
Pla
n A
ch
ieve
d+
80
Mb
oe
d f
rom
1Q
17
139
QoQ Growth: 14% 11% 9% 11% 9%
Wells Online: 28 45 35 55 - 65 56 - 62 38 - 44
+18 M
bo
ed
fro
m 4
Q1
7
~47% Production Growth
• New Mexico
> Greater Sand Dunes delivers
more great wells
> Better productivity shifted
artificial lift installations to Q2
• Barilla Draw
> Recent wells deliver 60 day
cum ~45% above 2017
• Delivered production
despite Q1 weather
impact of 2 MBoepd

20
Aventine – Strategic Relationships that Secure Supply and Lower Costs
3Q 2016
• Acquired land
• Project officially broke ground
• Facility operational
• Frac sand transloading
• Sandstorm logistics system
• Sooner Pipe OCTG facility
1Q 2018
3Q 2018E• Schlumberger facility online
• Expected savings of $500 - $750k
per well
2019E• Maintenance support for base
production and OpEx reduction
• Design concept approved
2Q 2017
> 14 unit trains of frac sand delivered
> 1,400 tons of pipe delivered
> Sandstorm logistics system
implemented
> Broke ground on Schlumberger and
HCL facility
> Facility directly supports New Mexico
operations with contingency support
to Texas Delaware20
18
Op
era
tin
g H
igh
ligh
ts

21
• Pipe Yard has 16 rail car spots
• 50,000 tons of storage
• Pipe from rail line instead of trucked
from Houston
• 24-hour access with the ability to
service more than 20 rigs
Dedicated personnel, services and equipment:• Directional drilling
• Cementing
• Fracturing
• Wellhead and frac tree systems
• Northern white sand supply
• Regional sand supply
• Sand mine to Aventine logistics
• Sand transloading terminal operations
• Sand last mile logistics and wellsite
storage provider
- Service Provider Facility
- Sand Provider
- Facility Operator
- OCTG
Logistics & Strategic Relationships – Aventine Logistics Hub
• HCl facility has 14 rail car spots
• OxyChem is expected to be the HCl provider
Secure Supply
• 240 acres in Eddy County, NM within 20 miles of Greater
Sand Dunes and other future development areas
• 30,000 tons of sand storage + transload capacity
• 2 unit train loops with ability to expand to 3 located off
major rail line
• Supports 10-12 rigs per year
• Secures availability of critical materials
• Reduces costs by $500 - $750 k per well
• Reduces spare equipment and personnel needed on location
• Reduction in last mile logistics cost
• Dedicated equipment maintenance facilities
• Sand and OCTG savings start 1Q18, other components fully
operational 3Q18HCl Provider
Lower Costs
HCl Facility

22
776 710
906
1H17 2H17 1Q18
*Drilling days measured from rig release of the previous well to rig release of the current well, excludes shallow casing set by small rig.
1H17 2H17 1Q18
749839
922
23% Increase
Operational Highlights
• Drilled Lower Spraberry 10,000 ft lateral well in
Midland Basin in under 10 days*
• Drilled 2nd Bone Spring 10,000 ft lateral well in New
Mexico in under 14 days*
• Drilled 9,600 ft of lateral in 44 hours on the Corral
Fly 02-01 22H
• Designed, tested, and implemented ten 10,000 ft
wells with 5 ½’’ casing in 6 ¾’’ hole
• Increased stages per day in New Mexico 19% from
1H17
• New Mexico frac core averaged 10 stages/day in a
month
• Achieved 14 stages per day on the Cedar Canyon 29
Fed 24H, 25H, and 26H.
Operational Efficiency & Speed – D&C Outperformance
17% Increase
New Mexico Feet Drilled per Day
Texas Feet Drilled per Day

23
Production Transport & Realizations – Ample Takeaway
Committed Oil
Takeaway
Committed
Gas Takeaway
Committed Oil & Gas Takeaway Ensures Products are Realized in Multiple Markets
> Multi-year firm oil commitments on four, third-party pipelines
• Total capacity ~470 Mbod to Gulf Coast
• Retain flexibility on third-party volumes gathered and transported
• Cactus supplies Corpus Christi Oil Terminal
> 100% owned Centurion Pipeline
> Gas capacity in-basin to receipt points that move gas to multiple markets
• Provide optionality on gas realizations
• Additional capacity on Gulf Coast Express expected 4Q19
Texas
Permian & Waha
In-Basin Firm Capacity to Gas Hubs
New Mexico
Future Oil
Committed Takeaway
Sales to
3rd Parties
24
Occidental Petroleum
• 1Q18 Highlights
• Breakeven Plan Progress
• Financial Summary and Guidance
• Permian Resources Update
• Closing Remarks

Appendix

26
Appendix Contents
• Peer Metrics
• Social Responsibility, Environment, and Governance
• 2017 Reserves
• Permian Updates
• Chemicals, Midstream and International Updates

27
Average Shareholder Payout Ratio (%)1
Shareholder Distributions Over the Last Three Years (2015– 2017)
1 Source: Company filings and Factset. Shareholder distributions include dividends and share repurchases. Peers 1 – 8 include APC, APA, COP, CVX, EOG, HES, MRO, XOM
4.3%
3.8%3.6%
3.4%
2.1% 2.1% 2.0%
0.8% 0.7%
OXY 4 3 6 1 2 5 7 8
64%
52%49% 48%
38%34%
17% 15% 13%
OXY 3 6 4 7 1 2 5 8
> Strong history and commitment to shareholder returns
> Confidence in asset capabilities and conservative balance sheet allows us to sustain dividend through cycle
> Improving payout ratio through high-margin growth with leadership in ROCE
43
25
98
2 1 1 1 1
3 4 6 OXY 7 1 8 5 2
4.48
3.43
3.29
2.52
1.38 1.241.00
0.79 0.34
4 3 OXY 6 1 7 5 8 2
Average Shareholder Payout per Share ($/Sh)1
Cumulative Distributions ($Bn)1
Average Shareholder Distribution Yield (%)1

28
Strong Balance Sheet - Oxy Credit Ratings Vs. Peers
Source: Factset, 02/12/2018
Company S&P
Ratings
S&P
Outlook
Moody’s
Ratings
Moody’s
Outlook
XOM AA+ Negative Aaa Stable
CVX AA- Negative Aa2 Stable
OXY A Stable A3 Stable
EOG BBB+ Stable Baa1 Stable
COP A- Stable Baa1 Stable
PXD BBB Stable Baa3 Stable
APA BBB Stable Baa3 Stable
NBL BBB Negative Baa3 Stable
DVN BBB Stable Ba1 Stable
APC BBB Stable Ba1 Stable
MRO BBB- Stable Ba1 Stable
HES BBB- Stable Ba1 Stable
CXO BBB- Stable Ba1 Positive
CLR BB+ Stable Ba3 Positive
WPX B+ Stable B2 Stable
WLL BB- Stable B3 Positive

29
Short and Long-term Executive Compensation Changes
1 For CEO, 80% of target value is linked to company performance; 20% is based on individual performance. 2 CROCE defined as (Net Income + DD&A + After-tax Interest Expense) / Average (Total Debt + Total Equity).
Expanded use of returns-based metrics for incentive compensation
15% of CEO annual bonus1 is determined by CROCE2, with a
performance target of 19%
Improved alignment with shareholders
25% of CEO long-term incentive compensation is determined by
CROCE, with a performance target of 20%. CEO long-term incentive is
70% performance-based
Consistent with our historical practices
CROCE-based compensation
~20%
2018 CEO Compensation
at Target
Short-term Incentives Long-term Incentives

30
Appendix Contents
• Peer Metrics
• Social Responsibility, Environment, and Governance
• 2017 Reserves
• Permian Updates
• Chemicals, Midstream and International Updates

31
Occidental Climate Report issued in March 2018
Stated Goals
In addition to our ongoing efforts to conserve resources and reduce
emissions, we have made new commitments to:
• Regularly evaluate our strategy with Board oversight under various lower-
carbon scenarios
• Model carbon prices and related financial impacts in capital spending
plans for major projects
• Develop new metrics for carbon dioxide and methane emissions to better
inform decision-making and enhance transparency
• End routine gas flaring by 2030
• Add an executive compensation metric related to the advancement of
CCUS
• Support industry emissions-reductions efforts as part of the American
Petroleum Institute-sponsored Environmental Partnership
Report available on the Investors and Social Responsibility sections of Oxy.com
32
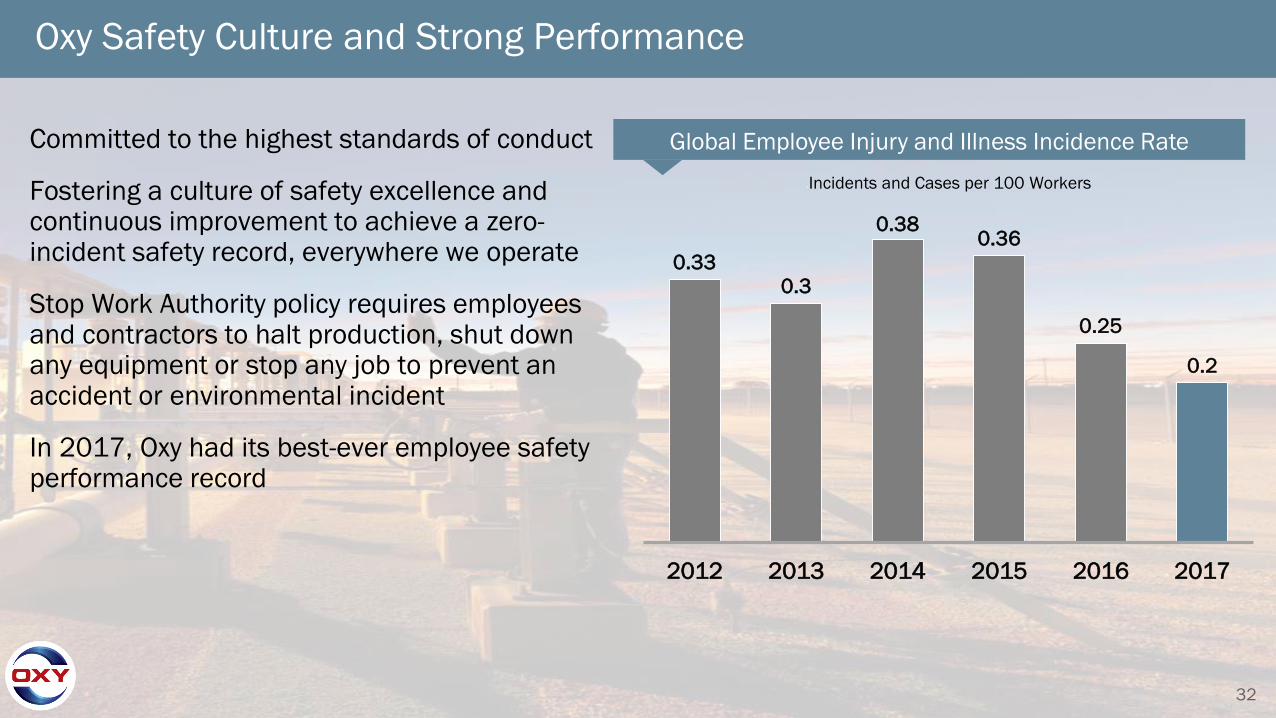
Oxy Safety Culture and Strong Performance
Committed to the highest standards of conduct
Fostering a culture of safety excellence and continuous improvement to achieve a zero-incident safety record, everywhere we operate
Stop Work Authority policy requires employees and contractors to halt production, shut down any equipment or stop any job to prevent an accident or environmental incident
In 2017, Oxy had its best-ever employee safety performance record
•Incidents and Cases per 100 Workers
Global Employee Injury and Illness Incidence Rate
0.33
0.3
0.380.36
0.25
0.2
2012 2013 2014 2015 2016 2017
33
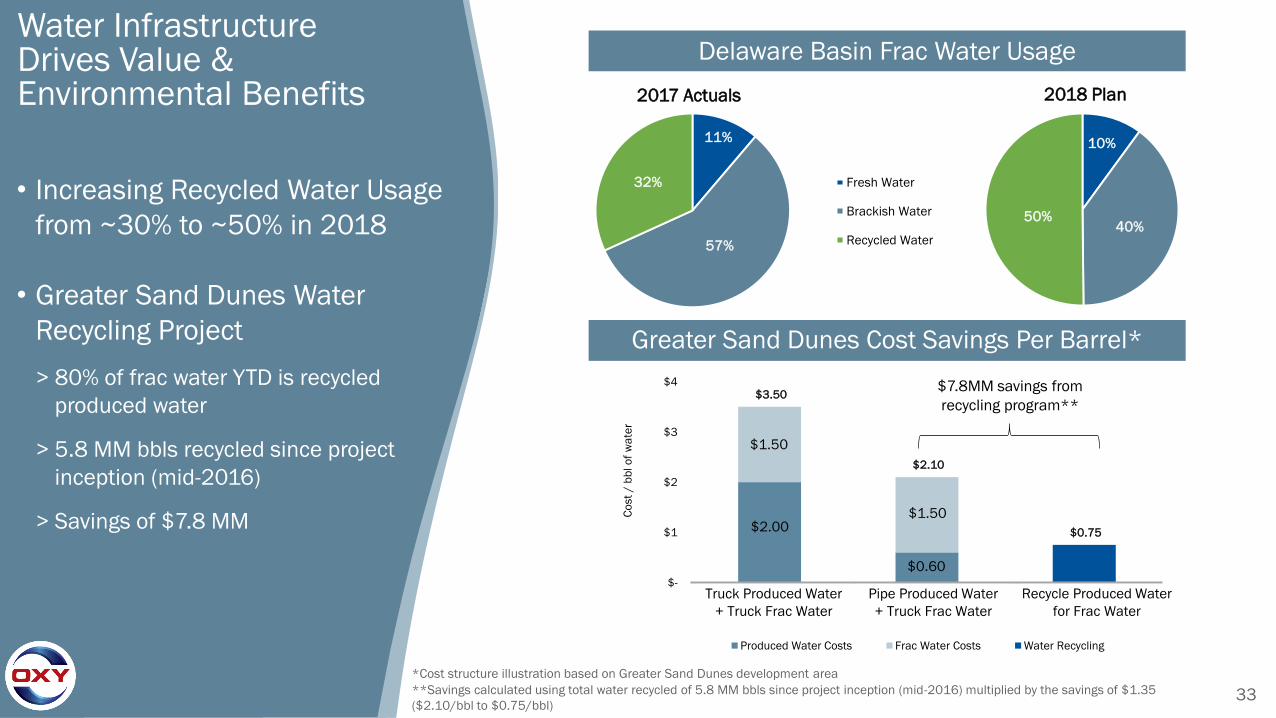
Water Infrastructure Drives Value & Environmental Benefits
$3.50
$2.10
$0.75
$-
$1
$2
$3
$4
Original Improved Current
Co
st
/ b
bl o
f w
ate
r
Produced Water Costs Frac Water Costs Water Recycling
Greater Sand Dunes Cost Savings Per Barrel*
$7.8MM savings from
recycling program**
Delaware Basin Frac Water Usage
*Cost structure illustration based on Greater Sand Dunes development area
**Savings calculated using total water recycled of 5.8 MM bbls since project inception (mid-2016) multiplied by the savings of $1.35
($2.10/bbl to $0.75/bbl)
Truck Produced Water
+ Truck Frac Water
Pipe Produced Water
+ Truck Frac Water
Recycle Produced Water
for Frac Water
$1.50
$2.00$1.50
$0.60
• Increasing Recycled Water Usage
from ~30% to ~50% in 2018
• Greater Sand Dunes Water
Recycling Project
> 80% of frac water YTD is recycled
produced water
> 5.8 MM bbls recycled since project
inception (mid-2016)
> Savings of $7.8 MM
11%
57%
32% Fresh Water
Brackish Water
Recycled Water
10%
40%50%
2017 Actuals 2018 Plan

34
CO2 EOR Process
34

35
How does CO2EOR Work
Physics of Miscible CO2 EOR at Pore Scale
• Water injection (blue) recovers oil in
large pores; leaving trapped oil (red)
in small pores
• CO2 (yellow) dissolves and displaces
trapped oil; leaving only heavy ends
(brown) in the reservoir
• The process is normally finalized by
injecting chase water after the CO2.
Sequestered CO2 remains
permanently trapped in the pore
spaces

36
Appendix Contents
• Peer Metrics
• Social Responsibility, Environment, and Governance
• 2017 Reserves
• Permian Updates
• Chemicals, Midstream and International Updates

37
Total Company
Reserve
Replacement
2017
187%
All In
162% Organic
YE 2016
Reserves
Production* Additions Acquisitions &
Sales
YE 2017
Reserves
2,406 (220)
3572,59855
74% Proved
Developed
75% Liquids
All reserves are in Mmboe. *2017 Production includes South Texas.
2017 Reserve Additions Through Program Execution
200 MMBoe Reserve Additions prior to price revisions

38
Successful Drilling and A&D Programs Leading to Lower F&D Costs
> Positive total-company performance revisions
> Improved productivity and lower well costs in Permian Resources
> Purchased ~80 MM Boe more barrels than sold in Permian transactions
> Expanded capacity at Al Hosn Gas
> Successful extension of Oman Block 9 contract
$18.05 $18.36
$8.34
5 Year 3 Year 2017
F&
D C
osts
(O
rga
nic
)*
*Refer to 4th Quarter Earnings Release for definitions of F&D calculations.
Occidental incurred approximately $0.7 Billion to convert proved undeveloped reserves to proved developed reserves.
$17.96 $17.22
$8.53
5 Year 3 Year 2017
F&
D C
osts
(A
ll S
ou
rce
s)*
Program Execution Highlights

39
Appendix Contents
• Peer Metrics
• Social Responsibility, Environment, and Governance
• 2017 Reserves
• Permian Updates
• Chemicals, Midstream and International Updates

40
D&C
70%Facilities
15%
OBO
10%
Other
5%
Greater Barilla Draw ~4 rigs
Permian Resources Acreage
Permian EOR Acreage
Greater Sand Dunes ~5.5 rigs
Turkey Track ~0.5 rigs
2018
Capex
$1.9 B
13 Rigs
195
Wells
Online
11
Development
Rigs
2 Net Non-op Rigs
180
Development
Wells
2018 Capital by Type
2018 Well Count 2018 Rig Count
Permian Resources 2018 Focused Development
Permian Resources 2018 Program
Midland Basin ~1 rig
• Appraise 6 new benches
• Additional Unconventional
CO2-EOR pilots
• Logistics hub in New Mexico
online
• Logistics solutions in TX
Delaware
• First 2.5 mile laterals
• Expanding produced water
recycling
15 Appraisal Wells

41
0
5
10
15
20
25
30
Jan - Jul 2017 Avg Sep-2017 Dec-2017
Mb
oe
d
SSAU Gross Production
Creating Value at the Seminole San Andres Unit
Increased Production 3,600 Boed or 16%
$0
$100
$200
$300
$400
$1/Boe $2/Boe $3/Boe $4/Boe $5/Boe
Value of Opex Synergies ($MM PV10)
Acquired Interest Existing Interest
• Increased plant inlet volume 32%
• Reduced flaring by 60%
• Implemented surveillance workflows
Reduced Redrill Capital Costs by 36% Greater than $5/Boe Opex Reduction
0
50
100
150
200
250
300
350
Prior Operator AFE Oxy Planned Oxy Actual
IP 3
0 B
oe
d
SSAU Redrill Well Productivity
• Savings utilizing Permian scale
• Implemented Oxy well design
• Operating capability improved efficiency
$0.0
$0.5
$1.0
$1.5
Prior Operator AFE Oxy Planned Oxy Actual$
MM
SSAU Redrill Well Cost
$0
$100
$200
$300
Oxy Planned Oxy Actual
$ M
M
SSAU Lift Revision Cost
$0
$10
$20
$30
Prior Operator Opex Oxy Current Opex Oxy Opex Target
Op
ex
$/b
oe
SSAU Opex
>$5/Boe
reduction to-date
• Optimized Purchased Injectant
• Well Enhancement Execution
• Optimized Resource Deployment

42
Turkey Track - New Modular Development Area
Greater Sand Dunes
Innovative Development Provides Scale
Advantages to Regional Areas
Multi-bench potential
Modular Facilities
Utilizes Basin Synergies
Turkey Track – Cumulative Production
-
50
100
150
200
250
300
350
400
450
0 30 60 90 120 150 180
Cu
mu
lati
ve M
Bo
e
New Mexico Modular Development Area
Leveraging Permian Scale to Realize
Value in Smaller Development Areas
Turkey Track – North Delaware Basin
• Greater than 40% all-in ROR at $50 WTI
• Successful appraisal of 3rd Bone Spring
• Well costs 25% below target costs
$7.7MM per well – 10,000’
• Drilled in 20 days
Begin development of 3rd Bone Spring
in 2Q18
Similar scale opportunities available
in other areas of the Permian Basin
Southeast New Mexico
3rd Bone Spring
1 well ~ 9,800’
Days Online
2nd Bone Spring
7 wells ~ 9,700’
Future 3rd Bone Spring Development
Future 2nd and 3rd Bone Spring Development

43
-
50
100
150
200
250
300
350
- 30 60 90 120 150 180 210 240 270 300 330 360
Cu
m M
Bo
e
Days Online
$4.31
$2.36
$4.15 $3.92
$9.75
$-
$2
$4
$6
$8
$10
$12
Red Bull South Mentone Lockridge Barilla - Birds of Prey
Area
Tx Delaware - Total
Operated Fields
Ro
llin
g 1
2 M
on
th O
pe
x/B
oe
Excellent results across multiple fields
• Barilla Draw proper 45% improvement in
Wolfcamp A
• First Oxy Hoban well peak 30D of 1,973 Boed
• Successful Wolfcamp C appraisal in Lockridge
field with 30D peak of 1,758 Boed
• Continued landing optimization in Red Bull
South acreage
Horizontal development improving margins
• Below $5/Boe opex in fields with primarily
horizontal wellsFour Greater Barilla Draw fields with all or almost all
horizontal development
Includes ~700
vertical wells
Hz well count: 62 11 19 18
Avg. Hz well age: ~2 years ~ 2.5 years ~1.5 years ~3 years
2018 Average
6 wells ~7,500’
2017 Average
8 wells ~6,700’
Pre-2017 Wolfcamp A Wells
Avg. Lateral ~4,700’
2017 Barilla Draw proper– Wolfcamp A & Hoban Optimized Landing Point Results
Hz Development Yields Low Operating Costs
Greater Barilla Draw Operating Excellence

44 -
20
40
60
80
100
120
140
160
180
- 30 60 90 120 150 180 210 240 270 300 330 360
Cu
m O
il -
MB
o
Midland Basin - Merchant
Operating cost <$2.75/Boe
• Horizontal only development
• 10,000 ft wells go-forward
• Centralized facilities and ample water
disposal capacity
• Infrastructure in place to increase margins
Two play-leading benches under
development
• Landing point optimized flow units
• Strong performance in Wolfcamp A and
Wolfcamp B benches
• Wolfcamp B performance +26%
$2.70
$-
$1
$2
$3
2017-2018
Downhole Maint Surface Other
Merchant Opex / Boe Successful Development Planning
from Inception Leads to Greenfield
Operating Cost
• First wells online in 2014
• 57 horizontals online
• Centralized facilities
• No water hauling with truck
• Central compression for gas lift
• Gas lift limits well failures and
downhole cost
New WC B Design
All WC A Wells
Pre 2017 WC B Design
Multi-bench program and operating efficiency create play-leading opex
Wolfcamp B Improvement = two high-return development benches

45
Primary Development Production
Permian EOR
Oxy Operated Grass Roots CO2
Flood and Current Development
Area
Phased Development Approach
Oxy’s CO2 EOR Capability Can Grow
Production of Mature Fields
• ~55% Expected Ultimate Recovery
• Long-lived Reserves
• CO2 flood phase F&D <$4.00 / Boe
Additional Future Development
Phases in Main Oil Column (MOC)
and Residual Oil Zone (ROZ)
Growing Production at the West Seminole San Andres Unit
Primary Development
~10% Recovery of OOIPWaterflood
+25% Recovery of OOIP
CO2 Flood
+20% Recovery of OOIP
Waterflood Development Production
CO2 Flood Current Development Forecast CO2 Flood Future Development Opportunity
0
2,000
4,000
6,000
8,000
1948 1958 1968 1978 1988 1998 2008 2018 2028 2038
Da
ily
Pro
du
cti
on
, B
op
d
WSSAU is an offset field to the acquired operator interest at Seminole San Andres Unit in 2017.
46
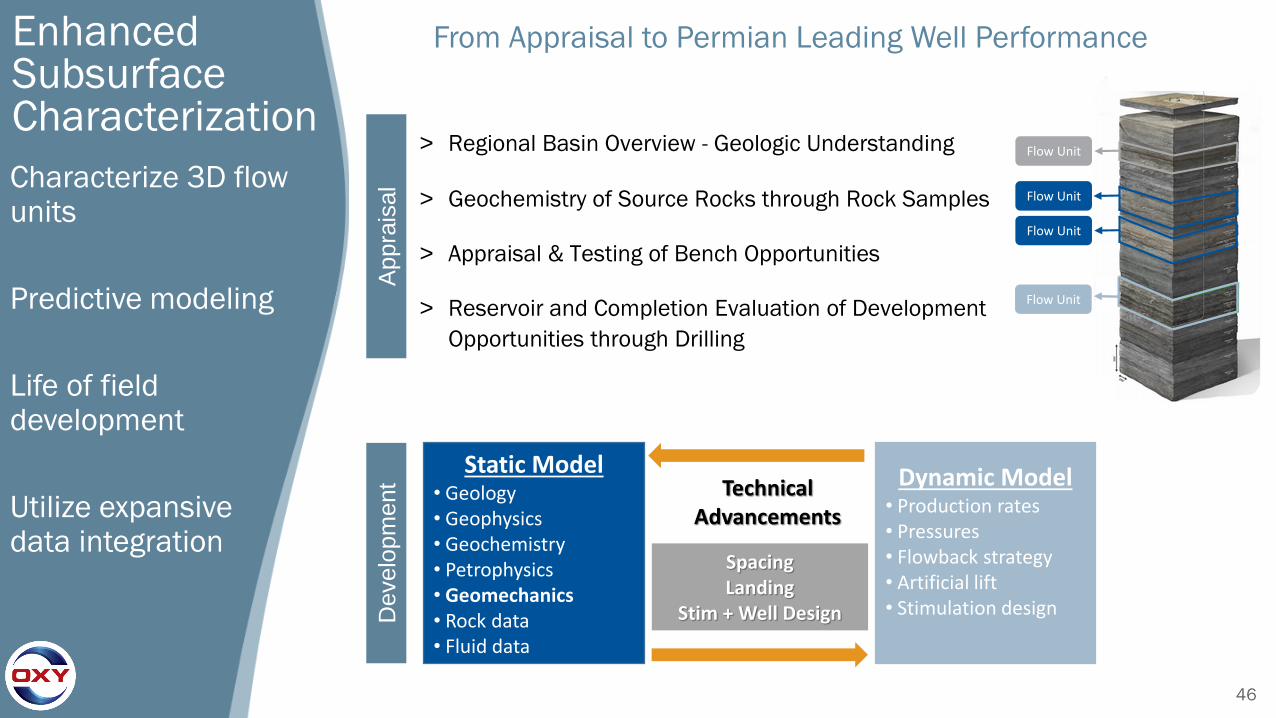
Enhanced Subsurface Characterization
Characterize 3D flow units
Predictive modeling
Life of field development
Utilize expansive data integration
From Appraisal to Permian Leading Well Performance
Appra
isal
> Regional Basin Overview - Geologic Understanding
> Geochemistry of Source Rocks through Rock Samples
> Appraisal & Testing of Bench Opportunities
> Reservoir and Completion Evaluation of Development
Opportunities through Drilling
Static Model• Geology• Geophysics• Geochemistry• Petrophysics• Geomechanics• Rock data• Fluid data
SpacingLanding
Stim + Well DesignDevelo
pm
ent Technical
Advancements
Dynamic Model• Production rates• Pressures • Flowback strategy • Artificial lift • Stimulation design
Flow Unit
Flow Unit
Flow Unit
Flow Unit

47
Pad
Drill
Multiple 3D Flow Unit Development
Maximize margin, EUR and capital efficiencies
Development with multiple rigs and frac crews
3D Flow unit understanding enables development without vertical interference
Horizontal pressurized “Completed Barriers” to minimize frac hits
Drilled Uncompleted (DUC) “Buffer” eliminates lateral frac to drilling interference
Accelerated and Optimized: Production, Facilities, and EUR
Zipp
er Frac
Co
mp
leted B
arrier
Zipp
er Frac
DU
C “B
uffer”
Pro
du
ction
Development Sequence Cross section view
Independent 3D Flow Units
1 2 3 4 5 6
Wolfcamp XY - Phase 2
Optimized Sequence vs Simultaneous Development
Three Section 2nd Bone Spring Development
Example in New Mexico
Bo
ep
d
2018
Simultaneous
development
Optimized
development
Production Acceleration+2,000 Boepd annual avg production
Facilities Optimization-2,500 Bopd, -3,600 Bwpd, - 250 Mcfpd
2nd Bone Spring -Phase 1
Optimized Sequenced Development (OSD)
Accelerates Production Efficiently
2nd Bone Spring Upper- Phase 1

48
Target Formation
Recent Well Results
Well NameLateral
Length (ft)
Peak 24 Hr
(Boed)
Peak 30 Day
(Boed)
Oil
(%)
Brushy Canyon Federal 23 13H 4,376 899 833 90%
Avalon Patton MDP1 18 Fed 23H 4,108 2,008 1,509 76%
1st BSS Cedar Canyon 23 2H 4,025 1,428 972 70%
2nd BSS
Cedar Canyon 23 Fed Co 6H 7,241 4,518 3,963 75%
Sunrise MDP1 8 5 Fed Com 2H 9,857 5,364 3,911 83%
Sunrise MDP1 8 5 Fed Com 6H 9,852 4,966 3,645 80%
Palladium MDP1 7/6 Fed Com 6H 9,852 4,731 3,404 81%
Palladium MDP1 7/6 Fed Com 1H 9,964 3,856 3,280 79%
Oxy Total 2018 Average 7,342 3,221 2,494 81%
3rd BSS
Cedar Canyon 21-22 FED Com 32H 9,851 5,834 3,916 68%
Cedar Canyon 23 24 Fed 32H 7,235 6,497 3,693 69%
Cedar Canyon 23 24 Fed Com 34H 7,172 4,876 3,338 73%
Cedar Canyon 21 22 Fed Com 34H 9,820 3,751 3,286 75%
Cedar Canyon 21 22 Fed Com 33H 9,758 3,730 3,192 77%
Wolfcamp XY
Cedar Canyon 27 28 Fed 44H 9,800 7,439 5,398 76%
Cedar Canyon 27 28 Fed 43H 9,648 6,007 4,351 77%
Patton 18 Fed 6H 4,394 2,774 2,150 71%
Calmon 35 Fed 171H 4,453 2,956 2,107 68%
Wolfcamp A
Janie Conner 204H 4,500 1,980 1,221 78%
B Banker 226H 4,400 1,874 1,030 76%
Cedar Canyon 27 10H 4,215 1,645 1,486 73%
Wolfcamp DJanie Conner 221H 4,522 2,282 1,809 39%
Tiger 14 24S 28E 224H 4,376 1,719 1,417 47%
Wells included in table include non-operated wells. Production data is from internal system for operated wells and from operator data and IHS Enerdeq for non-op wells where available.
Wells in blue font were turned to production in 1Q18. All Boe Data is based on two-stream well tests.
Average shown for all benches with at least three wells in 2018.
Barilla Draw Type LogGreater Sand Dunes
Proven Economic Delineating
Results in Greater Sand Dunes Area Multi-Bench Development
Brushy Canyon
Avalon
1st Bone Spring
2nd Bone Spring
3rd Bone Spring
Wolfcamp X-Y
Wolfcamp A
Wolfcamp D
New
New
New
Greater Sand Dunes
6,0
00
ft

49
Target Formation
Recent Well Results
Well Name Lateral Length (ft)Peak 24 Hr
(Boed)
Peak 30 Day
(Boed)
Oil
(%)
Avalon Evaluating
1st BS Evaluating
2nd BS
Collie A East N63H 9,725 1,370 1,155 81%
Aardvark State 6 2H 4,947 1,254 821 87%
Roan State 24 #51H 4,514 993 762 83%
3rd BS
A Herring 94-93-7N 74H 9,751 1,647 1,360 78%
Big George 180 SW 3H 7,576 759 571 57%
Morrison, HB 73H 4,927 854 864 75%
HobanGranada 73H 4,681 3,059 1,973 73%
Tycoon E-1053H 10,137 2,794 2,014 70%
Wolfcamp A
Lyda 33-40-1S State 16H 10,164 3,724 3,202 84%
Janey State 24-25-2N 15H 10,147 2,948 2,736 79%
Janey State 24-25-1N 16H 10,147 2,996 2,594 83%
Ryman 14-23-1S 15H 10,182 3,127 2,492 82%
Oxy Total 2018 Average 8,707 2,337 1,711 79%
Wolfcamp B
Agate 179-142-3S 25H 7,439 2,088 1,731 73%
Daytona Unit 1B 2H 6,947 1,897 1,544 79%
Agate 179 142 2S 21H 7,197 1,941 1,469 80%
Manhattan 183W 1H 7,092 1,831 1,460 75%
Wolfcamp CA Herring 94-93-6N 33H 10,199 2,521 1,758 81%
Lemur 24 1H 4,251 1,125 937 81%
Wells included in table include non-operated wells. Production data is from internal system for operated wells and from operator data and IHS Enerdeq for non-op wells where available.
Wells in blue font were turned to production in 1Q18. All Boe Data is based on two-stream well tests.
Average shown for all benches with at least three wells in 2018.
Proven Economic Delineating
Results in Greater Barilla Draw Area Multi-Bench Development
New
New
New
New
Greater Barilla Draw
Avalon
1st Bone Spring
2nd Bone Spring
3rd Bone Spring
Wolfcamp A
Wolfcamp C
Wolfcamp B
Hoban
4,5
00
ft

50
0
1,000
2,000
3,000
4,000
3/31/2017 7/9/2017 10/17/2017 1/25/2018
2,000
3,000
4,000
5,000
6,000
3/31/2017 7/9/2017 10/17/2017 1/25/2018
Permian Resources Delivers Basin Leading Wells for Less CostIP
24
Bo
pd
Pro
pp
an
t#
/ft
Oxy has 21 of top 50 Permian Wells in Prior 12 Months Basin Leading Wells with Less Proppant
Oxy Average
Proppant #/ft
Competitor
Average
Proppant #/ft
+46%
04/17 04/18 04/17 04/18
Oxy Wells Competitor Wells Oxy Wells Competitor Wells
Note: Data sourced from IHS Enerdeq for the period April 1, 2017 – April 1, 2018. Data for four recent Oxy wells were sourced from internal data as records were not yet available in IHS Enerdeq.

51
AVG Lat Length (ft) 4,811 5,789 6,933 ~7,500 6,636 6,204
0
20
40
60
80
100
120
2015 2016 1H 17 2017
Expected*
Top Peers
2017
Top Peers
2016
0
20
40
60
80
100
120
140
160
180
200
2015 2016 1H 17 2017
Expected*
Top Peers
2017
Top Peers
2016
0
20
40
60
80
100
120
140
160
2015 2016 1H 17 2017
Expected*
Top Peers
2017
Top Peers
2016
0
50
100
150
200
250
2015 2016 1H 17 2017
Expected*
Top Peers
2017
Top Peers
2016
Permian Resources Wells Continue to Improve
Top Peers is an average of Peers in the Top 15 based on # of wells online within the respective year with 6 month cumulative production available.Oxy and Peer data sourced from IHS Performance Evaluator, Gas Equivalent calculated at 20:1, solid bars represent oil, grey bars represent gas.*2017 expected is based on internal results and will be updated with public data when available.
6 M
on
th B
oe
Cu
mu
lati
ve
Pro
du
cti
on
6
Mo
nth
Bo
e
Cu
mu
lati
ve
Pro
du
cti
on
6 M
on
th B
oe
Cu
mu
lati
ve
Pro
du
cti
on
6
Mo
nth
Bo
e
Cu
mu
lati
ve
Pro
du
cti
on
AVG Lat Length (ft) 4,169 4,906 5,430 ~6,000 5,953 5,235
New Mexico Bone Spring
New Mexico Wolfcamp
Texas Delaware Wolfcamp
Texas Midland Wolfcamp
AVG Lat Length (ft) 4,398 ~6,700 5,619 5,137 AVG Lat Length (ft) 7,168 7,366 7,555 ~8,200 8,273 8,071
*Operators Include: Advanced Pet, Bopco, Bta Oil Producers, CVX, CXO, Caza, CDEV, DVN, EOG, LGCY, MRO,
MTDR, Mcelvain O&G, Mewbourne, Murchison, WPX, XEC, XOM*Operators Include: APC, BHP, CRZO, CVX, CXO, CDEV, EGN, EOG, FANG, HK, Jagged Peak Energy, Mewbourne,
MTDR, NBL, RDSA, REN, RSPP, WPX, XEC
*Operators Include: APA, Broad Oak, CPE, CVX, CXO, Crownquest, ECA, EGN, END, EPE, FANG, LPI,
PE, PXD, SM, Sem Opg, Surge Opg, XOM*Operators Include: COP, CXO, CDEV, Caza, DVN, EOG, MRO, MTDR, Mewbourne, WPX, XEC
52
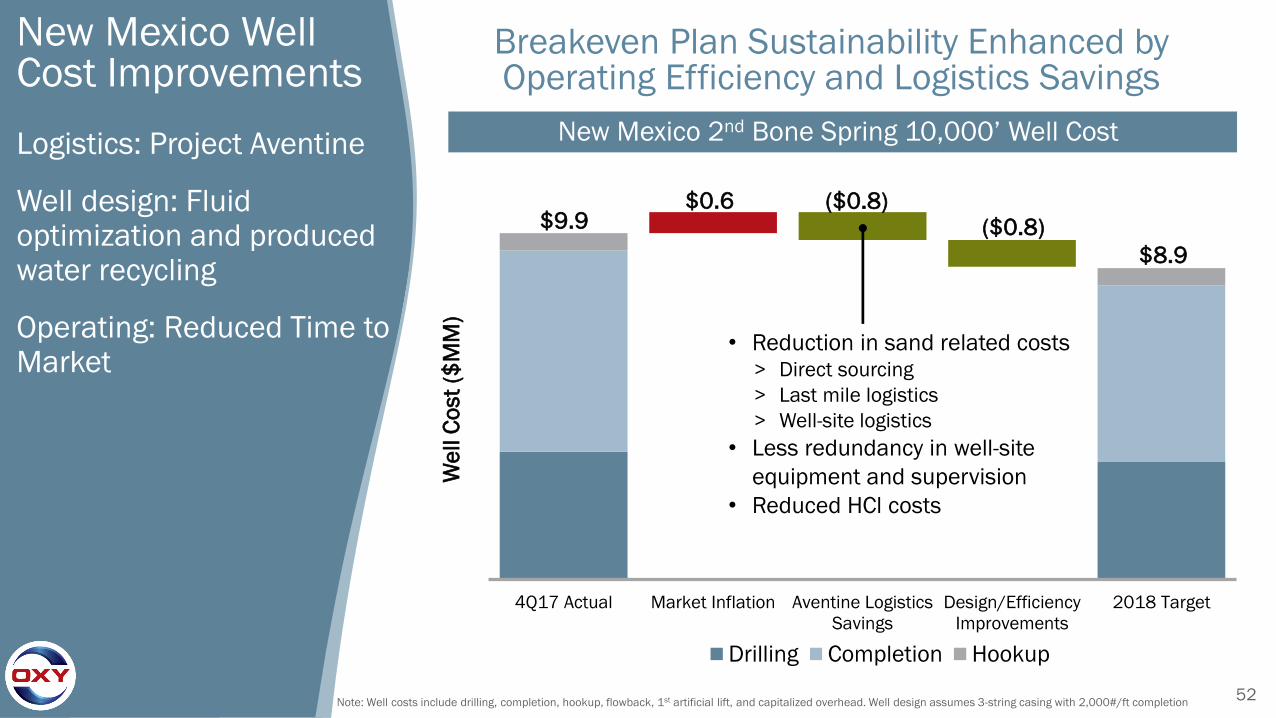
4Q17 Actual Market Inflation Aventine Logistics
Savings
Design/Efficiency
Improvements
2018 Target
We
ll C
ost
($M
M)
Drilling Completion Hookup
New Mexico Well Cost Improvements
Logistics: Project Aventine
Well design: Fluid optimization and produced water recycling
Operating: Reduced Time to Market
Breakeven Plan Sustainability Enhanced by Operating Efficiency and Logistics Savings
New Mexico 2nd Bone Spring 10,000’ Well Cost
$8.9
$0.6 ($0.8)($0.8)$9.9
• Reduction in sand related costs> Direct sourcing
> Last mile logistics
> Well-site logistics
• Less redundancy in well-site
equipment and supervision
• Reduced HCl costs
Note: Well costs include drilling, completion, hookup, flowback, 1st artificial lift, and capitalized overhead. Well design assumes 3-string casing with 2,000#/ft completion

53
$12.93
$11.17
$8.43$8.00
$-
$4.00
$8.00
$12.00
2014 2015 2016 2017 2018E 4Q18E
Permian Resources Opex/Boe
Surface Downhole Supports Energy Other
Operating Capability Reduces Costs
• Full-field development
for life-cycle value
• Water-handling
reducing surface costs
• Lift optimization
reducing downhole
failure costs
<$6.00
38% Improvement
<$7.00
54
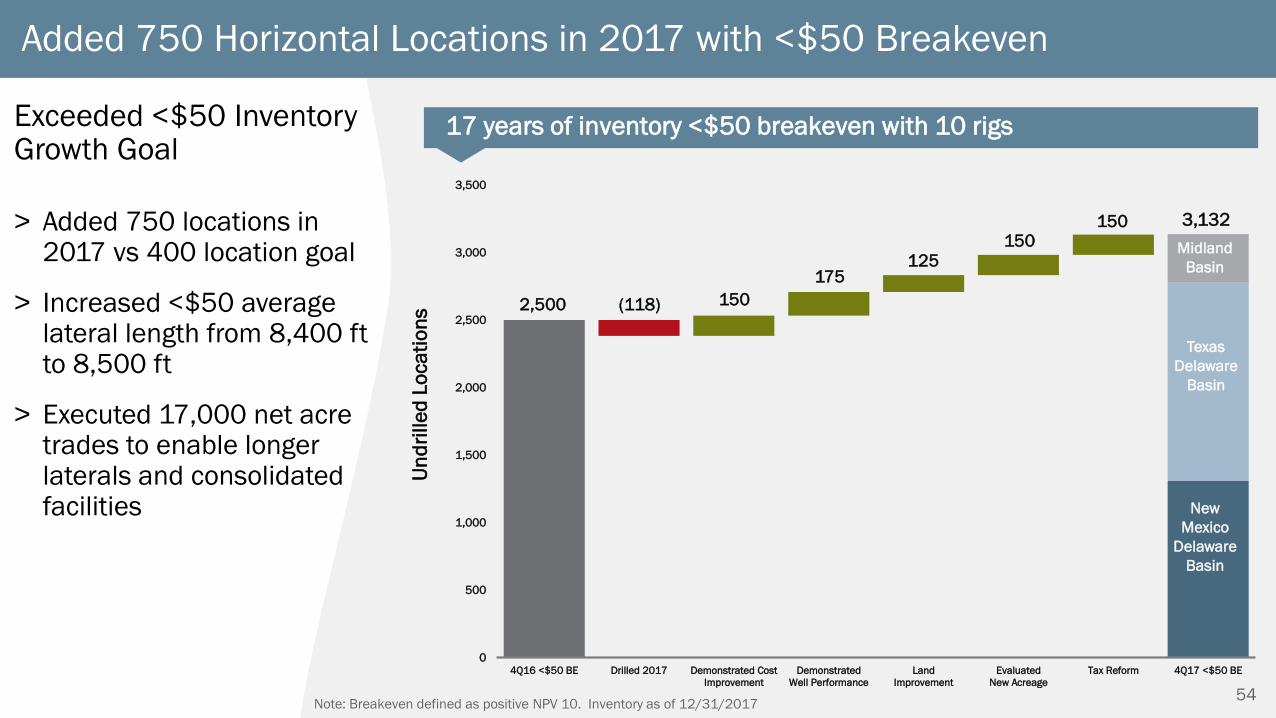
Added 750 Horizontal Locations in 2017 with <$50 Breakeven
17 years of inventory <$50 breakeven with 10 rigs
Note: Breakeven defined as positive NPV 10. Inventory as of 12/31/2017
Un
dri
lle
d L
oca
tio
ns
0
500
1,000
1,500
2,000
2,500
3,000
3,500
4Q16 <$50 BE Drilled 2017 Demonstrated Cost
Improvement
Demonstrated
Well Performance
Land
Improvement
Evaluated
New Acreage
Tax Reform 4Q17 <$50 BE
3,132
Midland
Basin
Texas
Delaware
Basin
(118)
175
150150
150
125
New
Mexico
Delaware
Basin
2,500
Exceeded <$50 Inventory Growth Goal
> Added 750 locations in 2017 vs 400 location goal
> Increased <$50 average lateral length from 8,400 ftto 8,500 ft
> Executed 17,000 net acre trades to enable longer laterals and consolidated facilities
55
0
2,000
4,000
6,000
8,000
10,000
12,000
14,000
Breakeven
<$50
Breakeven
<$60
Breakeven
<$70
Additional
Inventory
4Q17 Normalized
to 7,100'
4Q16
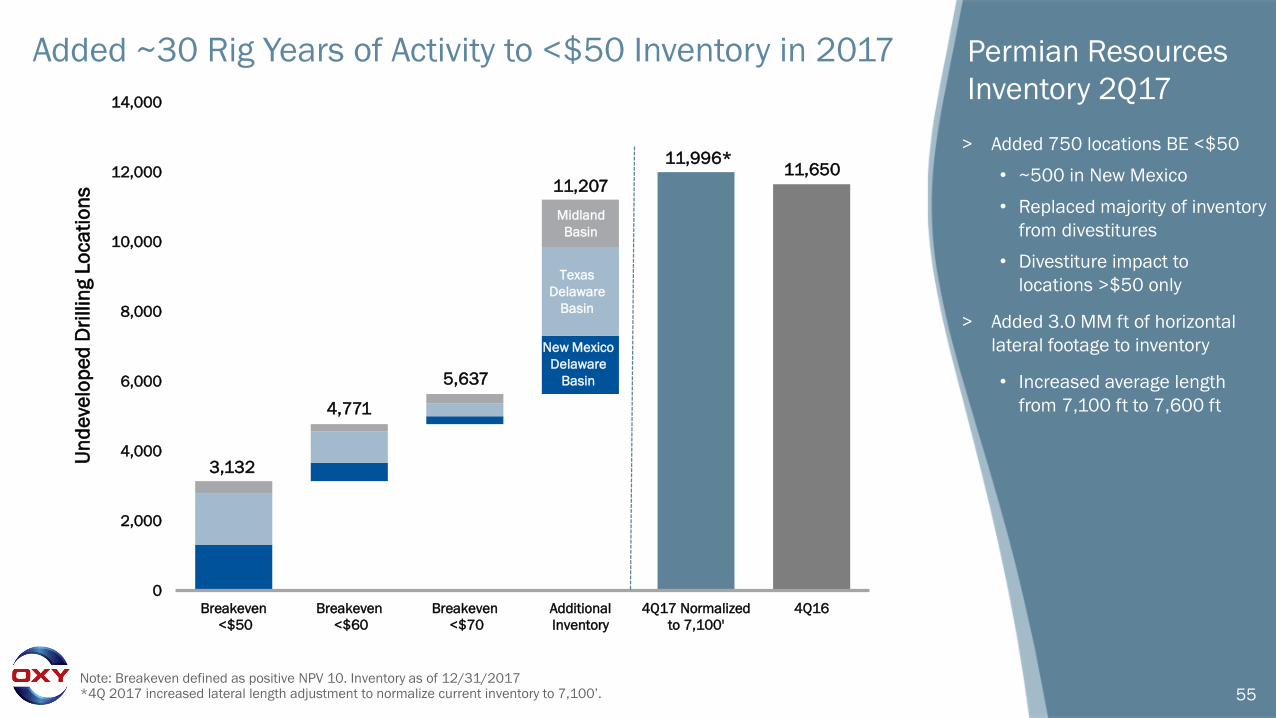
Added ~30 Rig Years of Activity to <$50 Inventory in 2017
3,132
4,771
5,637
11,20711,650
Permian Resources
Inventory 2Q17
> Added 750 locations BE <$50
• ~500 in New Mexico
• Replaced majority of inventory
from divestitures
• Divestiture impact to
locations >$50 only
> Added 3.0 MM ft of horizontal
lateral footage to inventory
• Increased average length
from 7,100 ft to 7,600 ft
Midland
Basin
Texas
Delaware
Basin
New Mexico
Delaware
Basin
Note: Breakeven defined as positive NPV 10. Inventory as of 12/31/2017*4Q 2017 increased lateral length adjustment to normalize current inventory to 7,100’.
11,996*
Un
de
velo
pe
d D
rillin
g L
oca
tio
ns

56
0
500
1,000
1,500
2,000
Proven Leader in Maximizing Recovery Across the Permian
<$10 <$6
Permian EOR Net Resource Potential
MM
Bo
e
CO2 Floods
TZ/ROZ*
Water Floods +
Other Infill Drilling
Opportunities
High-gradable
Inventory
*Transition Zone and Residual Oil Zone
Note: As of 12/31/2017
Permian EOR
• Seminole San Andres Unit
adds low F&D inventory
> ~1,000 MMBoe at
< $6.00 future
development cost
• Significant opportunity to
improve and grow new
inventory
> Subsurface
characterization
> Operating efficiency
> Technology
Future Development
Cost ($/Boe)
Permian EOR Water Floods
Midland Basin
Central Basin
Platform
Additional
Conventional
Inventory
Permian EOR CO2 Floods
Permian EOR PlantsTotal
Identified
Barrels

57
Permian Resources
• Significant growth potential in
all development areas
• ~650,000 net acres within
the Delaware and Midland
Basin boundaries• NM Delaware Basin 290,000
• TX Delaware Basin 160,000
• Midland Basin 200,000
Total ~650,000
Net
Acres*Resources Basin Development Areas
• Central Basin Platform 260,000
• New Mexico NW Shelf 150,000
• Continuing Evaluation 340,000
Total ~750,000
Net
Acres*Other Resources Unconventional Areas
• Resources – Unconventional Areas 1.4
• Enhanced Oil Recovery Areas 1.1
Oxy Permian Total ~2.5MM
Net
Acres*Business Area Acreage
Permian Resources Acreage Permian EOR Acreage
NM Delaware Basin
TX Delaware Basin
Midland Basin
Central Basin
Platform
New Mexico NW Shelf
*Includes surface and minerals.
Note: Acreage as of 12/31/2017
• ~325,000 net acres
associated with 11,207
wells in unconventional
development inventory
• Additional acreage
evaluated in 2017
offset by divested
acreage

58
Appendix Contents
• Peer Metrics
• Social Responsibility, Environment, and Governance
• 2017 Reserves
• Permian Updates
• Chemicals, Midstream and International Updates

59
Chemicals Cash Flow Improvement Drivers
JV Ethylene Cracker
startup complete
4CPe Plant startup in
4Q17 with ramp-up
through 1H18
Capturing margin from
improving pricing and
operations
Annualized Chemicals Cash Flow From Operations ($ MM)
0
200
400
600
800
1,000
1,200
1,400
1,600
1,800
1Q17
CFFO Annualized
Ethylene Cracker
Startup
Market
Improvement
4CPe Plant
Ramp-up
Breakeven Plan
Target
1Q18
CFFO Annualized
$1,600
$150$1,125
$50
$150
Achieved
$1,475
Market improvements:
• Improved Caustic Soda pricing
• Improved PVC pricing
• Lower Ethylene input cost

60
Chemicals Free Cash to Significantly Increase with Lower Capital Spending
• 4CPe Plant complete on-time and on-budget
> Plant started up in 4Q17
• 4CPe Plant manufactures the feedstock for a climate-
friendly, next generation refrigerant to be used in
automobiles
> Feedstock to be provided to new, world-scale plant in Baton Rouge for
production of 1234YF (next generation refrigerant)
• OxyChem capital spend will be near maintenance levels in
20180
100
200
300
400
500
600
700
2011 2012 2013 2014 2015 2016 2017
New Business Spending Maintenance & Other Spending
$M
M
Chemicals Capital Spend
4CPe Plant

61
Market Overview Update
• Major industry consolidation complete
• Caustic soda supply-demand balance continues to improve
• PVC demand improved YoY
0
50
100
150
200
250
300
350
1Q
12
2Q
12
3Q
12
4Q
12
1Q
13
2Q
13
3Q
13
4Q
13
1Q
14
2Q
14
3Q
14
4Q
14
1Q
15
2Q
15
3Q
15
4Q
15
1Q
16
2Q
16
3Q
16
4Q
16
1Q
17
2Q
17
3Q
17
4Q
17
1Q
18
2Q
18
E
$ M
illio
ns
Chemicals Pre-Tax Earnings (EBIT)1
0.00
1.00
2.00
3.00
4.00
5.00
0
100
200
300
400
500
600
1Q
12
2Q
12
3Q
12
4Q
12
1Q
13
2Q
13
3Q
13
4Q
13
1Q
14
2Q
14
3Q
14
4Q
14
1Q
15
2Q
15
3Q
15
4Q
15
1Q
16
2Q
16
3Q
16
4Q
16
1Q
17
2Q
17
3Q
17
4Q
17
1Q
18
$/M
cf
$/D
ry S
ho
rt T
on
FO
B U
S G
ulf
Co
ast
Chemicals Profitability DriversCaustic Soda Price Natural Gas Price Price
Notes: 1 Chemicals pre-tax earnings excluding special items. 2 IHS Domestic Average Spot Caustic Soda Price. 3 Nymex natural gas prices.
2 3

62
Midstream Cash Flow Improvement Drivers
Al Hosn plant
debottlenecking: 1Q18
with ramp-up through
3Q18
Oil terminal capacity
upgrade: 2H18 – 2019
2H18 Midland to Gulf
Coast spread outlook
$7.00 - $8.00 versus
breakeven plan
assumption of $2.10
Annualized Midstream Cash Flow From Operations ($ MM)
0
100
200
300
400
500
600
700
800
900
1Q17
CFFO Annualized
Marketing Spread
Quarterly Average
$2.10 per Boe
Al Hosn Gas
Plant
Debottlenecking
Crude Oil Terminal
Capacity Upgrade
Breakeven Plan
Target
1Q18
CFFO Annualized
$800
$200
$150
$50
$50
Achieved
Downtime Adj.
$50 Actual
Notes:1 Excludes non-cash impacts of mark-to-market on crude contracts. 2 Al Hosn debottlenecking improvement allocated to Midstream for Breakeven Plan
purposes though cash flow generated in both Midstream and Upstream.
1
2
$450
Market and operational improvements:
• Mid to Gulf Coast Differentials
• Export Margin
• Gas, NGLs and Sulfur Margin

63
Outlook for Midland to Gulf Coast Spreads
0.00
2.00
4.00
6.00
8.00
10.00
12.00
Midland to Magellan East Houston Spread ($/Bbl)
Actual Outlook
Harvey Impact on
Spread
2018
1Q 2Q 3Q 4Q
2017
1Q 2Q 3Q 4Q
2019
1Q 2Q 3Q 4Q
Upper Bound1
Lower Bound1
New Pipeline Capacity
Breakeven Plan Assumption: $2.10
Possible pipeline capacity
constraints (late 2018/
early 2019 pending new
project in-service dates)
Pipeline constraints will
require rail and truck
utilization
Rail Transportation Cost to Gulf Coast
Truck Transportation Cost to Gulf Coast
Notes:1 Upper and lower bounds assume ~85-90% Permian pipeline utilization over time.
64
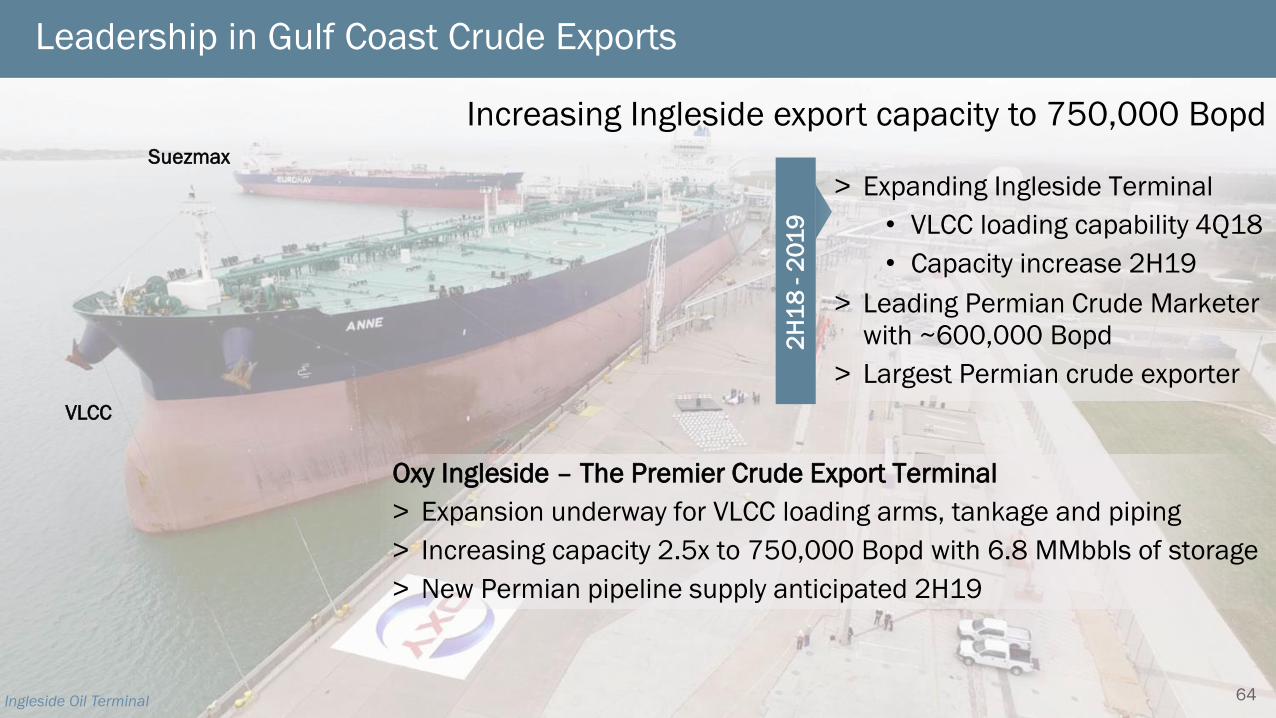
Leadership in Gulf Coast Crude Exports
Increasing Ingleside export capacity to 750,000 Bopd
Oxy Ingleside – The Premier Crude Export Terminal
> Expansion underway for VLCC loading arms, tankage and piping
> Increasing capacity 2.5x to 750,000 Bopd with 6.8 MMbbls of storage
> New Permian pipeline supply anticipated 2H19
2H
18
-2
01
9
VLCC
Suezmax
> Expanding Ingleside Terminal
• VLCC loading capability 4Q18
• Capacity increase 2H19
> Leading Permian Crude Marketer
with ~600,000 Bopd
> Largest Permian crude exporter
Ingleside Oil Terminal

65
2017 International Highlights and 2018 Plan
> 2017 production of 298 MBoedgenerated over $1 Bn of free cash flow at ~$55 Brent
> Pipeline of potential short and long-cycle projects
> Best international HES performance in Oxy history
Oman Block Position
20
17
Mile
sto
ne
s
20
18
Pla
n
> Record Al Hosn Gas production of 71 Mboed achieved via plant optimization
> Milestones of 1 Bn barrels of oil produced in Oman and record gross production from the La Cira Infantas field in Colombia
> Extended Block 9 and signed Block 30 which brings Oman acreage to 2.3 Million
> Step-out wells in Oman and Colombia added 50 MM barrels of net resource
> Al Hosn Gas Plant debottlenecking increases capacity by 11% for $10 MM of capital. Peak-rate of ~83 MBoed will be reached in 3Q18.
> Sanction TECA Steamflood in Colombia after 2017 pilot
> Continue step-out program in Oman and Colombia
Al H
osn
Ga
s P
lan
t
66
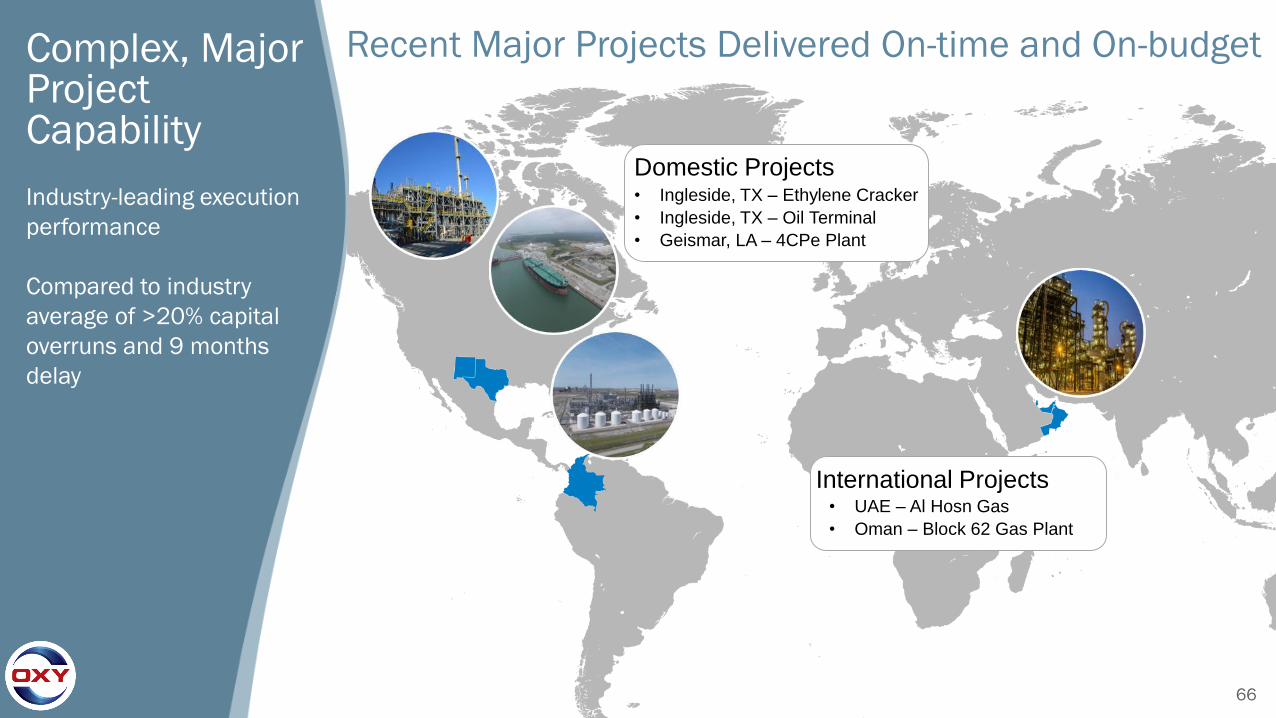
Complex, Major Project Capability
Industry-leading execution
performance
Compared to industry
average of >20% capital
overruns and 9 months
delay
Domestic Projects• Ingleside, TX – Ethylene Cracker
• Ingleside, TX – Oil Terminal
• Geismar, LA – 4CPe Plant
International Projects• UAE – Al Hosn Gas
• Oman – Block 62 Gas Plant
Recent Major Projects Delivered On-time and On-budget
67
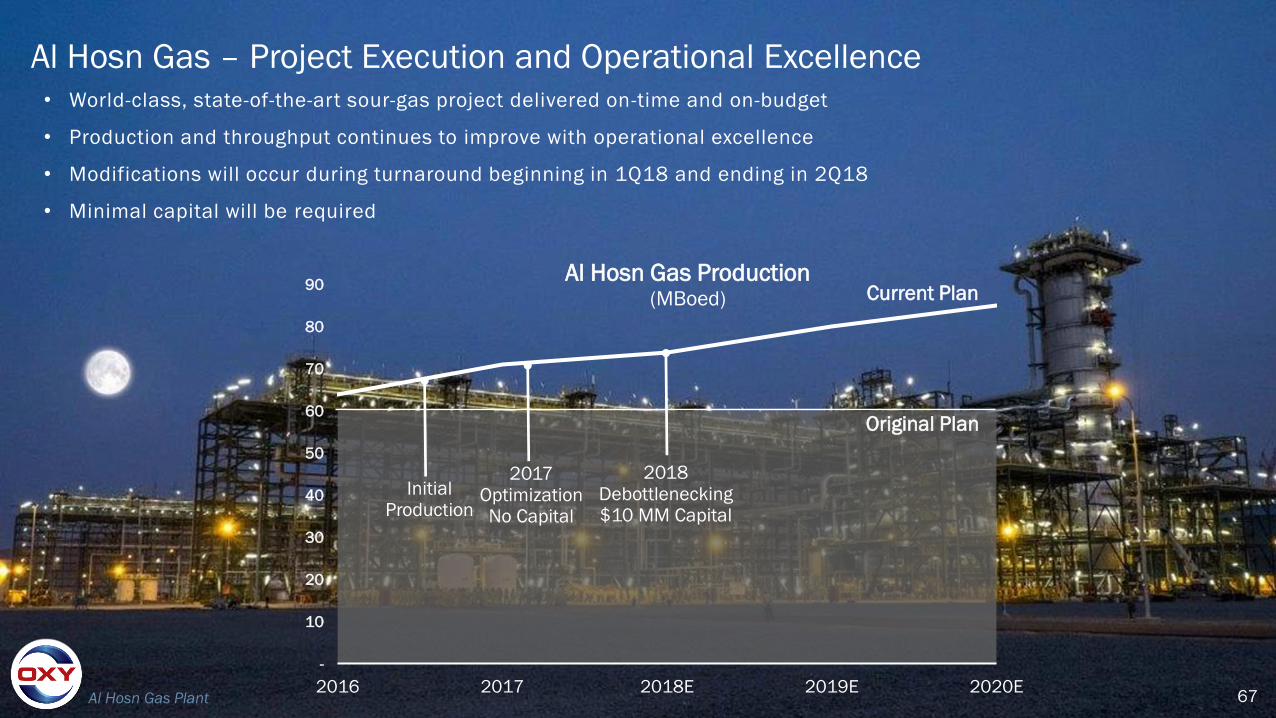
Al Hosn Gas – Project Execution and Operational Excellence• World-class, state-of-the-art sour-gas project delivered on-time and on-budget
• Production and throughput continues to improve with operational excellence
• Modifications will occur during turnaround beginning in 1Q18 and ending in 2Q18
• Minimal capital will be required
Al Hosn Gas Plant
-
10
20
30
40
50
60
70
80
90
2016 2017 2018E 2019E 2020E
Al Hosn Gas Production(MBoed)
Original Plan
Current Plan
2018Debottlenecking$10 MM Capital
2017OptimizationNo Capital
Initial Production


