Occupancy engine Research report and proof of concept Aleksandar Rusinov, Jetnipat Sarawongsuth, Dingzhong Weng 11/22/2014 Report for research and blueprint development of Qualcomm occupancy engine which main aim is to figure out people presence in a room
Transcript
Occupancy engine Research report and proof of concept
Aleksandar Rusinov, Jetnipat Sarawongsuth, Dingzhong Weng
11/22/2014
Report for research and blueprint development of Qualcomm occupancy engine which main aim is to figure out people presence in a room
Contents Qualcomm occupancy engine Background and Concept ........................................................................... 2
Project Requirement and scope ............................................................................................................... 3
Research Done ......................................................................................................................................... 4
Qualcomm occupancy engine - Relevant prototypes built ........................................................................ 7
Development of the user interface ........................................................................................................ 11
User Interface Heuristic Evaluation ........................................................................................................ 20
Heuristic Evaluation - Rating System ................................................................................................ 21
Heuristic Evaluation – Form ................................................................................................................... 22
Link to the version control repository .................................................................................................... 23
Initial test strategies .............................................................................................................................. 24
User interface and reports generation ............................................................................................... 46
Maintenance and error handling: ....................................................................................................... 46
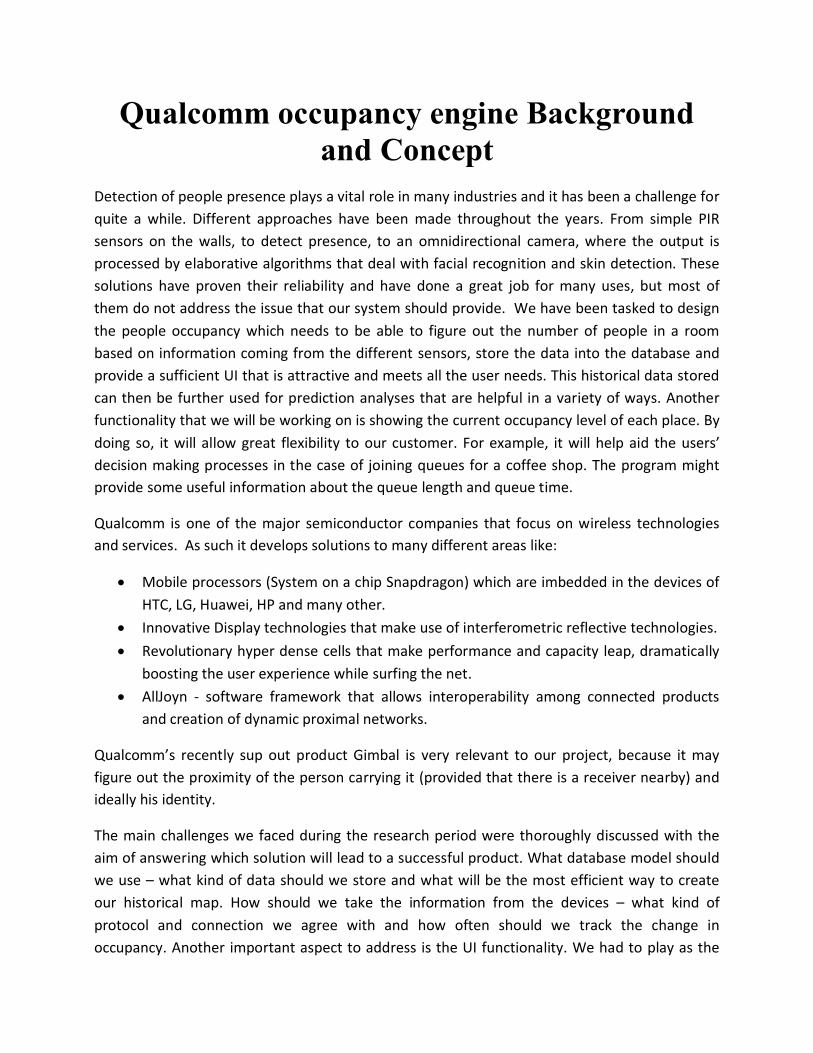
Qualcomm occupancy engine Background and Concept
Detection of people presence plays a vital role in many industries and it has been a challenge for
quite a while. Different approaches have been made throughout the years. From simple PIR
sensors on the walls, to detect presence, to an omnidirectional camera, where the output is
processed by elaborative algorithms that deal with facial recognition and skin detection. These
solutions have proven their reliability and have done a great job for many uses, but most of
them do not address the issue that our system should provide. We have been tasked to design
the people occupancy which needs to be able to figure out the number of people in a room
based on information coming from the different sensors, store the data into the database and
provide a sufficient UI that is attractive and meets all the user needs. This historical data stored
can then be further used for prediction analyses that are helpful in a variety of ways. Another
functionality that we will be working on is showing the current occupancy level of each place. By
doing so, it will allow great flexibility to our customer. For example, it will help aid the users’
decision making processes in the case of joining queues for a coffee shop. The program might
provide some useful information about the queue length and queue time.
Qualcomm is one of the major semiconductor companies that focus on wireless technologies
and services. As such it develops solutions to many different areas like:
Mobile processors (System on a chip Snapdragon) which are imbedded in the devices of
HTC, LG, Huawei, HP and many other.
Innovative Display technologies that make use of interferometric reflective technologies.
Revolutionary hyper dense cells that make performance and capacity leap, dramatically
boosting the user experience while surfing the net.
AllJoyn - software framework that allows interoperability among connected products
and creation of dynamic proximal networks.
Qualcomm’s recently sup out product Gimbal is very relevant to our project, because it may
figure out the proximity of the person carrying it (provided that there is a receiver nearby) and
ideally his identity.
The main challenges we faced during the research period were thoroughly discussed with the
aim of answering which solution will lead to a successful product. What database model should
we use – what kind of data should we store and what will be the most efficient way to create
our historical map. How should we take the information from the devices – what kind of
protocol and connection we agree with and how often should we track the change in
occupancy. Another important aspect to address is the UI functionality. We had to play as the
user and think about the most genuine way to present the information. What will be the scale
of functionality of the system – what will be the present options that the customer wants to
see?
Project Requirement and scope
PRIORITIES FEATURES
MUST HAVE A system that is able to accurately quantify the number of people in each room in a building.
A user interface that the users can interact with to check how many people are currently in a room and in the past. This will be in a form of a website.
An error handling module that can cope with hardware detection errors. For example, the case where the hardware says that there are more people leaving the room than there actually are in the room.
Storing the data for past occupancy.
SHOULD HAVE A colour coding scheme for the floor plan map to represent how crowded a room is.
COULD HAVE A system that is able to predict, accurate up to a certain degree, the number of people that will possibly be in a room at a given time on a given day.
WOULD LIKE TO HAVE A system that uses machine learning to predict very accurately the number of people that will be in a room at a given point in the future.
A system that can, not only count the number of people in a room at the time as well as predicting the number of people at any given time in the future, but also identify the different people in the room.
Research Done
NAME RESEARCH DONE Aleksandar Rusinov Human-Sensing: Methods for Detecting Presence, Count,
Location, Track, and Identity – Thiago Teixeira, Greshon Dublon, Andreas Savvides
Researched on HTML and PHP Languages http://www.w3schools.com/php/default.asp
http://www.w3schools.com/html Researched on making PHP connection to a MySQL database
and sending and retrieving data from the database http://webcheatsheet.com/php/connect_mysql_database.ph
p http://www.w3schools.com/php/php_mysql_connect.asp
During the past two months we made a research in several areas that are relevant to our project. We
looked at what has been done in the past for room occupancy counting and discussed the ideas present.
Some of the models we have come across include in-depth and sophisticated work in different areas like
machine learning and human recognition. However this approach uses cameras and devices that are,
not only very expensive, but also require a lot of research to be done on the topic of machine learning
and more. Eventually, we decided on using a structure of relational database, because MySQL and DBMS
are very flexible in nature. If there are sufficient amount of data stored in the database, the possibilities
of extending it to a great range and it is quite easy to infer conclusions from them. In our model the
historical data about the rooms and the one about the current state can be generated very easily with
the data present in the building plan and the snapshot tables. We thought of generating the building
plan from a JSON file because JSON is a well adopted format for data transfer and it has a sufficiently
good APIs for different programming languages. We looked at different coding practices and found a set
of useful libraries that we applied in our prototypes. Later, we created a java prototype and then a PHP
prototype that encompass part of our ideas to show it to our client. Another decision that both
Qualcomm team reached was protocol for connection with the Arduino. Both teams agreed on using
http connection and requests that are already present in the PHP prototype.
Qualcomm occupancy engine - Relevant prototypes built
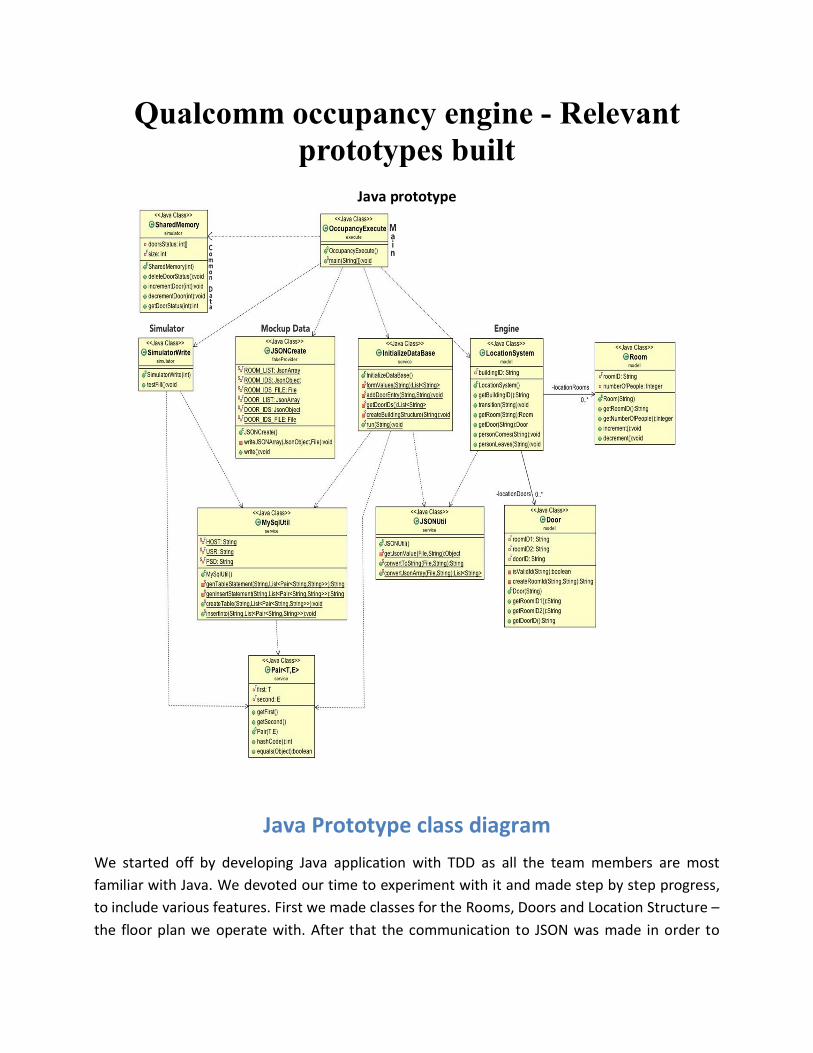
Java prototype
Java Prototype class diagram
We started off by developing Java application with TDD as all the team members are most
familiar with Java. We devoted our time to experiment with it and made step by step progress,
to include various features. First we made classes for the Rooms, Doors and Location Structure –
the floor plan we operate with. After that the communication to JSON was made in order to
initialize an example building plan. We also created classes that connect our Java program to
the MySQL database. We carefully designed its structure and tested it by inserting raw data into
it. The style mostly abides to this Google Java Style rules.
PHP prototype
After realising that our Java prototype will be time consuming in getting it to work as it requires
a virtual machine to run on and setting one up is not feasible under the current timeframe, we
decided that the best course of action for our group to move forward was to use PHP to deal
with data received and storage. We chose PHP for its simplicity to be implemented and that it
can be easily integrated into a HTML website that we are working on for the user interface
design. Another reason to use PHP and MySQL on server side due to maturity of framework and
easy and portable environment setup for different OS - Apache, MySQL and PHP setup – so
called AMP setups (Linux: LAMP, Windows: WAMP, MacOS X: MAMP). For communication with
the Arduino we created a PHP prototype that handles the connection to the MySQL database as
well as storing the information into the database and visualizing it in a HTML website. The
address of the website is located at http://qualoccupy.azurewebsites.net/review_data.php .
The Arduino that the other team is working on will be sending the data on the sensors into the
database using HTTP protocols in the form of
http://qualoccupy.azurewebsites.net/add_data.php?parametres¶metres, for example.
UI prototype
The UI prototype was built using Balsamiq Mock up tools and Microsoft PowerPoint. Mock up is
a very user friendly tool that allows the user to create quality screens of his website/app. You
can create moderate design on the fly. PowerPoint was used to make a presentation showing
the action flow of an example scenario. During the design invention we refer to the NASDAQ
website and Google Nest for reference. NASDAQ has implemented great ideas for viewing a
historical data, it is widely used in the investor business and you could get any kind of statistical
information about the period ask. Google Nest thermostat application provides current data for
the temperature in the rooms and may say if it is suitable for the user. The idea for using our
system on queues came from this model. You can find more about the design and the actual UI
in the “Development of the user interface section” of our site.
Database structure
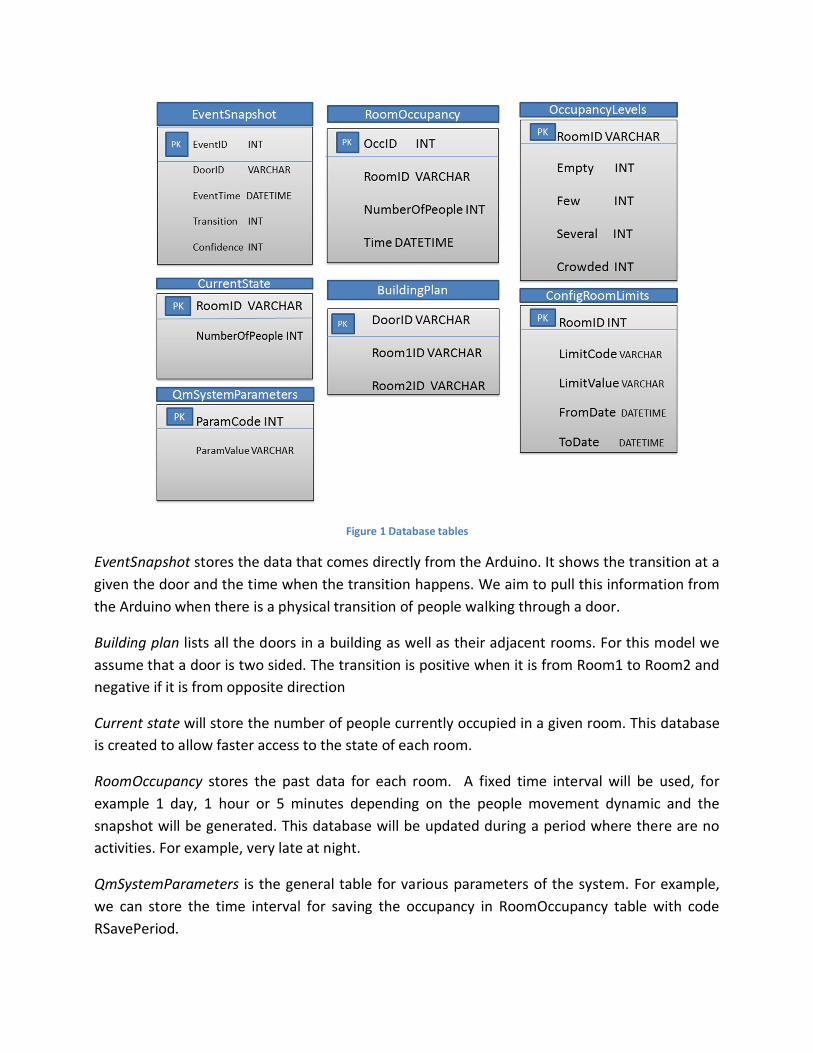
Figure 1 Database tables
EventSnapshot stores the data that comes directly from the Arduino. It shows the transition at a
given the door and the time when the transition happens. We aim to pull this information from
the Arduino when there is a physical transition of people walking through a door.
Building plan lists all the doors in a building as well as their adjacent rooms. For this model we
assume that a door is two sided. The transition is positive when it is from Room1 to Room2 and
negative if it is from opposite direction
Current state will store the number of people currently occupied in a given room. This database
is created to allow faster access to the state of each room.
RoomOccupancy stores the past data for each room. A fixed time interval will be used, for
example 1 day, 1 hour or 5 minutes depending on the people movement dynamic and the
snapshot will be generated. This database will be updated during a period where there are no
activities. For example, very late at night.
QmSystemParameters is the general table for various parameters of the system. For example,
we can store the time interval for saving the occupancy in RoomOccupancy table with code
RSavePeriod.
OccupancyLevels gives information about the crowdedness of each room. The values vary
depending on the area of a room. The occupancy level might be associated with a color. The
values in Empty, Few, Several, Crowded present an upper bound for the level. Empty is always
0. For example if we have Few – 4, Several – 10, Crowded – 30, and we have green for Empty,
yellow for Few, orange for several and red for Crowded and the system shows that there are 14
people in a room, it will have red label. Another way to show the occupancy to the use colour
coding with addition of small RGB step when there is change of occupancy. For example it might
change from – pure green – 0, 255, 0 - when empty to pure red – 255, 0, 0 - when 10 people are
in the room with a (25.5, -25.5, 0) RGB step per person.
ConfigRoomLimits specifies various characteristics about the rooms. For example, one can store
HVAC (heating regulation and air-conditioning) conditions about every room. Since that is a
major energy consumer for buildings a demand driven control will be of essential value. The
value parameter represents the number of people that should be in the room for a certain
activity to start. The dates show the period that this activity is valid. Some limits might be done
by a predictive engine and take action in the future.
Figure 2Presentation of simple building plan
Development of the user interface
1) Login screen – a screen with a login form that requires the user to enter their login
credentials (username and password) to access the database on the site. It could have an
attractive background – as shown or a plain one depending on the target group. The
upper left bar will lead to Qualcomm pages. The name is displayed also – may be
changed. We followed the outline of https://www.qualcomm.com .
2) Options screen - The screen with the different options. In this case, it gives the user the
option to select the different buildings being monitored. There is a navigation panel on
the left which displays the name of each building. When a user selects a building in the
panel, an image of the corresponding location is displayed. In that case, the diplodocus
in Hintze hall. The inspect button will take the user to a more detailed webpage about
the place. The button might have a more attractive appearance as in the qualcomm site.
3) Occupancy map – This screen shows the current state of a floor (part) of the building.
You can navigate through different floors from the left menu. The floor plan in the
center of the picture is interactive and the number in each room shows the current
number of people there. This information changes dynamically and different coloring is
applied when the room is selected or an error occurs. Once selected from the menu or
directly on the map, the user can proceed by clicking it again.
4) Analyze occupation – This screen gives the user the option to select the period for which
the occupancy data is displayed. He can use the calendar form – ideally with an
indication of whether a day is a holiday or a weekend. This screen may be absent and
then the flow will proceed directly to the next one.
5) Occupation analysis line chart – This screen provides a graphical representation of the
data on the occupancy such as a line chart. There are options in tabs that can regulate
the precision and the whole time period. The ideas about the UI here and on the next
screen are influenced by the way the market change is represented in
http://www.nasdaq.com/ .
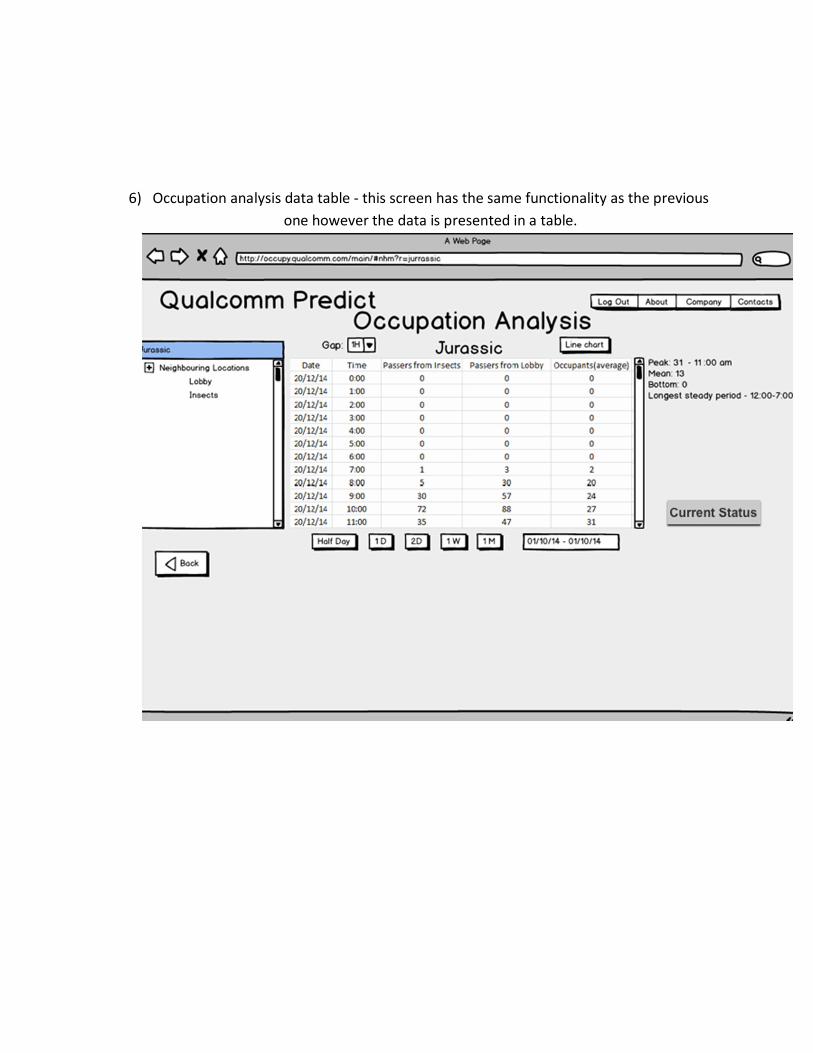
6) Occupation analysis data table - this screen has the same functionality as the previous
one however the data is presented in a table.
7) Current crowdedness index – This gives an indication to the user on how crowded a
room is. The value of the index differs depending on the size of each room. This
particular feature can be very useful in giving the user the information on how long a
queue to a park ride is or how crowded a toilet is.
8) Information about the movement and occupation – This is a more detailed view to show
the flow of people entering and exiting the rooms and how it changes over time. It
shows how many people had entered or exited a room with 3 doors. One can see that
Door 1 and Door 3 are more regularly used than Door 2. This might be useful in
determining and planning the most attractive route around the place such as a museum
or in a large car showroom.
9) Report for movement through a specific door – This is again a more elaborative option –
it shows how much a door is used and in what time. This may be useful for door
extension consideration.
10) Room Occupation for a given time – a table that shows the occupancy for every room
in a given moment. This could be enhanced to show the crowdedness index with it’s
color.
User Interface Heuristic Evaluation
The evaluation of the user interface was made based on these heuristics Heuristics (Nielson, 1995: http://www.nngroup.com/articles/ten-usability-
heuristics/)
1. Visibility of system status The system should always keep users informed about what is going on, through
appropriate feedback within reasonable time. 2. Match between system and the real world
The system should speak the users' language, with words, phrases and concepts familiar to the user, rather than system-oriented terms. Follow real-world conventions, making information appear in a natural and logical order.
3. User control and freedom Users often choose system functions by mistake and will need a clearly marked
"emergency exit" to leave the unwanted state without having to go through an extended dialogue. Support undo and redo.
4. Consistency and standards Users should not have to wonder whether different words, situations, or actions
mean the same thing. Follow platform conventions. 5. Error prevention
Even better than good error messages is a careful design which prevents a problem from occurring in the first place. Either eliminate error-prone conditions or check for them and present users with a confirmation option before they commit to the action.
6. Recognition rather than recall Minimize the user's memory load by making objects, actions, and options visible.
The user should not have to remember information from one part of the dialogue to another. Instructions for use of the system should be visible or easily retrievable whenever appropriate.
7. Flexibility and efficiency of use Accelerators -- unseen by the novice user -- may often speed up the interaction
for the expert user such that the system can cater to both inexperienced and experienced users. Allow users to tailor frequent actions.
8. Aesthetic and minimalist design Dialogues should not contain information which is irrelevant or rarely needed.
Every extra unit of information in a dialogue competes with the relevant units of information and diminishes their relative visibility.
9. Help users recognize, diagnose, and recover from errors Error messages should be expressed in plain language (no codes), precisely
indicate the problem, and constructively suggest a solution. 10. Help and documentation
Even though it is better if the system can be used without documentation, it may be necessary to provide help and documentation. Any such information should be easy to search, focused on the user's task, list concrete steps to be carried out, and not be too large.
Heuristic Evaluation - Rating System Severity Ratings (Nielson, 1995: http://www.nngroup.com/articles/how-to-rate-the-severity-of-usability-
problems/)
The severity of a usability problem is a combination of three factors:
The frequency with which the problem occurs: Is it common or rare? The impact of the problem if it occurs: Will it be easy or difficult for the users to
overcome? The persistence of the problem: Is it a one-time problem that users can overcome once
they know about it or will users repeatedly be bothered by the problem?
The following 0 to 4 rating scale can be used to rate the severity of usability problems:
0 = I don't agree that this is a usability problem at all
1 = Cosmetic problem only: need not be fixed unless extra time is available on project
2 = Minor usability problem: fixing this should be given low priority
3 = Major usability problem: important to fix, so should be given high priority
4 = Usability catastrophe: imperative to fix this before product can be released
Heuristic Evaluation – Form
The following form represents the issues found during the heuristics. It appears that
heuristic 4 is valuated most frequently.
Interface Issue Heuristic(s)
Frequency 0 (rare) to
4 (common)
Impact 0
(easy) to
difficult (4)
Persistence 0 (once) to
4 (repeated)
Severity = Sum Total of F+I+P /3
Login screen
Invalid details provided
5,9 2 1 0 1
Location Options Screen
Inconsistency between “option” and “building”
4 3 0 0 1
Occupancy map Screen
No explicit sign that the map is interactive
4, 7 4 1 1
2
Occupation analysis screen
Shortened names for day – “D”, week “W” and Month – “M” may cause confusion
4,7 2 0 0 1
2
Reports for occupation screens
Not that attractive to users
8 3 0 0 1
Link to the version control repository
Version control is an essential matter in the development life of a project. Let’s say a team start
working on a new project. Having only the initial files you all know that their quality and
quantity will change a lot during the development. In this period, there are possibilities that
mistakes may occur in the system being developed and when these are spotted, we should be
able to revert the previous version. Version control does history of your work and allows
moving back and forward between different versions. When linked to a web hosting service you
can have many functionalities such as issues, adding of new collaborators, contributing to open
source projects that are on a public repository (often called repo) and you can interact in more
pleasant way with system – not just shell as pure Git with the shell commands.
There are many tools on the web that provide version control hosting like – Github, Subversion,
Aegis, Mercurial, bazaar, Codeville, other Git hosting services such as Bitbucket and many
others. We agreed to use Github because it is a proven standard and it surpasses most of it’s
competitors and user experience. Unlike the competitors like Subversion where the developers
make changes directly to the files stored in the central repository online, GitHub uses a
technique where the files stored in the system are copied into your local repository and you
make changes to the local copies of the files and when you’re ready you just publish the copy
into the system. Another advantage of using GitHub is a feature called forking. This is where a
user can copy another user’s repository on a project that the person’s working on, assuming
they have access to it, and make changes in your own local repository then notify the project
owner of the changes made and the project owner can then simply merge the files together into
the original repository. This makes it much easier for many people to collaborate on a project
and why it makes sense for our team to use GitHub. In our project work, we created 2
repositories - one for the java project and another for the PHP prototype in order to avoid
confusion. We used Google drive for documents, reports, minutes and other files because it
allows real time mutual collaboration and also has much better in-browser navigation that is
absent in Github.
Initial test strategies
Java Testing - JUnit JUnit is the most widely used java testing framework for TDD and unit testing. It is part of the
xUnit family and originates from SUnit(1989) – Smalltalk unit testing framework. Smalltalk was
the first highly adopted object oriented languages – Xerox early computers. The framework
makes very stable result checkers and requires knowledge of Smalltalk in the same way that
JUnit requires knowledge of Java. We aim to test our java classes using various matchers and
application of JUnit.
PHP Testing There are many different tools for PHP Test Driven Development and Quality Assurance. There
is PHPUnit for unit tests, again part of the xUnit family – the most widely used PHP testing tool
having all the necessary features to properly test your code. Behat – a Behavioral Driven
Development framework that allows one to do very readable and easy to comprehend tests –
understandable even to people without any technical background. The Tests come in form of
scenarios that look like :
Scenario: List 2 files in a directory
Given I am in a directory "test"
And I have a file named "foo"
And I have a file named "bar"
When I run "ls"
Then I should get:
"""
bar
foo
"""
Taken from - http://www.sitepoint.com/8-must-have-php-quality-assurance-tools/
Then classes are written to process each sentence
/** @Given /^I have a file named "([^"]*)"$/ */
public function iHaveAFileNamed($file)
{
touch($file);
}
Taken from - http://www.sitepoint.com/8-must-have-php-quality-assurance-tools/
This pattern matches the regular expression on the first line and then runs the appropriate
function.
Another tools are vfsStream, PHPLOC, PHP CodeSniffer that are used for mock testing,
advanced code analysis that may be connected with Github and syntax check. When planning
more sophisticated PHP modules the outline tools before will be used for Q&A.
Testing Simulator The PHP simulator that is implemented emulates the HTTP POST transfer from Arduino
processors by sending data over http protocol to the database at random intervals of time.
Instead a real information it reads the data from a CSV (comma separated value) files, extracts
and sends it to a module that inserts a row into the data table Snapshot. This is to simulate real
transfer of data from the sensors. We had a look at and considered many different simulator
and techniques. One of the ideas was to read and write into a JSON file for some time period.
This might be built in Java during term two if necessary. Also if the changes are too rapid we
might put the requests in queries. Another option is to put a flag that indicates change in a
buffer, storing the current transitions. Polling the flag every 0.1 ms will signal if there is a change
and if present an insert to the database will be performed. A test data of each error case
outlined in the error module in our “Project modules” section will be made and test against our
system. This will come in a set of .csv files.
Record of the progress
First Bi-weekly report
Aleksandar Rusinov , Jetnipat Sarawongsuth, Dingzhong Weng
We have been assigned a task to create an occupancy predictive engine. Our client is Qualcomm. We will be closely collaborating with Team 21 which will be working on the hardware side of the project (Project name: Qualcomm Presence with Unifying Signals) while our team, Team 20, will be working on the software side of the project . On 06/10/2014, all of the team members of both teams had a joint client meeting to gather more information about the project.
First Client Meeting (Date: 06/10/14)
The followings are the items discussed during the client meeting:
Goal: Predicting the number of people that will be in a location at a certain day or time in the future.
Input will be based on a system which uses sensors to count the number of people in a room at the time
(and over a period of time).
Stretched Goals:
- Using the data we have to control external devices such as light, heater, etc.
Additional Ideas
- The possibility of using machine learning.
- To start with, using the information obtained from the sensors as well as our own visual
observations, train the system to detect the population of the room with the sensors and double
check the accuracy of the system from the sensor using our observation.
- Experiment with different sensors and detectors and analyse the accuracy and effectiveness of
the data obtained from these sensors before narrowing down the list of sensors to be used
- The effectiveness of using Hadoop.
Group Meeting (Date: 07/10/2014)
We looked through the advantages and disadvantages of using different types of sensors in our project.
We decided to work jointly with the other team on the hardware solutions at first. The following are
some of what was discussed:
1. IR distance sensors – most suitable and cheap.
2. Microwave sensors – relatively cheap but it is still unclear as to whether it will be a convenient way of
doing so.
3. Laser sensor – very good and precise but expensive, each costing around £300.
4. Beacon – enables to track a specific person that is upto 50 metres from a receiver, and even up to
100m in open spaces..
We also brainstormed ideas about the data received and how it will be obtained:
We were discussing about the possibility of mounting an array of IR sensors on top of the two sides of
each door pointing vertically downwards so we will receive a signal which notifies the system when an
object passes through the sensors. The data will be captured from the IRs with the frequency of 10 per
second (860000 per day) and decide if there is a person present.
If the person is present we set:
outer IR as OIR (this IR sensor is located on the outside of the door)
and inner IR as IIR (this IR sensor is located on the inside of the door)
If a person walks (abnormal value on the sensors) through OIR and then to IIR we sent Timestamp for
person entering.
If a person walks (abnormal value on the sensors) through IIR and then to OIR we sent timestamp for
person exiting.
Example of how the data may be stored:
SensorValues[]{
OIR[]
OIR_TIMESTAMP
IIR[]
IIR_TIMESTAMP
MICROWAVE
VIDEO
TIMESTAMP
}
Example of simple processing of the data:
IF OIR_TIMESTAMP<IIR_TIMESTAMP – ENTERING
IF OIR_TIMESTAMP > IIR_TIMESTAMP - EXITING
We will set a delay limit to a specified figure, for example, 1 minute, so unusual behaviours, such as OIR
being triggered but IIR not being triggered within a set timeframe, will be discarded; If one sensor is
triggered but not the other within the period of 1 minute, then this will not be recorded onto the system.
Looked at Hadoop – Two main parts – MapReduce and HDFS (hadoop data file System) with a lot of tools
providing different functionalities :
Hive – allows one to write queries in HiveQL – language similar to SQL
Pig - Pig Latin – language based on Hadoop can adept at very long data pipelines.
HBase – non-relational database that allows low-latency lookups in Hadoop
Flume – enables populating Hadoop with web servers, mobile devices to collect data to Hadoop
Oozie – workflow processing system allowing one to define schedule of jobs written in multiple
languages.
Ambari – set of tools that allow the managing of Apache Hadoop clusters.
Avro - serialization system allowing encoding the schema of Hadoop files. Good for executing removed
procedure calls.
Sqoop - moving data from other kind of data stores into Hadoop (i.e SQL database)
HCatalog – metadata management
Mahout - Data mining library. Performs regression testing , clustering and statistical modelling
implementing map reduce. (may be important for the predicting engine)
Tutorials from You Tube - https://www.youtube.com/watch?v=xWgdny19yQ4
Meanwhile, we are learning from previous works. The relating articles are listed as the following:
Wrote a java class file that communicates with MySQL.
Dingzhong Weng:
Acquainted the team with Github.
Done repository for the project.
Done UML diagrams.
Done UML Use case and class diagram.
*The time period might be different.
** This may not be the optimal way of representing the RoomId.
Third Bi-weekly Report
Over the past week, both teams, team 8 and team 9 have been cooperating and discussing over the data
format that our team will receive from the other team. Jetnipat Sarawongsuth was tasked to look at and
decide on the different hardware device that can be used to connect the sensors that the other team
had been experimenting with. A decision was then made that the sensors are to be connected to an
Arduino board version YUN. An Arduino is very easily programmable and is very versatile in nature.
Unlike other version of Arduino, Arduino YUN’s board has a built-in Ethernet and WiFi support. This will
turn out to be very handy when we are looking at sending the data wirelessly from the Arduino’s sensors
to a database when the sensors are interrupted. As an experiment, two IR sensors are to be connected
to an Arduino YUN which will then be mounted on top of a door frame. A simple program has been
written by the other team that can detect movement when something passes through the IR sensors.
Over the next weeks or so, I will be looking into creating a simulator of the floor plan in to test our
system and the error handling module.
Client Meeting (Date: 10/11/2014)
This week we had another joint meeting with the other team with the client from Qualcomm. We mostly
explained to the client the progresses of both teams. The following are what was discussed.
The other team has been making progresses on Arduino and the IR sensors. They have written a simple
piece of code and detects movement when someone walks pass the sensors. However, the data here are
not being stored and is sent over the USB cable. In the near future, we will be looking at using Arduino
YUN which will make it possible to send the data from the sensors directly and wirelessly to a computer,
database, or a tablet. At the moment, there is a slight issue with the batter power. This means that the IR
sensors do not have enough power to cover the whole length of the door. They are still looking into the
possibilities of using alternate power source that will provide enough powers to the sensors. The usage
of Kinect was also briefly gone over. Kinect could be used as the secondary sensors to the IR sensors.
After having discussed that, our group explained in a fair amount of details in what the database
structures may look like. We also explained to the client on how the basic java application that we wrote
works as well as explaining to them about the usage of MySQL table as a mean to store data. During the
explanation, the clients once again brought up the idea of hardware errors and how our current software
might not be able to error correct. They suggested that we have an error correcting module or
inconsistency spotters that gives a flag when the data seems incorrect. They introduced the idea of using
confidence level when we calculate how many people are in a room by looking at the reliability of the
sensors. This could be done by putting weightings on the different sensors. For example, sensors that are
not 100% accurate might get a smaller weighting in the result so the result will not be entirely based on
the inaccurate sensors. This is something that our group might be looking into implementing at later
stage of the development of the application.
Client Meeting (Date: 13/11/2014)
After a brief meeting on Monday, the client agreed to come to UCL to have a face-to-face meeting with
both Qualcomm teams. The meeting started off with the Qualcomm representatives explaining what
they had done earlier this year with a Kinect device. They talked about how they were using different
software to track hands movement. They used skeleton tracker which track the hands as well as the
elbow. This eliminates the problem where the motion tracker would lose the hands when the two hands
cross over each other. This is very relevant to our project since the hardware team is also currently
working and experimenting on the usage of Kinect as one of the sensors. Instead of tracking the hands,
our team is looking at researching and developing a program for Kinect that can be used to track
people’s head as they walk through a doorway. The Kinect device will be fitted on top of the doorway.
However, since it is a complicated device, the cost is significantly higher than the cost of our other
sensors. This was discussed in the meeting and the client suggested that the benefits of using such
sensor outweigh the cost of using and operating it so we will continue working with it for the time being.
The hardware team also went on to explain their progress on the current Arduino work they have been
working on. They showcased the IR sensor working alongside an Arduino and displaying the result on a
laptop. As an object cuts through the IR beam, the counter increments and display the total on the
laptop. However, there are a few different problems that were presented such as the rate of detection
can be slightly slow. Alongside IR sensors, we also talked about using ultrasound as another sensor. This
will also be mounted at the entrances to a room. Our group then started explaining our progress on the
database as well as the user interface that we have decided to go with. We decided to go with Aleks’
user interface design as it is very practical and informative since it provides a graphical representation of
the building plan, the current number of people in each room as well as some statistics and graphs from
past data. We showed the client our basic user interface design and they seemed to be pleased with it.
The client brought up the idea of the different sensors sending different values for what was supposed to
be the same. For example, an ultrasound mounted on door A might not suggest there’s a person passing
through but the IR sensors might suggest otherwise. The client asked a question on the reliability of the
sensors and which sensors to disregard in such event. To answer this problem, we will be looking into the
details in the coming weeks but we briefly explained our solution to this problem. Our solution to this
issue is to come up with an algorithm that takes into account the reliability and the preset confidence
levels of the each of the sensors and come up with an overall confidence level. Each sensors will carry
and confidence level weightings which will be set according to their real life accuracy and reliability.
Lastly, we explored over the different ways in which the data from the sensors can be delivered or
received. We talked about the two ways in which the data can be sent. The first being event based data.
This is when the data is sent automatically every time an event is occurring. For example, a data is sent
when the IR sensors detect movement. The second being active data sending. This comes in the two
forms of data pushing and pulling whereby a system pushes the data into the database every specified
period of time for data pushing and the data is sent only in the event where the database requests it for
data pulling.
During the last lab classes our team met with the HCI supervisor for the module. We discussed the user
interfaces for our system we made for course work 3. We agreed to step on the basis of the UI
presented by Aleksandar Rusinov. We were given few advices how to enhance and make it better. Our
supervisor recommended checking Google nest Thermostat applications and looking at the interface
there.
Nest learning thermostat UI research report
Nest learning thermostat is a wi-fi enabled thermostat that has a lot of different functionalities such as
personal scheduling, program choosing and history viewer. You can also set and view the temperature
remotely from your mobile phone. Also the thermostat allows you to view the recordings of the
temperature for each room for a certain period of time. This functionalities make Google Nest a valuable
product to look at since one of the main goals of our UI will be presenting similarly structured data.
Here is how the temperature in the moment for a specific location is presented. Similarly for our project one may have the number of people instead of the degrees. Depending on how many people are there in a location the color of the circle will indicate how crowded is the space there. There also may be sensors in a queuing place - café, theatre, cinema, zoo and and a time estimation that says how much time will pass until all the current people have passed.
This is how the recorded data is presented in the Nest app. The energy consumption history is displayed with different variants. We may include the occupancy level when we present the data in one of the future UI mocks. That is how you can figure out in which hours a place gets crowded usually and not wait a really long queue for hours.
Intial PoC Web Design
Dingzhong Weng will work with Lazlo de Brissac from the hardware team to create initial PoC report on a
website. They agree to implement Ruby on Rails as their framwork for entire website development. As
for the style of presentation, they have decided to design a simplistic single page website and to section
the important aspects of initial PoC, so that the client can have a straight-forward understanding of all
the information presented. Also, both team have agreed to share the layout of the website. It will have
two navigation button clearly indicating the name of the team, so that the client can directly click and
view the respective PoC for the team selected.
Jobs done:
Aleksandar Rusinov:
Looked at Google Nest
Done accepted UI design
Construct Tables for the new concept
Done Proof of Concept draft skeleton
Jetnipat Sarawongsuth:
Done minutes of Skype meeting
Done minutes of general in campus meeting
Done research for a connection device
Dingzhong Weng:
Done draft for the project site, link: https://qualcomm.herokuapp.com (temporary)
Fourth Bi-weekly Report
Progress
During the last two weeks, we have made much progress and we approached the issues of setting up an
online system. During the first week, after migrating from a common Java application to a dynamic web
application, we have done research on servlet and we conducted some tests and examples.
Unfortunately, the deploying of the Java application on a server took longer than we previously expected
so we settled down with a PHP solution that sends the data to the database and displays it. We discussed
that issue with our client-Nadine Macrae on Monday and we were able to develop a PHP prototype that
satisfies some of our objectives and points that the client mentioned by Friday 28th November. We plan
to show it to the client on the next client meeting on Monday 1st December and ask for their feedback
and improvement suggestions.
Client Meeting (Date: 17/11/14)
We had another joint weekly meeting with Qualcomm and we had a discussion on the following subjects.
The hardware team had been experimenting with the ultrasound sensors which they had been planning
to use and they raised an issue with them but this will be looked at in the coming weeks. Alex’s team
uploaded code on github. Also, some fixes on UI design are on schedule. Qualcomm and both team
decided that the meetings will hold in two periods in the future. First one at 11 am will be meeting with
Alex’s team, and second one at 11:30am will be meeting with Lazlo’s team. Speaking of the UI design,
Alex brought up that the team has talked to its supervisor for some advice over the design. Before next
meeting, Alex will set up a database for both team to communicate data with. Qualcomm suggested to
take a look into REST design pattern. Both team decided to continue researching in ways to
communicate the data with.
Client Meeting (Date: 24/11/14)
Today the hardware and the software teams of Qualcomm project had a Skype meeting with the client,
but this time we had separate sessions with each team explaining their progresses on the project. The
following is our part of the meeting.
We started the meeting off by explaining to the client what the team members have been working on
over the past weeks. Dingzhong has been working on creating a template for a website for the Proof of
Concept part of the project as well as working on the user interface. We briefly talked to the client about
the user interface for the project website to monitor the number of people in rooms as well as our
approach to colour coding the rooms to give the user the idea of how crowded each room is. Jetnipat has
been researching and coding PHP scripts that will allow the data received to be sent to MySQL database
as well as the scripts that handle receiving data over a port. Meanwhile, Aleks has been working with
Dingzhong on the user interface as well as working more on the simulator. After that, we informed them
that due to the time constraint this term, we will not be able to complete the process of having a Java
app, which deals with receiving and storing data, running on a server over a virtual machine that we have
recently requested to UCL. Thus for now, we will be working with PHP scripts that will work as a
replacement instead. We explained to the client that the MySQL will be stored in MS Azure and that the
data that we will be receiving from the other team will be sent through SSH socket. The client then
suggested that we look at another, possibly, option of sending the data through HTTP instead as the
client suggested that it will be easier to work with. The last thing we discussed was how our simulator
works. Currently, our simulator simulates only one transition but it is done several times. We then
discussed over the fact that our simulator currently is not using SSH socket so the client advised us to use
as much code that’s to be used in the real code as possible for the simulator.
Lab Session (Date: 25/11/2014)
Today in the two-hour lab session, we made some physical progresses in the project. We first set up a
database of event snapshot on Microsoft Azure. The event snapshot will contain information about
people entering or leaving the room. The table that stores the information contains these fields: doorID,
event_time, transition, confidence level. DoorID field stores the string that represent the door that
someone has walked through. Event Time stores the date time format of when someone walked through
the door. Transition tells us which room the person is walking to. For example, either room 1 to room 2
or room 2 to room 1. Confidence level shows how confident we are that someone has walked through
the door. We also set up PHP scripts that deals with data insertion into MySQL events_snapshot table as
well as a php script that listens to a port (socket) for data.
Jetnipat Sarawongsuth:
Researched on PHP script that deals with sending data to MySQL table and script that deals with data
retrieval from a port.
Conducted minutes of meetings.
Conducted biweekly report with Aleks.
Worked on the project during the lab session.
Aleksandar Rusinov:
Researched on ways to implement the simulator on Java (Multi-threading and socket listening).
Made PHP scripts for the Azure server (http connection that adds a row into the MySQL table and display
the table).
Set up the server on Azure.
Dingzhong Weng:
Working on the Proof of concept website.
Conducted minute of the meeting (17/11/14).
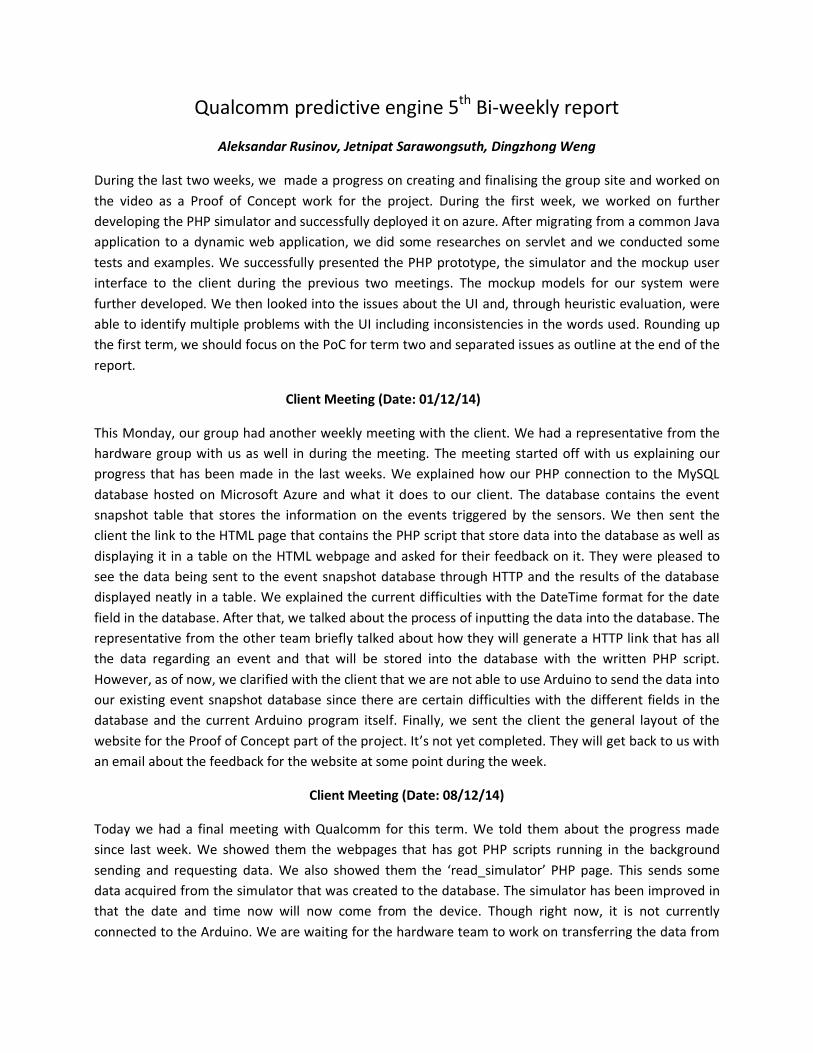
Qualcomm predictive engine 5th Bi-weekly report
Aleksandar Rusinov, Jetnipat Sarawongsuth, Dingzhong Weng
During the last two weeks, we made a progress on creating and finalising the group site and worked on
the video as a Proof of Concept work for the project. During the first week, we worked on further
developing the PHP simulator and successfully deployed it on azure. After migrating from a common Java
application to a dynamic web application, we did some researches on servlet and we conducted some
tests and examples. We successfully presented the PHP prototype, the simulator and the mockup user
interface to the client during the previous two meetings. The mockup models for our system were
further developed. We then looked into the issues about the UI and, through heuristic evaluation, were
able to identify multiple problems with the UI including inconsistencies in the words used. Rounding up
the first term, we should focus on the PoC for term two and separated issues as outline at the end of the
report.
Client Meeting (Date: 01/12/14)
This Monday, our group had another weekly meeting with the client. We had a representative from the
hardware group with us as well in during the meeting. The meeting started off with us explaining our
progress that has been made in the last weeks. We explained how our PHP connection to the MySQL
database hosted on Microsoft Azure and what it does to our client. The database contains the event
snapshot table that stores the information on the events triggered by the sensors. We then sent the
client the link to the HTML page that contains the PHP script that store data into the database as well as
displaying it in a table on the HTML webpage and asked for their feedback on it. They were pleased to
see the data being sent to the event snapshot database through HTTP and the results of the database
displayed neatly in a table. We explained the current difficulties with the DateTime format for the date
field in the database. After that, we talked about the process of inputting the data into the database. The
representative from the other team briefly talked about how they will generate a HTTP link that has all
the data regarding an event and that will be stored into the database with the written PHP script.
However, as of now, we clarified with the client that we are not able to use Arduino to send the data into
our existing event snapshot database since there are certain difficulties with the different fields in the
database and the current Arduino program itself. Finally, we sent the client the general layout of the
website for the Proof of Concept part of the project. It’s not yet completed. They will get back to us with
an email about the feedback for the website at some point during the week.
Client Meeting (Date: 08/12/14)
Today we had a final meeting with Qualcomm for this term. We told them about the progress made
since last week. We showed them the webpages that has got PHP scripts running in the background
sending and requesting data. We also showed them the ‘read_simulator’ PHP page. This sends some
data acquired from the simulator that was created to the database. The simulator has been improved in
that the date and time now will now come from the device. Though right now, it is not currently
connected to the Arduino. We are waiting for the hardware team to work on transferring the data from
Arduino through HTTP protocols. We later explained to them about a couple of new tables that we
decided to create in our database, the first one being the OccupancyLevels table. This table stores the
information on how crowded a room is. For example, we might have a label Empty when there is nobody
in the room or we can have a label Crowded when there are more than 30 people in a room. We can also
have associate colours for each level of crowdedness. Another table is ConfigRoomLimits. This store the
information on what action should be done depending on how many people are in the room. For
example, we might set a condition in this table for a room to turn the volume of the speakers at a club
up if there are more than 20 people in the room between 2AM and 4AM. Finally, we had a discussion
over the Proof of Concept website and they were quite pleased with the layout of the page. We will be
putting in actual content on the page in the coming days.
Main task sheet for Term 2
Tasks Stage
Java Testing Started
PHP Testing Starting Term 2
Java Application Elaborated but needs refinement + modules built
Application Modules Elaboration:
Module 1 – Data initialization Completed
Module 2 – Data gathering and maintenance Main components works on PHP,
To be implemented in Java
Module 3 – Procedures and functions for engine Starting Term 2
Module 4 – UI and Reports module A work-in-progress mockup
– implemented on PHP prototype
Module 5 – Error module Starting Term 2
Engine testing with real data from Arduino
sensors
Starting Term 2
Additional Task: Cross Platform app Term 2
Additional Task: Predictive engine Enchanced database model is under
development –
Term 2
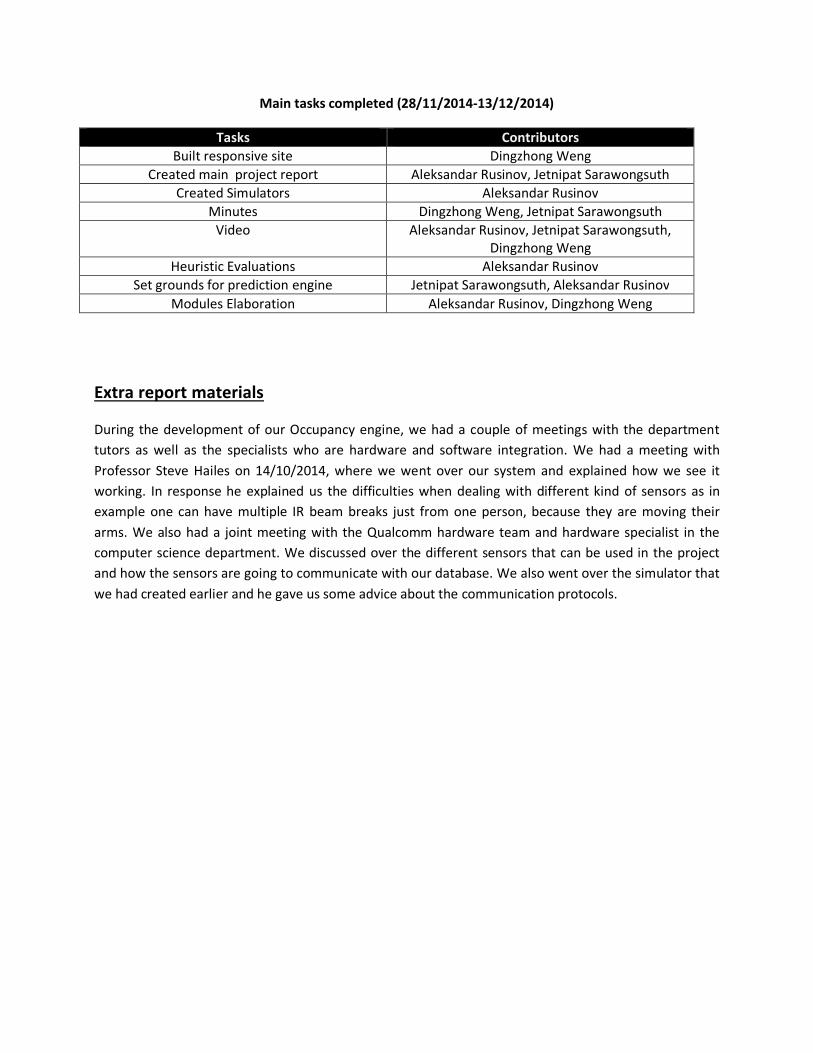
Main tasks completed (28/11/2014-13/12/2014)
Tasks Contributors
Built responsive site Dingzhong Weng
Created main project report Aleksandar Rusinov, Jetnipat Sarawongsuth
Created Simulators Aleksandar Rusinov
Minutes Dingzhong Weng, Jetnipat Sarawongsuth
Video Aleksandar Rusinov, Jetnipat Sarawongsuth, Dingzhong Weng
Heuristic Evaluations Aleksandar Rusinov
Set grounds for prediction engine Jetnipat Sarawongsuth, Aleksandar Rusinov
Modules Elaboration Aleksandar Rusinov, Dingzhong Weng
Extra report materials
During the development of our Occupancy engine, we had a couple of meetings with the department
tutors as well as the specialists who are hardware and software integration. We had a meeting with
Professor Steve Hailes on 14/10/2014, where we went over our system and explained how we see it
working. In response he explained us the difficulties when dealing with different kind of sensors as in
example one can have multiple IR beam breaks just from one person, because they are moving their
arms. We also had a joint meeting with the Qualcomm hardware team and hardware specialist in the
computer science department. We discussed over the different sensors that can be used in the project
and how the sensors are going to communicate with our database. We also went over the simulator that
we had created earlier and he gave us some advice about the communication protocols.
Plans for developing the final PoC design during term 2
A lot has been done this term. We have created a Java prototype, a simulator, a PHP prototype and a
very basic mockup of the UI. Next term, we will be working on developing the analysis engine that will
have algorithms that deal with counting the number of people in a room in a building, calculate the level
of confidence in that number and identify and self-correct the errors that may be encountered. A test
data for the error module will be done and stored into a set of .csv files. This will guarantee the stability
of the system and will show if a proper treatment handles the edge cases. We will also be working on
developing a fully working user interface. We currently have a UI that meets some of the criteria we set
for the UI. It has some features such as displaying the historical data in a neat table. However, it still lacks
certain functionalities described in the UI prototype. For example, it does not have a login form nor does
it have a navigation panel on the option page that takes the user to a different building. Fixing the issues
found in the process of the heuristics evaluation of the UI is a priority. We will also be working on JUnit
testing framework as well as testing the PHP codes that has been written this term with PHPUnit and
other Q&A tools. As an additional task should all the tasks above are completed before the deadline, we
might also develop a predictive engine which will use an algorithm that predicts the number of people
that will be in a room at a given time on a given day. This will require some further research to be done
and there will be challenges that we will need to overcome.
Tasks Stage
Java Application Elaborated but needs refinement + modules built
Application Modules Elaboration:
Module 1 – Data initialization Done
Module 2 – Data gathering and maintenance Partly done on PHP to be implemented in Java
Module 3 – Procedures and functions for engine Term 2
Module 4 – UI and Reports module Designed mock – partly implemented on PHP prototype
Module 5 – Error module Term 2
Cross Platform app realisation Would/ Term 2
Predictive engine Enchanced database model present – Would/Term 2
Engine testing with real data from Arduino sensors
Term 2
Module testing and refinement Term2
Java Testing Started
Php Testing Term 2
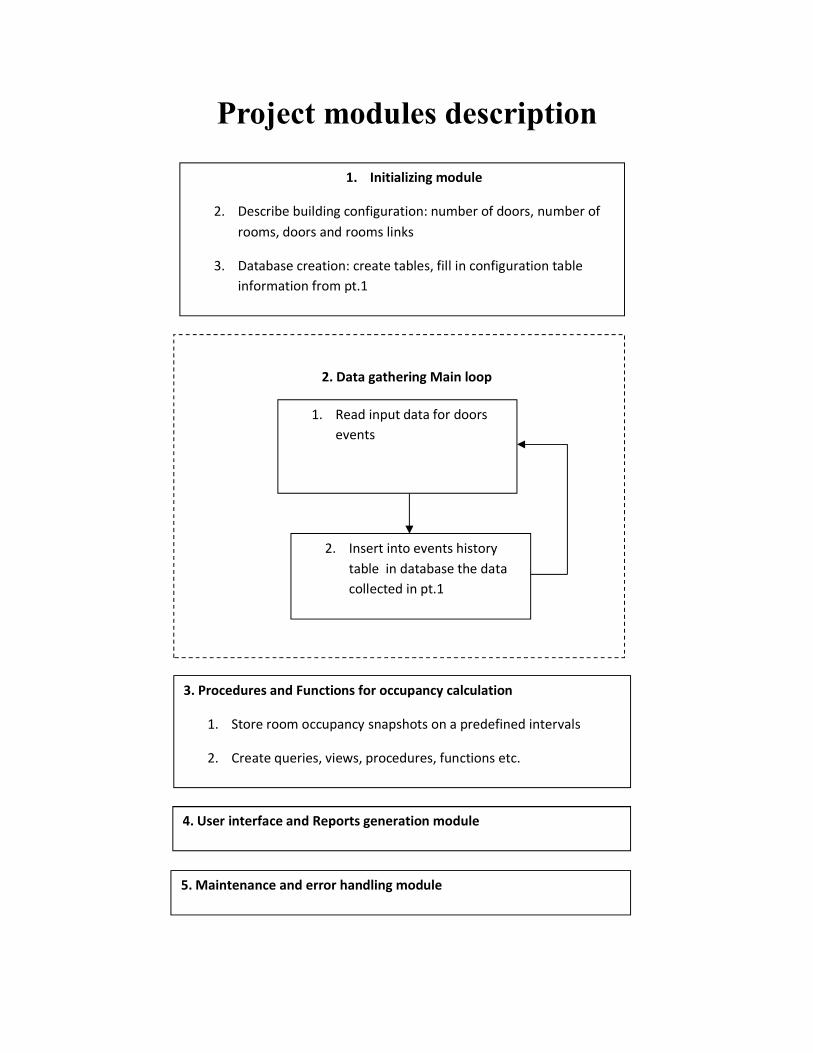
1. Read input data for doors
events
2. Insert into events history
table in database the data
collected in pt.1
3. Procedures and Functions for occupancy calculation
1. Store room occupancy snapshots on a predefined intervals
2. Create queries, views, procedures, functions etc.
4. User interface and Reports generation module
5. Maintenance and error handling module
Project modules description
2. Data gathering Main loop
1. Initializing module
2. Describe building configuration: number of doors, number of
rooms, doors and rooms links
3. Database creation: create tables, fill in configuration table
information from pt.1
Initializing module During the early period of development, we figured out that the occupancy engine needs some
plan of the buildings, identification of doors, rooms and buildings. In the initial java mockup, we
took the building structure data from a JSON file and made the building location structure based
on it. The second approach put this data into a table called BuildingPlan. The snapshot table that
receives all the relevant data from the sensors, the table with the system values, current state
and room occupancy has to be made for each building present.
Data gathering main loop This module will receive the data from the Arduino (For now, in the form of http request) –
DoorID, transition, confidence, time of the event and make a connection to the database
inserting them in a row into the EventSnapshot table. For now this approach can be seen in our
PHP mockup model – handling requests from the simulator and ones done manually.
Procedures and functions for occupancy calculation. This part deals with the filling of the RoomOccupancy and CurrentState table. This are set of
functions – MySQL queries that will analyse the data in the EventSnapshot table and make
judgment about how many people are there in a room for a given time. For example, if you
want to find out how many people were in a room two days ago all the transitions in the
snapshot table that consider this room will be selected and then the summation aggregation,
just like on figure two, will be made . The currentTime table will be updated once over a small
period of time – say 5 minutes and it will consider the new rows present in the EventSnapshot
table. Another way is to update a table every time we receive new information in the
Eventsnapshot table.
Queries
1. Current number of people in every room
2. Number of people in rooms for the selected previous date and time
3. Number of people moving through selected door/doors for the selected period of time
4. Order the doors by people moving through for the selected period of time
5. Find the doors with most/least number of people going through
6. Find the day/(time period) with the most/least people in the selected room
7. Find the day/(time period) with the most/least people moved through the selected
room
8. Find the room/rooms where the most/least people are moving
User interface and reports generation The user interface follows the model outlined in the chapter “Development of the user
interface”. The screens with the report table generation will use the query power of MySQL.
Maintenance and error handling: In this part of the system we have to create error handling procedures. For the purpose of
dealing with errors arising from the fault of the sensors/Arduinos/Server/Power/network
failures, etc. we have to create modules for scanning inconsistencies in the input data and
coming up with a solution on how to overcome the problem.
1. Error checking procedures:
o Check for too low probability percent ( repeating from the same DoorID) – at predefined
interval execute check procedure for repeating low probability data, for the same door
o Check for incorrect/impossible values (negative number of people in room) - with trigger
on table for current number of people in every room (table CurrentState). On update,
this trigger checks for negative value.
2. Procedure for clarify the real situation (ground truth) – the real number of people in the
rooms.
3. Error correcting procedures: by adding transactions to correct errors. – We may add a
field “correction” in snapshot table where to mark the records from correction. They
have to be inserted with the same date and time as the wrong ones. A consistent
manual correction has to be done in the table for storing the number of people in every
room, and in the table for current state of people number in the rooms.
Additional checks may be performed - for example unusual high movement in off working time
to compare computed occupancy with predefined table with fields [RoomID], [DayOfWeek],
[TypeOfDay], [30min_period_of_day], [MinOccupants], [MaxOccupants], [MustBeForced]. This
table could be filled manually in initial stages. After gathering enough data (For example, after 6
months) the table may be filled using procedure with real data.