143
Occupational Medicine Prof. Francesco S. Violante General Concepts Evolution of Working Conditions Health and Labour Occupational Injuries and Diseases

Occupational MedicineProf. Francesco S. Violante
General Concepts
Evolution of Working Conditions
Health and Labour
Occupational Injuries and Diseases

What is Occupational Medicine It is considered to have been founded in 1700 by
Prof. Bernardino Ramazzini's treatise “De Morbis Artificum Diatriba” (b. Carpi – d. Padova)
It was for a long time identified as the medical specialty concerned with the diagnosis, treatment and prevention of occupational diseases
It has developed in Europe since the first half of the XIX century
At the beginning of the XX century, the first “Work Clinic” is established in Milan, and the International Commission on Occupational Health is founded in 1906

What is Occupational MedicineIt is the medical specialty concerned with
the protection and promotion of the working population's health
It is not an “anatomical” specialtyIt is a qualification required by law for
exercising some professional activities (Competent Physician and Authorized Physician)
It has developed and uses peculiar techniques, which have in their turn become operative specialties
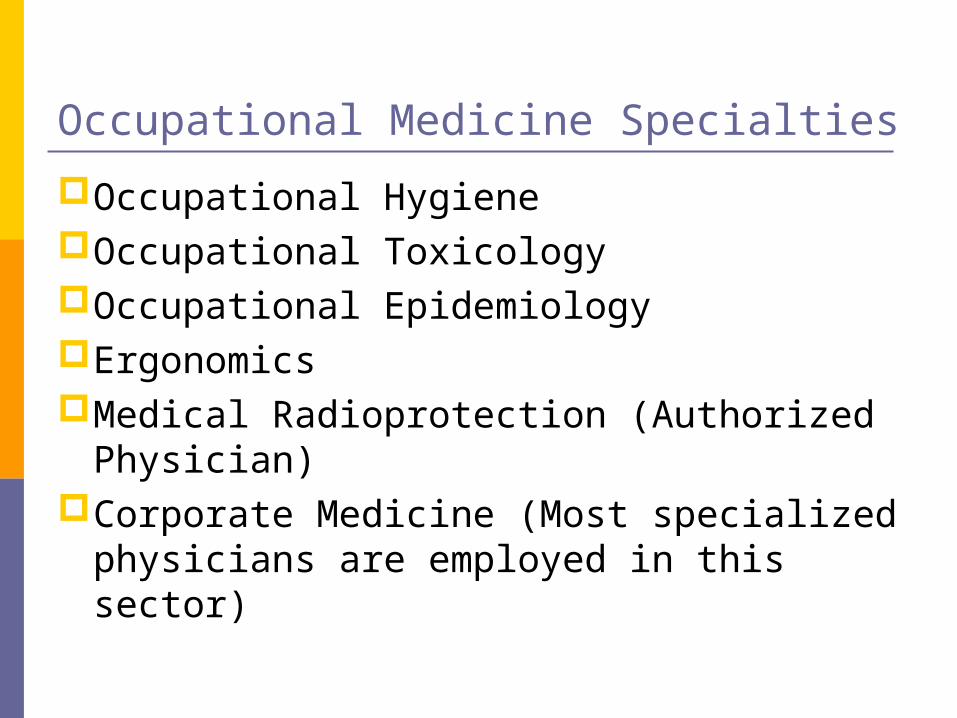
Occupational Medicine Specialties
Occupational HygieneOccupational ToxicologyOccupational EpidemiologyErgonomicsMedical Radioprotection (Authorized
Physician)Corporate Medicine (Most specialized
physicians are employed in this sector)

Evolution of Working Conditions
As with many aspects of human life, working conditions remained almost unchanged for centuries
Structured work, as we know it today, is a product of the “Industrial Revolution” (XVIII century)
We are currently living in what is called a “post-industrial society”

Life and Working Conditions before the Industrial Revolution In past centuries, life was dominated by
undernutrition, bad hygienic conditions and lack of effective medical care
In the Middle Ages, life expectancy (today in Italy: 77-83) was about 50 for those who reached adulthood
Food availability and big epidemics have affected the world population rate:- 1000: 300.000.000- 1500: 500.000.000- 1800: 1.000.000.000- 1930: 2.000.000.000- 1975: 4.000.000.000- 2000: 6.000.000.000

World Population Development
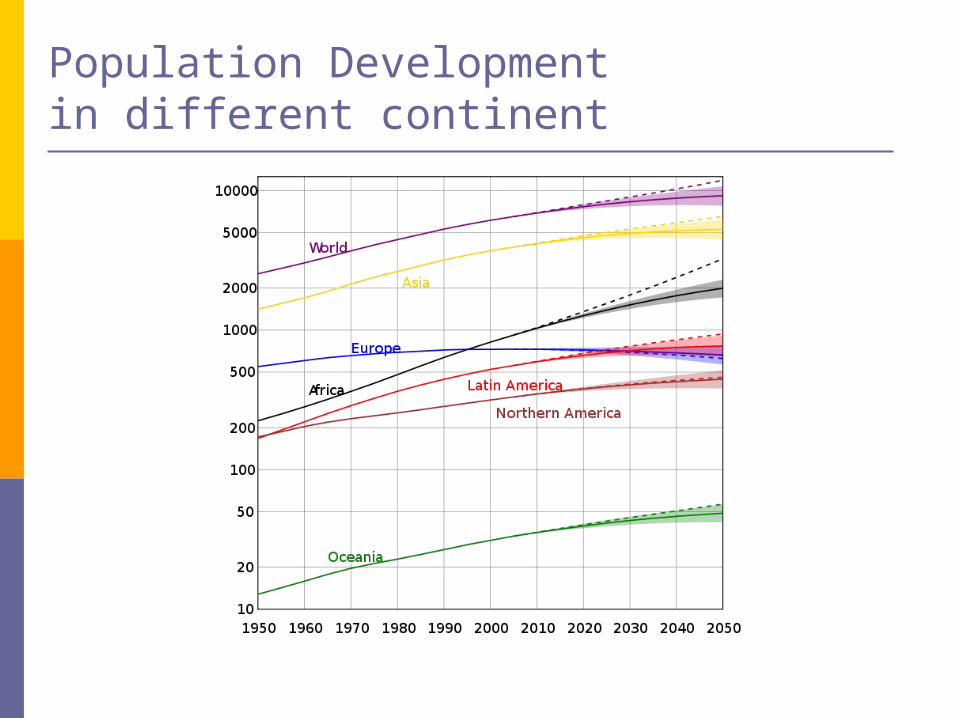
Population Developmentin different continent
Anno
Pop
ola
zione in m
ilioni
(s
cala
logari
tmic
a)

Working Conditions before the Industrial Revolution
Most of the population was employed in agriculture and zootechnics; few worked as craftsmen and even less in the service industry
The working life began as soon as children were strong enough
All the work was done by strength of arm, animals and simple machines (levers, block-and-tackles)
The working day lasted from sunrise to sunset Healthcare (mostly ineffective or dangerous) had
to be paid for or was provided by charities (religious organizations)

Health and Labour before the Middle Ages
Hyppocrates (460-377 B.C.): miners, metal craftsmen, dyers, farmers
Lucretius (100-55 B.C.): De Rerum Natura, miners
Plinius the Elder (23-79): minersGalenus (129-200): miners, gladiatorsAl-Razi (850-923): cotton spinning

From the Middle Ages to the Industrial Revolution 1242: Roger Bacon publishes the formula for
black powder, which would lead, in the ensuing centuries, to a change in military technology (and in excavation techniques)
1492: the Discovery of America Ellenbog (1440-1499): metal workers Paracelsus (1493-1541): miners and glazers 1455: Johann Gutenberg puts on sale the first
printed book, a Bible George Bauer, called Agricola (1494-1555): De Re
Metallica, gold and silver metallurgy 1677: van Leeuwenhoek develops the microscope

The Industrial RevolutionIt takes place in England between 1760
and 1830, after the Agricultural Revolution1712: Newcomen's Steam EngineGA Scopoli (1723-1788) is appointed as
physician of the mercury mines in Idrjia, where he works for 16 years. He is author of the De Hydroargyro Idriensi Tentamina, a treatise on mercury poisoning in miners
1768: Arkwright patents the mechanical spinning frame

The Industrial Revolution
1786: John Fitch's Steamboat 1810: Krupp improves the steel production
process (originally developed in 1740 by Huntsmann, in Sheffield), eventually improved by Bessemer (1854) and Martin, by the Siemens in 1866 and by Thomas (1875)
1825: The Locomotion 1 by Robert Stephenson drags the first commercial train in the world from Stockton-on-Tees to Darlington
1840: Samuel Cunard launches a transatlantic service between Great Britain and the United States

Working Conditions during the Industrial Revolution
Safety and Hygiene standards are very poor The population's hygienic and nutritive conditions
are also precarious (though improving) There is no general healthcare The first laws on child labour ban and limit its use
(between 12 and 8 hours depending on age)

Labour in History:the Spinning Mill (1815)

Labour in History: 1800
Working in the Spinning Mill: silkwormsFonte: http://www.provincia.venezia.it/medea/est/frulli/filanda/filande.htm

Labour in History: 1800
Working in the Spinning Mill: silkwormsFonte: http://spazioinwind.libero.it/filandeonline/images/7%20Bachi.jpg
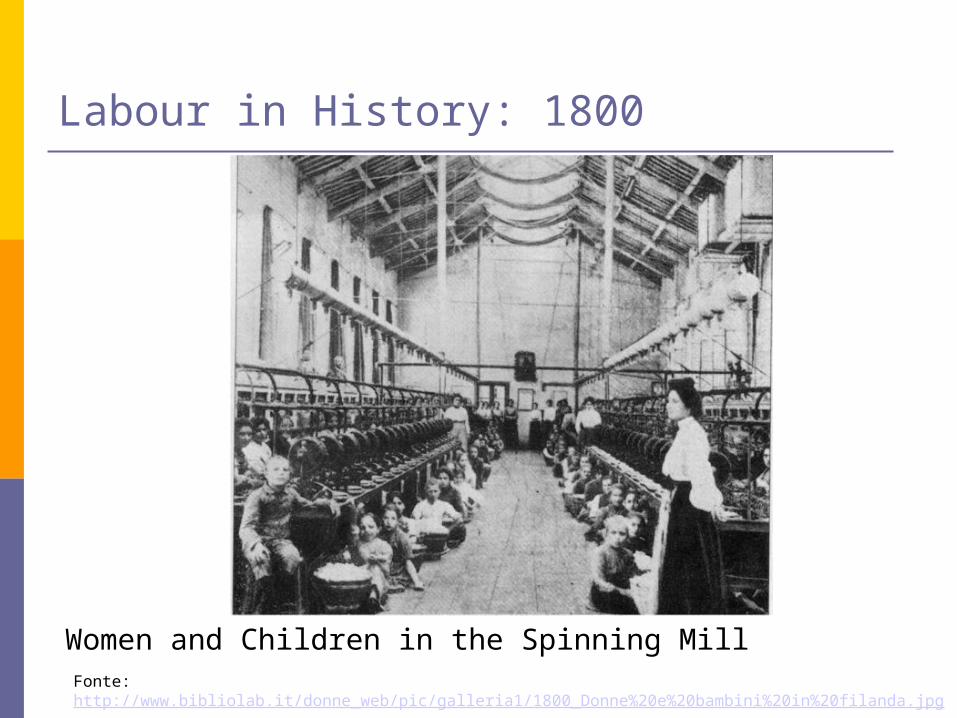
Labour in History: 1800
Women and Children in the Spinning MillFonte: http://www.bibliolab.it/donne_web/pic/galleria1/1800_Donne%20e%20bambini%20in%20filanda.jpg

Labour in History: ~1900
Factory Workers of the Rasica Spinning Mill in Osio Sotto Source: http://www.lomb.cgil.it/sedi/bg/cdl/2006/8marzo/sommario_foto.htm
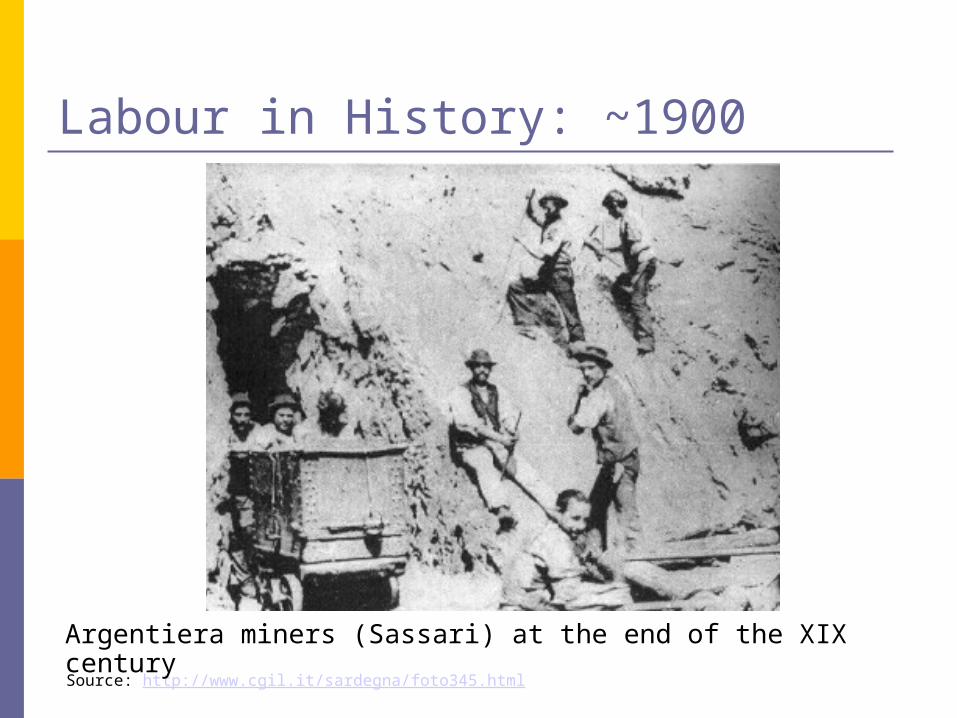
Labour in History: ~1900
Source: http://www.cgil.it/sardegna/foto345.html Argentiera miners (Sassari) at the end of the XIX century

Industrial Development in Italy
On the eve of the First World War, Italy is still an agricultural country with few factories
The first stage of industrial growth dates back to the period between the two World Wars
After the Second World War, Italy emerges first as an industrial economy and later as a post-industrial one (after 1980)

Labour in History: ~1940
Legler Mechanical Looms in the forties
Source: http://www.lomb.cgil.it/sedi/bg/cdl/2006/8marzo/sommario_foto.htm

Labour in History: 1950
Weber Factory: Drilling Machine Operator
Source: Regione Emilia Romagna http://www.form-azione.it/pariopportunita/donnedellaltrosecolo.htm

Labour in History: 1950
Factory worker making sweet boxes by hand
Source: Regione Emilia Romagna http://www.form-azione.it/pariopportunita/donnedellaltrosecolo.htm

Labour in History: 1950
Ducati Factory WorkerSource: Regione Emilia Romagna http://www.form-azione.it/pariopportunita/donnedellaltrosecolo_06.htm

Labour in History: 1960
Sourcehttp://www.stava1985.it/intranet/stava1985_it/www/wo_albums/Index/20050718_152739/20050718_162011/PhotoFolder?display=medium
Miners working in the Prestavel mine (fluorite veins)

Labour in History: 1965
Miner working with jack-leg – Mine in Valle Vedra
Source: http://www.wwmm.org/storie/storia.asp?id_storia=252&pagina=9&project=0

The first Italian laws on work safety
1886 Ban on child labour under 9 and ban on night labour under 12
1902 Minimum age for working 12 years
1904 Minimum age for working 14 years
1899-1913 General prevention regulations and regulations for some specific sectors
1898-1934 Mandatory insurance against occupational injuries and (later) diseases

Workforce composition in Italy between 1881 and 2000 (INAIL data)
Year Agriculture Industry Service
1881 65,4% 20,2% 14,4%
1936 52,0% 25,6% 22,4%
1951 43,0% 29,9% 27,1%
1981 11,1% 41,5% 47,4%
2000 5,3% 32,1% 62,6%

Active Population per Sector in Italy (Istat Data, 2001)
Males Females Total
Industry 5.316.779 1.712.202 7.028.981
Trade 2.298.682 1.687.856 3.986.538
Credit and Insurances, services to companies
1.168.507 884.174 2.052.681
Agriculture 739.903 413.775 1.153.678
Transportations and Communications
780.240 198.789 979.029
Other Activities 2.537.860 3.254.965 5.792.825
Total 12.841.971 8.151.761 20.993.732

Relationship between Health and Labour
Work can affect health both negatively and positively
Negative consequences: occupational injuries and diseases, reduction of life expectancy
However, “healthy” work is an important factor in health promotion

Occupational Injuries and Diseases Occupational Injury: damage to an individual's
psychophysical integrity due to a violent causal factor which is concentrated in time during the working activity
Occupational Disease: damage to an individual's psychophysical integrity due to a causal factor which is diluted in time during the working activity
Occupational Injuries and Diseases are, by definition, predictable events

Working is good for our Health It is not yet clear which occupational factors are
associated with an improved health status Income, Social Relations, Identity Physical Activity Abstention from Smoke (in some sectors) Regular Medical Checks (maybe) Healthy Worker Effect: phenomenon described in
Epidemiology whereby workers usually have better health than unemployed people

Mortality and Labour (Turin 1991-96)
Working Condition Relative Risk
Steadily employed 1,00
Intermittently employed 1,52
Unemployed (previously employed)
2,29
Steadily unemployed 2,61
Steadily out of labour force 4,81
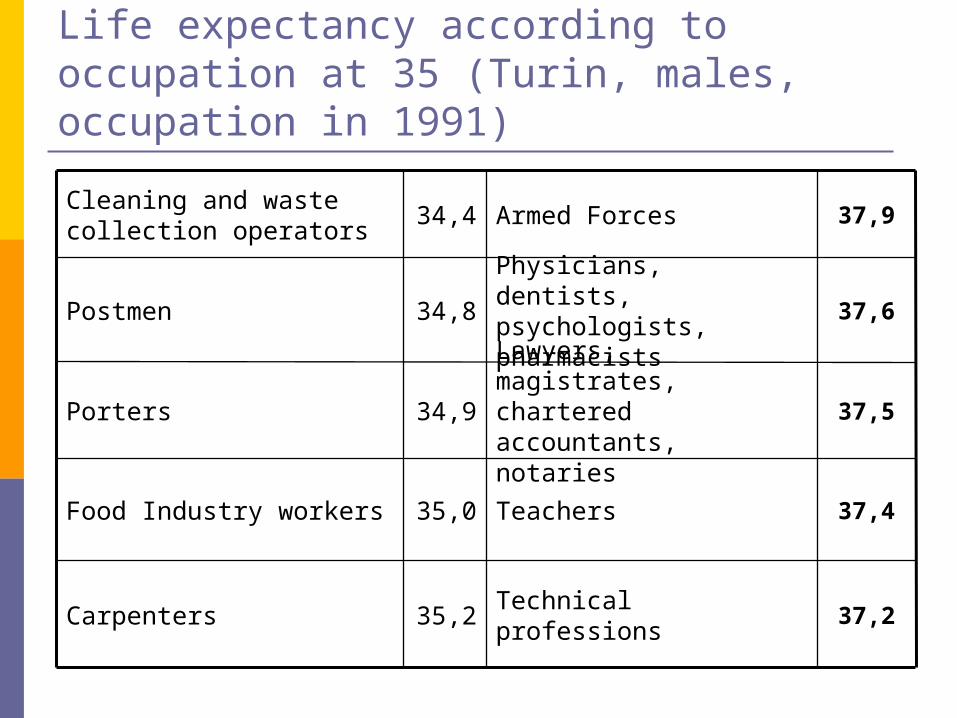
Life expectancy according to occupation at 35 (Turin, males, occupation in 1991)
Cleaning and waste collection operators
34,4 Armed Forces 37,9
Postmen 34,8Physicians, dentists, psychologists, pharmacists
37,6
Porters 34,9Lawyers, magistrates, chartered accountants, notaries
37,5
Food Industry workers 35,0 Teachers 37,4
Carpenters 35,2 Technical professions 37,2
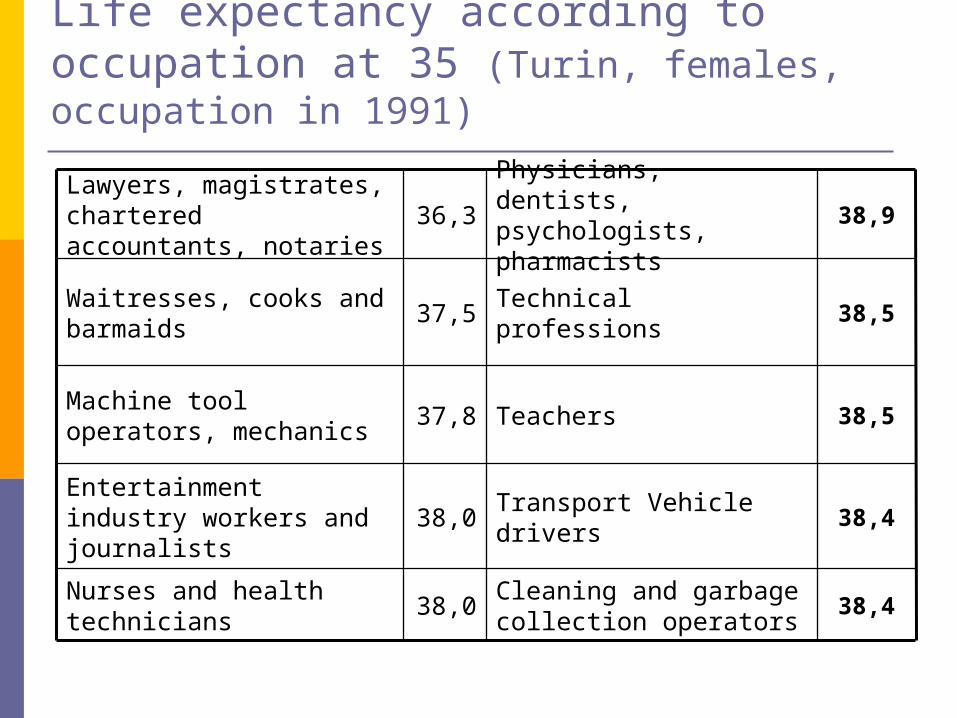
Life expectancy according to occupation at 35 (Turin, females, occupation in 1991)
Lawyers, magistrates, chartered accountants, notaries
36,3Physicians, dentists, psychologists, pharmacists
38,9
Waitresses, cooks and barmaids
37,5 Technical professions 38,5
Machine tool operators, mechanics
37,8 Teachers 38,5
Entertainment industry workers and journalists
38,0Transport Vehicle drivers
38,4
Nurses and health technicians
38,0Cleaning and garbage collection operators
38,4

Italian Population divided by age and sex (1-1-2008)
Classi di età
(anni)
Maschi Femmine Totale
0-19 5.837.497 5.512.040 11.349.537
20-64 18.112.441 18.211.326 36.323.767
65 e oltre 4.999.809 6.946.177 11.945.986
Totale 28.949.747 30.669.543 59.619.290
Nati 2007 290.330 273.603 563.933
Morti 2007 279.792 291.009 570.801

Deaths by age and sex class - Italy, 2002Age Classes
(years)Males Females Total
Below 1 1.320 1.017 2.337
1-14 720 469 1.189
15-29 4.257 1.345 5.602
30-44 8.579 4.148 12.727
45-59 24.445 13.591 38.036
60-69 45.516 24.432 69.948
70-79 88.331 64.105 152.436
80-89 79.272 105.664 184.936
90 and over 26.856 66.323 93.179
Total 279.296 281.094 560.390

Deaths by group of causes - Italy, 2002
Cause Males Females Total
Circulatory system diseases 105.726 131.472 237.198
Tumours 93.398 69.672 163.070
Respiratory apparatus diseases 20.617 15.324 35.941
Traumatisms and poisonings 16.026 10.667 26.693
Digestive apparatus diseases 12.485 12.234 24.719
Psychic diseases, diseases of the nervous system and sense organs
9.552 14.765 24.317
Infectious and parasitic diseases 2.145 2.147 4.292
Other morbid conditions … … …
Total 279.296 281.094 560.390

Deaths by group of causes
Mortalità per causa - Per 100.000 abitanti

Deaths due to external causes of traumatisms and poisonings– Italy, 2002
Causa Maschi Femmine Totale
Cadute accidentali 4.035 6.517 10.552
Incidenti stradali 5.577 1.542 7.119
Suicidi 3.145 924 4.069
Annegamento e soffocamento 349 91 440
Omicidio o lesioni provocate intenzionalmente da altri
401 159 560
Incendi 144 131 275
Complicanze di operazioni chirurgiche
199 159 358
Avvelenamento da gas 45 22 67
Altri incidenti … … …
Totale 16.026 10.667 26.693

Major Malignant Tumours causing death, by sex – Italy, 2002
Site Males Females Total
Trachea, bronchus and lung 25.765 6.528 32.293
Colon, rectus and anus 9.164 8.072 17.236
Breast (in women) ― 11.309 11.309
Stomach 6.266 4.686 10.952
Liver and intrahepatic bile ducts 6.661 3.604 10.265
Linfatic and emopoietic tissues 3.887 3.724 7.611
Prostate 7.132 ― 7.132
Leukemias 3.022 2.533 5.555
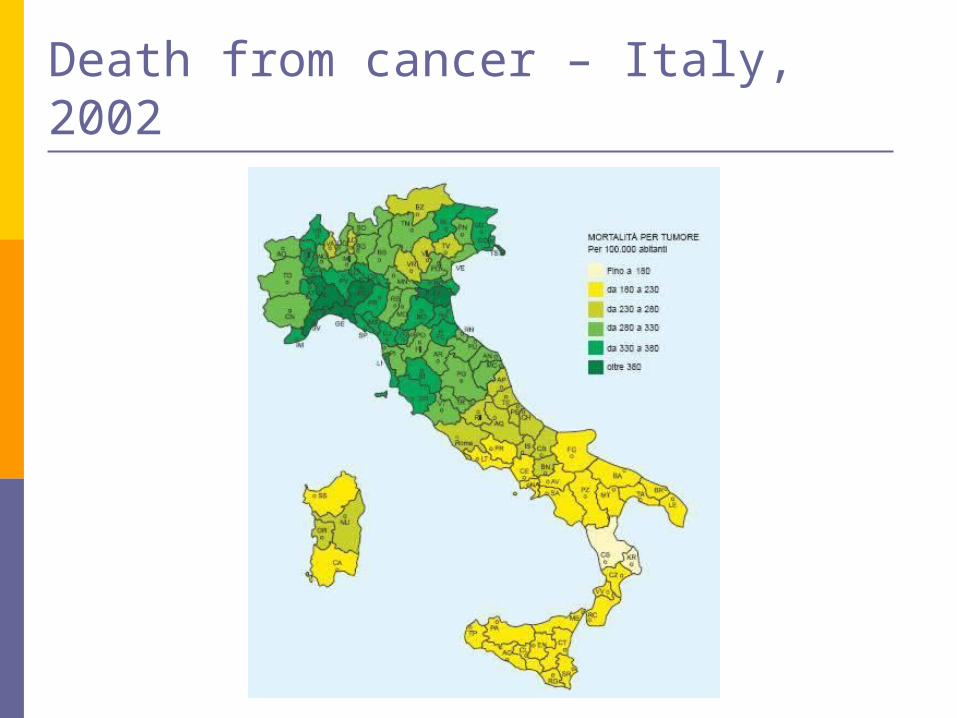
Death from cancer – Italy, 2002

Occupational Injuries

Occupational Injuries reported to INAIL (2008)
All Lethal
Agriculture(in-itinere injuries)
53.355 (1.259)
121(18)
Industry and Service(in-itinere injuries)
790.278 (88.236)
)
911(249)
Public employees(in-itinere injuries)
31.457 (5.008
88(9)
Total(in-itinere injuries)
875.090(97.201)
1120(276)

Occupational Injuries in the EU (2005)
Economic activity All Lethal
Manufacturing industry 3.505 837
Building sector 6.069 1.236
Trade 2.184 372
Transportations 3.696 701
Agriculture 4.560 4.153
Hotels and restaurants 2.943 61
Electricity, gas, water 1.830 53

Occupational Injuries Industry and Service- type of lesion (INAIL 2008)
Natura della lesione Inabilità temporanea
Inabilità permanente
Morte Totale
Contusione 150.801 4.603 162 155.566
Lussazione 150.830 5.493 5 156.328
Ferita 103.657 2.881 29 106.567
Frattura 49.593 16.872 458 66.923
Altri agenti (calore,..) 12.006 374 91 12.471
Corpi estranei 12.450 130 0 12.580
Lesioni da sforzo (ernie,…) 9.184 239 1 9.424
Altre e indeterminate 6.689 471 161 7.321
Perdita anatomica 1.776 1.085 3 2.864
Lesione da agenti infett. 328 21 1 350
Totale 497.314 32.169 911 530.394

Occupational Injuries - Agriculture- type of lesion (INAIL 2008)
Natura della lesione Inabilità temporanea
Inabilità permanente
Morte Totale
Ferita 8.964 418 4 9.386
Contusione 13.031 706 16 13.753
Lussazione 9.147 773 1 9.921
Frattura 4.898 2.117 51 7.066
Perdita anatomica 169 102 2 273
Da agenti infett. 74 2 - 76
Da altri agenti 596 18 17 631
Da corpi estranei 1.164 17 - 1.181
Da sforzo 616 33 - 649
Totale 38.989 4.236 117 43.342

Occupational Injuries Industry and Service- site of lesion (INAIL 2008)
Sede della lesioneInabilità
temporaneaInabilità
permanenteMorte Totale
Mano 129.803 4.583 2 134.388
Colonna vertebrale 72.918 3.180 39 76.137
Ginocchio 37.320 2.881 1 40.202
Caviglia 37.922 2.444 1 40.367
Cranio 20.841 1.575 439 22.855
Piede 23.735 1.585 1 25.321
Polso 20.716 2.726 0 23.442
Cingolo toracico 22.450 3.248 3 25.701
Occhi 19.178 497 0 19.675
Parete toracica 19.481 1.073 98 20.652
Altro (...) (...) (...) (...)
Totale 497.314 32.169 911 530.394

Occupational Injuries - Agriculture- site of lesion (INAIL 2008)
Sede della lesioneInabilità
temporaneaInabilità
permanenteMorte Totale
Mano 8.542 477 - 9.019
Colonna vertebrale 3.188 455 8 3.651
Ginocchio 4.099 423 - 4.522
Caviglia 2.918 315 1 3.234
Cranio 1.435 133 38 1.606
Polso 1.606 394 - 2.000
Piede 2.014 172 - 2.186
Cingolo toracico 2.460 572 - 3.032
Occhi 2.346 105 - 2.451
Parete toracica 2.899 209 17 3.125
Altro (...) (...) (...) (...)
Totale 38.989 4.236 117 43.342

Injuries: Incidence Rates in the EU (2005)
0 1000 2000 3000 4000 5000 6000 7000
Spagna
Francia
Portogallo
UE - Euro Area
Lussemburgo
Germania
Belgio
UE - 15
Finlandia
ITALIA
Danimarca
Paesi Bassi
Austria
Grecia
Regno Unito
Irlanda
Svezia

Lethal Injuries: Incidence Rates in the EU (2005)
0 1 2 3 4 5 6 7
Spagna
Francia
Portogallo
UE - Euro Area
Lussemburgo
Germania
Belgio
UE - 15
Finlandia
ITALIA
Danimarca
Paesi Bassi
Austria
Grecia
Regno Unito
Irlanda
Svezia

Injury Causes
The ever-present influence of organizational factors on the occurrence of injury events is much more relevant than that of technological factors

Hazardous environments and equipments

Hazardous environments and equipments

Hazardous environments and equipments
Desk-top circular saw
Flexible grind wheel

Specific Causes of Injury
Age below 30Early working hours Less than 5 years experience in a specific taskPerforming unusual tasks Lack of experienceDistractionSleep disorders

Social Determinants of Injury
Schooling levelOccupational conditions (working position and activity)
Psychosocial factors(work stress, relations with colleagues)
Smoke, alcohol and lack of sleep
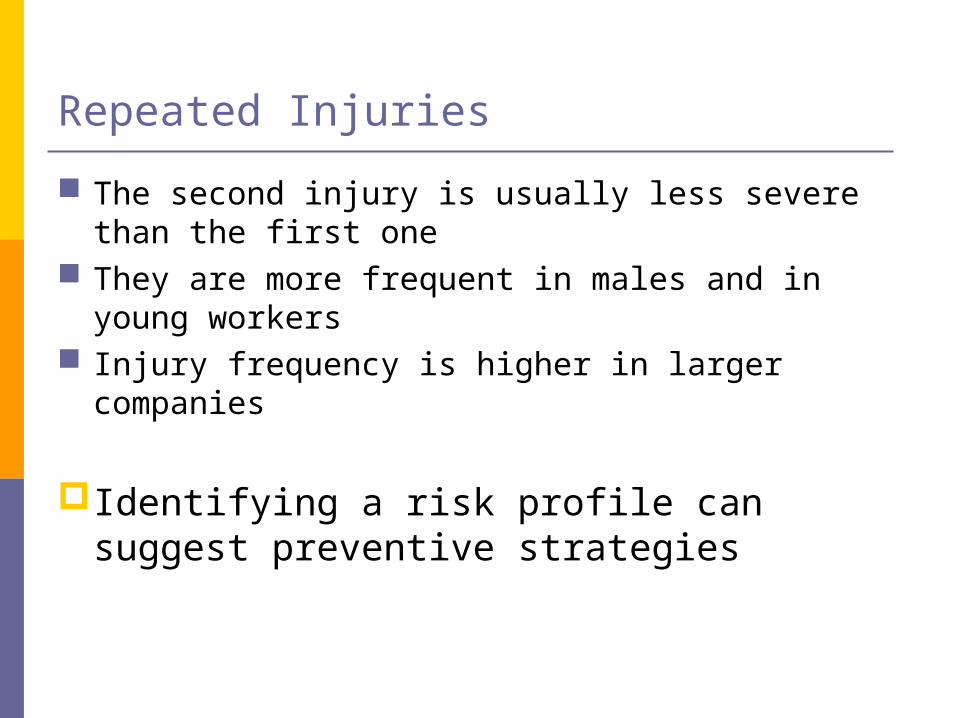
Repeated Injuries
The second injury is usually less severe than the first one
They are more frequent in males and in young workers
Injury frequency is higher in larger companies
Identifying a risk profile can suggest preventive strategies

Risk Perception
The attitude to act safely is associated with a higher or lower risk perception on the part of workers
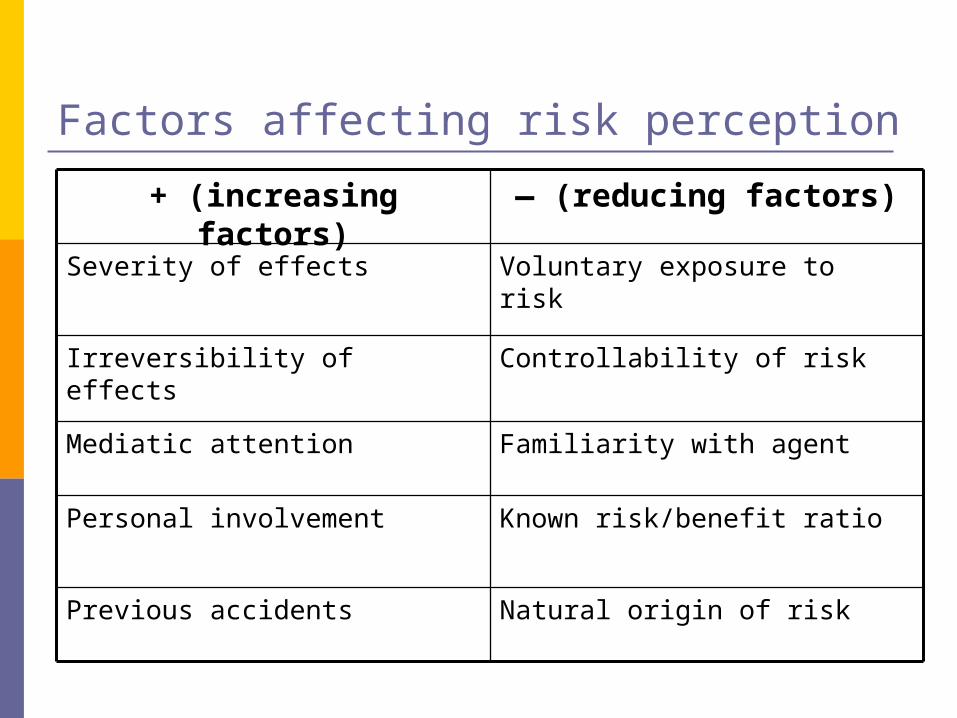
Factors affecting risk perception
+ (increasing factors) — (reducing factors)
Severity of effects Voluntary exposure to risk
Irreversibility of effects Controllability of risk
Mediatic attention Familiarity with agent
Personal involvement Known risk/benefit ratio
Previous accidents Natural origin of risk

Occupational Diseases

Recognized Occupational Diseases UE (2003)
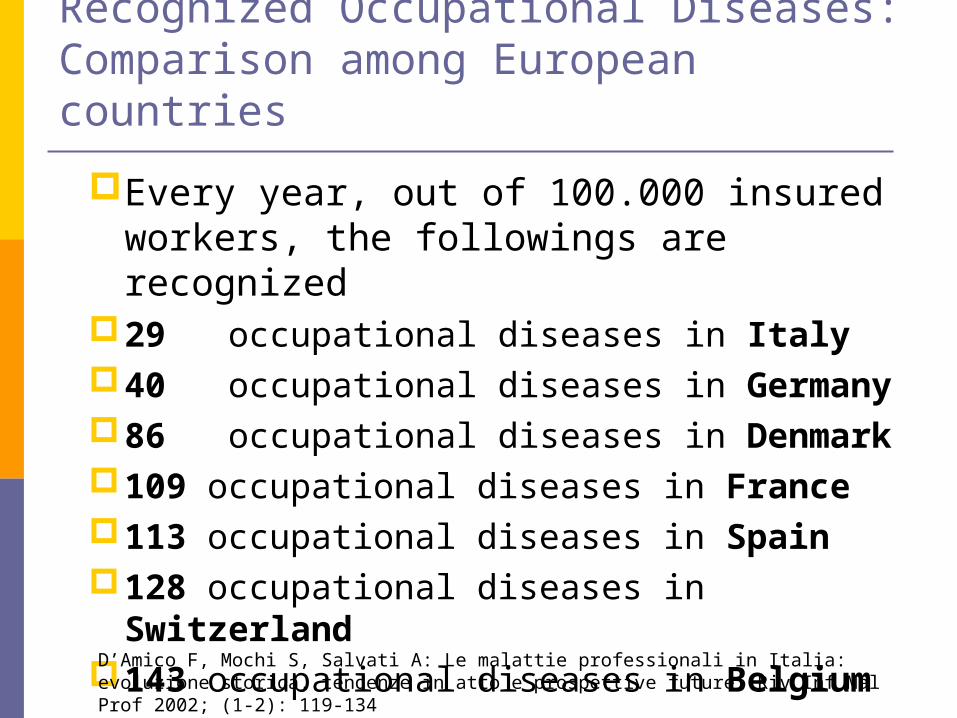
Recognized Occupational Diseases: Comparison among European countries
Every year, out of 100.000 insured workers, the followings are recognized
29 occupational diseases in Italy40 occupational diseases in Germany86 occupational diseases in Denmark109 occupational diseases in France113 occupational diseases in Spain128 occupational diseases in Switzerland143 occupational diseases in Belgium
D’Amico F, Mochi S, Salvati A: Le malattie professionali in Italia: evoluzione storica, tendenze in atto e prospettive future. Riv Inf Mal Prof 2002; (1-2): 119-134

Classification of Occupational Diseases in Italy
The occupational diseases recognized in Italy are those contracted in the exercise and because of the working conditions as specified in the tables annexed to D.P.R. 336 (13/4/1994)
Tables report occupational diseases, exposures and working conditions that could cause them

“Tabled” Occupational Diseases reported to INAIL (2005)
Type od disease Agriculture,
Industry and Service
Hypoacusia and Deafness 1.126
Pneumoconiosis 660
Asbestos Neoplasias 642
Skin Diseases 385
Osteoarticular Diseases 148
Bronchial Asthma 143
Allergic Alveolites 11
Others (…)
Total 3.593
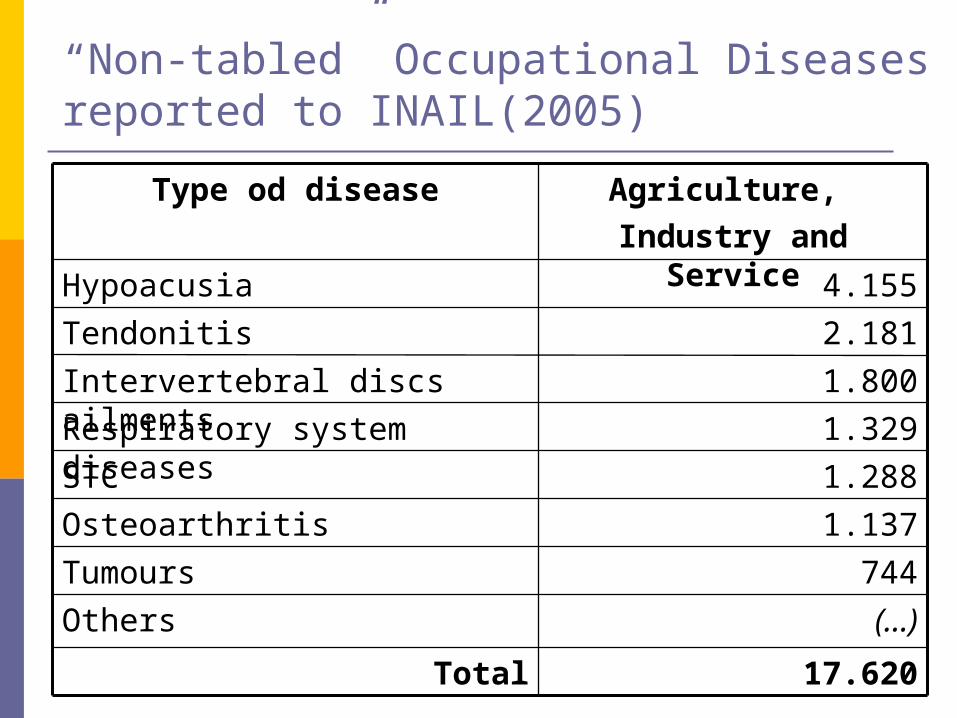
“Non-tabled” Occupational Diseases reported to INAIL(2005)
Type od disease Agriculture,
Industry and ServiceHypoacusia 4.155
Tendonitis 2.181
Intervertebral discs ailments 1.800
Respiratory system diseases 1.329
STC 1.288
Osteoarthritis 1.137
Tumours 744
Others (…)
Total 17.620

Epidemiological Data
Every year I.N.A.I.L. receives about 25.000 reports of occupational diseases
Fourth Survey on Workers' Health (European Foundation, Dublin, 2005) :24,7% report back pain22,8% report muscular pain22,3% report stress disorders

Ods compensated in the years1999 – 2002, INAIL data (INDUSTRY AND SERVICE)
Malattie professionali indennizate
-1,0002,0003,0004,0005,000
1998 1999 2000 2001 2002
Tabellate
Non tabellate
Totale

ODs occurred in the years2000 – 2004 in the Italian regions
-
50
100
150
200
250
2000 2001 2002 2003 2004
N°
PIEMONTE VALLE D'AOSTA LOMBARDIA LIGURIA TRENTINO A.A.
VENETO FRIULI V. G. EMILIA ROMAGNA TOSCANA MARCHE
LAZIO ABRUZZO MOLISE CAMPANIA PUGLIA
BASILICATA CALABRIA SICILIA SARDEGNA UMBRIA
VENETO
MARCHEEMILIA ROMAGNA
TOSCANAABRUZZO
UMBRIA

Malattie professionali indennizzate
0
200
400
600
800
1000
1200
1400
1600
1800
2000
1990 1991 1992 1993 1994 1995 1996 1997 1998 1999
MALATTIE DA METALLI
MALATTIE CUTANEE CAUSATE DA CATRAME,BITUME, PECE, FULIGGINE, ANTRACENE
MALATTIE OSTEOARTICOLARI E ANGIONEUROTICHE CAUSATE DA VIBRAZIONI MECCANICHE
BRONCOPNEUMOPATIE DA INALAZIONE DI SILICATI O DI CALCARE
BRONCOPNEUMOPATIE (POLVERI,ESALAZIONI): ALLUMINIO,METALLI DURI, SCORIE THOMAS, LEGNI ESOTICI, COTONE
BRONCOPNEUMOPATIE (POLVERI,ESALAZIONI): ANTIBIOTICI,FRUMENTO GOMMA ARABICA, ISOCIANATI
ASBESTOSI
MALATTIE NON TABELLATE O CONTRATTE INLAVORAZIONI NON TABELLATE

ODs reported in Italy
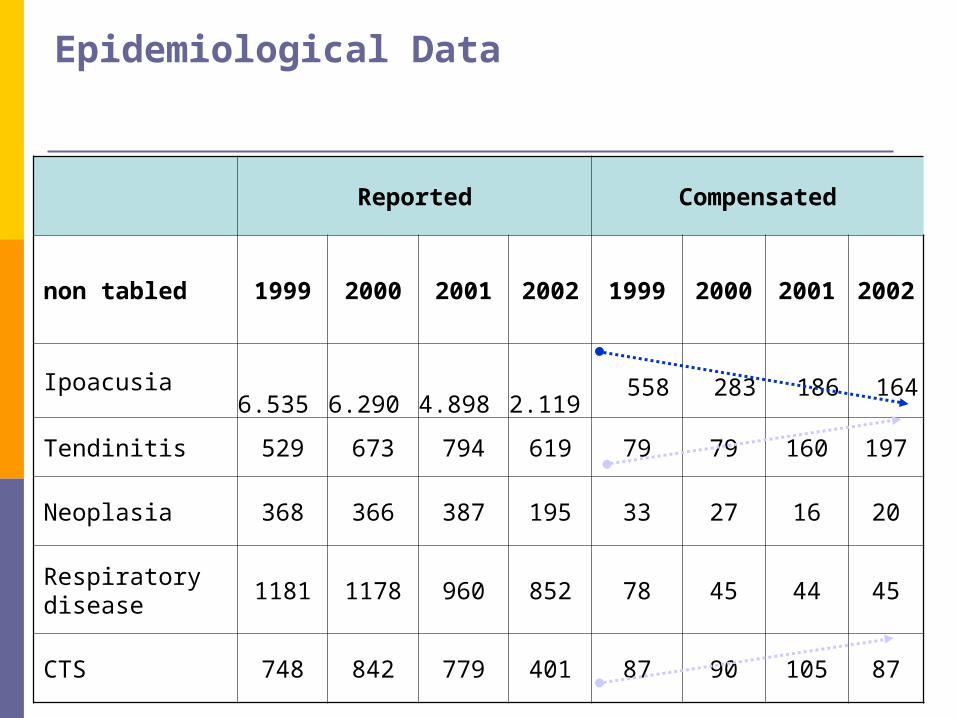
Reported Compensated
non tabled 1999 2000 2001 2002 1999 2000 2001 2002
Ipoacusia 6.535 6.290 4.898 2.119 558 283 186 164
Tendinitis 529 673 794 619 79 79 160 197
Neoplasia 368 366 387 195 33 27 16 20
Respiratory disease
1181 1178 960 852 78 45 44 45
CTS 748 842 779 401 87 90 105 87
Epidemiological Data

Low back pain: INAIL data (1999) Among occupational diseases compensated by
INAIL, musculoskeletal diseases occupy the tenth position (18,1%).
Among non-tabled musculoskeletal diseases accepted by INAIL (about 1000), disc pathology account for 7% of the total
But… 10% of occupational injuries affect the spine (56000
events/year): 38% affect the lumbar rachis 93% of occupational injuries to the lumbar rachis are due
to heavy lifting and to inappropriate movements
(Giuseppe Campo, ISPESL: relazione congressuale 2002)
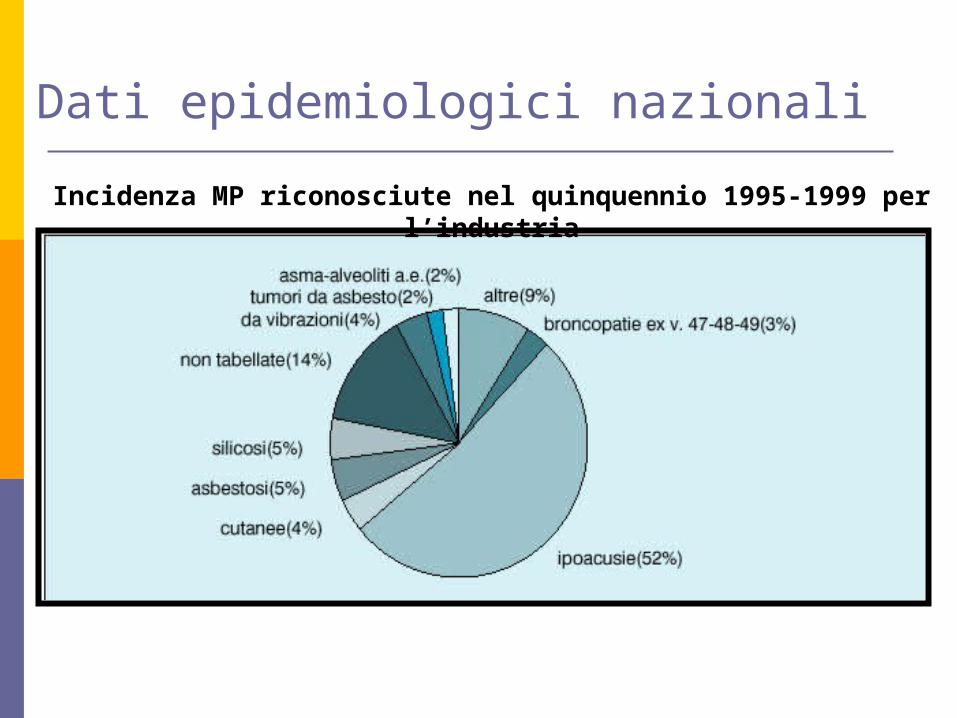
Dati epidemiologici nazionali
Incidenza MP riconosciute nel quinquennio 1995-1999 per l’industria

WRMSD e INAIL:Numero di casi accolti rispetto ai casi pervenuti (1996-2000)

WRMSD e INAIL Anno 2000MP da WRMSD accolte in SMG nell’anno 2000 (incidenza per patologie)
MP da WRMSD pervenute in SMG - anno 2000 (distribuzione per regioni)

Ripartizioni percentuale dei casi di WRMSD accolti secondo le lavorazioni

INAIL - % MSDs per patologia
0
10
20
30
40
50
60
2000
STC
Spalla
Epicond. /Epitr.
Discopatia rachide
M. De Quervain
Neurop. Ulnare
Tend. Mano/polso
Altro
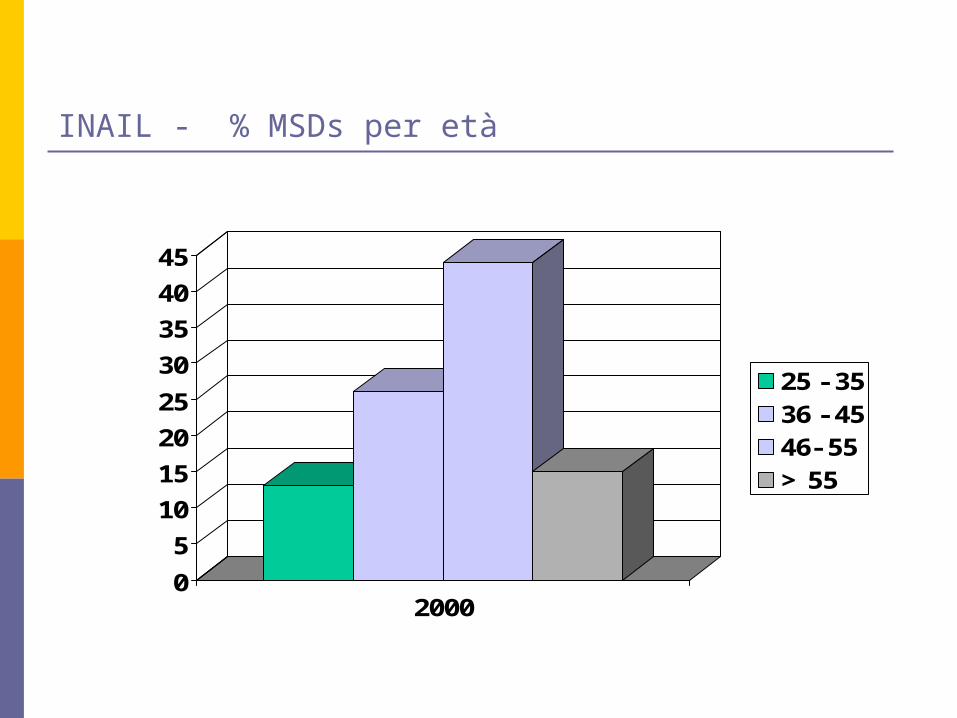
INAIL - % MSDs per età
0
5
10
15
20
25
30
35
40
45
2000
25 - 3536 - 4546- 55> 55
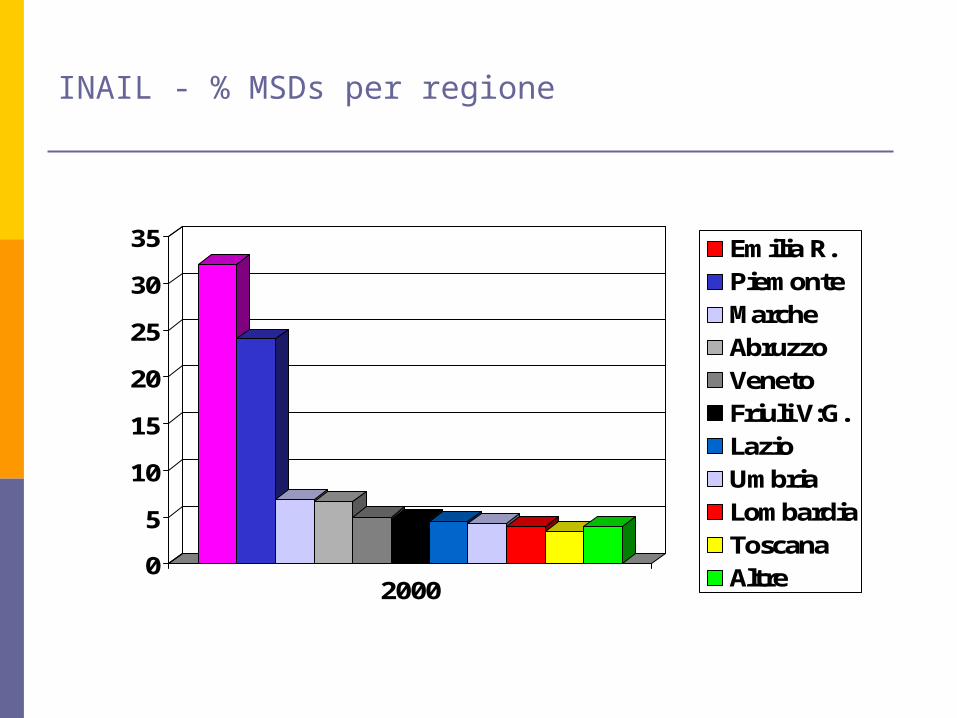
INAIL - % MSDs per regione
0
5
10
15
20
25
30
35
2000
Emilia R.PiemonteMarcheAbruzzoVenetoFriuli V:G.LazioUmbriaLombardiaToscanaAltre

Tecnopatia 1999 2000 2001 2002 2003 2004 Tot. %Ipoacusie 2859 2108 2376 2378 2283 2253 14257 71,3PMS 341 384 498 696 601 1146 3666 18,3Dermatiti 164 113 160 107 113 109 766 3,8Broncopneumo. 48 41 38 32 41 45 245 1,2Neoplasie 23 35 30 38 78 37 241 1,2Mesoteliomi 17 30 28 37 42 61 215 1,1Asbestosi 11 8 21 18 16 25 99 0,5Epatopatie 58 1 10 5 3 1 78 0,4Asma bronchiale 8 14 11 21 11 10 75 0,4Saturnismo 15 10 12 4 20 9 70 0,4Silicosi 15 6 4 4 2 14 45 0,2Stress/Mobbing 1 1 5 4 9 18 38 0,2Altre 41 14 34 31 34 49 203 1Totale 3601 2765 3227 3375 3253 3777 19998 100
Segnalazioni MP SPSAL Emilia-RomagnaSegnalazioni MP SPSAL Emilia-Romagna
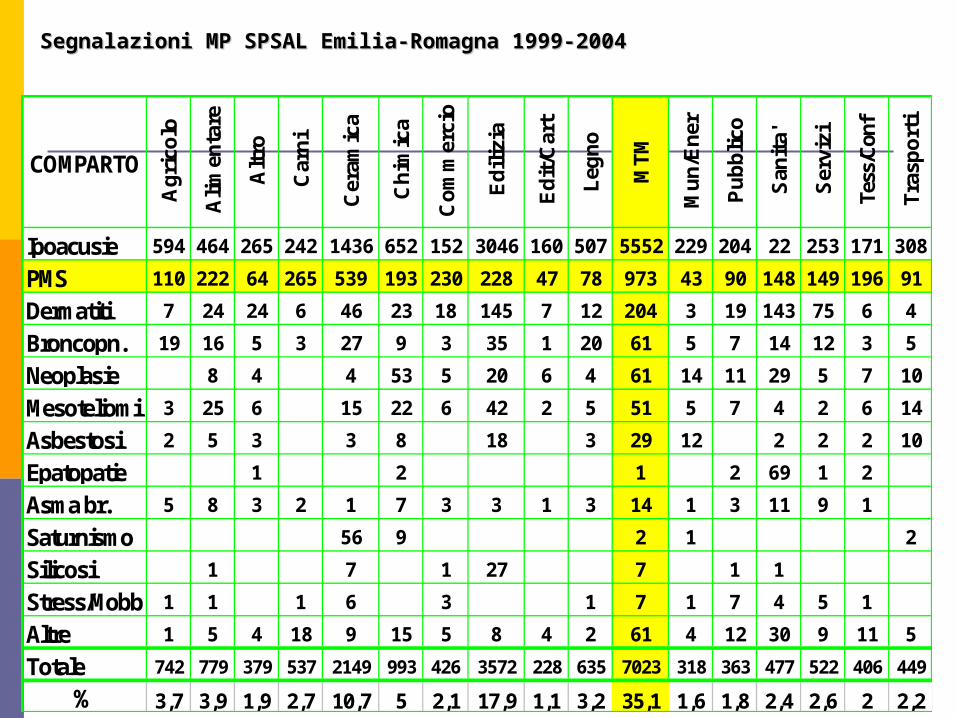
COMPARTOA
gri
colo
Ali
men
tare
Alt
ro
Car
ni
Cer
amic
a
Ch
imic
a
Co
mm
erci
o
Ed
iliz
ia
Ed
it/C
art
Leg
no
MT
M
Mu
n/E
ner
Pu
bb
lico
San
ita'
Ser
vizi
Tess
/Con
f
Tra
spo
rti
Ipoacusie 594 464 265 242 1436 652 152 3046 160 507 5552 229 204 22 253 171 308
PMS 110 222 64 265 539 193 230 228 47 78 973 43 90 148 149 196 91
Dermatiti 7 24 24 6 46 23 18 145 7 12 204 3 19 143 75 6 4
Broncopn. 19 16 5 3 27 9 3 35 1 20 61 5 7 14 12 3 5
Neoplasie 8 4 4 53 5 20 6 4 61 14 11 29 5 7 10
Mesoteliomi 3 25 6 15 22 6 42 2 5 51 5 7 4 2 6 14
Asbestosi 2 5 3 3 8 18 3 29 12 2 2 2 10
Epatopatie 1 2 1 2 69 1 2
Asma br. 5 8 3 2 1 7 3 3 1 3 14 1 3 11 9 1
Saturnismo 56 9 2 1 2
Silicosi 1 7 1 27 7 1 1
Stress/Mobb 1 1 1 6 3 1 7 1 7 4 5 1
Altre 1 5 4 18 9 15 5 8 4 2 61 4 12 30 9 11 5
Totale 742 779 379 537 2149 993 426 3572 228 635 7023 318 363 477 522 406 449
% 3,7 3,9 1,9 2,7 10,7 5 2,1 17,9 1,1 3,2 35,1 1,6 1,8 2,4 2,6 2 2,2
Segnalazioni MP SPSAL Emilia-Romagna 1999-2004Segnalazioni MP SPSAL Emilia-Romagna 1999-2004
Occupational Diseases
In 1981, Doll and Peto estimated that 4% of annual cancer deaths were caused by occupational exposures
Many countries have developed surveillance systems to correctly identify the origin of occupational diseases

Surveillance Systems (USA)
SENSOR (Sentinel Event Notification System for Occupational Risks)

Surveillance Systems (GB)
THOR (The Health and Occupational Reporting Network)
In the period 2003-2004, the Health and Safety Executive estimated that (prevalence data):
2.223.000 subjects were suffering from diseases whose causes could be traced to occupational factors
Occupational diseases were 5.200 per 100.000 workers
Deaths were 6.000/year and were caused by diseases due to occupational risk factors
HSE. Health and Safety Statistics Highlights 2003/2004. National Statistics, 2004.
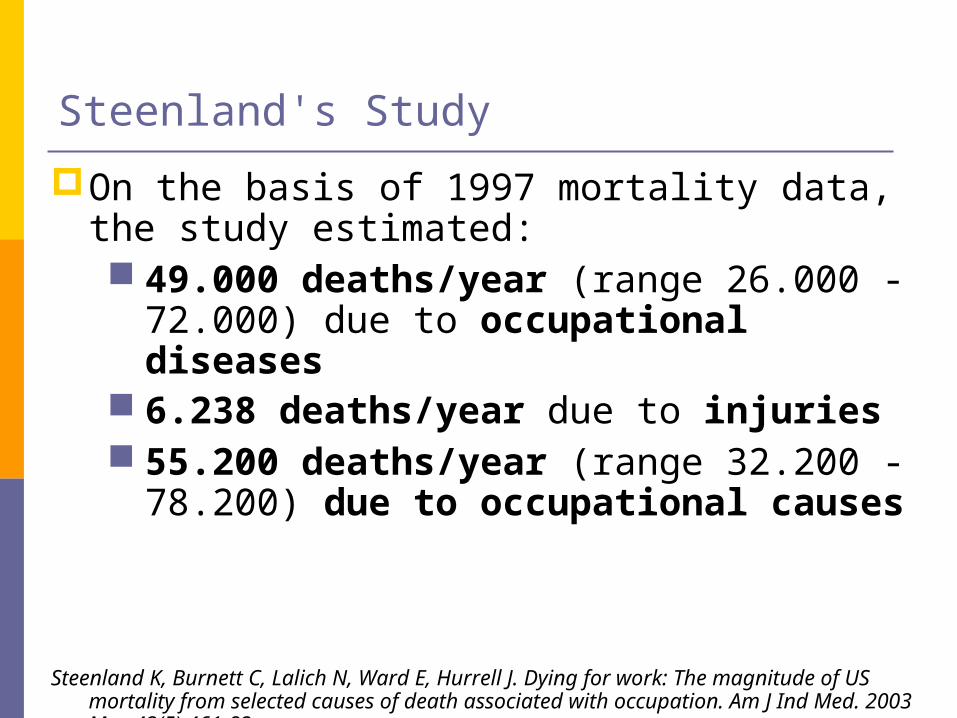
Steenland's Study
On the basis of 1997 mortality data, the study estimated: 49.000 deaths/year (range 26.000 -
72.000) due to occupational diseases 6.238 deaths/year due to injuries 55.200 deaths/year (range 32.200 -
78.200) due to occupational causes
Steenland K, Burnett C, Lalich N, Ward E, Hurrell J. Dying for work: The magnitude of US mortality from selected causes of death associated with occupation. Am J Ind Med. 2003 May;43(5):461-82.

Steenland's StudyThe number of death was evaluated
on the basis of 1997 mortality data of USA, calculating the attributable fraction

Attributable Fraction The attributable risk is the proportion of
cases attributable to a specific risk factor (work). Measure the decreasing incidence of the disease if the exposition at this particular risk is completely eliminated
The attributable risk in a population is the proportion of the risk difference between the general population and the non-exposed population, and the risk in the general population

Attributable Fraction
P(E) (RR-1)
––––––––––––––––––P(E) (RR-1) + 1
P(E) = fraction in the general population exposed to a particular risk factor
RR = disease or death relative risck in the exposed vs. non-exposed

Steenland's Study
attributable fraction (AF) of work-related mortality:
Pneumoconiosis (Asbestosis/Silicosis/Berylliosis)
AF 100% 1.087 deaths/year
Asthma AF 15% 784 deaths due to work-related asthma (range 575 -1.099)
COPD AF 14% 14.257 deaths (range 5.092 - 24.440)

Steenland's Study
Tubercolosis AF 5% 60 deaths
Coronary Heart Disease (CHD) AF 6,3-18% of subjects between 20 and 69
years of age range of deaths 4.500-12.900
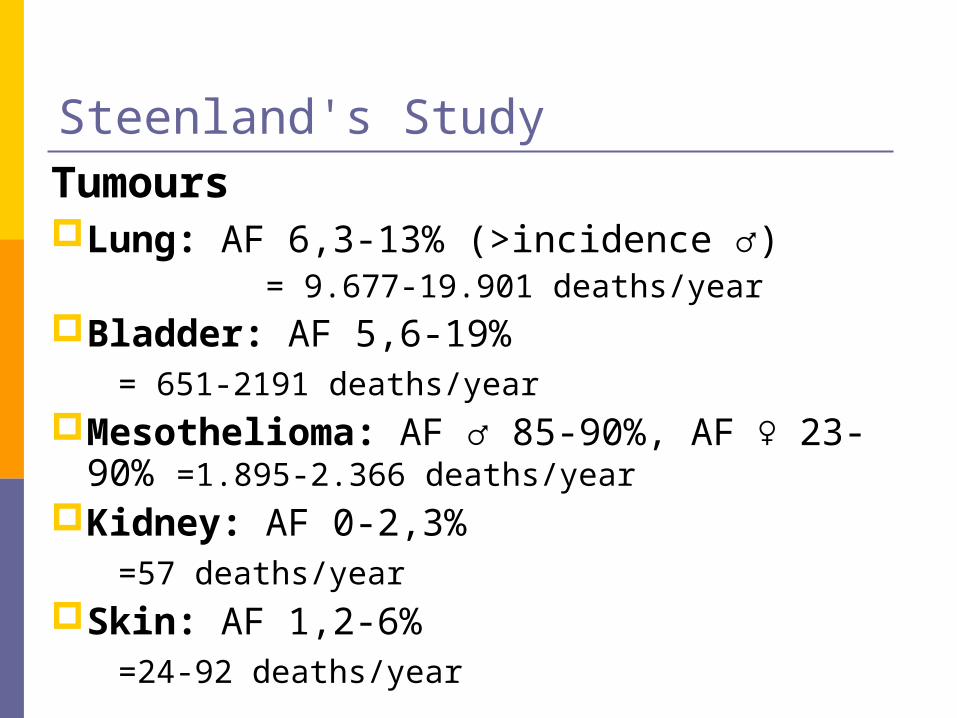
Steenland's StudyTumoursLung: AF 6,3-13% (>incidence ♂)
= 9.677-19.901 deaths/yearBladder: AF 5,6-19% = 651-2191 deaths/yearMesothelioma: AF ♂ 85-90%, AF ♀ 23-
90% =1.895-2.366 deaths/yearKidney: AF 0-2,3% =57 deaths/yearSkin: AF 1,2-6% =24-92 deaths/year

Steenland's Study
Leukemia: AF 0,8-2% = 152-533 deaths/year
Larynx: AF 1-20% = 30-603 deaths/year
Nose: AF 31-43% = 231-322 deaths/year
Liver: AF 0,4-0,11% = 29-80 deaths/year

Steenland's Study
The study shows the significance of work-related pathologies and deaths, both in terms of human lives and economic costs

A new metrics in the assessment of work-related damage
1996, WHO introduced a new operative unit devoted to the “Global Programme on Evidence for Health Policy” (GPE), with the aim of improving the planning and allocation of health resources
At the same time, the ”International Burden of Disease Network” (including the GPE, which gathers several countries) was launched. The aim was that of providing a rational basis for cost/effectiveness evaluation of health policies
Four criteria for the planning and allocation of health resources
Is this problem sufficiently important? (How many people does it affect; how many healthy years of life have been lost due to this problem?)
Do we have any effective tools to face this problem?
Do we have a good basic knowledge of the problem?
Are developed countries already making efforts in that direction?

Global Burden of Disease (GBD)
The burden of disease measures the gap between the current health status and an ideal situation where everyone lives into old age free of disease and disability
The unit of measurement of GBD is time. This allows to combine the time lived with disability and the time lost due to premature mortality
Health Measures
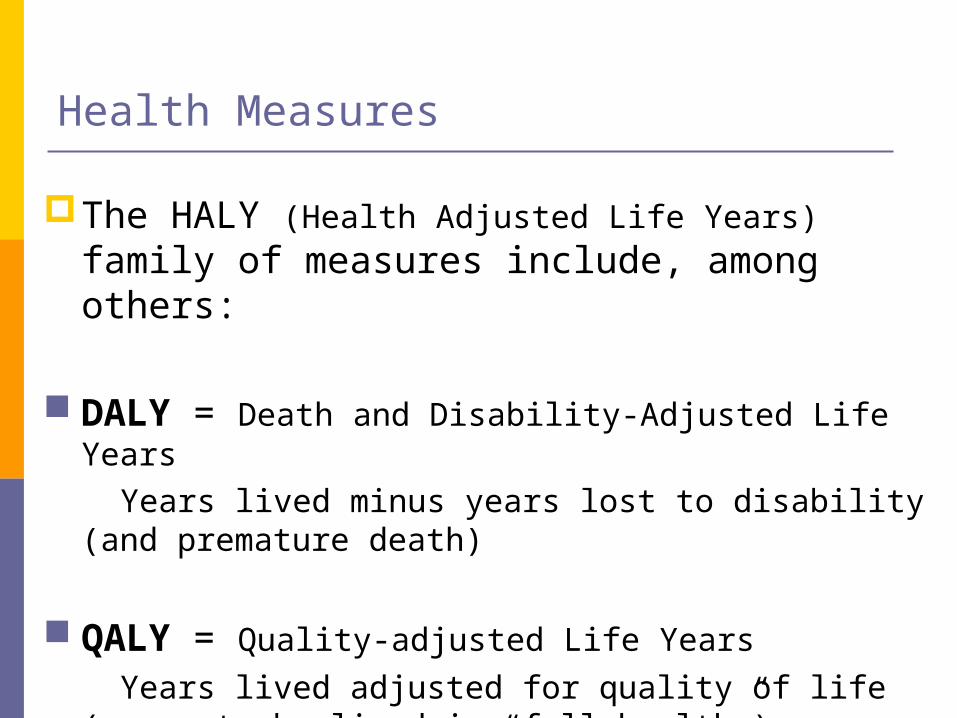
The HALY (Health Adjusted Life Years) family of measures include, among others:
DALY = Death and Disability-Adjusted Life Years
Years lived minus years lost to disability (and premature death)
QALY = Quality-adjusted Life Years Years lived adjusted for quality of life (years to be
lived in “full health”)

DALY The DALY is the unit of measurement adopted by
WHO to measure the Global Burden of Disease (i.e., the impact of a particular disease on health status)
This measure considers the impact (expressed in
years) on populations of: “early” mortality (mortality below a conventional
age, attainable by all individuals when risk variables are controlled)
Non-fatal consequences of pathologies and accidents
DALY
One DALY can be thought of as the measure, expressed in years, of healthy life lost due to a certain condition
↓disease load attributable to such
condition ↓measure of the impact of a specific
pathology on a population

Graphic representing the case of a subject dying the same age as the previous one, after progressive worsening
Graphic representing the case of a subject dying suddenly after a life in full health

The use of the DALY allows not only a geographic and temporal comparison, but also a comparison among risk factors
It also allows to compare the relative weight of a risk factor on different adverse health phenomena
DALY


Global Deaths (000s) due to Selected Occupational Exposures (2000)
Risk Factor Outcome Males Females Total % of occup
deaths
Agents leading to COPD COPD 240 78 318 37
Risk factors for injuriesUnintentional injuries
293 19 312 37
Beryllium, cadmium, chromium, diesel exhaust, nickel, arsenic, asbestos, silica
Trachea, bronchus, or lung cancer
88 14 102 12
Asbestos Mesothelioma 28 15 43 5
Asthmamagens Asthma 23 15 38 4
CoalCoal workers’ pneumoconiosis
14 14 2
Silica Silicosis 9 9 1
Asbestos Asbestosis 7 7 1
Benzene, ethylene oxide, ionizing radiation
Leukemia 4 3 7 1
Ergonomic stressors Low back pain 0 0 0 0
Noise Hearing loss 0 0 0 0
Total 706 144 850 100
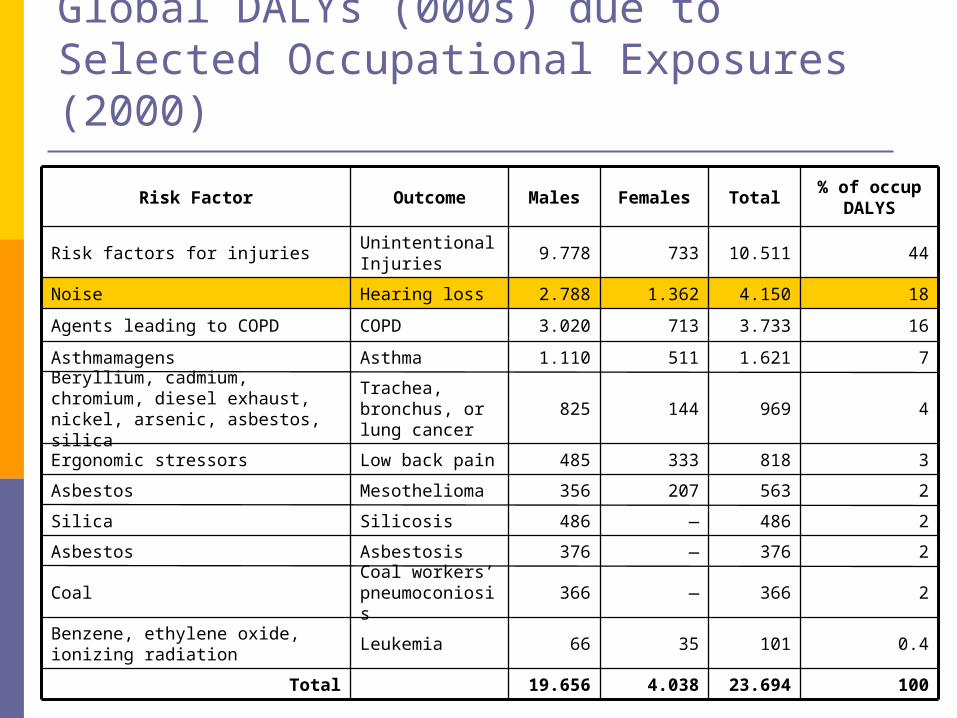
Global DALYs (000s) due to Selected Occupational Exposures (2000)
Risk Factor Outcome Males Females Total% of occup
DALYS
Risk factors for injuriesUnintentional Injuries
9.778 733 10.511 44
Noise Hearing loss 2.788 1.362 4.150 18
Agents leading to COPD COPD 3.020 713 3.733 16
Asthmamagens Asthma 1.110 511 1.621 7
Beryllium, cadmium, chromium, diesel exhaust, nickel, arsenic, asbestos, silica
Trachea, bronchus, or lung cancer
825 144 969 4
Ergonomic stressors Low back pain 485 333 818 3
Asbestos Mesothelioma 356 207 563 2
Silica Silicosis 486 ― 486 2
Asbestos Asbestosis 376 ― 376 2
CoalCoal workers’ pneumoconiosis
366 ― 366 2
Benzene, ethylene oxide, ionizing radiation
Leukemia 66 35 101 0.4
Total 19.656 4.038 23.694 100

Attributable Fractions (%) for Mortality and Morbidity (DALYs) due to Selected Occupational Exposures for the Global Burden of Occupational Disease and Injury
Risk Factor Outcome Males Females Total
Ergonomic stressors Low back pain 41 32 37
Noise Hearing loss 22 11 16
Agents leading to COPD COPD 18 6 13
Asthmagens Asthma 14 7 11
Risk factors for injuriesUnintentional Injuries
12 2 8
Beryllium, cadmium, chromium, diesel exhaust, nickel, arsenic, asbestos, silica
Trachea, bronchus, or lung cancer
10 5 9
Benzene, ethylene oxide, ionizing radiation
Leukemia 2 2 2

Average cost per worker for fatal and all nonfatal injuries and illnesses
Description of detailed industry
Average cost
per worker (USD)
Contribution to GDP per employed worker
(%)
Taxicabs 11.528 21,16
Bituminous coal and lignite mining
8.600 15,78
Logging 7.009 12,86
Crushed and broken stone
4.024 7,38
Oil and gas field services
3.938 7,23
Water transportation services
3.551 6,52
SIC = 1987 standard industrial classification, USD = United States Dollars, GDP = gross domestic product

Total cost for fatal and all nonfatal injuries and illnesses
SIC = 1987 standard industrial classification, USD = United States Dollars, GDP = gross domestic product
Description of detailed industry
Total cost (USD) GDP (%)
Trucking and courier services, except air
4.394.408.812 0,0672
Eating and drinking places
3.245.844.489 0,0495
Hospitals 2.755.633.582 0,0421
Grocery stores 2.718.377.125 0,0414
Nursing and personal care facilities
1.943.638.220 0,0297
Motor vehicles and motor vehicle equipment
1.344.070.300 0,0205

Average cost ranking of industries with the lowest costs per worker
SIC = 1987 standard industrial classification, USD = United States Dollars, GDP = gross domestic product
Description codeCosts
per worker (USD)GDP per employed
worker (%)
Labor union offices 86 0,16
Security and commodity exchanges
101 0,19
Mortgage bankers and brokers
136 0,25
Security brokers and dealers 137 0,25
Legal services 138 0,25
Passenger transportation arrangements
140 0,26

Classification of Risk Factors

Physical, Chemical and Biological agents, biomechanical and
relational factors
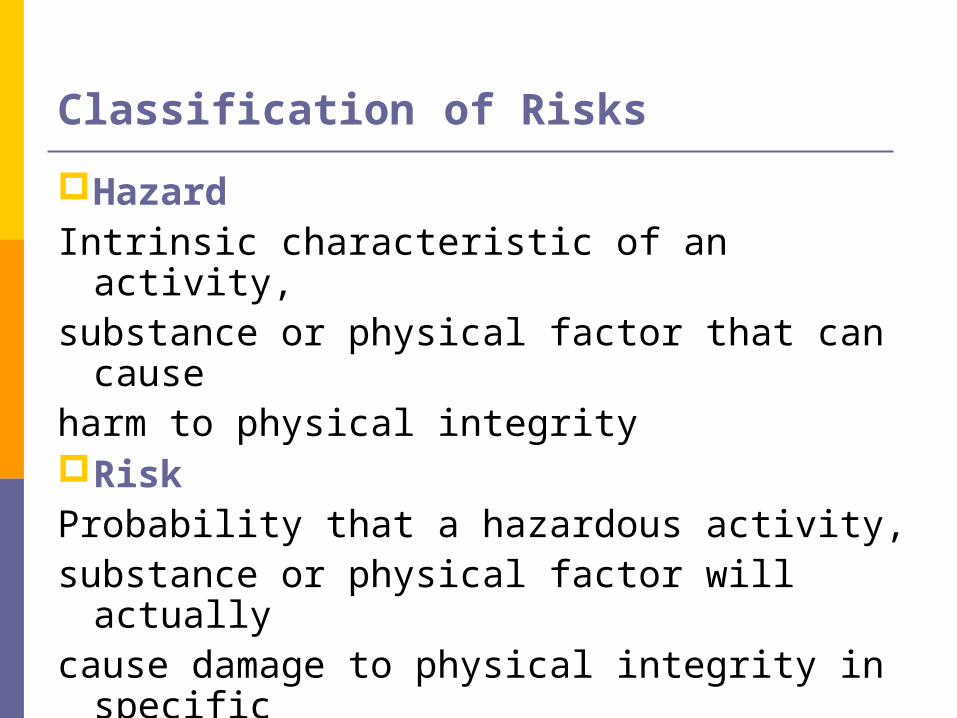
Classification of Risks
HazardIntrinsic characteristic of an activity,substance or physical factor that can cause harm to physical integrityRiskProbability that a hazardous activity,substance or physical factor will actuallycause damage to physical integrity in specificwork situations

Safety risks can be classified as risks deriving from:
Structural deficiencies of the working environment
Safety deficiencies regarding machines and equipment
Handling of hazardous substances Deficiencies in electrical safety Fire and/or explosion
Classification of Risks

Classification of Risks
Safety risks can be classified as risks deriving from:
Physical agents Chemical agents Biological agents Biomechanical factors Relational factors
120
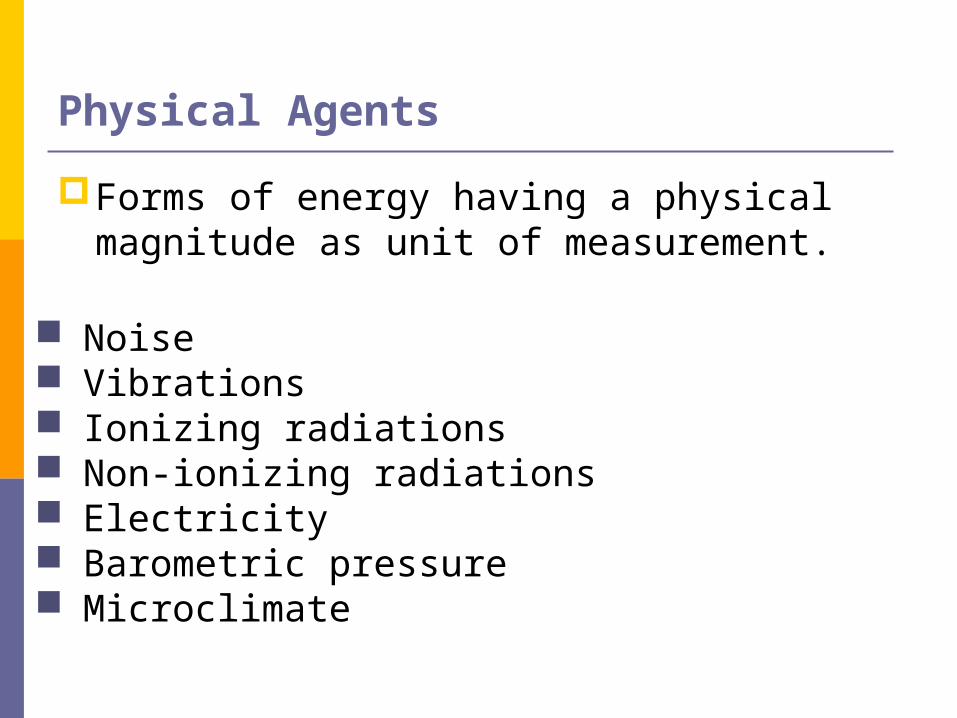
Physical Agents
Forms of energy having a physical magnitude as unit of measurement.
Noise Vibrations Ionizing radiations Non-ionizing radiations Electricity Barometric pressure Microclimate

Noise
A series of pressure variances propagating through a medium, that can be perceived by the human ear as sound sensation
Occupational Exposure Building sector, Agriculture, Steel Industry,
etc.

Vibrations
Oscillations of a body around a reference point characterised by: frequency, amplitude and acceleration
Whole-body Vibration
(tractor drivers, lorry drivers, bus drivers, train and underground drivers, crane operators)
Hand-arm Vibration
(workers using compressed air or electrically powered vibrating tools; e.g. construction workers,
lumberjacks)

Ionizing Radiations
Radiations which interact with the matter giving rise to ionization phenomena
Corpuscular radiations
(alpha rays, beta rays, neutrons)
Non-corpuscular radiations
(X rays, gamma rays)

Ionizing Radiations
Occupational Exposure Medical applications
(diagnostic radiology, use of radioactive isotopes, radiotherapy)
Industrial applications
(extraction, production, transformation,
treatment, transportation) Research laboratories

Non-Ionizing Radiations
Radiations that do not carry enough energy to modify atoms and molecules; they form a part of the electromagnetic spectrum and are characterized by several frequency subintervals
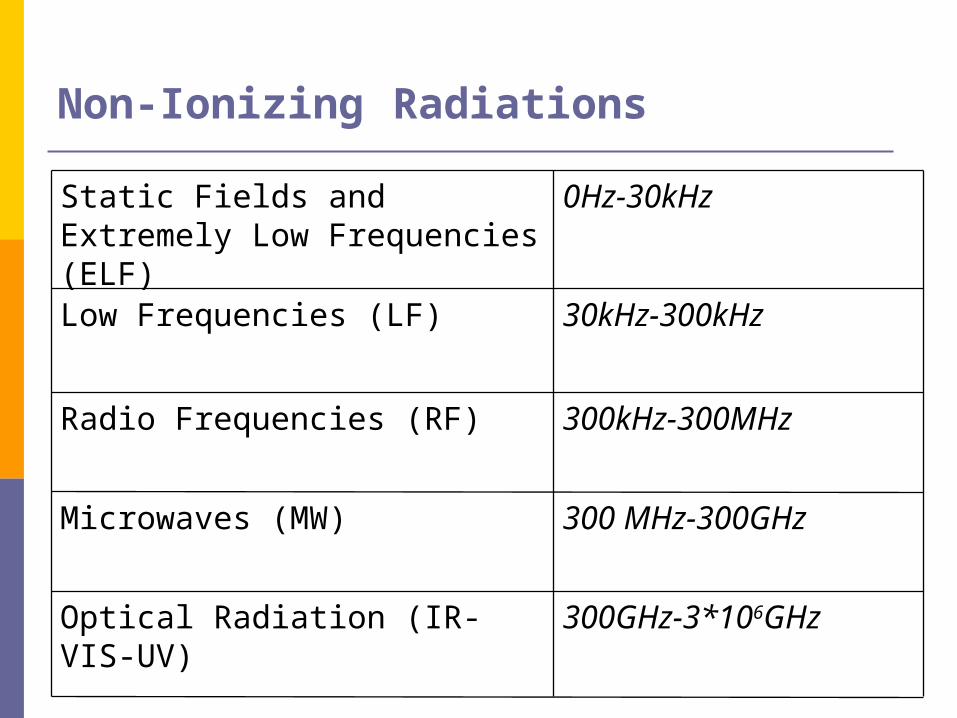
Static Fields and Extremely Low Frequencies (ELF)
0Hz-30kHz
Low Frequencies (LF) 30kHz-300kHz
Radio Frequencies (RF) 300kHz-300MHz
Microwaves (MW) 300 MHz-300GHz
Optical Radiation (IR-VIS-UV) 300GHz-3*106GHz
Non-Ionizing Radiations
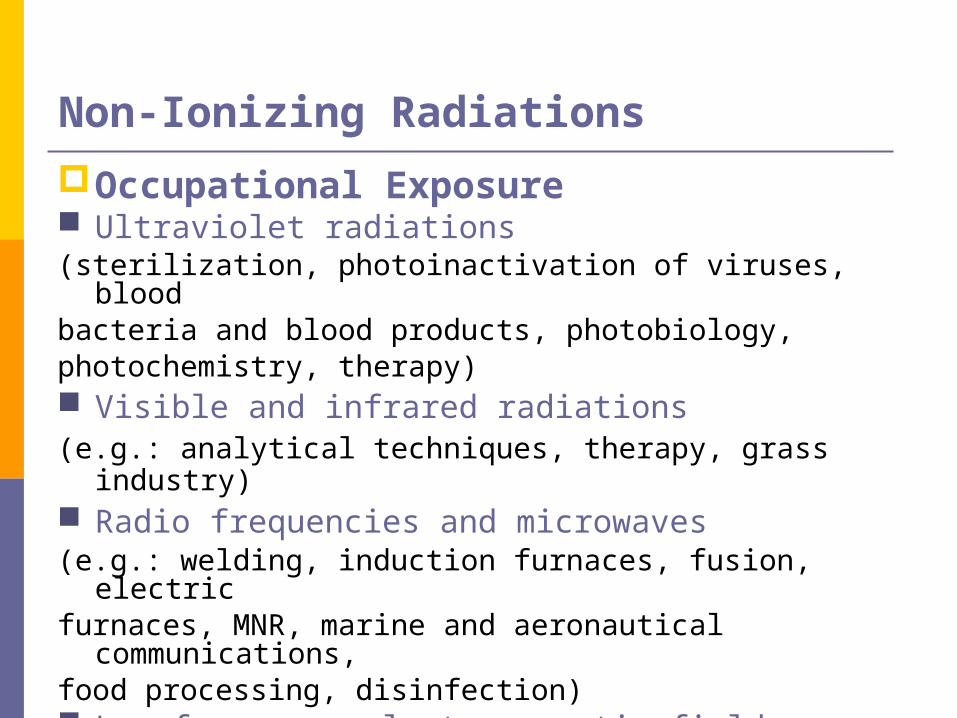
Non-Ionizing Radiations
Occupational Exposure Ultraviolet radiations(sterilization, photoinactivation of viruses, blood bacteria and blood products, photobiology,photochemistry, therapy) Visible and infrared radiations(e.g.: analytical techniques, therapy, grass industry) Radio frequencies and microwaves(e.g.: welding, induction furnaces, fusion, electricfurnaces, MNR, marine and aeronautical communications, food processing, disinfection) Low-frequency electromagnetic fields or static
magnetic fields(e.g.: electrical equipment in general)

ElectricityOccupational ExposureElectricians, electrotechnicians
Barometric PressureOccupational ExposureHigh-altitude jobs, underwater jobs.
MicroclimateThermal stress due to high or low temperatures
Occupational Exposuree.g.:outdoor activities, food industry,
iron and steel industry, etc.
Chemical Agents
Any chemical substance used (or already present) alone or in combination in a productive process
(e.g.: solvents, metals, pesticides, resins, etc.)
Dusts Fogs Gases Vapours

Exposure Modes and Absorption Pathways
Respiratory pathway Cutaneous pathway (via skin contact) By ingestion
Occupational Exposure
Several divisions in the agriculture, industry
and service sectors
Chemical Agents
Biological Agents
Risks associated with exposure to pathogenic organisms and microorganisms
Viruses Bacteria Fungi or mycetes Protozoa Parasites
Biological Agents
Occupational ExposuresHealth personnel and clinical and researchlaboratory personnel, farmers, breeders,slaughterhouse operators, waste collectionand disposal personnel

Biological Agents
Transmission Modes
Parenteral pathway(e.g.: hepatitis B,C, HIV)
Aerial pathway(e.g.:TBC, influenza, meningococcal meningitis,
measles)
Transmission by contact(e.g.: scabies)
Transmission by the oral route(e.g.: hepatitis A)
Biomechanical Factors
Forces applied to the body (or generated by the body itself) acting on muscles, tendons, peripheral nerves and blood vessels
Forces applied to the body Repetitive movements Posture Manual handling of loads

Biomechanical Factors
Occupational Exposure
Assembly-line operators, manufacturing
operators, data-entry operators, assistance
to patients, storekeepers, porters,
construction workers, etc.

Forces Applied to the Body
External Forces
Load exerted on the body surface when
performing a task (pushing or grabbing an
object to lift it)
Internal Forces
Tension originating in muscular, tendinous, or
ligamentous structures when making an effort

Repetitive Movements
Identical or very similar movements performed at a high frequency
Posture
Static Postures
Static and prolonged postures
Awkward Postures
Body joints deviate from their optimal area,
which allows effort exertion with minimum
tissue overload

Manual Handling of Loads
Transportation and support operations including:
Lifting Depositing Pushing Pulling Carrying Moving a load
which involve the risk of dorsolumbarinjuries

Relational factors
Factors regarding work organization and social relations, which can affect the psychological and physical health of workers
Worker/occupation relationship (stress, burn out)
Relationships between individuals within the working environment (mobbing)

Relational Factors
Worker/occupation relationshipWork contents:
Task characteristics(lack of variety, short work cycles, no use or under-use of skills, high uncertainty)
Workload, work pacing, work schedule(work overload or underload, lack of control overpacing, time pressure, shift work, lack of scheduleflexibility, overtime work)

Relational factors
Relationships between individuals within the working environment
Working context:
Culture and organizational function, role in the organization, career development, work/family interface, authoritarianism, mobbing, sexual harassment.


