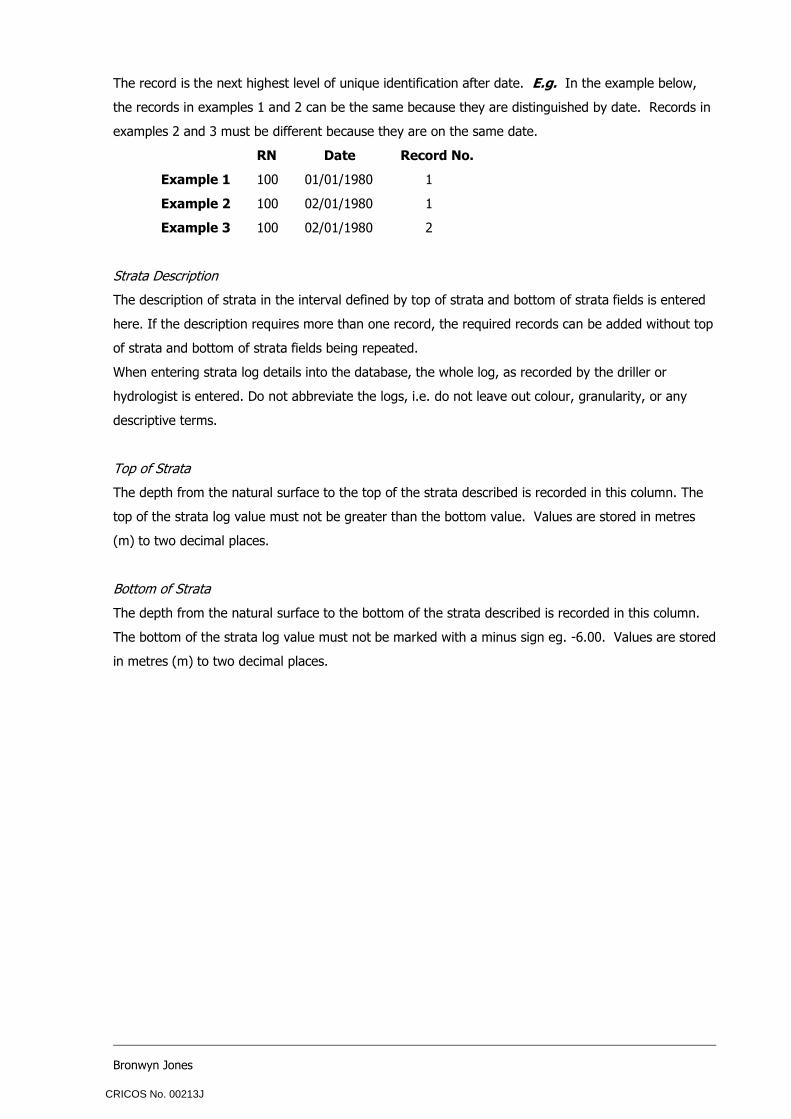
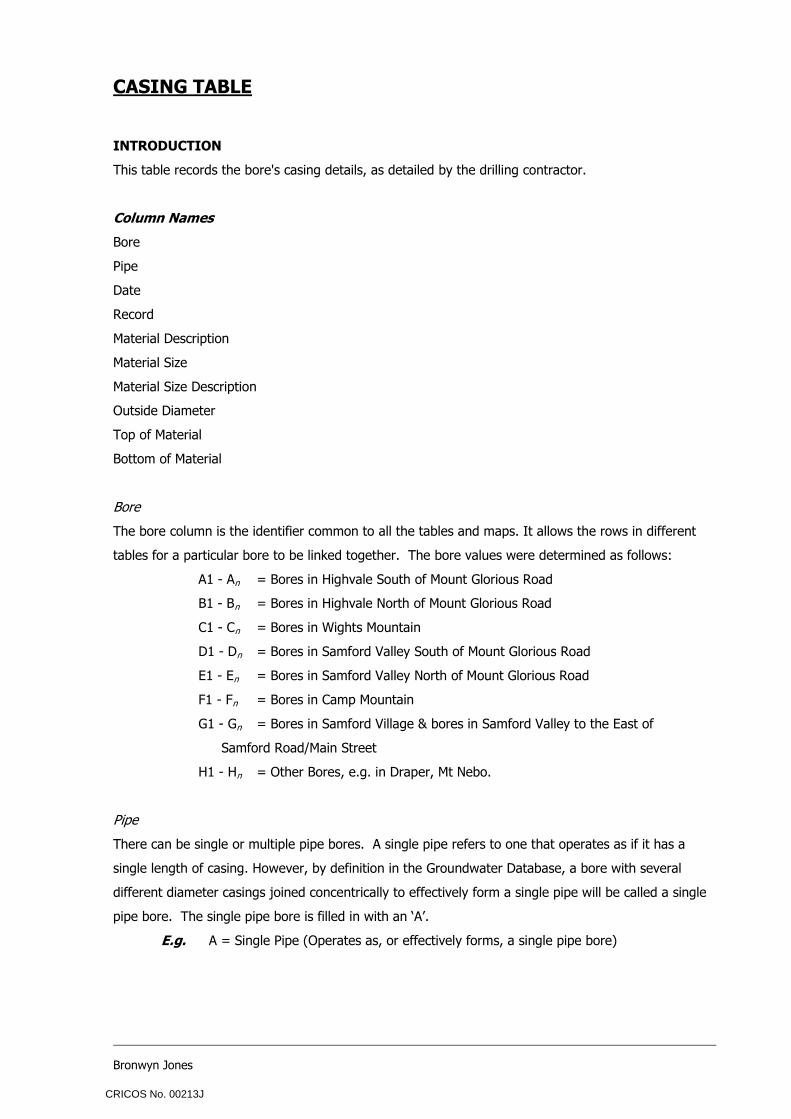
Bronwyn Jones Queensland University of Technology School of Natural Resource Sciences OCCURRENCE AND CHEMICAL CHARACTER OF GROUNDWATER WITHIN SAMFORD VALLEY, SOUTHEAST QUEENSLAND by Bronwyn Ursula Patricia Jones B.App.Sc.Dist.(QUT) 2007 SUPERVISOR Associate Professor Malcolm E. Cox Queensland University of Technology A thesis submitted in partial fulfilment of the requirements for the degree of Bachelor of Applied Science (Honours) at the Queensland University of Technology. Further reproduction prohibited without permission from the author. CRICOS No. 00213J
Transcript
Bronwyn Jones
Queensland University of Technology
School of Natural Resource Sciences
OCCURRENCE AND CHEMICAL CHARACTER OF
GROUNDWATER WITHIN SAMFORD VALLEY,
SOUTHEAST QUEENSLAND
by
Bronwyn Ursula Patricia Jones
B.App.Sc.Dist.(QUT)
2007
SUPERVISOR
Associate Professor Malcolm E. Cox
Queensland University of Technology
A thesis submitted in partial fulfilment of the requirements for the degree of Bachelor of
Applied Science (Honours) at the Queensland University of Technology. Further reproduction
prohibited without permission from the author.
CRICOS No. 00213J
Bronwyn Jones
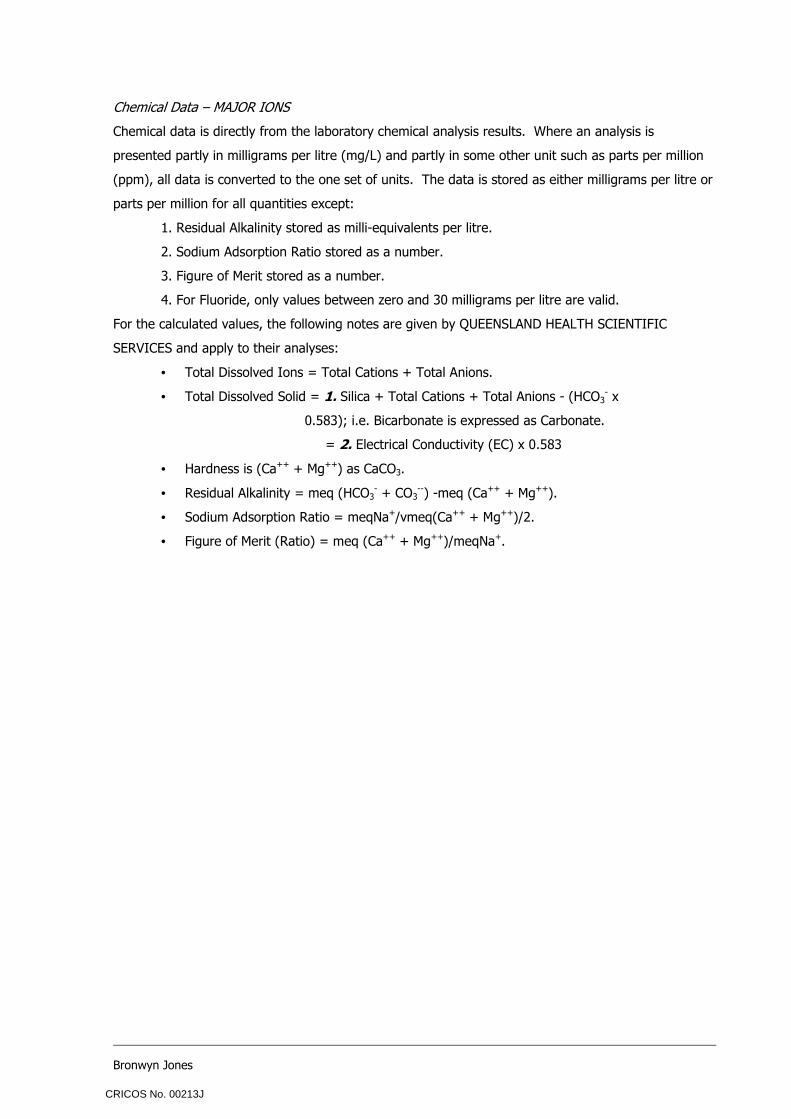
ABSTRACT
Samford Valley, southeast Queensland, is a granitic catchment essentially formed
from a granodiorite intrusion of Middle Triassic age that has been weathered and
differentially eroded. The weathered and fractured granitic rocks of the valley floor have
formed aquifers that contain an important water supply for the area; however, there has
never been a comprehensive groundwater study to assess the quality, occurrence,
productivity or potential of the groundwater resources of the valley. This current study was
carried out to determine the occurrence and chemical character of the groundwater within the
valley and the hydrogeological controls on it. Field measurements and a water sample were
taken from existing groundwater bores; an experienced drilling contractor with extensive local
knowledge provided drilling records with bore yields and stratigraphic data.
Hydrochemical analyses and electrical conductivity measurements indicate that
groundwater quality is fresh and potable towards the margins of the valley and that there is a
central brackish-saline zone. Maps and graphs generated from the software programs
SURFER and AquaChem have also revealed that groundwater central to the valley is mature
and more evolved than around the edges, as evidenced by Na-Cl type groundwater, more
total dissolved solids, elevated pH, and higher Cl–/HCO3– ratios. Furthermore, shallow
permeability and bore yields are highest around the valley edges and lowest in the central
zone, however the thickest weathered zone is in the centre of the valley.
The results suggested that the fresh groundwater around the edges of the valley is
from recharging rainwater that has filled fracture systems and is extracted early in its
migration. The more saline groundwater in the central zone is from the accumulation of salts
as the groundwater evolved. These salts are products of rock-water interactions and ion
exchanges within the deeply weathered granodioritic aquifers as the groundwater flowed
from the higher-elevation recharge areas at the edges of the valley to the low lying discharge
area. Low precipitation and high evaporation conditions have also enhanced salinity over
time. The prolonged in situ weathering history of the granodiorite and the formation of clays
as remnant material have reduced shallow permeability and yields in the centre of the valley;
however, networks of connected fractures draining porous weathered rocks have contributed
to the high permeability and bore yields around the northern and southern edges of Samford
Valley.
KEY WORDS
Samford Valley · Southeast Queensland · Groundwater occurrence · Chemical character ·
Topographic map of Samford Valley (metres above sea level) 145
Mapped location of groundwater bores in Samford Valley 146
Electrical conductivity of groundwater, Samford Valley 147
DEM topographic map with surface drainage systems 148
Generalised distribution of shallow permeability, Samford Valley 149
Photographs looking NE across the valley from Jolly’s Lookout 150
CRICOS No. 00213J
Bronwyn Jones
STATEMENT OF ORIGINAL WORK
The work contained within this thesis has not been submitted for a degree or diploma
at any other higher education institution. To the best of my knowledge and belief, this thesis
contains no material previously published or written by another person except where due
reference is made.
Signed ……………………………………………….
Date ...………………………………………………..
CRICOS No. 00213J
Bronwyn Jones
ACKNOWLEDGMENTS
A special thank-you is expressed towards Associate Professor Malcolm Cox for his
supervision, helpful comments and guidance throughout the year. They were greatly
appreciated.
I acknowledge Wathsala Kumar for her assistance with laboratory work, Dr Micaela
Preda for her assistance with DEM data and maps, and to NRS PhD student Qing Wang for
providing me with some of her data.
I have appreciated the Honours scholarship, jointly funded by the QUT Institute for
Sustainable Resources (ISR) and QUT School of Natural Resource Sciences (NRS) and I
thank Professor Peter Grace and Associate Professor Mal Cox for this support. I also thank
Peter Loose and Dr Rainer Hasse of Pine Rivers Shire Council for information and DEM
contour data, and the Department of Natural Resources and Water (NRW) for use of the
groundwater database.
Thanks is given to drilling contractor Mr Neville Scells and his colleague Glen from
S. H. Scells Water Well Drilling Business for sharing their knowledge of the area, access to
well-organised logbooks, and the invitations to observe them drill groundwater bores. I also
gratefully thank Mr Geoff Ward for sharing his general and groundwater knowledge of the
area. Finally, I thank the many friendly and helpful landholders of Samford Valley for
providing me with access to their private bores.
CRICOS No. 00213J
Bronwyn Jones
INTRODUCTION
Weathered and fractured zones of granitic rocks can form aquifers which, in many
parts of the world, contain important groundwater resources locally, particularly for rural
populations. Samford Valley is an area where such groundwater is important as two-thirds of
the valley is not connected to townwater and on-going dry conditions have reduced rainwater
tank supplies. The valley has formed from the differential weathering of a granodiorite
intrusion and the weathered and fractured granitic rocks contain the important water supply
for the area. The potential of the aquifer system to supply groundwater is governed by such
factors as the distribution of permeability, the quality of the water, and the depth to the
watertable. However, despite the fact that domestic bores have been drilled in the valley for
over 60 years, there has not been a previous comprehensive groundwater study to
determine the occurrence and chemical character of the groundwater resource in Samford
Valley.
An overall understanding of the groundwater movements throughout the valley was
required to assess the potential groundwater resource. A map and conceptual model of the
watertable have been developed to explain the groundwater flow, and a bore yield map was
used to determine the generalised spatial distribution of shallow permeability.
It was also essential to ascertain the evolution of the chemical character of the
groundwater and the water quality variations throughout the valley. These parameters have
been determined by the collection and analysis of groundwater samples from different
aquifer materials throughout the whole valley, and by the production of a salinity distribution
map. In addition, the comprehensive compilation of groundwater and bore data has enabled
the production of a groundwater bore inventory that will be a useful record or reference to
support future management of this valuable local resource.
Aim
The overall aim of this study was to determine the occurrence and chemical character
of groundwater within Samford Valley and the hydrogeological controls on it.
Objectives
To achieve the aim, the objectives were to:
• Compile a comprehensive groundwater bore inventory for Samford Valley as a useful
record or reference for future studies and management of the resource.
CRICOS No. 00213J
Bronwyn Jones
• Investigate the chemical variations of the groundwater by analysing for chemical ions
in groundwater samples collected from existing bores throughout Samford Valley.
This also involved physico-chemical measurements such as electrical conductivity
(EC) and pH.
• Examine the groundwater resource potential and controls on the occurrence and
movement of groundwater by establishing the depth to groundwater within different
aquifers and their water-bearing characteristics (e.g. bore yields).
• Determine the distribution of salinity and shallow permeability to produce groundwater
resource maps for the valley.
• Determine the groundwater flow direction and link between groundwater and surface
waters (i.e. South Pine River) by the development of a watertable contour map and
flow net for the valley.
Significance
There has not been a previous comprehensive study of the hydrogeology or
groundwater of the valley. Thus, this study is significant in that it provides an understanding
of how groundwater occurs within this weathered granodioritic catchment. The study also
provides some understanding of groundwater/surface water interactions in Samford Valley
and the chemical variations of the groundwater throughout the whole valley. In addition,
useful information, with respect to resource management and land use, can be gained from
the comprehensive groundwater bore inventory and maps.
CRICOS No. 00213J
Bronwyn Jones
BACKGROUND
Description of Location
The groundwater study was conducted in Samford Valley, in the Pine Rivers Shire,
~20 km northwest of Brisbane, southeast Queensland (Figure 1a, b). Samford Valley
occupies an area of approximately 50 km2 and encompasses the localities of Camp
Mountain, Highvale, Wights Mountain, Samford Village and Samford (Figure 2). It is
surrounded by a prominent “horseshoe” of mountains to the north, west and south (Figure
1b). To the south and west are the Brisbane Forest Park and D’Aguilar Ranges including
Mount Nebo and Jolly’s Lookout. To the north is the House Mountain Range and Mount
O’Reilly. Thus, the boundary for the study area was clearly defined on three sides, and the
eastern limit was taken as the elevated area immediately east of Samford Village.
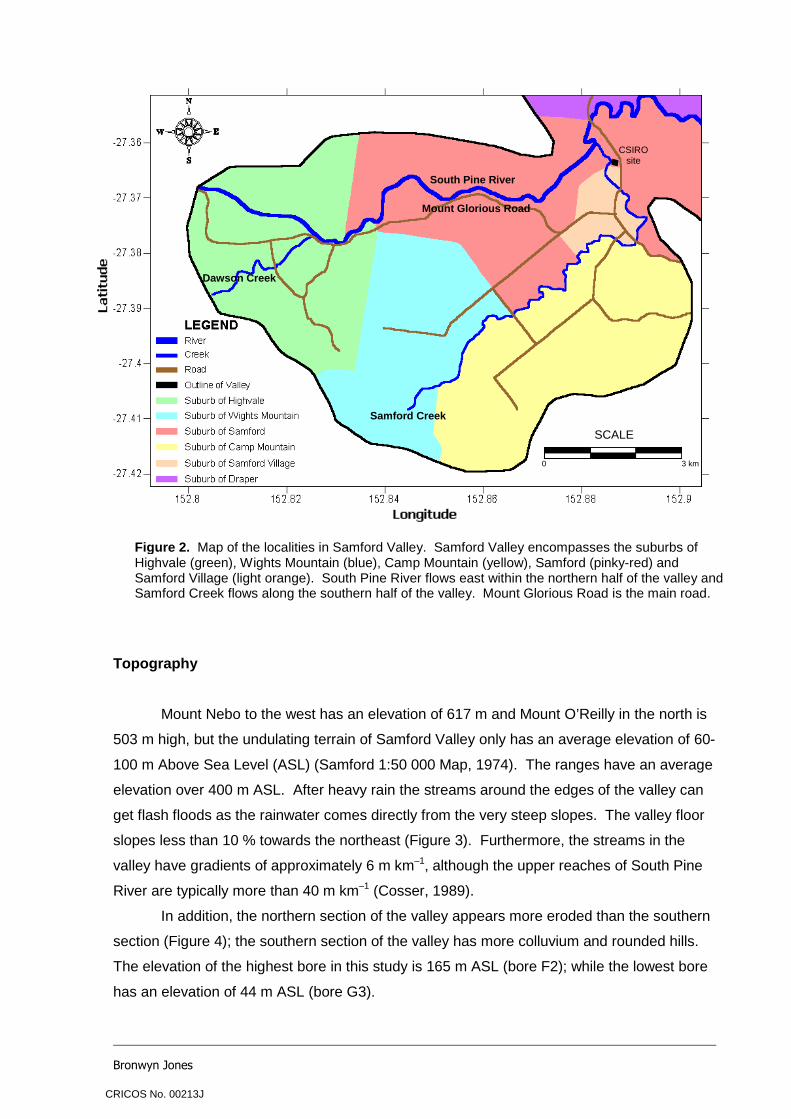
South Pine River forms the main drainage system. It enters the valley in the west
(just north of Mount Nebo) and flows east within the northern half of the valley, while Samford
Creek flows along the southern half of the valley (Figure 2). The valley has a dendritic
drainage pattern and the rivers have incised into the granodiorite, depositing very limited
amounts of floodplain alluvium. The streams and creeks have an ephemeral flow and during
dry periods of the year flow usually ceases over much of their length. This is especially the
case under the current dry conditions and with continued extraction of groundwater. At
present, the water quality of Samford Creek and South Pine River are “satisfactory to poor”
and degraded with nutrients and coliform bacteria (Nolte and Loose, 2004). Locals have also
observed that there is a tendency to get saline borewater near Samford Village. Many
residents near the village have therefore followed “conventional wisdom” and have not had a
bore drilled because of the known elevated salinity.
CRICOS No. 00213J
Bronwyn Jones
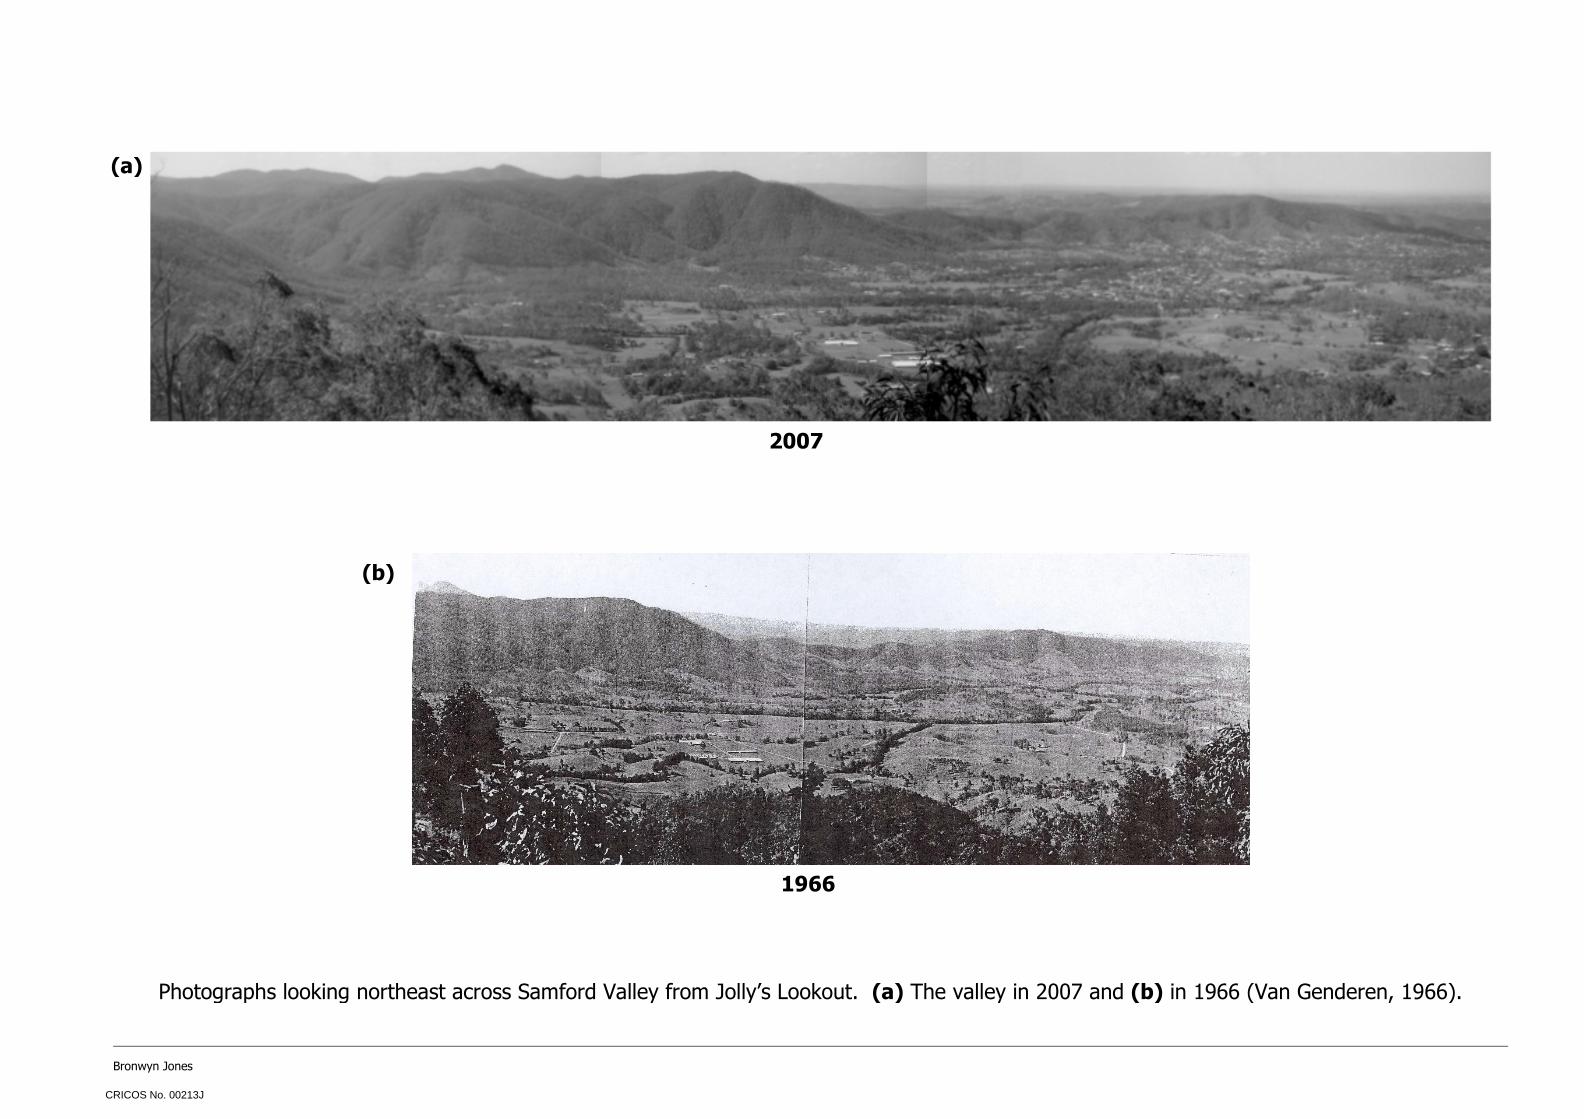
Figure 1. Location map of Samford Valley. (a) Regional setting of Samford Valley in southeast Queensland. (b) Ortho-photo map of Samford Valley. The valley occupies an area of ~50 km2, and is surrounded by mountains to the north, west and south. The ortho-photo image is from aerial photographs flown in March 2002 and was produced by the Department of Natural Resources and Water, 2007 (an A3-size ortho-photo map is in the Appendix).
(a)
(b)
CRICOS No. 00213J
Bronwyn Jones
Topography
Mount Nebo to the west has an elevation of 617 m and Mount O’Reilly in the north is
503 m high, but the undulating terrain of Samford Valley only has an average elevation of 60-
100 m Above Sea Level (ASL) (Samford 1:50 000 Map, 1974). The ranges have an average
elevation over 400 m ASL. After heavy rain the streams around the edges of the valley can
get flash floods as the rainwater comes directly from the very steep slopes. The valley floor
slopes less than 10 % towards the northeast (Figure 3). Furthermore, the streams in the
valley have gradients of approximately 6 m km–1, although the upper reaches of South Pine
River are typically more than 40 m km–1 (Cosser, 1989).
In addition, the northern section of the valley appears more eroded than the southern
section (Figure 4); the southern section of the valley has more colluvium and rounded hills.
The elevation of the highest bore in this study is 165 m ASL (bore F2); while the lowest bore
has an elevation of 44 m ASL (bore G3).
South Pine River
Samford Creek
Dawson Creek
Mount Glorious Road
CSIRO site
0 3 km
SCALE
Figure 2. Map of the localities in Samford Valley. Samford Valley encompasses the suburbs of Highvale (green), Wights Mountain (blue), Camp Mountain (yellow), Samford (pinky-red) and Samford Village (light orange). South Pine River flows east within the northern half of the valley and Samford Creek flows along the southern half of the valley. Mount Glorious Road is the main road.
CRICOS No. 00213J
Bronwyn Jones
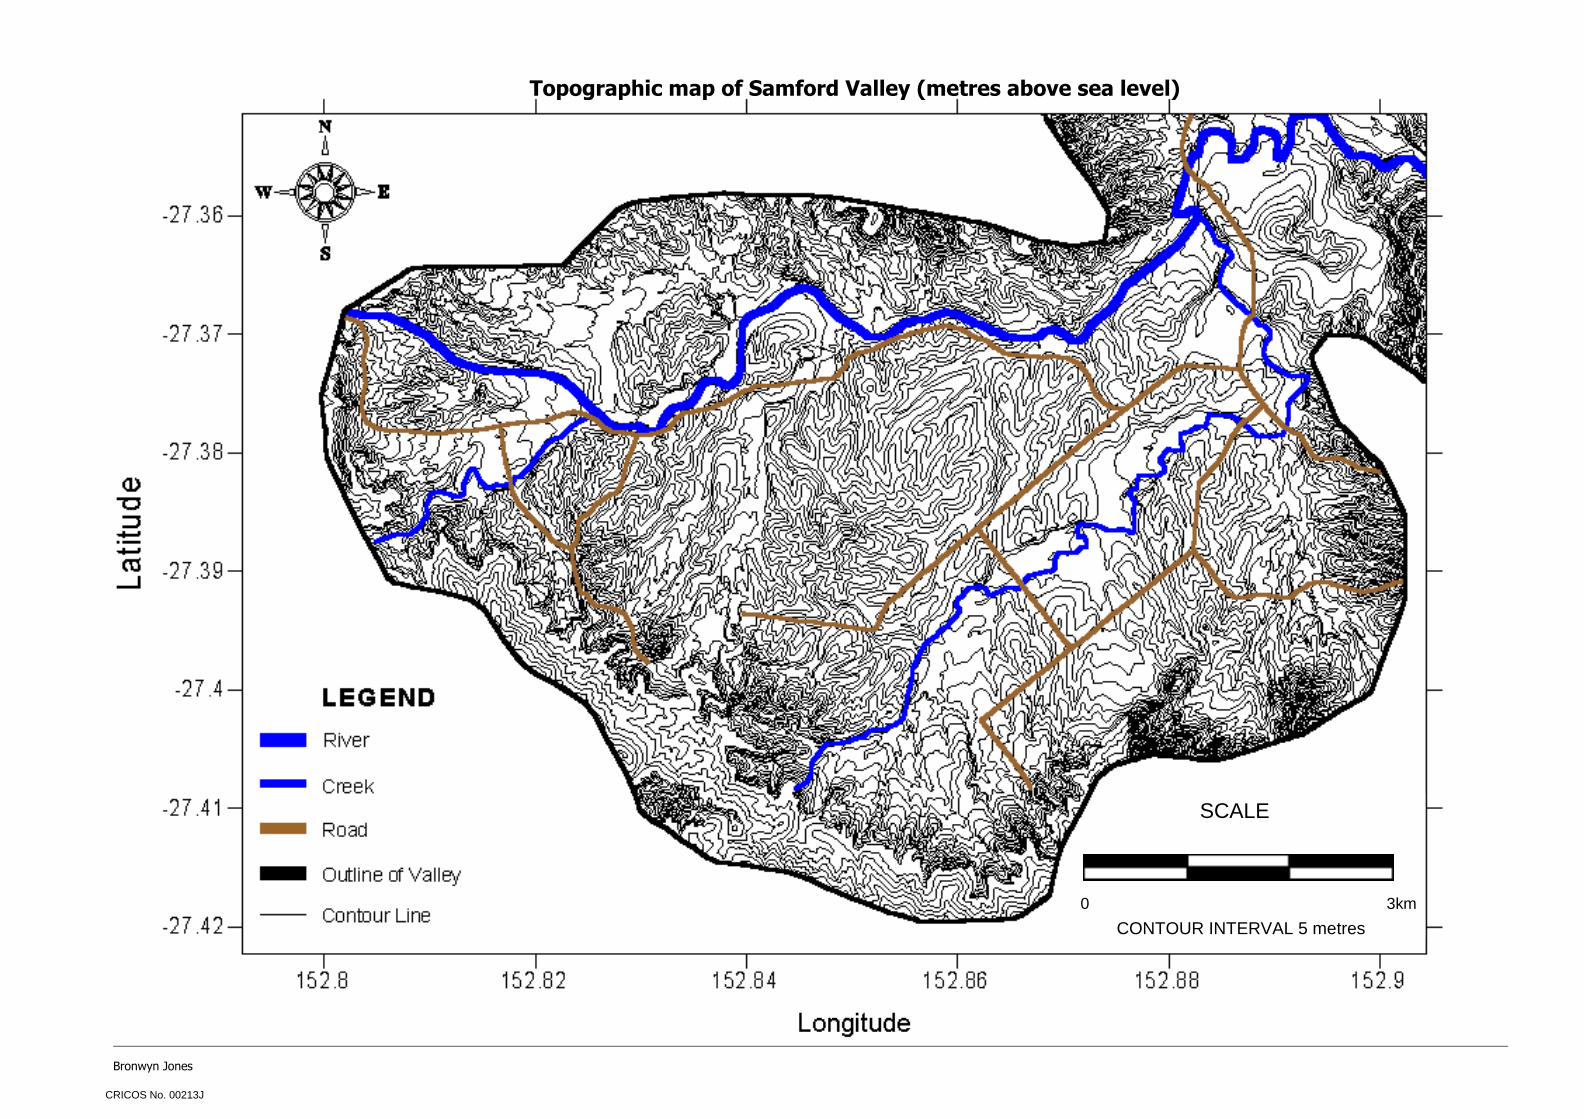
Figure 3. Topographic map of Samford Valley. Samford Valley has an undulating terrain with an average elevation of 60 – 100 m ASL. The gradient of the valley floor is less than 10 % towards the northeast. The red line is the location of the topographic profile for Figure 4. The contour data is from Pine Rivers Shire Council (an A3-size topographic map is in the Appendix).
Figure 4. Topographic profile of Samford Valley from north to south (A – A’ [Figure 3]). The northern section of the valley is more eroded than the southern half. Note: vertical exaggeration of ×10.
A
A’
A A’
0 3km
SCALE
South Pine River Samford Creek
CONTOUR INTERVAL 5 metres
CRICOS No. 00213J
Bronwyn Jones
Rainfall
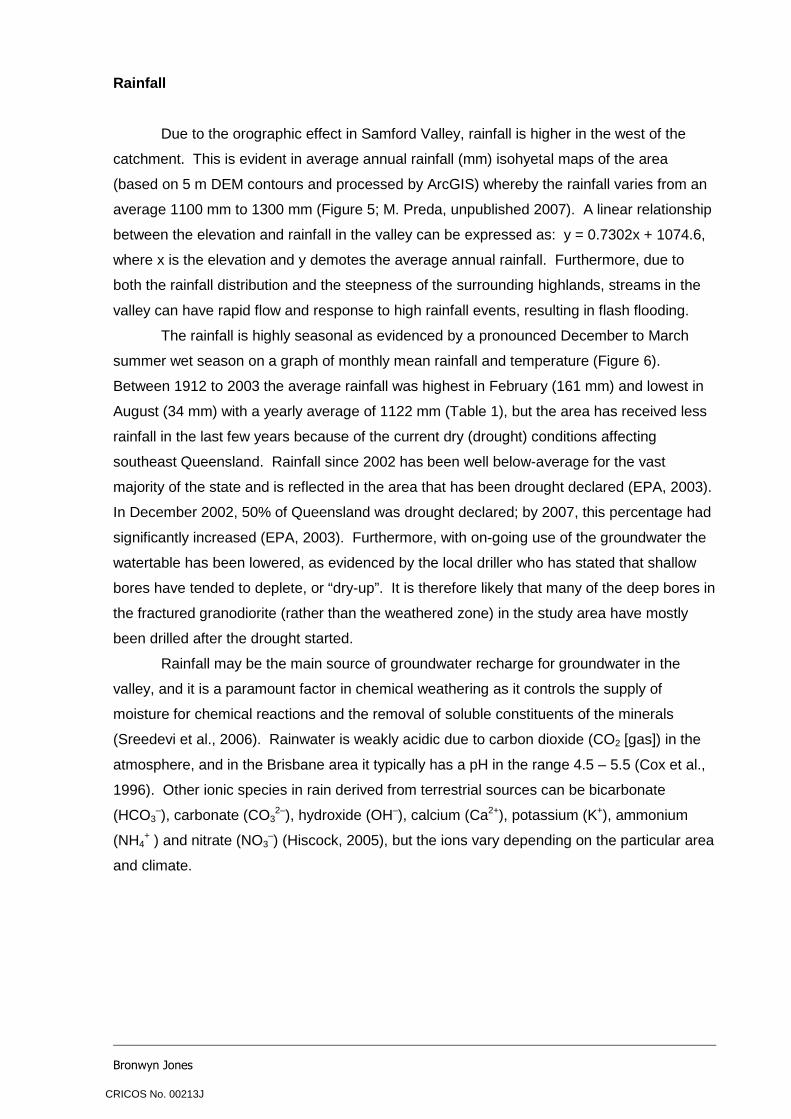
Due to the orographic effect in Samford Valley, rainfall is higher in the west of the
catchment. This is evident in average annual rainfall (mm) isohyetal maps of the area
(based on 5 m DEM contours and processed by ArcGIS) whereby the rainfall varies from an
average 1100 mm to 1300 mm (Figure 5; M. Preda, unpublished 2007). A linear relationship
between the elevation and rainfall in the valley can be expressed as: y = 0.7302x + 1074.6,
where x is the elevation and y demotes the average annual rainfall. Furthermore, due to
both the rainfall distribution and the steepness of the surrounding highlands, streams in the
valley can have rapid flow and response to high rainfall events, resulting in flash flooding.
The rainfall is highly seasonal as evidenced by a pronounced December to March
summer wet season on a graph of monthly mean rainfall and temperature (Figure 6).
Between 1912 to 2003 the average rainfall was highest in February (161 mm) and lowest in
August (34 mm) with a yearly average of 1122 mm (Table 1), but the area has received less
rainfall in the last few years because of the current dry (drought) conditions affecting
southeast Queensland. Rainfall since 2002 has been well below-average for the vast
majority of the state and is reflected in the area that has been drought declared (EPA, 2003).
In December 2002, 50% of Queensland was drought declared; by 2007, this percentage had
significantly increased (EPA, 2003). Furthermore, with on-going use of the groundwater the
watertable has been lowered, as evidenced by the local driller who has stated that shallow
bores have tended to deplete, or “dry-up”. It is therefore likely that many of the deep bores in
the fractured granodiorite (rather than the weathered zone) in the study area have mostly
been drilled after the drought started.
Rainfall may be the main source of groundwater recharge for groundwater in the
valley, and it is a paramount factor in chemical weathering as it controls the supply of
moisture for chemical reactions and the removal of soluble constituents of the minerals
(Sreedevi et al., 2006). Rainwater is weakly acidic due to carbon dioxide (CO2 [gas]) in the
atmosphere, and in the Brisbane area it typically has a pH in the range 4.5 – 5.5 (Cox et al.,
1996). Other ionic species in rain derived from terrestrial sources can be bicarbonate
–) (Hiscock, 2005), but the ions vary depending on the particular area
and climate.
CRICOS No. 00213J
Bronwyn Jones
Figure 6. Graph of mean monthly rainfall and temperature. The data is from 1912 – 2003 at the Samford CSIRO site (Figure 2 [site was closed December 2003]). The rainfall is highly seasonal as evidenced by a pronounced summer wet season.
Month
Samford Valley
Figure 5. Topography and average annual rainfall (mm) isohyetal map. Due to an orographic effect, rainfall is higher in the west of the catchment and varies from an average 1100 mm to 1300 mm. The DEM was based on 5 m contours and processed by ArcGIS (M. Preda, unpublished 2007).
CRICOS No. 00213J
Bronwyn Jones
Land Use
Samford Valley can be classified as a ‘peri-urban’ area and townwater is currently
only supplied to the new estates built north of Mount Glorious Road, the main road that runs
east-west near South Pine River and links to Mount Nebo (Figure 2). The new estates
receive water from North Pine Dam (located at Lake Samsonvale), that has been treated by
Brisbane Water and distributed to the Pine Rivers Shire. The two-thirds of the valley south of
the main road, mostly acreage properties, are not connected to town water and must
therefore provide their own water supply. The property owners use borewater and rainwater
tanks and most have ponds or small dams. However, during long dry periods (e.g. the
present drought conditions) many residents have resorted to having water tanked in by water
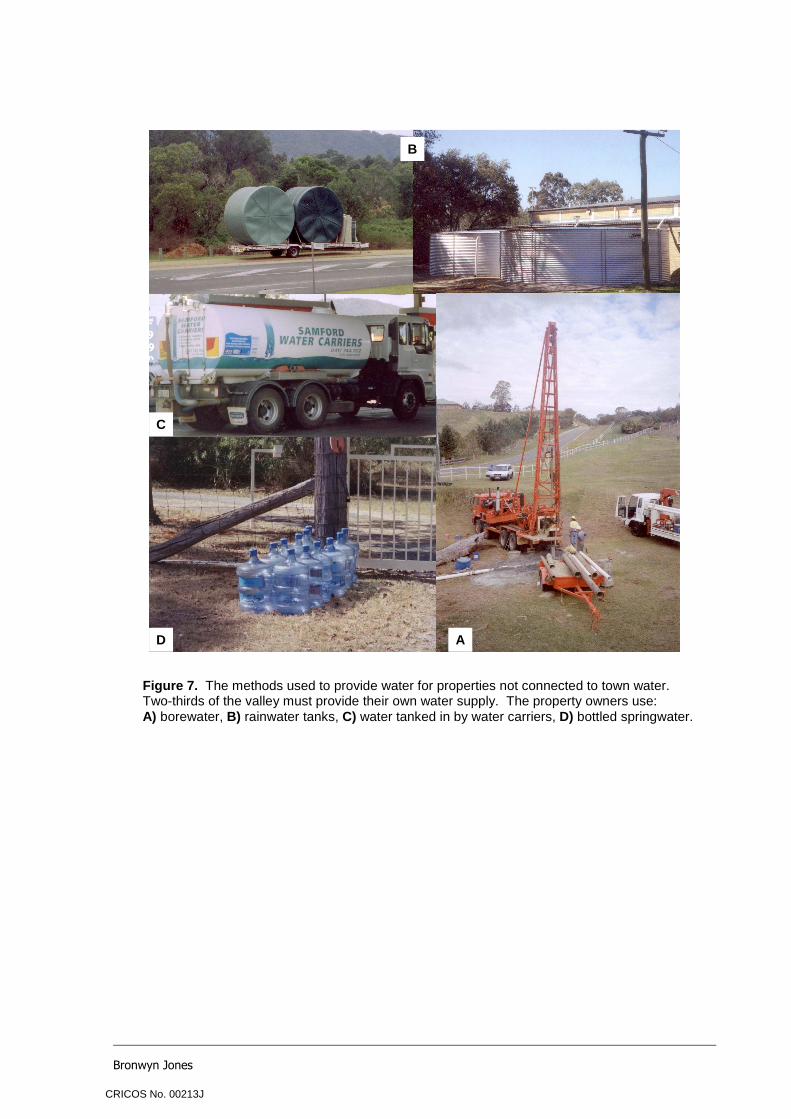
carriers, while others buy bottled springwater (Figure 7). Thus, two-thirds of the valley is
reliant or heavily dependent on the groundwater. In addition, only Samford Village is
connected to a sewerage system. The remainder of the valley uses some form of septic
system.
In this peri-urban environment, land use is made up of new residential estates and a
golf course (north of the main road), a showground, farms, horse studs, urban blocks, and
bushland areas. Native forest covers the steep perimeter of the valley, and there are some
small plantations. Furthermore, there has generally been a change from rural to rural-
residential blocks in the valley. Altogether, the five local suburbs now have a combined
population of about 6700 (year 2006) (PIFU, 2004).
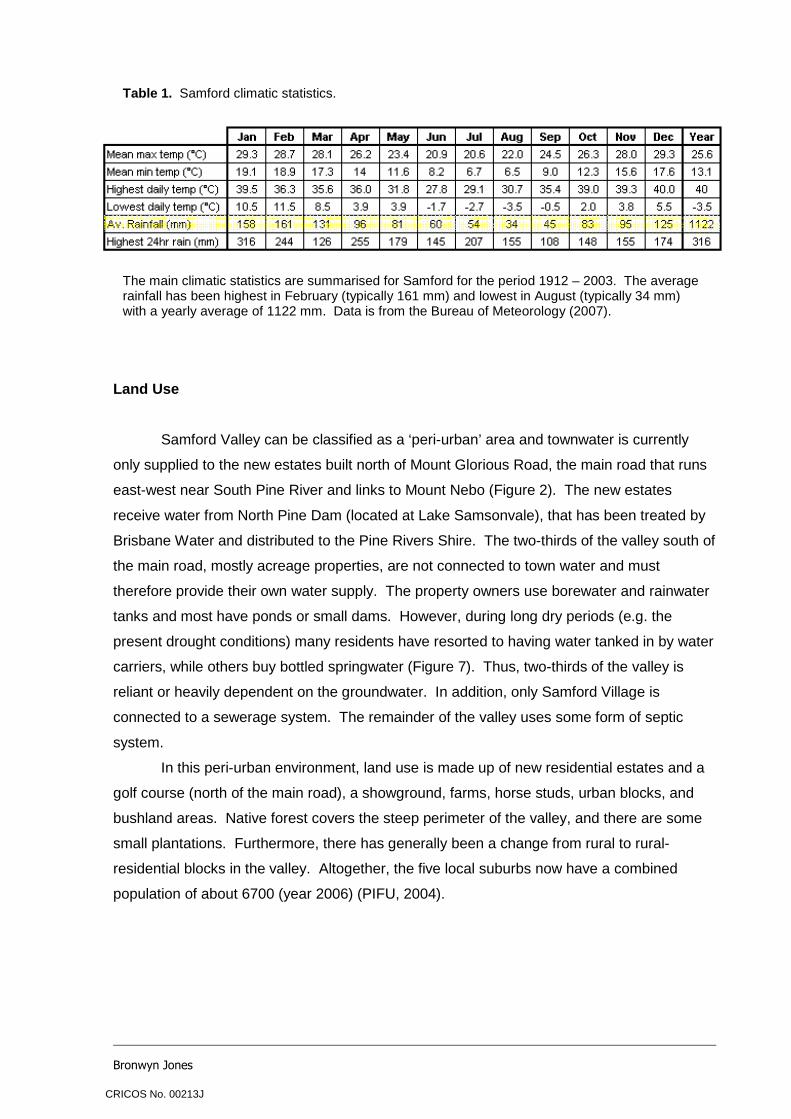
Table 1. Samford climatic statistics.
The main climatic statistics are summarised for Samford for the period 1912 – 2003. The average rainfall has been highest in February (typically 161 mm) and lowest in August (typically 34 mm) with a yearly average of 1122 mm. Data is from the Bureau of Meteorology (2007).
CRICOS No. 00213J
Bronwyn Jones
Figure 7. The methods used to provide water for properties not connected to town water. Two-thirds of the valley must provide their own water supply. The property owners use: A) borewater, B) rainwater tanks, C) water tanked in by water carriers, D) bottled springwater.
A
C
D
B
CRICOS No. 00213J
Bronwyn Jones
Geological Setting
The pronounced basin-shape of Samford Valley is essentially the result of a granitic
intrusion that has been weathered and eroded differentially. The Samford Granodiorite (K/Ar
age 221 ± 8 m.y.) intruded Palaeozoic Bunya Phyllite and Neranleigh-Fernvale beds in the
Middle Triassic (Cranfield et al., 1976). The intrusion is largely granodiorite but has some
dioritic rocks in the western part (near Mount Nebo), and minor trondhjemite (a leucotonalite)
occurs along the valley margins (Stevens, 1984).
In sections of the contact metamorphic zone between the granodiorite and the
metasediments, hornfels developed because of the heat of the molten Samford Granodiorite
magma, i.e. the surrounding metasediments were recrystallised (Figure 8) (Willmott and
Trezise, 1984). Thus, the steep slopes of the metasediments are exaggerated around
Samford Valley because the alteration to hornfels has made those rocks more resistant to
weathering than the relatively “weak” or more susceptible granitic rocks (Phillips, 1959;
Stevens, 1973).
The grey-white, coarse-grained Samford Valley Granodiorite has the composition of a
typical granodiorite and consists of andesine laths (3 – 10 mm), microperthitic feldspar,
1955). Biotite is the dominant mafic mineral, but others include hornblende and rare
pyroxene (non-pleochroic diopsidic augite) (Cranfield et al., 1976). Accessories include
apatite, magnetite, sphene, and rare zircon (Cranfield et al., 1976). The xenoliths in the
granodiorite are derived from both the surrounding country rock and igneous rocks
(Gradwell, 1966). The country rocks are Bunya Phyllite in the east and Neranleigh-Fernvale
beds in the west; the boundary between these runs north-westerly and is intruded by the
Samford pluton (Figure 8) (Willmott, 2004; Hodgkinson et al., 2006).
Although the valley is primarily formed of granodiorite, there are also some colluvium
deposits around the valley edges. This material contains unsorted masses of clay and sand
mixed with boulders and stone layers that can be traced upslope to the surrounding hills
(Van Genderen, 1966). Holocene unconsolidated alluvium is only found along very small
sections of Samford Creek and South Pine River and ranges in texture from sandy to heavy
clays (Van Genderen, 1966).
CRICOS No. 00213J
Bronwyn Jones
Figure 8. Geological map of Samford Valley. Hornfels have developed in the contact metamorphic zone between the Samford Granodiorite and the metasediments. The country rocks are Bunya Phyllite and Neranleigh-Fernvale beds; the boundary between these runs northwest and is intruded by the Samford pluton (Willmott, 2004).
0 1 2 3 km
CRICOS No. 00213J
Bronwyn Jones
Hydrogeology
Porosity and Permeability of Granitic Rocks
The granodioritic rocks are porous and permeable due to secondary porosity by
fracturing and weathering. The weathering and removal of both biotite and plagioclase from
weathered granodiorite results in significant amounts of silica (quartz), kaolinite and other
clay minerals left as remnant material, which may reduce the available secondary porosity
(e.g. by kaolinisation) (Dewandel et al., 2006). On the other hand, it is possible that the
swelling of certain minerals (the most sensitive mineral is biotite) can result in a local
increase in volume that favours cracking and fissuring, increasing secondary porosity
(Dewandel et al., 2006). The deeper granodiorite has only fracture porosity, with the porosity
(the volume of voids to the total volume [n = Vv/Vt]), typically ranging between 0 – 0.10. In
comparison, the porosity in alluvial tracts (up to 0.35) is higher than those of the granitic
formations (Stober and Bucher, 2007).
The hydraulic conductivity (K) or permeability of fractured granitic rocks typically
ranges from 10–13 – 10–4 m s–1 (Stober and Bucher, 2007). Hornfels at the valley margins in
the contact metamorphic zone of the Neranleigh-Fernvale metasediments would have no or
very low permeability (Davis and DeWiest, 1991). In Samford Valley, permeability and
groundwater yield is low with maximum bore yields at 1 L/sec. However, the local drilling
contractor has recommended to many people in the valley to use a pumping rate of 0.25
L/sec, which provides a good supply for domestic use. The likely aquifers or water-bearing materials in Samford Valley are:
i) Alluvium in the active drainage systems, peripheral to streams, and on floodplains;
colluvium at the edges of the valley. Both of these materials are very limited in volume.
ii) Weathered upper granodiorite, which is probably the primary aquifer of the valley.
However, over much of the valley, the weathered zone has become unsaturated as the
watertable has lowered, and some bores that were once productive are now dry because
of the current dry (drought) conditions. Whereas previously bores only needed to be
drilled into the weathered zone to reach water, a lot of new bores registered on the NRW
database are being drilled into fractured granodiorite.
iii) Deeper fresh, fractured granodiorite. Some of the bores in the fractured granodiorite in
Samford Valley are to depths of 60 metres.
Some of these aquifers may overlap and be hydrogeologically continuous.
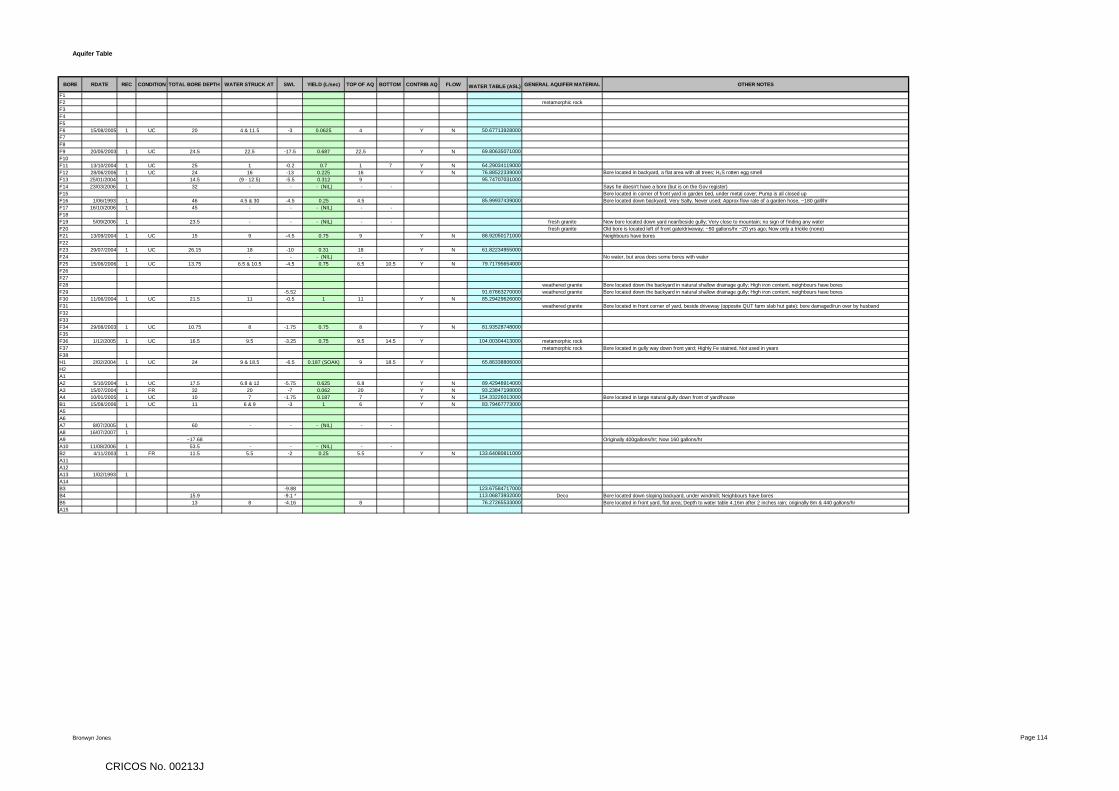
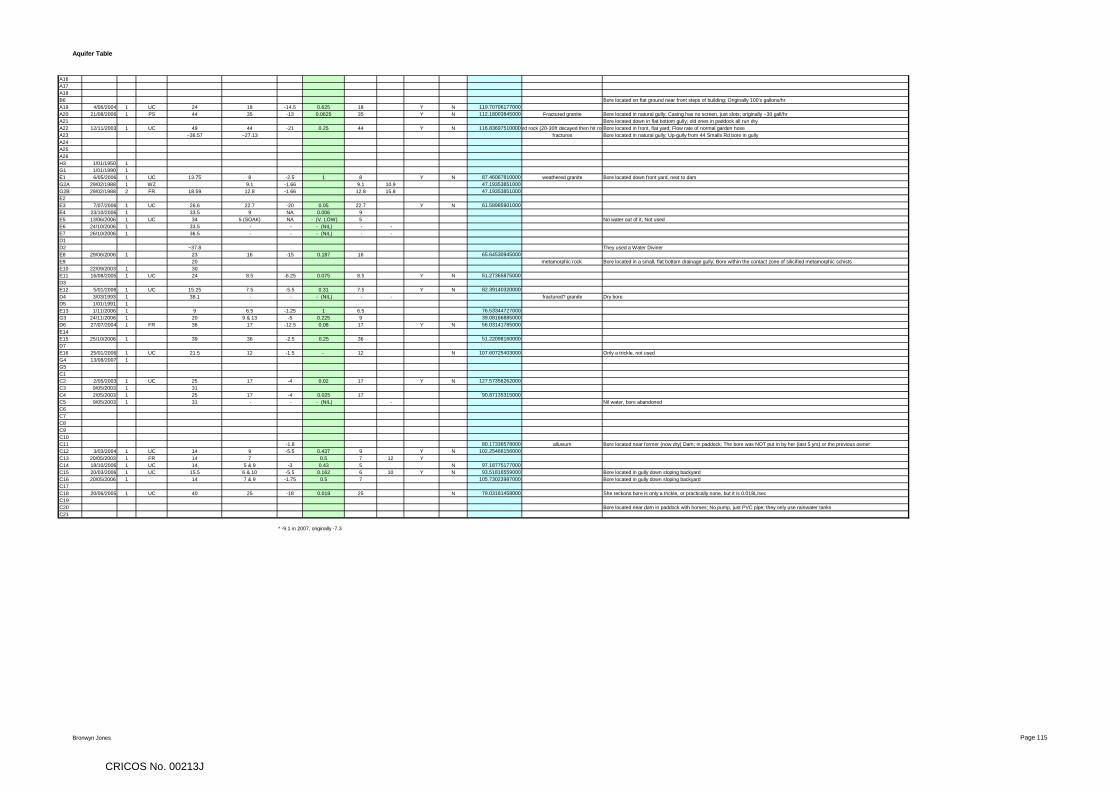
From drillers’ logbooks (N. Scells, unpublished data 2007), the depth to the water-
bearing zone varies from 1 m (bore F11) to 44 m (bore A22); in some bores the water level
rose from this depth. The aquifers are primarily unconfined, and generally only occupy the
first tens of metres below the ground surface. However, the rise in the water level in some
bores could indicate (a) hydraulic head related to recharge, or (b) semi confining conditions.
CRICOS No. 00213J
Bronwyn Jones
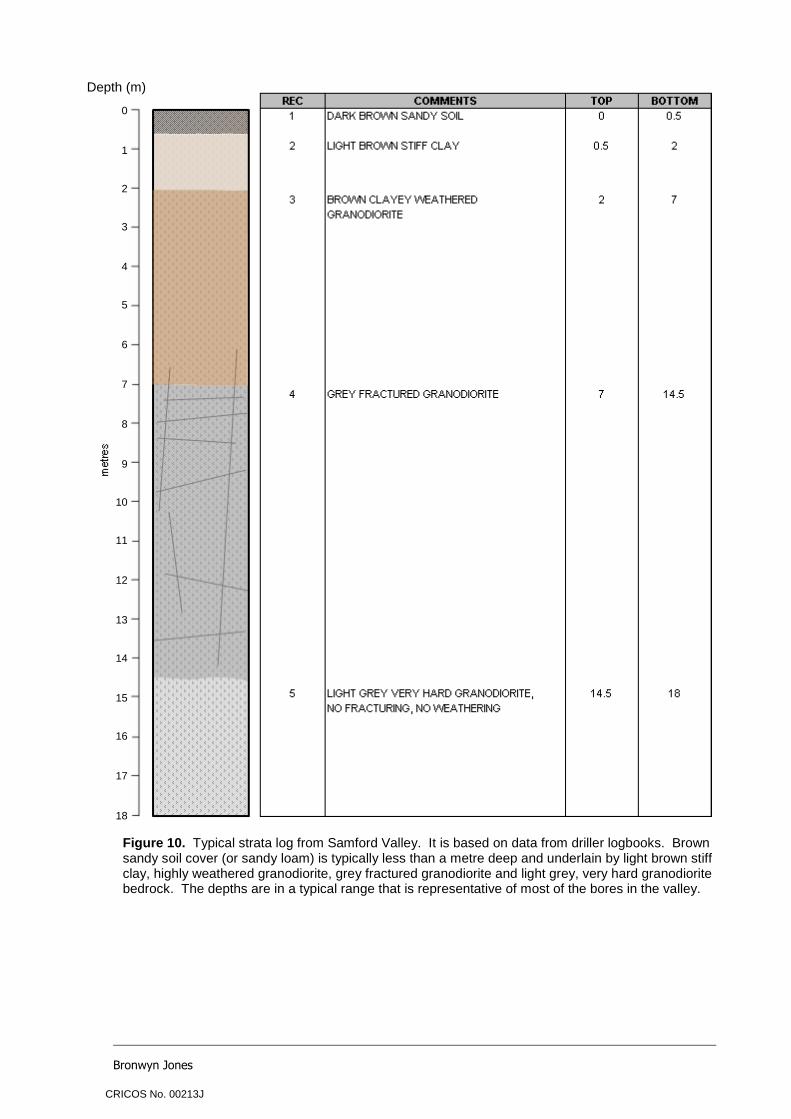
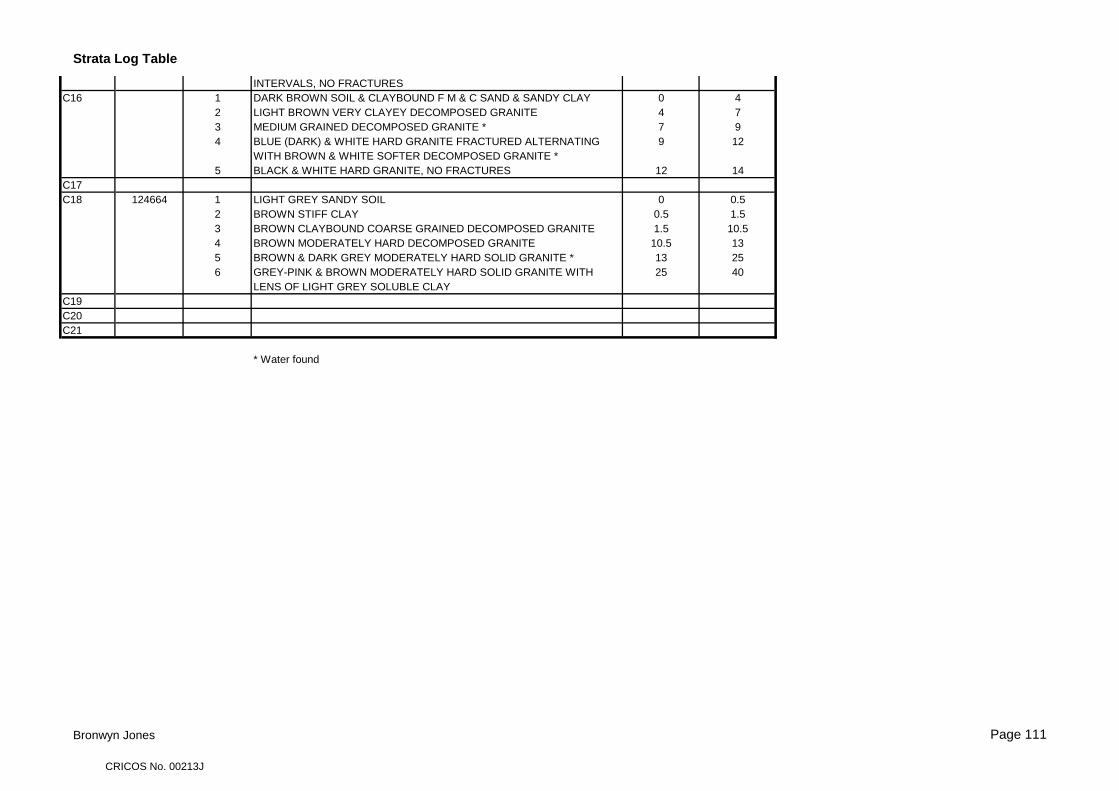
Strata Log
A typical weathering profile for granitic rocks includes overlying sediments (usually
structureless sands and clays), weathered rock, a weathered-fractured zone, and fractured
bedrock (Figure 9, Huggett, 2003). Based on data from driller logbooks, a strata log was
created for the Samford Valley bores (Figure 10). The brown sandy soil cover (typically
sandy loam) derived from the weathering of the Samford Granodiorite is typically less than a
metre deep and underlain by light brown stiff clay, highly weathered granodiorite and grey
fractured granodiorite.
The light brown stiff clay material and deeply weathered zone have formed because
of the prolonged in situ weathering of the granodiorite. The thickness of the weathered zone
varies from 1 m (bore E7) to about 29 m thick (bore D4) and is referred to as “deco”
(decomposed) by the drillers. The highly weathered granodiorite is then underlain by
fractured grey granodiorite. The deepest layer is the fresh, unweathered, light grey, very
hard granodiorite bedrock, which has no or negligible fracturing.
Figure 9. Generalised weathering profile for granitic rocks. Layers include overlying sediments, weathered rock, the weathered-fissured zone, and fractured bedrock (Huggett, 2003).
CRICOS No. 00213J
Bronwyn Jones
0
1
2
3
4
5
6
7
8
9
10
11
12
13
14
15
16
17
18
Figure 10. Typical strata log from Samford Valley. It is based on data from driller logbooks. Brown sandy soil cover (or sandy loam) is typically less than a metre deep and underlain by light brown stiff clay, highly weathered granodiorite, grey fractured granodiorite and light grey, very hard granodiorite bedrock. The depths are in a typical range that is representative of most of the bores in the valley.
Depth (m)
CRICOS No. 00213J
Bronwyn Jones
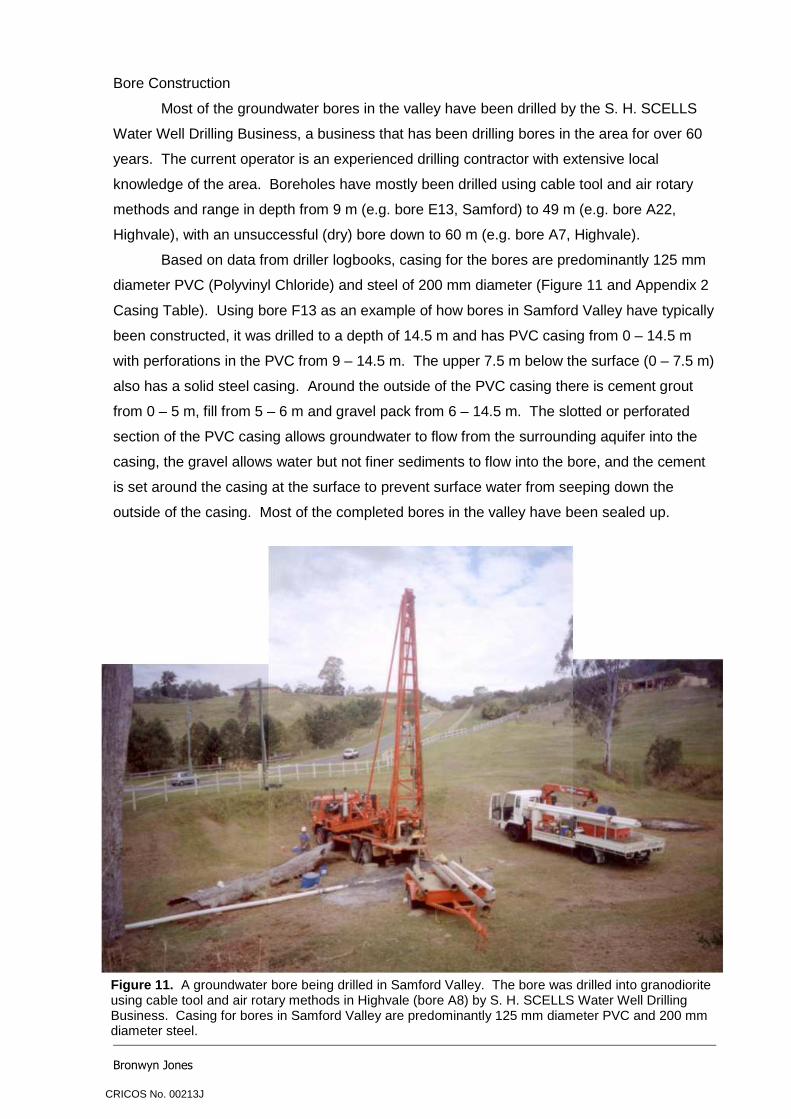
Bore Construction
Most of the groundwater bores in the valley have been drilled by the S. H. SCELLS
Water Well Drilling Business, a business that has been drilling bores in the area for over 60
years. The current operator is an experienced drilling contractor with extensive local
knowledge of the area. Boreholes have mostly been drilled using cable tool and air rotary
methods and range in depth from 9 m (e.g. bore E13, Samford) to 49 m (e.g. bore A22,
Highvale), with an unsuccessful (dry) bore down to 60 m (e.g. bore A7, Highvale).
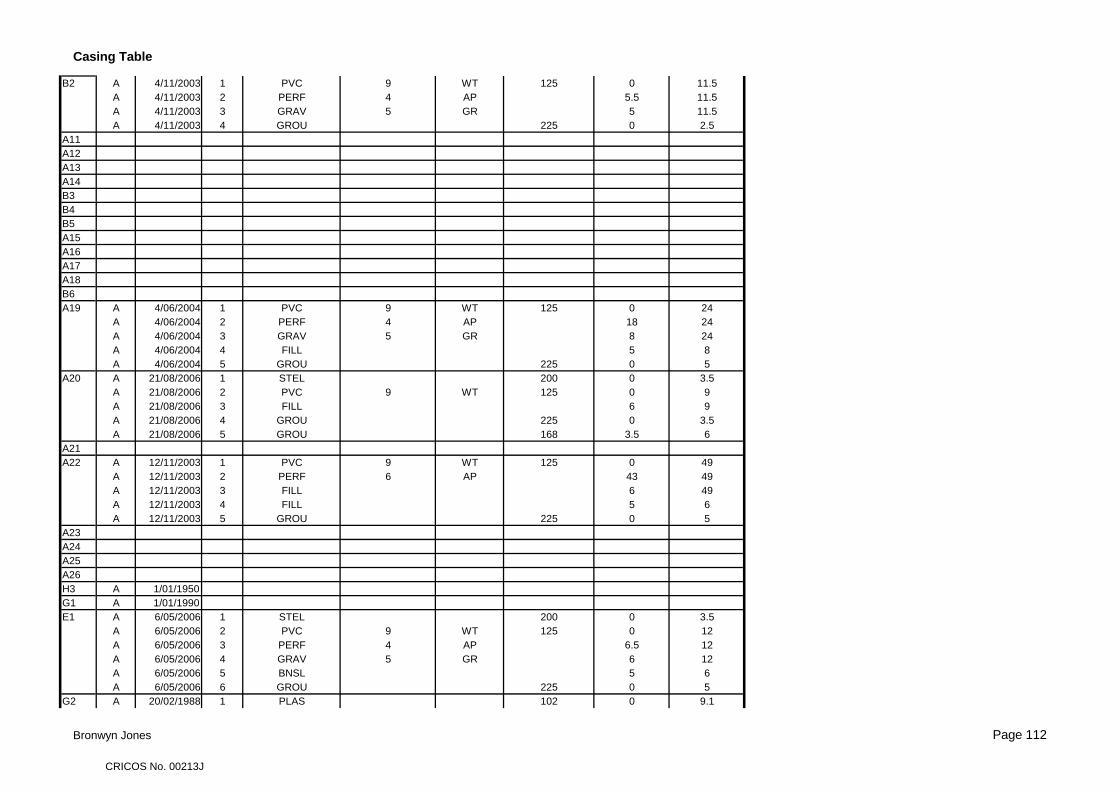
Based on data from driller logbooks, casing for the bores are predominantly 125 mm
diameter PVC (Polyvinyl Chloride) and steel of 200 mm diameter (Figure 11 and Appendix 2
Casing Table). Using bore F13 as an example of how bores in Samford Valley have typically
been constructed, it was drilled to a depth of 14.5 m and has PVC casing from 0 – 14.5 m
with perforations in the PVC from 9 – 14.5 m. The upper 7.5 m below the surface (0 – 7.5 m)
also has a solid steel casing. Around the outside of the PVC casing there is cement grout
from 0 – 5 m, fill from 5 – 6 m and gravel pack from 6 – 14.5 m. The slotted or perforated
section of the PVC casing allows groundwater to flow from the surrounding aquifer into the
casing, the gravel allows water but not finer sediments to flow into the bore, and the cement
is set around the casing at the surface to prevent surface water from seeping down the
outside of the casing. Most of the completed bores in the valley have been sealed up.
Figure 11. A groundwater bore being drilled in Samford Valley. The bore was drilled into granodiorite using cable tool and air rotary methods in Highvale (bore A8) by S. H. SCELLS Water Well Drilling Business. Casing for bores in Samford Valley are predominantly 125 mm diameter PVC and 200 mm diameter steel.
CRICOS No. 00213J
Bronwyn Jones
METHODS
Collection of Data for Groundwater Bores
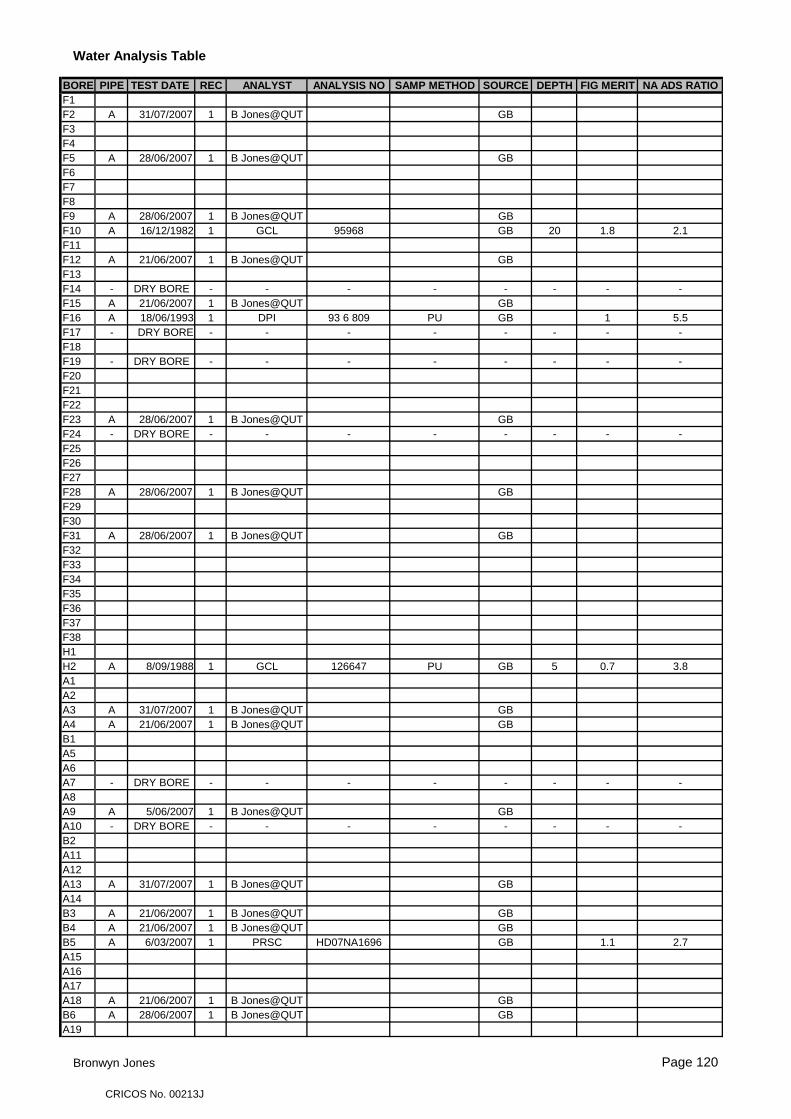
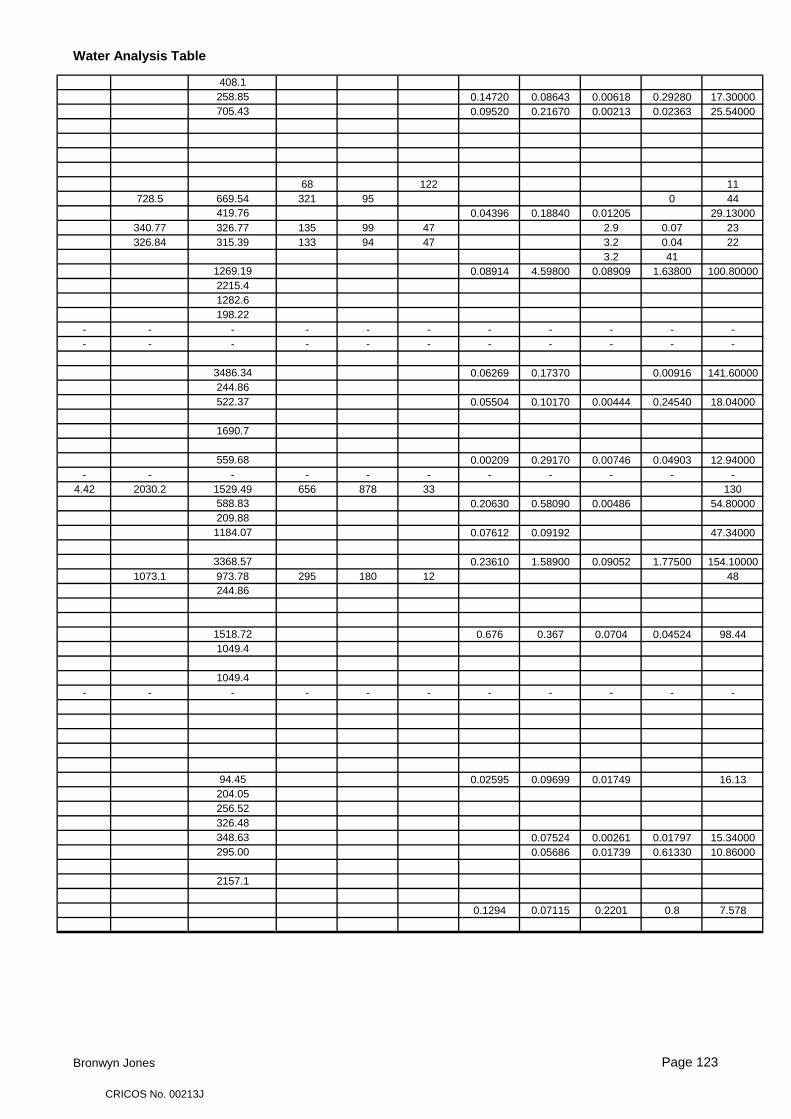
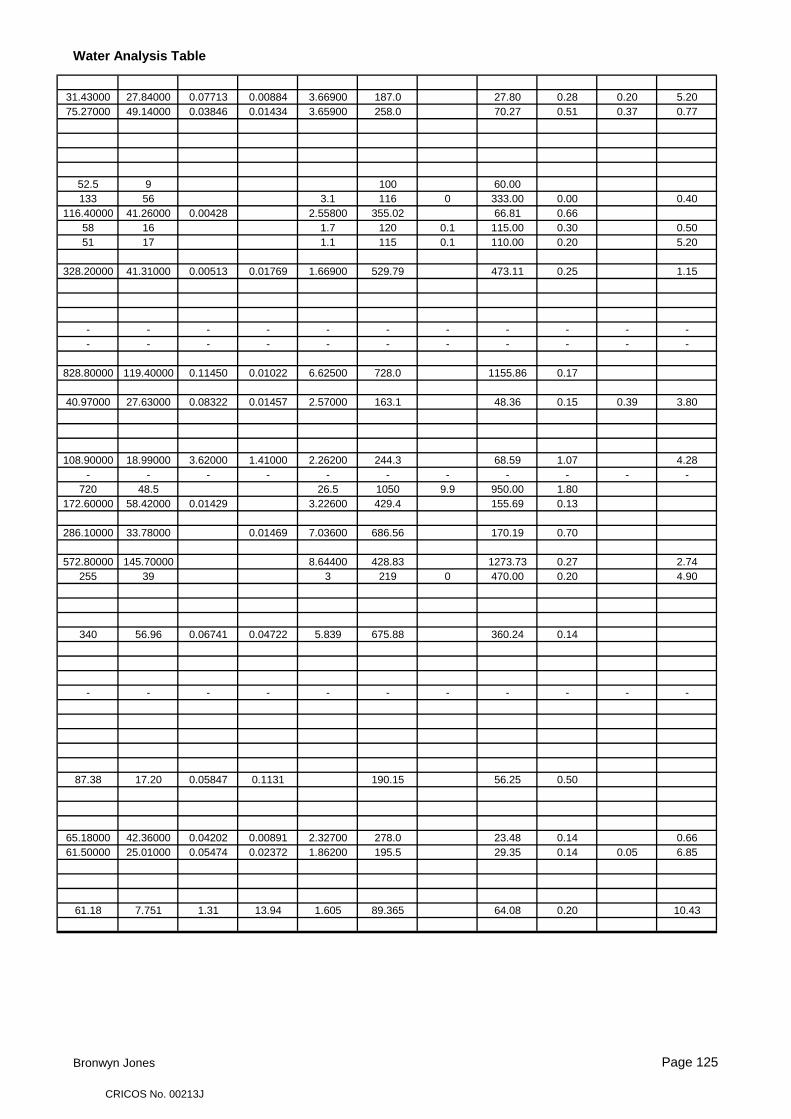
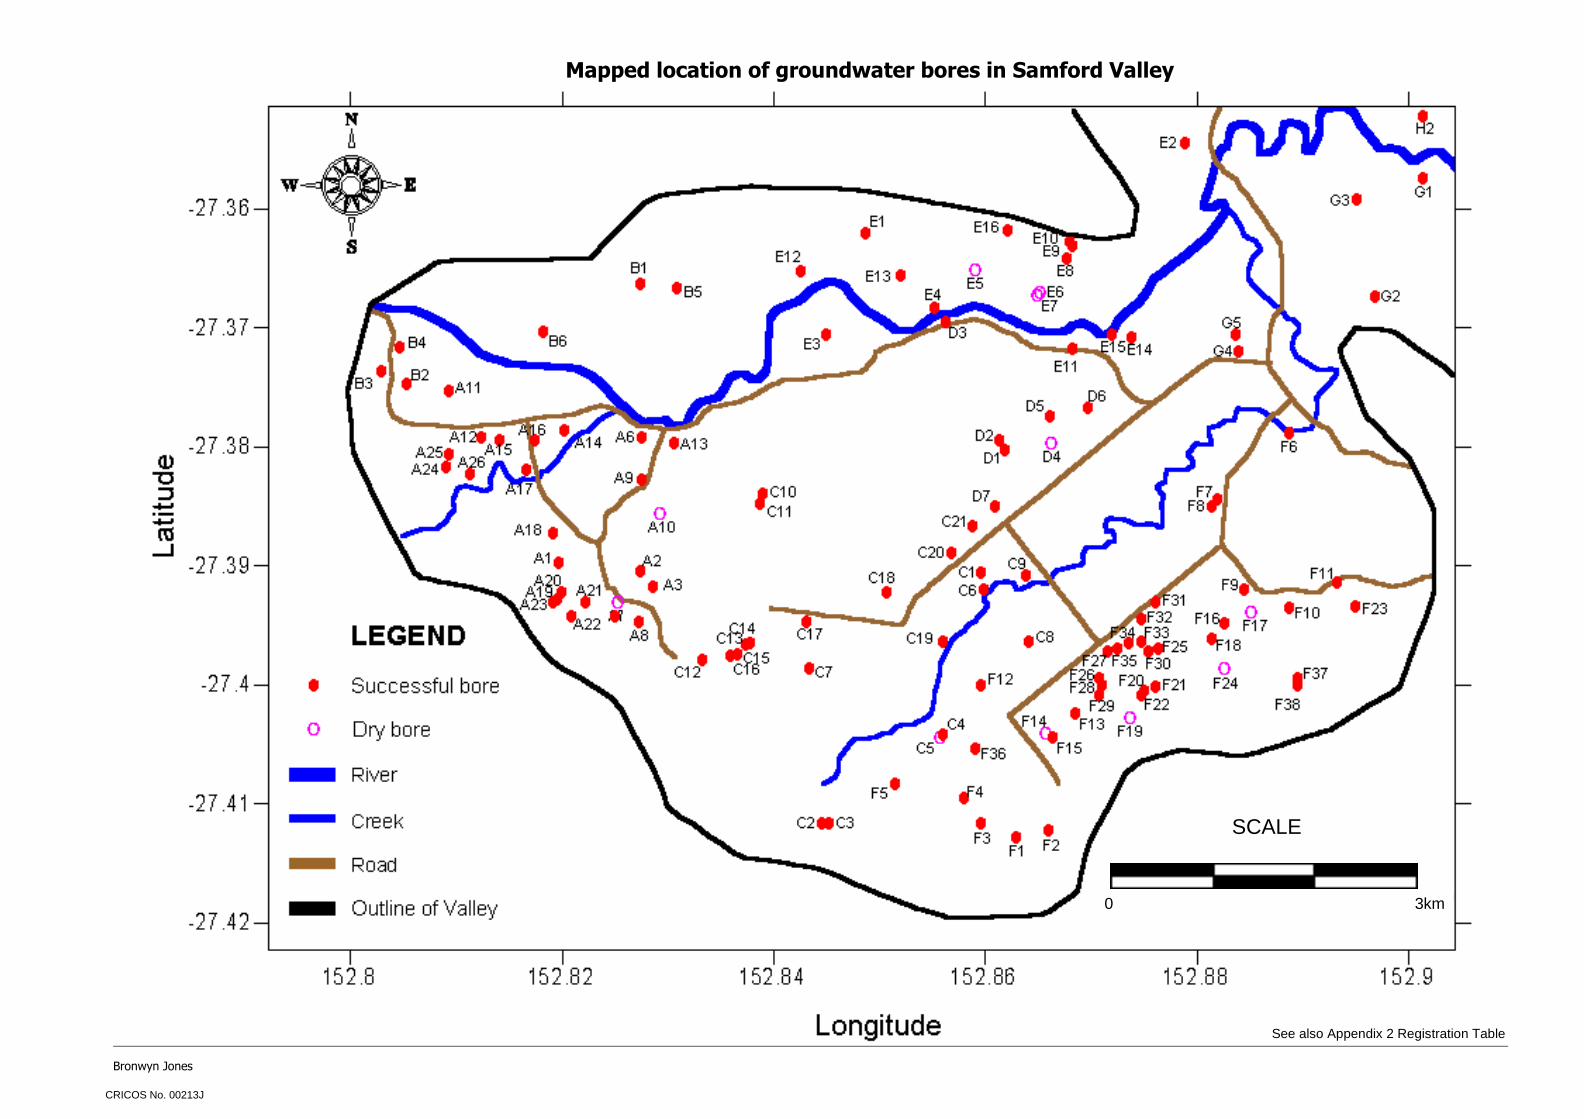
A total of 122 existing groundwater bores were located in Samford Valley (Figure 12
and Appendix 2). Although there was an attempt to locate a relatively even spread of bores,
they are distributed throughout the whole valley with clusters in some areas, and in other
areas the bores are widely spread. Nevertheless, the main focus was to establish where
bores were, so that a complete groundwater bore inventory could be generated. In addition,
there does not appear to be any spatial significance to the location of the dry bores.
Forty-nine bores were originally identified from the Queensland State Government’s
Department of Natural Resources and Water (NRW) Register, as prior to several years ago
there were no requirements for bores to be registered. However, a local ex-driller identified
where other bores were (G. Ward, pers. comm., 2007), and the location of other non-
registered private bores (including dry bores) was established in this study by visiting
properties. The challenge of locating new bores was increased as some landowners were
nervous about providing access (especially considering there has long been talk of the
council metering bores).
Co-ordinate locations of the bores were confirmed by handheld GPS (Global
Positioning System), and each bore position was later converted to easting and northing,
latitude and longitude in decimals, and latitude and longitude in degrees, minutes and
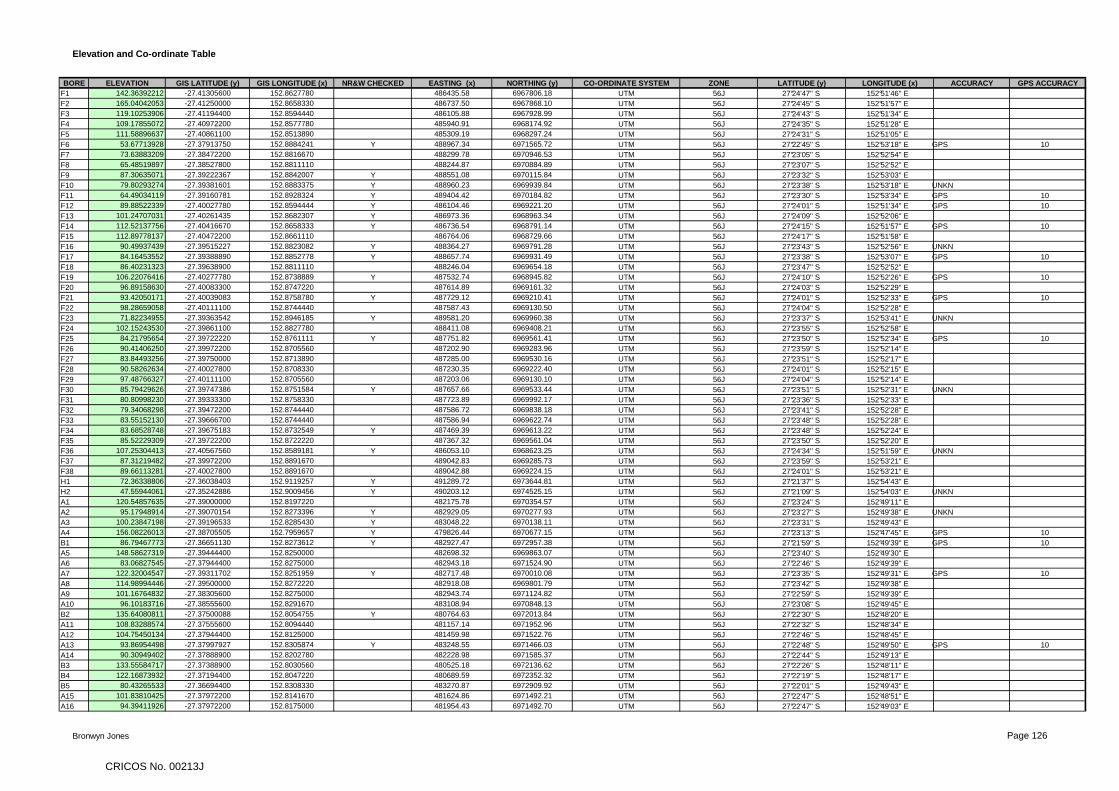
seconds (Appendix 2 Elevation and Co-ordinate Table).
An experienced drilling contractor with extensive local knowledge also provided
access to drill logs (N. Scells, unpublished data 2007); data such as bore yield (supply in
L/sec), stratigraphy, casing data and drilling methods for a lot of bores were obtained. The
full details for each bore are listed in the groundwater inventory (Appendix 2) and the
mapped locations of the 122 bores are shown in Figure 12.
CRICOS No. 00213J
Bronwyn Jones
Figure 12 . Mapped location of groundwater bores in Samford Valley. A total of 122 existing groundwater bores were located and confirmed in Samford Valley. The details for each bore are listed in the groundwater inventory (Appendix 2) and an A3-size bore location map is also in the Appendix.
CRICOS No. 00213J
Bronwyn Jones
Groundwater Field Investigations
Field measurements and a groundwater water sample were taken from existing
groundwater bores (no new bores were drilled specifically to measure and collect
information). Both the in situ field measurements and sample collection were made over
three months at various bore locations throughout the area. If there was a tap connected to
the bore, this was run before tests were carried out. A few of the bores with no tap or pump
were bailed (such as bore F16 which had equivalent to 30 L of water bailed out); otherwise,
shallow water or water sitting in the pipe (e.g. rainwater) would have been tested instead of
the main groundwater source.
Various physico-chemical parameters of the groundwater were measured in the field
including the potential hydrogen ion activity (pH), electrical conductivity (EC in µS/cm) and
redox potential (Eh in millivolts). The pH and EC’s of the groundwater were measured by
means of pH and conductivity meters. The electrode probes were placed into a bucket of the
groundwater and the measurement values were allowed to stabilise before a reading was
recorded. Sixty-six EC values, 51 pH values and 26 redox potential values have been
obtained (See Appendix 2).
The depth to the watertable was determined by placing a dipmeter* down the bore.
This was only possible with bores that were not sealed up, although most of the 45 standing
water levels were available from the NRW database and drill log reports. The government
records, mostly from the period 2003 – 2007, and field measurements in this current study
were taken to indicate the current water table conditions. The yields of the aquifers (supply
in L/sec) from 51 bores were also available from drill logs.
The groundwater samples from 42 existing bores were collected in clean 250 mL
plastic bottles for hydrochemical analysis in the QUT geochemistry laboratory. Each
container was filled completely, so as to be free of air. Two sample bottles, one each for
cations and anions, were required for each site. Before going into the field 2 mL of
concentrated nitric acid (HNO3–) was added to the cation sample bottles, to give a pH<2 in
the final sample, to stabilise metal ions in solution.
* A dipmeter or dipper has a probe on the end of a long tape. The inner electrode on the probe ‘beeps’ when it comes into contact with water.
CRICOS No. 00213J
Bronwyn Jones
Laboratory Water Analyses
Groundwater samples collected from bores in the field were chemically analysed for
major and minor cations and anions in the QUT geochemistry laboratory by various methods,
to determine the chemical components, character and variation. The water analyses were
performed by the ion chromatography (IC) and inductively coupled plasma (ICP – OES)
machines, as well as manually by acid titration (for bicarbonates). The full laboratory
groundwater analytical procedure is included in Appendix 3.
Acid Titration for Bicarbonates
The concentration of bicarbonate anions (HCO3–) in each groundwater sample was
determined by titrating hydrochloric acid (HCl) with each sample. Calculations were made
using the amount (volume) and concentration of titrate used to reach the endpoint, so as to
convert the bicarbonate expressed as alkalinity (mg/L CaCO3) to the concentration of the
bicarbonate species (HCO3–). The full acid titration procedure is in Appendix 3.
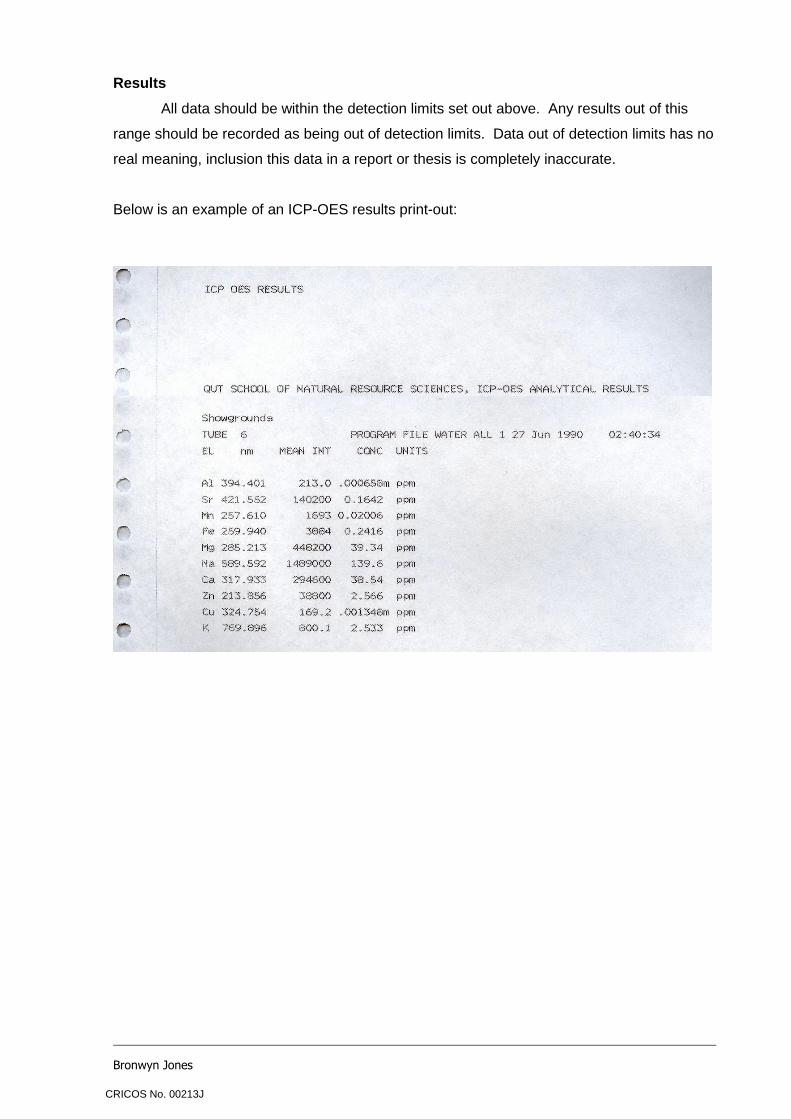
machine was used to analyse for major and minor cations in the groundwater samples that
had been filtered and acidified with nitric acid. The concentrations of sodium, calcium,
potassium, magnesium, iron, aluminium, manganese, strontium, zinc and copper (Na, Ca, K,
Mg, total Fe, Al, Mn, Sr, Zn, and Cu respectively) were determined. The full ICP procedure is
in Appendix 3.
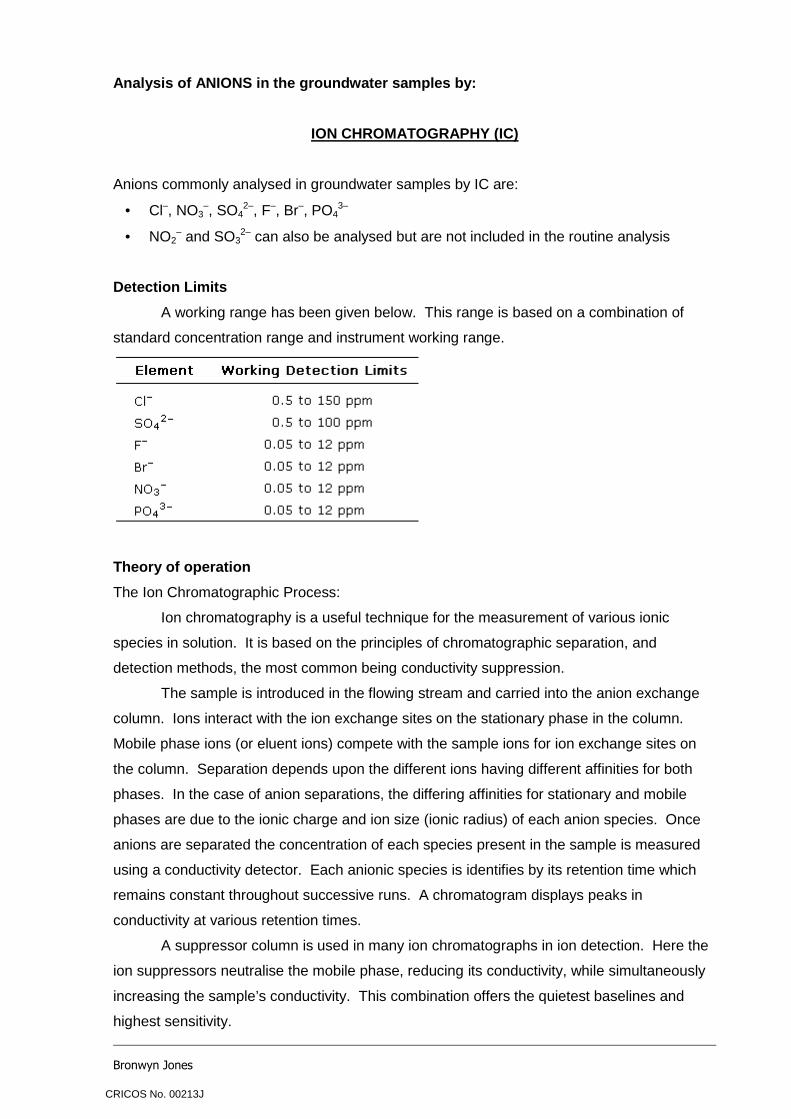
Ion Chromatography
The Ion Chromatography (IC) machine analysed the groundwater samples for the
important anions of chloride, fluoride, bromide, nitrate, phosphate and sulphate (Cl, F, Br,
NO3, PO4 and SO4 respectively). These anion samples were not acidified. The full IC
procedure is in Appendix 3.
Data Interpretation and Modelling
SURFER
SURFER for Windows by Golden Software, Inc. was used to generate groundwater
resource maps of Samford Valley. Contour maps (2D and 3D) were developed to show the
electrical conductivity, watertable, bore yields, and generalised distribution of shallow
permeability in the valley. Maps of the watertable (metres above sea level) were constructed
CRICOS No. 00213J
Bronwyn Jones
by subtracting the standing water level values from bore elevations. The bore elevations and
topographic data had been extrapolated from a 1 m and 5 m contour digital elevation model
(DEM) of the area. Groundwater flow was identified through the direction and magnitude of
vector arrows overlaid on the watertable map. The arrow symbol points in the “downhill”
direction and the length (magnitude) of the arrow depends on the steepness, or gradient, of
the watertable (SURFER 8, 2002). A bore yield and generalised permeability distribution
map was prepared from the driller logbook data on the yield in litres/second; while an
electrical conductivity map was prepared from EC data to determine the distribution of
salinity in the valley.
AquaChem
Various graphs and diagrams in the aqueous geochemistry package AquaChem were
used to plot the chemical character of the groundwater samples, to determine mixing and
major trends visually and to also show clustering of data points that indicate samples (water
bodies) that have similar compositions.
Scatter plots were produced to determine the major trends, patterns and relationships
between different combinations of parameters in the groundwater samples. A schoeller
diagram provided a comparison of the logarithmic concentrations of the major ions.
A trilinear diagram was used to plot together the relative percent abundance of major
ions to classify different watertypes, to interpret the chemical evolution, and to reveal
relationships or groupings of all the samples. Samples were classified by dividing the main
diamond field into nine distinct categories based upon chemical composition (Figure 13).
Figure 13. Piper classification diagram. The diamond field is divided into nine groundwater types based upon chemical composition (after Sujatha and Reddy, 2003).
The groundwater pH values in the study area range between pH 5.8 (bore B4 in
Highvale) to pH 8.5 (bore H2 in Draper). The highest pH value measured within the valley
itself was pH 8.0 (bores F16 and D5) but the average pH was calculated to be 6.86. The pH
was low in samples collected from around the periphery of the valley, including at Mount
Nebo (bore H3, pH 6.4). The pH was higher in samples from the middle of the valley (e.g.
D5 and D6).
A scatter plot was produced to determine whether there is a relationship between pH
and the electrical conductivity (Figure 14). The electrical conductivity axis of the graph was
given a logarithmic scale to better discriminate the distribution of samples. It is apparent that
the pH of the groundwater generally increases with increasing electrical conductivity. The
samples with lower EC and pH are mainly from recharge areas towards the valley edges.
The groundwater samples with the highest electrical conductivity and pH are mainly from
Samford or in the central area of the valley. Furthermore, seven of the ten highest electrical
conductivities are from Samford.
B4
C11
F5
G1
F9 F15
F16 D5
H2
D2
E15
B3
D6 C15
B6
Electrical Conductivity (µS/cm)
pH
Figure 1 4. Scatter plot of the relationship between electrical conductivity and pH. The pH increases with increasing EC.
H3
CRICOS No. 00213J
Bronwyn Jones
A scatter plot was created to determine whether pH is influenced by the amount of
bicarbonate (Figure 15). It is evident that the pH of the groundwater generally increases with
increasing bicarbonate (HCO3). The groundwater samples with the highest bicarbonate
content are from Samford in the middle of the valley (e.g. D5, D6, D2) and they are at some
of the highest pH’s in the valley. Conversely, groundwater samples from Highvale near the
western edge of the valley have some of the lowest pH’s and bicarbonate contents (e.g. B4,
B3). All the Highvale samples have a pH of less than 7.31, and less than 365 mg/L HCO3–.
H2
F16 D5
F9 F31
B4 G1
D6
C1
D2
F5
H3 F15
Figure 15. Scatter plot of the influence of bicarbonate on pH. The pH increases with increasing bicarbonate. Samford samples (red) D5, D6 and D2 have some of the highest pH’s and bicarbonate contents.
B3
CRICOS No. 00213J
Bronwyn Jones
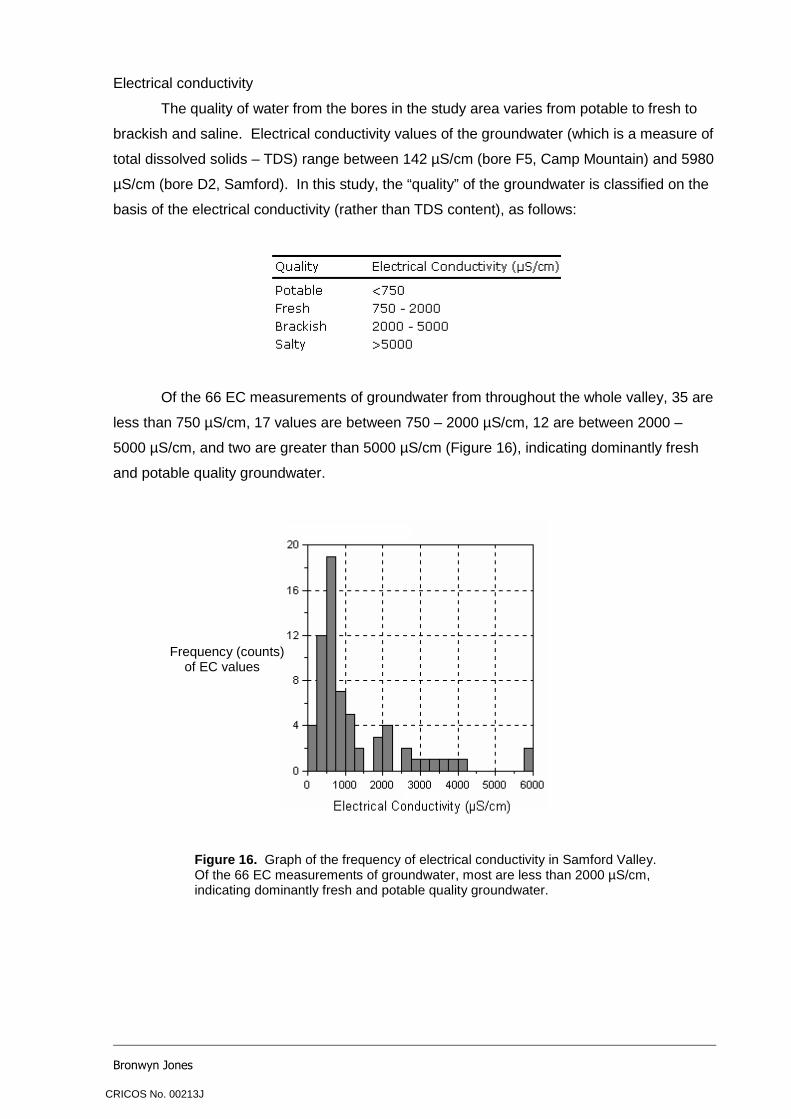
Electrical conductivity
The quality of water from the bores in the study area varies from potable to fresh to
brackish and saline. Electrical conductivity values of the groundwater (which is a measure of
total dissolved solids – TDS) range between 142 µS/cm (bore F5, Camp Mountain) and 5980
µS/cm (bore D2, Samford). In this study, the “quality” of the groundwater is classified on the
basis of the electrical conductivity (rather than TDS content), as follows:
Of the 66 EC measurements of groundwater from throughout the whole valley, 35 are
less than 750 µS/cm, 17 values are between 750 – 2000 µS/cm, 12 are between 2000 –
5000 µS/cm, and two are greater than 5000 µS/cm (Figure 16), indicating dominantly fresh
and potable quality groundwater.
Figure 1 6. Graph of the frequency of electrical conductivity in Samford Valley. Of the 66 EC measurements of groundwater, most are less than 2000 µS/cm, indicating dominantly fresh and potable quality groundwater.
Frequency (counts) of EC values
CRICOS No. 00213J
Bronwyn Jones
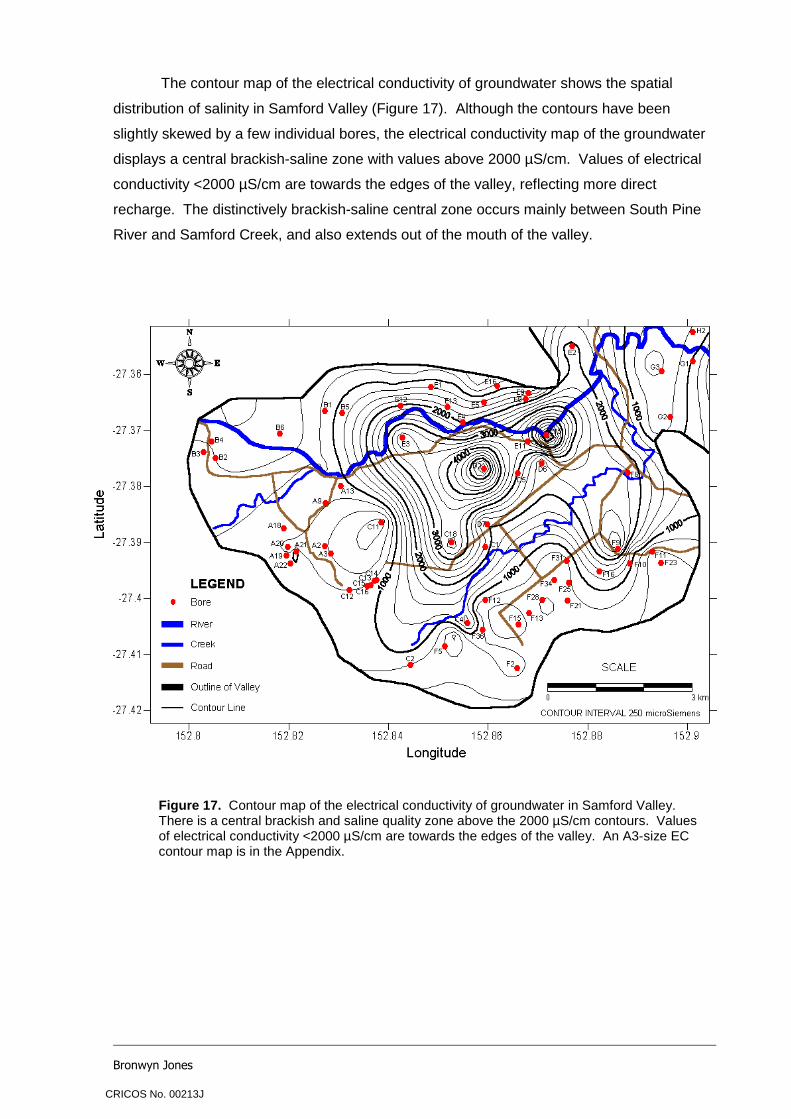
The contour map of the electrical conductivity of groundwater shows the spatial
distribution of salinity in Samford Valley (Figure 17). Although the contours have been
slightly skewed by a few individual bores, the electrical conductivity map of the groundwater
displays a central brackish-saline zone with values above 2000 µS/cm. Values of electrical
conductivity <2000 µS/cm are towards the edges of the valley, reflecting more direct
recharge. The distinctively brackish-saline central zone occurs mainly between South Pine
River and Samford Creek, and also extends out of the mouth of the valley.
Figure 17. Contour map of the electrical conductivity of groundwater in Samford Valley. There is a central brackish and saline quality zone above the 2000 µS/cm contours. Values of electrical conductivity <2000 µS/cm are towards the edges of the valley. An A3-size EC contour map is in the Appendix.
CRICOS No. 00213J
Bronwyn Jones
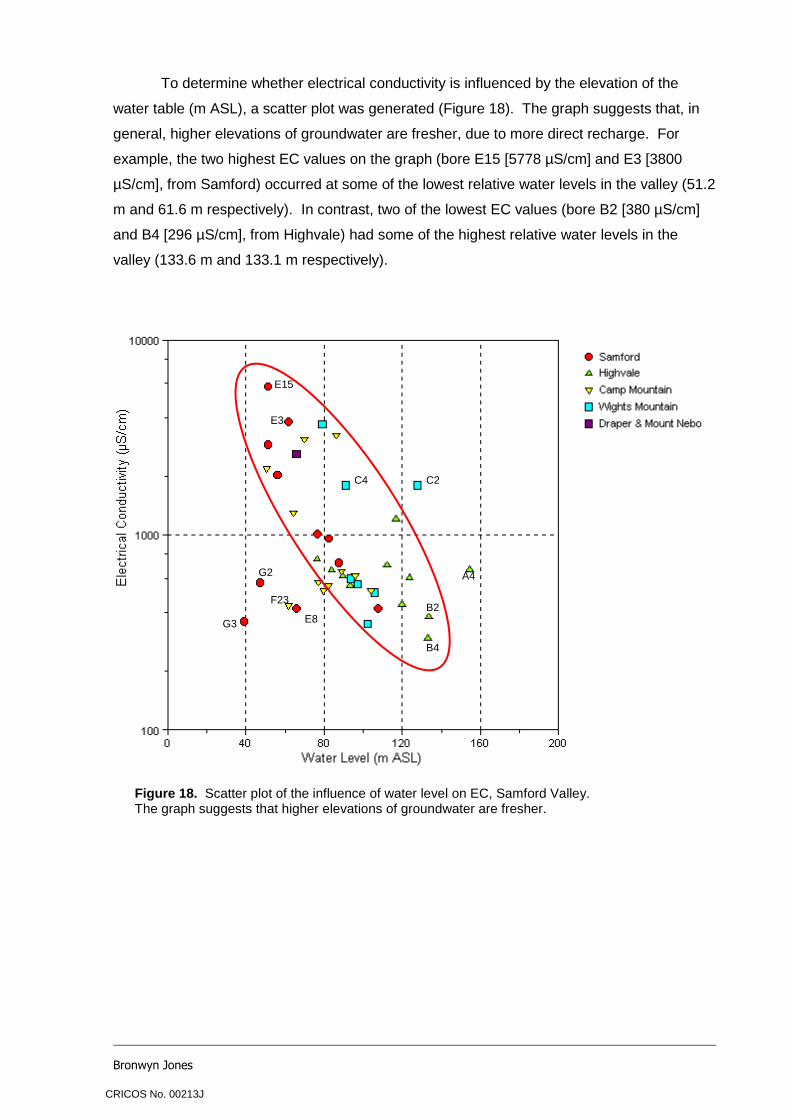
To determine whether electrical conductivity is influenced by the elevation of the
water table (m ASL), a scatter plot was generated (Figure 18). The graph suggests that, in
general, higher elevations of groundwater are fresher, due to more direct recharge. For
example, the two highest EC values on the graph (bore E15 [5778 µS/cm] and E3 [3800
µS/cm], from Samford) occurred at some of the lowest relative water levels in the valley (51.2
m and 61.6 m respectively). In contrast, two of the lowest EC values (bore B2 [380 µS/cm]
and B4 [296 µS/cm], from Highvale) had some of the highest relative water levels in the
valley (133.6 m and 133.1 m respectively).
E3
E15
B4
B2
G3
G2
E8
F23
A4
C2 C4
Figure 18. Scatter plot of the influence of water level on EC, Samford Valley. The graph suggests that higher elevations of groundwater are fresher.
CRICOS No. 00213J
Bronwyn Jones
Bore Yield
A contour map of the bore yields (supply in L/sec) reflects the generalised distribution
of shallow permeability in the valley (Figure 19). These values are estimates of bore
production with pumping and are conducted by drillers after the hole has been drilled. It is
apparent that the highest yields are generally obtained around the northern and southeastern
edges of the valley (at up to 1 L/sec). The lowest yield values (<0.25 L/sec) are central to the
valley between South Pine River and Samford Creek, and extend to the valley mouth. Yields
are also low along the south-southwestern margins of the valley where contact
metamorphism is well developed. Using the bore yield map to infer the generalised
distribution of shallow permeability, it is evident that shallow permeability is highest towards
the margins of the valley. However, it should be noted that there is local variability, both
laterally and with depth.
Figure 19. Contour map of bore yields and distribution of permeability in Samford Valley. Yield is highest around the northern and southern edges (at up to 1 L/sec). The lowest yields (<0.25 L/sec) are in a central zone of the valley. An A3-size generalised distribution of shallow permeability map is in the Appendix.
CRICOS No. 00213J
Bronwyn Jones
Watertable
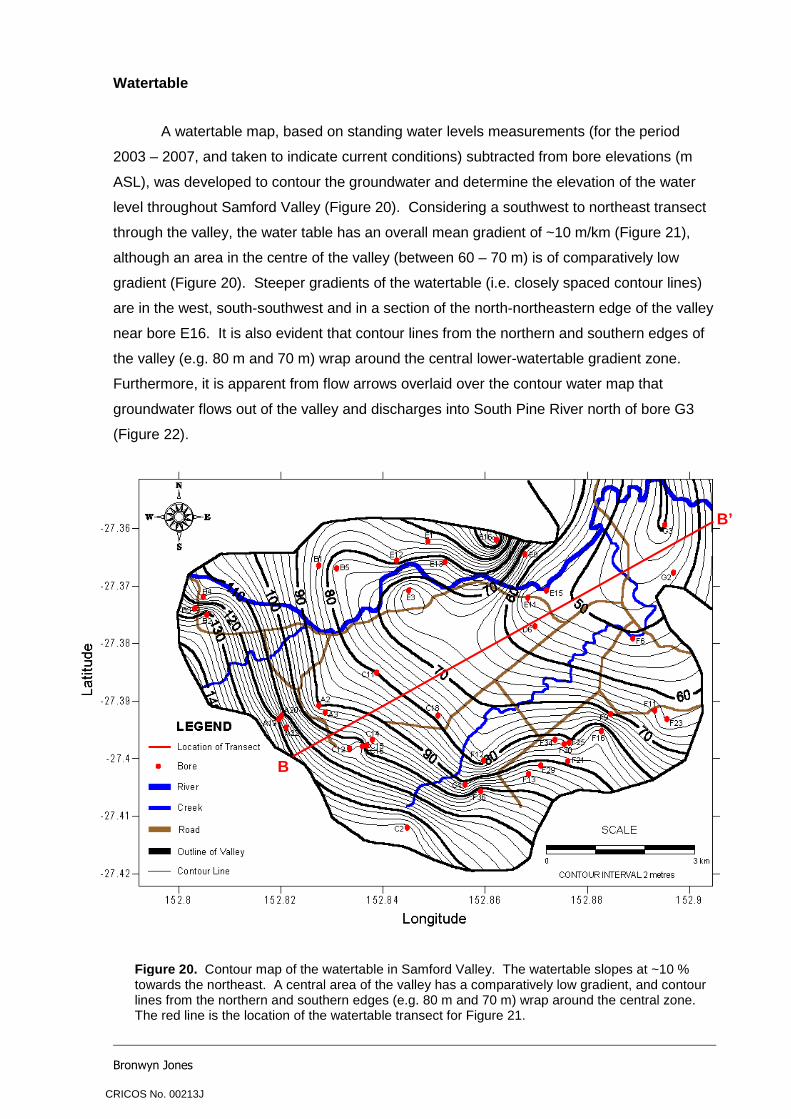
A watertable map, based on standing water levels measurements (for the period
2003 – 2007, and taken to indicate current conditions) subtracted from bore elevations (m
ASL), was developed to contour the groundwater and determine the elevation of the water
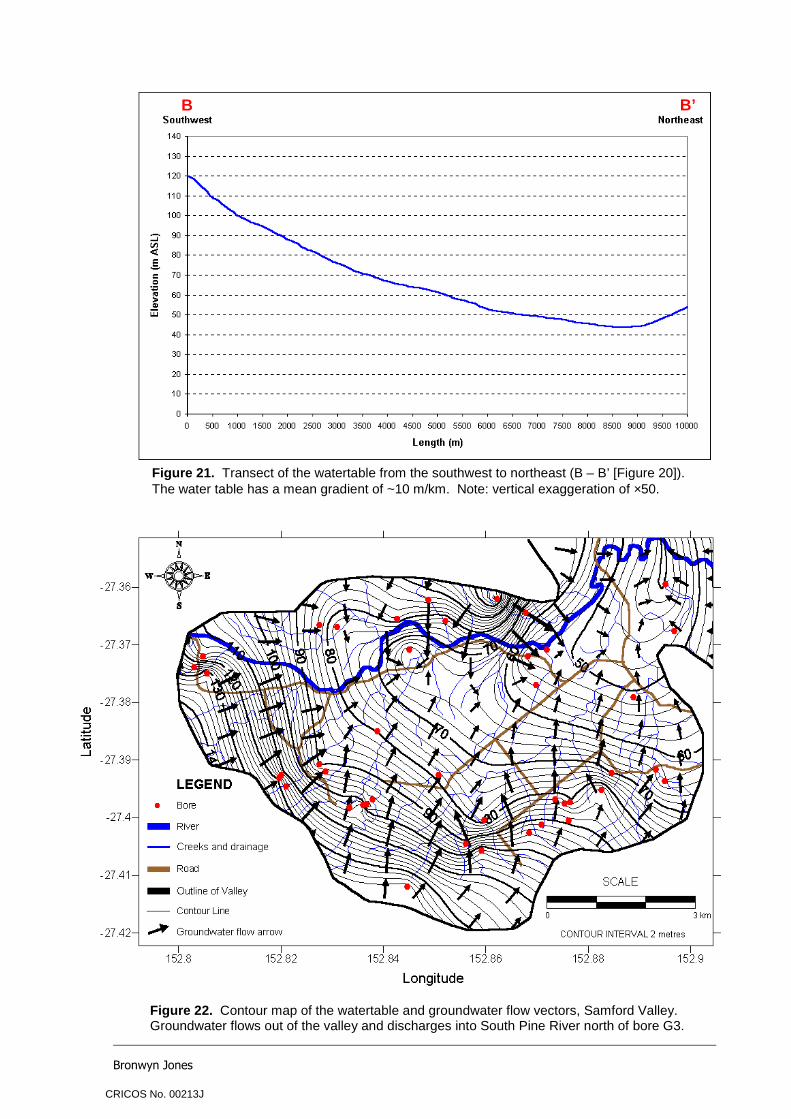
level throughout Samford Valley (Figure 20). Considering a southwest to northeast transect
through the valley, the water table has an overall mean gradient of ~10 m/km (Figure 21),
although an area in the centre of the valley (between 60 – 70 m) is of comparatively low
gradient (Figure 20). Steeper gradients of the watertable (i.e. closely spaced contour lines)
are in the west, south-southwest and in a section of the north-northeastern edge of the valley
near bore E16. It is also evident that contour lines from the northern and southern edges of
the valley (e.g. 80 m and 70 m) wrap around the central lower-watertable gradient zone.
Furthermore, it is apparent from flow arrows overlaid over the contour water map that
groundwater flows out of the valley and discharges into South Pine River north of bore G3
(Figure 22).
Figure 20. Contour map of the watertable in Samford Valley. The watertable slopes at ~10 % towards the northeast. A central area of the valley has a comparatively low gradient, and contour lines from the northern and southern edges (e.g. 80 m and 70 m) wrap around the central zone. The red line is the location of the watertable transect for Figure 21.
B
B’
CRICOS No. 00213J
Bronwyn Jones
Figure 22. Contour map of the watertable and groundwater flow vectors, Samford Valley. Groundwater flows out of the valley and discharges into South Pine River north of bore G3.
Figure 2 1. Transect of the watertable from the southwest to northeast (B – B’ [Figure 20]). The water table has a mean gradient of ~10 m/km. Note: vertical exaggeration of ×50.
B B’
CRICOS No. 00213J
Bronwyn Jones
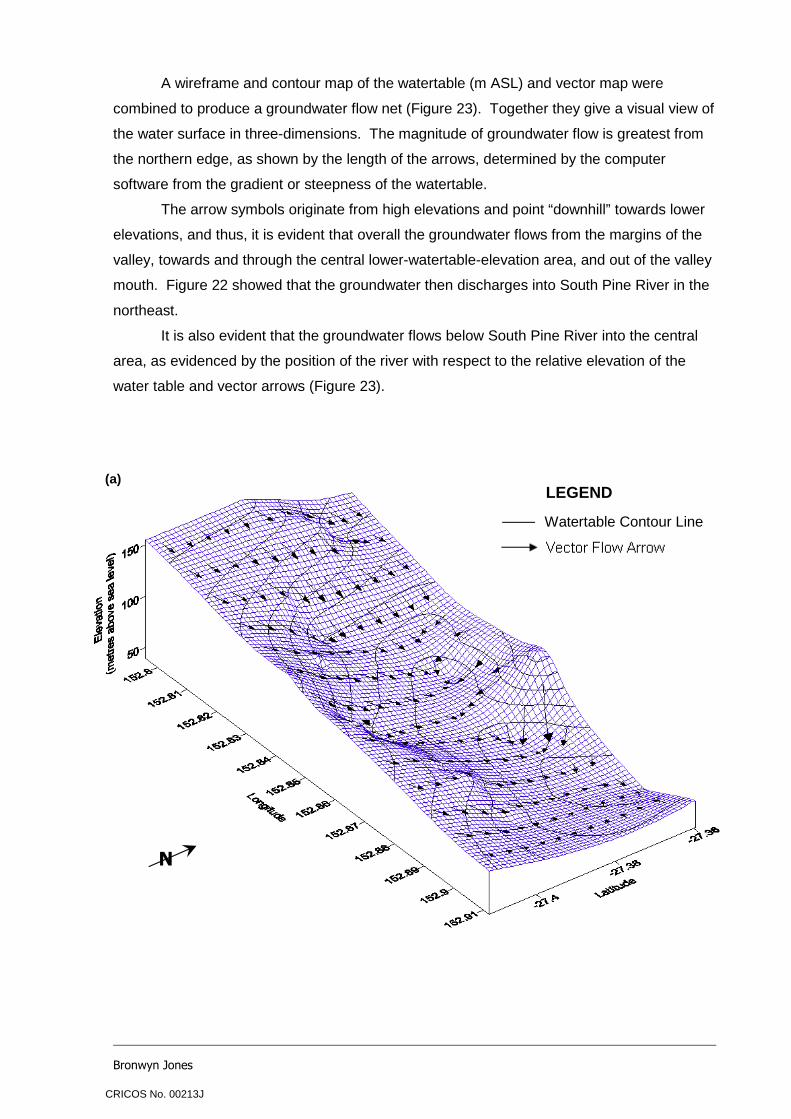
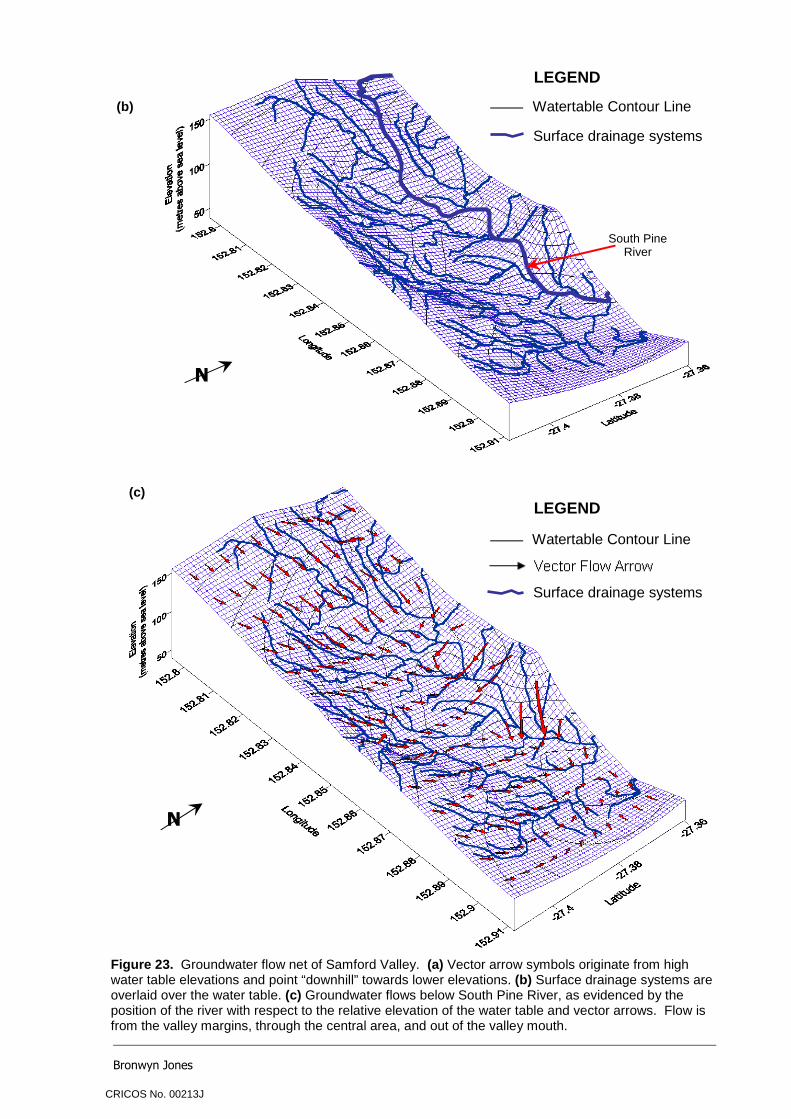
A wireframe and contour map of the watertable (m ASL) and vector map were
combined to produce a groundwater flow net (Figure 23). Together they give a visual view of
the water surface in three-dimensions. The magnitude of groundwater flow is greatest from
the northern edge, as shown by the length of the arrows, determined by the computer
software from the gradient or steepness of the watertable.
The arrow symbols originate from high elevations and point “downhill” towards lower
elevations, and thus, it is evident that overall the groundwater flows from the margins of the
valley, towards and through the central lower-watertable-elevation area, and out of the valley
mouth. Figure 22 showed that the groundwater then discharges into South Pine River in the
northeast.
It is also evident that the groundwater flows below South Pine River into the central
area, as evidenced by the position of the river with respect to the relative elevation of the
water table and vector arrows (Figure 23).
LEGEND
N
(a)
Watertable Contour Line
CRICOS No. 00213J
Bronwyn Jones
N
N
LEGEND
LEGEND
South Pine River
(b)
(c)
Figure 23. Groundwater flow net of Samford Valley. (a) Vector arrow symbols originate from high water table elevations and point “downhill” towards lower elevations. (b) Surface drainage systems are overlaid over the water table. (c) Groundwater flows below South Pine River, as evidenced by the position of the river with respect to the relative elevation of the water table and vector arrows. Flow is from the valley margins, through the central area, and out of the valley mouth.
Surface drainage systems
Surface drainage systems
Watertable Contour Line
Watertable Contour Line
CRICOS No. 00213J
Bronwyn Jones
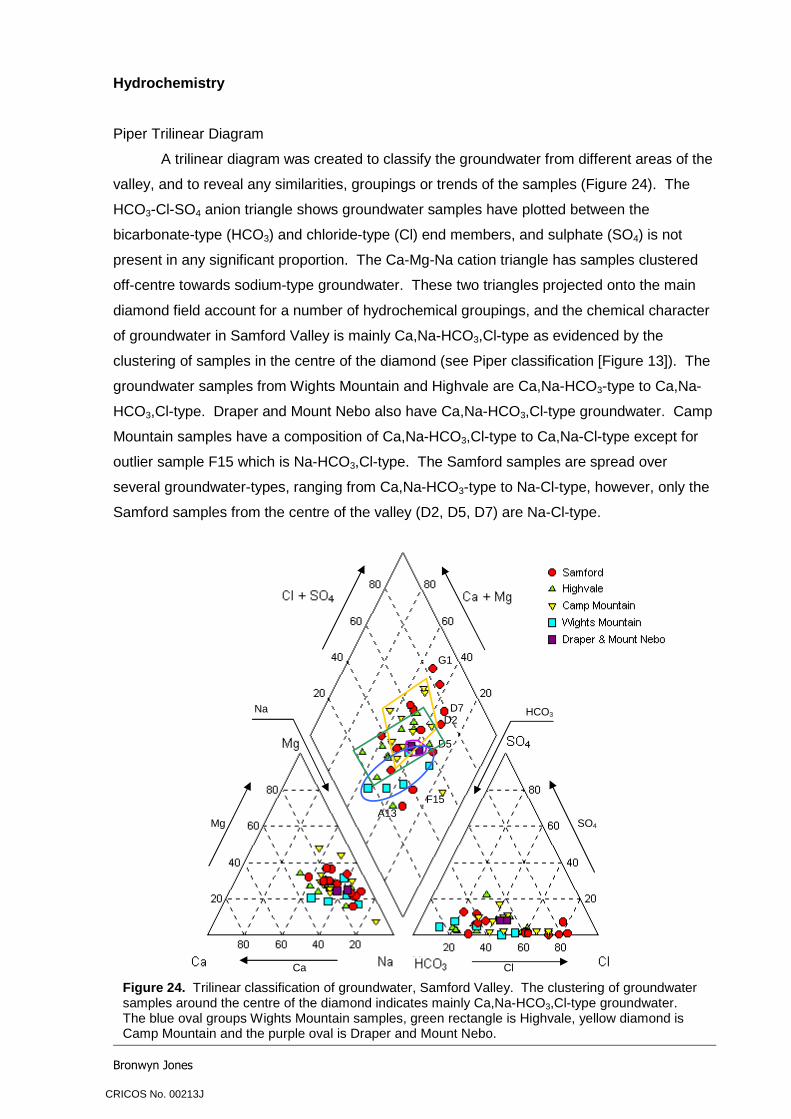
Hydrochemistry
Piper Trilinear Diagram
A trilinear diagram was created to classify the groundwater from different areas of the
valley, and to reveal any similarities, groupings or trends of the samples (Figure 24). The
HCO3-Cl-SO4 anion triangle shows groundwater samples have plotted between the
bicarbonate-type (HCO3) and chloride-type (Cl) end members, and sulphate (SO4) is not
present in any significant proportion. The Ca-Mg-Na cation triangle has samples clustered
off-centre towards sodium-type groundwater. These two triangles projected onto the main
diamond field account for a number of hydrochemical groupings, and the chemical character
of groundwater in Samford Valley is mainly Ca,Na-HCO3,Cl-type as evidenced by the
clustering of samples in the centre of the diamond (see Piper classification [Figure 13]). The
groundwater samples from Wights Mountain and Highvale are Ca,Na-HCO3-type to Ca,Na-
HCO3,Cl-type. Draper and Mount Nebo also have Ca,Na-HCO3,Cl-type groundwater. Camp
Mountain samples have a composition of Ca,Na-HCO3,Cl-type to Ca,Na-Cl-type except for
outlier sample F15 which is Na-HCO3,Cl-type. The Samford samples are spread over
several groundwater-types, ranging from Ca,Na-HCO3-type to Na-Cl-type, however, only the
Samford samples from the centre of the valley (D2, D5, D7) are Na-Cl-type.
Figure 24. Trilinear classification of groundwater, Samford Valley. The clustering of groundwater samples around the centre of the diamond indicates mainly Ca,Na-HCO3,Cl-type groundwater. The blue oval groups Wights Mountain samples, green rectangle is Highvale, yellow diamond is Camp Mountain and the purple oval is Draper and Mount Nebo.
D5
F15
D7 D2
G1
Cl
SO4
Ca
Mg A13
Na HCO3
CRICOS No. 00213J
Bronwyn Jones
Bicarbonate and Chloride
As it was quite apparent from the anion triangle in the Piper trilinear diagram that the
groundwater samples had plotted between the bicarbonate (HCO3–) and chloride (Cl–) end
members rather than up to sulphate (Figure 24), a 1:1 scatter plot was created to examine
the trend between the HCO3 and Cl ions (Figure 25). The results showed that, overall, most
samples have a distinct enrichment of bicarbonate relative to chloride (i.e. a high ratio of
HCO3 to Cl); however, several samples have an enrichment of chloride (e.g. D2, E15, F9,
F31, F16). In the graph, sample E15 from Samford in the central zone of the valley, for
example, has a ratio of Cl/HCO3 of 2.97 (rather than 1:1) which indicates a high chloride
(salty, low bicarbonate) content, whereas F15 from near an edge of the valley has a Cl/HCO3
ratio of 0.5 which indicates a low chloride (potable, high bicarbonate) content. Furthermore, it
is evident that groundwater samples collected from the centre of the valley in the brackish-
saline quality zones (Figure 17) mostly have more chloride ions than bicarbonate ions.
F15
D5
E15, Cl/HCO3 ratio 2.97
D2
F9
F16
F31
C1 D6
B4
A3
H2
Samples from areas with salty or brackish quality groundwater
Old, evolved, mature, salty groundwater
Young, fresh, immature groundwater
B6
Figure 25. Scatter plot of the trend between bicarbonate and chloride ions. Most samples have a distinct enrichment of bicarbonate relative to chloride. The inset plot has enlarged the sample cluster to distinguish the samples.
G2
A18
B3
C15
F5
C11
CRICOS No. 00213J
Bronwyn Jones
Schoeller Diagram
A Schoeller diagram is used to provide a comparison of the logarithmic
concentrations of major ions in groundwater sample pairs of different water types (Figure 27).
The results show that the concentrations of certain ions in samples from “fresh” groundwater
areas are different to the ion concentrations in “brackish-saline” samples from the middle of
the valley. The groundwater samples from the centre of the valley (D5, F9) have high
sodium and chloride, some elevation of magnesium, but low calcium. In contrast, the two
samples from fresh quality areas (A21, A22) have much lower sodium and chloride, no
elevation in magnesium, and no depletion in calcium. It is thus apparent that while there is
originally a similar proportion of calcium, sodium and magnesium ions in the fresh
groundwater (A21, A22), the calcium ion concentrations decrease and sodium ion
concentrations increase in the brackish-saline groundwater (F9, D5). The chloride ions also
have a substantial increase, however the bicarbonate ions do not.
Figure 26. Schoeller diagram of fresh and brackish-saline sample pairs. F9 (yellow) and D5 (pink) have high sodium and chloride, some elevation of magnesium, but low calcium. A21 (green) and A22 (green) have much lower sodium and chloride, no elevation in magnesium, and no depletion in calcium.
Major Ions
Recharge areas
Central zone of valley
CRICOS No. 00213J
Bronwyn Jones
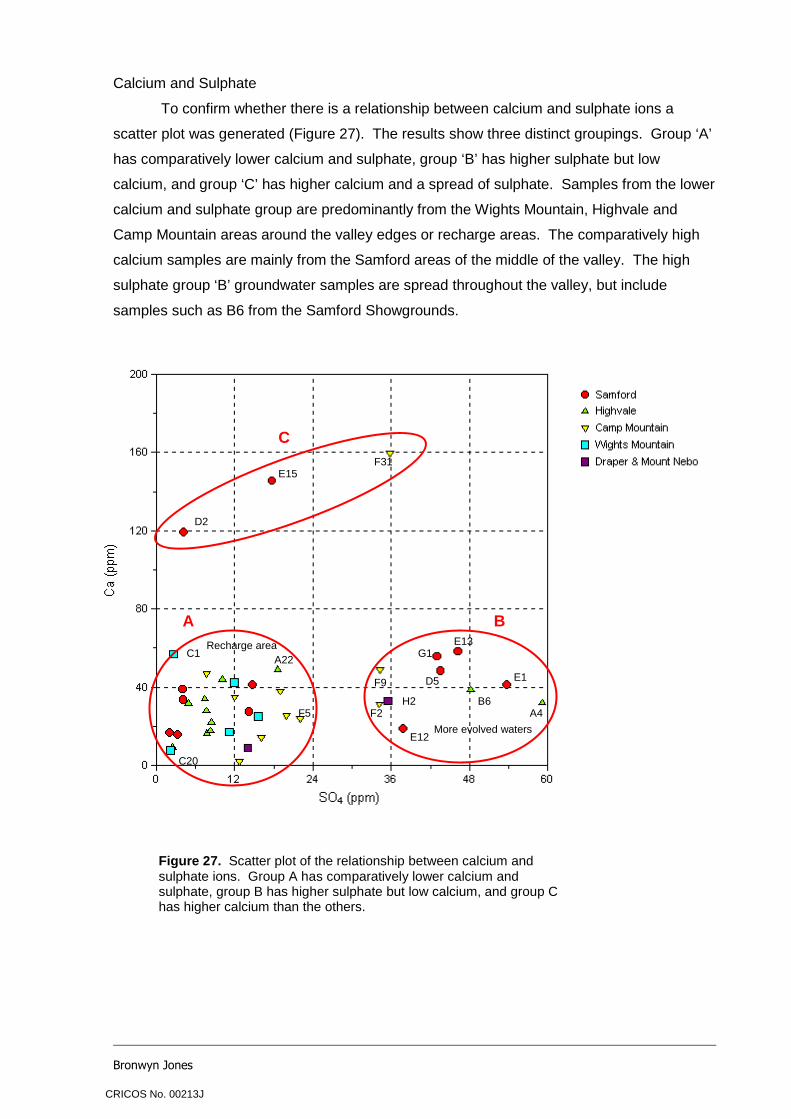
Calcium and Sulphate
To confirm whether there is a relationship between calcium and sulphate ions a
scatter plot was generated (Figure 27). The results show three distinct groupings. Group ‘A’
has comparatively lower calcium and sulphate, group ‘B’ has higher sulphate but low
calcium, and group ‘C’ has higher calcium and a spread of sulphate. Samples from the lower
calcium and sulphate group are predominantly from the Wights Mountain, Highvale and
Camp Mountain areas around the valley edges or recharge areas. The comparatively high
calcium samples are mainly from the Samford areas of the middle of the valley. The high
sulphate group ‘B’ groundwater samples are spread throughout the valley, but include
samples such as B6 from the Samford Showgrounds.
Figure 27. Scatter plot of the relationship between calcium and sulphate ions. Group A has comparatively lower calcium and sulphate, group B has higher sulphate but low calcium, and group C has higher calcium than the others.
E15
D2
F31
F9
A4
E12
B6
C1 A22
C20
E13
F5
E1 D5
G1
H2 F2
Recharge area
More evolved waters
C
A B
CRICOS No. 00213J
Bronwyn Jones
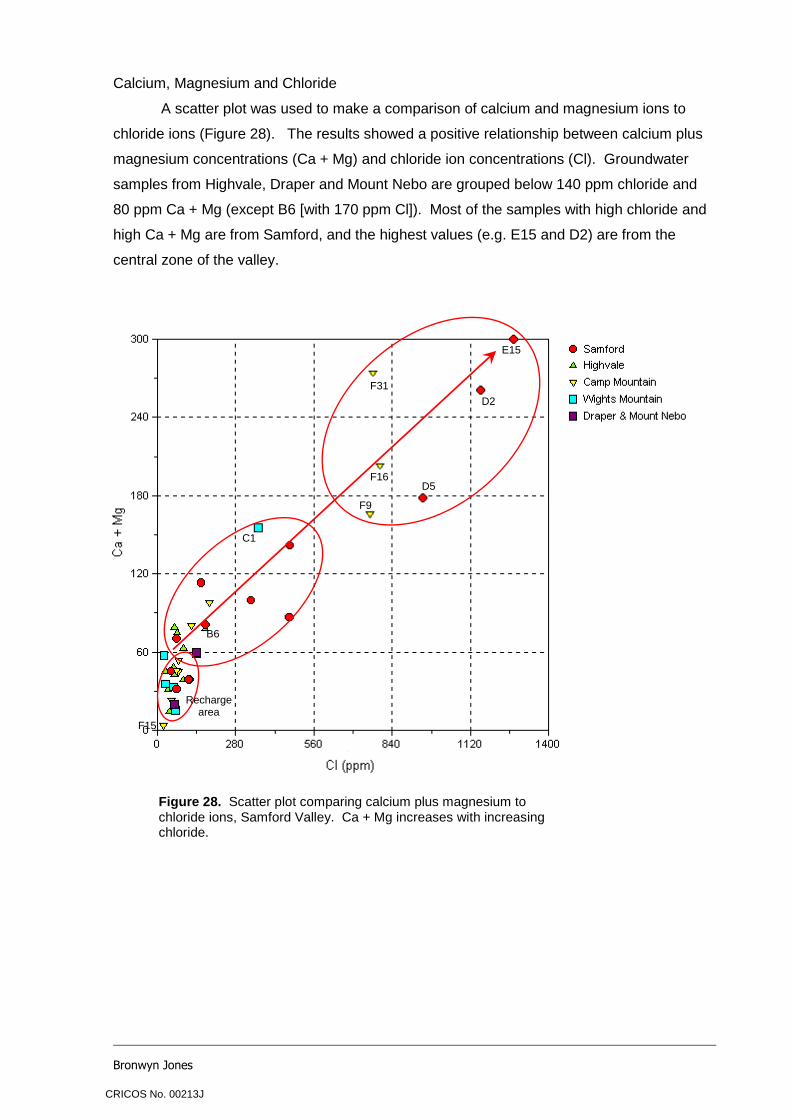
Calcium, Magnesium and Chloride
A scatter plot was used to make a comparison of calcium and magnesium ions to
chloride ions (Figure 28). The results showed a positive relationship between calcium plus
magnesium concentrations (Ca + Mg) and chloride ion concentrations (Cl). Groundwater
samples from Highvale, Draper and Mount Nebo are grouped below 140 ppm chloride and
80 ppm Ca + Mg (except B6 [with 170 ppm Cl]). Most of the samples with high chloride and
high Ca + Mg are from Samford, and the highest values (e.g. E15 and D2) are from the
central zone of the valley.
F15
F31
D2
E15
F16 D5
F9
Figure 28. Scatter plot comparing calcium plus magnesium to chloride ions, Samford Valley. Ca + Mg increases with increasing chloride.
Recharge area
B6
C1
CRICOS No. 00213J
Bronwyn Jones
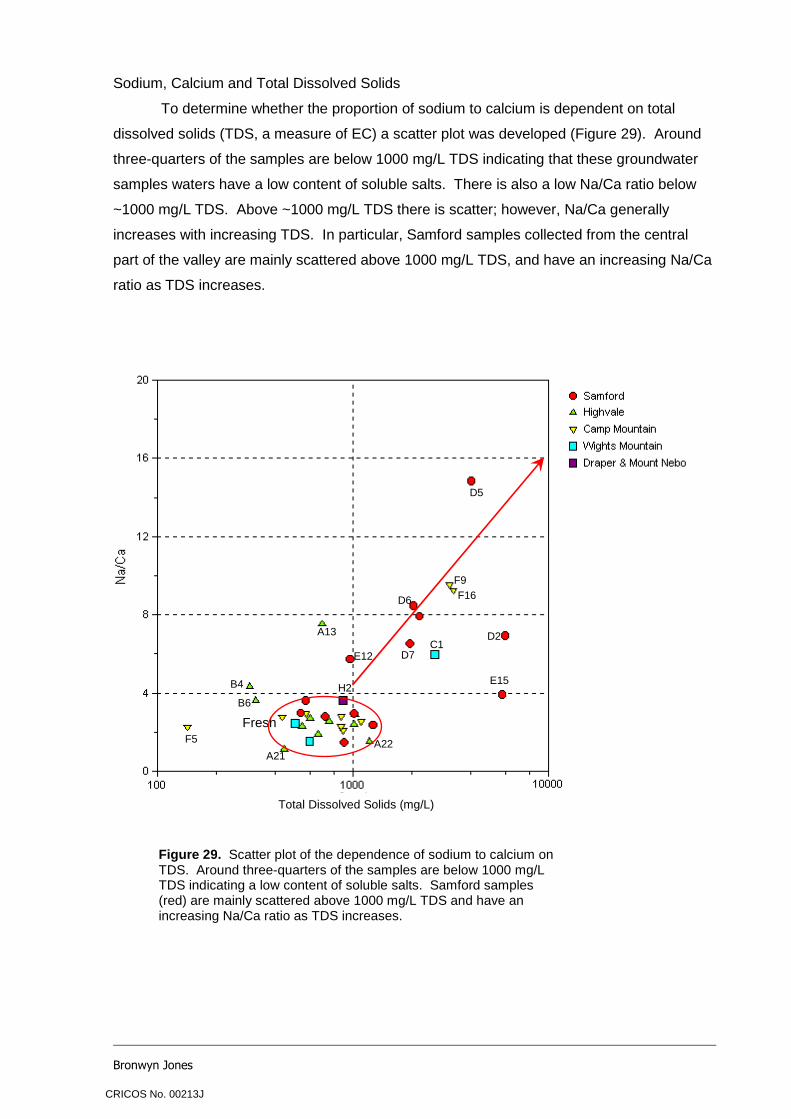
Sodium, Calcium and Total Dissolved Solids
To determine whether the proportion of sodium to calcium is dependent on total
dissolved solids (TDS, a measure of EC) a scatter plot was developed (Figure 29). Around
three-quarters of the samples are below 1000 mg/L TDS indicating that these groundwater
samples waters have a low content of soluble salts. There is also a low Na/Ca ratio below
~1000 mg/L TDS. Above ~1000 mg/L TDS there is scatter; however, Na/Ca generally
increases with increasing TDS. In particular, Samford samples collected from the central
part of the valley are mainly scattered above 1000 mg/L TDS, and have an increasing Na/Ca
ratio as TDS increases.
Figure 29. Scatter plot of the dependence of sodium to calcium on TDS. Around three-quarters of the samples are below 1000 mg/L TDS indicating a low content of soluble salts. Samford samples (red) are mainly scattered above 1000 mg/L TDS and have an increasing Na/Ca ratio as TDS increases.
Total Dissolved Solids (mg/L)
Fresh
D5
H2
D2
E15
C1
F5
F9 F16
B4
A13
B6
A21 A22
D6
D7 E12
CRICOS No. 00213J
Bronwyn Jones
DISCUSSION
Bore Yield and Permeability
The contour map of estimated bore yield indicates higher permeability and flow (>0.5
L/sec) towards the margins of the valley floor (Figure 19). Areas of higher yield in the valley
imply greater shallow permeability produced by the fractured or weathered granodiorite
(Dewandel et al., 2006). These areas are also likely to contain groundwater under a higher
hydraulic head (Stober and Bucher, 2007). Central to the valley and extending to its mouth
in the northeast is a lower permeability zone with yields of <0.25 L/sec. A reason may be
that large fractures that drain the porous weathered rock are connected to the high yielding
bores at the valley edges, whereas the central zone may have deeper permeability, or
possibly reduced permeability as a result of the long weathering history of the granodiorite
(Davis and DeWiest, 1991). Bore D4, for example, is found in the central zone and has the
thickest weathering zone of the valley (29 m thick). The prolonged weathering and removal
of both biotite and plagioclase must have resulted in significant amounts of silica (quartz),
kaolinite and other clay minerals left as remnant material, which would have reduced the
available permeability (e.g. by kaolinisation) (Dewandel et al., 2006). There may also be fine
clays deposited into fracture systems. Furthermore, the bores in the permeable zones will be
more likely to provide less-mineralised groundwater than less-permeable zones, due to a
shorter period of groundwater contact with the aquifer materials (Al-Khashman, 2007). In
addition, the less-permeable zone in the south-southwest can be related to hornfels in the
contact metamorphic zone (Figure 8).
Interestingly, Davis and DeWiest (1991) found topography is an important indication
of bore yield, whereby bores in flat areas and in gullies tend to produce larger amounts of
water than bores on hill tops, because groundwater drains to points of discharge in low lying
areas. The local drillers in Samford Valley also tend to drill groundwater bores in gullies and
in the weathered zone to <20 m, and have stated that hard granite, and high elevations up-
gully tend to provide limited amounts of water. However, the bore yield maps have shown
that the elevated areas (e.g. in the north of the valley) do not produce limited amounts of
water, possibly due to a higher hydraulic head of the water table with higher elevations in the
valley. Furthermore, there may not be a significant influence of topography on bore yield in
Samford Valley because granitic terrains have extreme spatial variability in hydraulic
conductivity (Cook, 2003). For example, extensive networks of connected fractures around
the edges of the valley may be draining weathered rock to provide the high yields (Davis and
DeWiest, 1991). Hence, high bore productivity in most granitic terrains may simply depend
on the luck of drilling into a fracture or highly weathered zone, rather than any influence of
topography. Nevertheless, on smaller scale areas of the valley floor, it is possible the
CRICOS No. 00213J
Bronwyn Jones
topography (bore elevation) may influence the yield or performance of some bores (as Davis
and DeWiest [1991] suggested), because Van Genderen (1966) noted in his soil, slope and
landuse study of the area that the depressions and concave slopes of the valley tend to
accumulate water, while the mounds and convex surfaces shed water.
Watertable
The watertable surface has an overall mean gradient of ~10 m/km towards the
northeast (Figure 21), which follows the overall mean slope of the topography in the valley (of
~10 m/km towards the northeast). Therefore, the differences in the surface topography are
mirrored in the changes of the watertable, and the groundwater flow system has developed
driven by a watertable surface that is a subdued replica of the land surface (Umar, 2006;
Huggett, 2003; Sophocleous, 2002). A scatter plot also confirms that topography (based on
bore elevations in m ASL) does influence the watertable as evidenced by the increasing
linear trend (Figure 30 below).
A very steep watertable gradient often reflects low permeability (Stober and Bucher,
2007). The steep gradient of the watertable in the south-southwest therefore reflects the low
permeability of the hornfels in the contact metamorphic zone. The lower watertable
gradients in the south-southeast and north reflect the highest bore yields and greatest
shallow permeability of the valley. However, the low watertable gradient in the centre of the
valley reflects a reduced permeability zone, possibly as a result of the long weathering
history of the granodiorite, formation of clay material and kaolinisation (Dewandel et al.,
2006). Furthermore, the north-northeastern edge of the valley has a steep watertable
gradient, high watertable elevations and higher magnitude of flow than other areas of the
valley (Figure 22, Figure 23); however, high bore yields and shallow permeability are in the
northern section (Figure 19). The higher elevations of the watertable in the north-northeast
of the valley may indicate a high hydraulic head related to recharge, possibly with networks
of connected fractures, which would provide the higher bore yields and high permeability
(Davis and DeWiest, 1991).
Besides topography, other major factors controlling the water level may be the
amount of rainfall, evaporation and pumping of bores. For example, during drought the water
table tends to flatten out (ADITC, 1992). The main sources of recharge for groundwater in
the area are direct precipitation, groundwater flow, infiltration, and seepage from South Pine
River. Recharge in the west of the valley would be rainfall, especially since rainfall is higher
due to an orographic effect. The east would mainly be receiving infiltration and groundwater
flow.
CRICOS No. 00213J
Bronwyn Jones
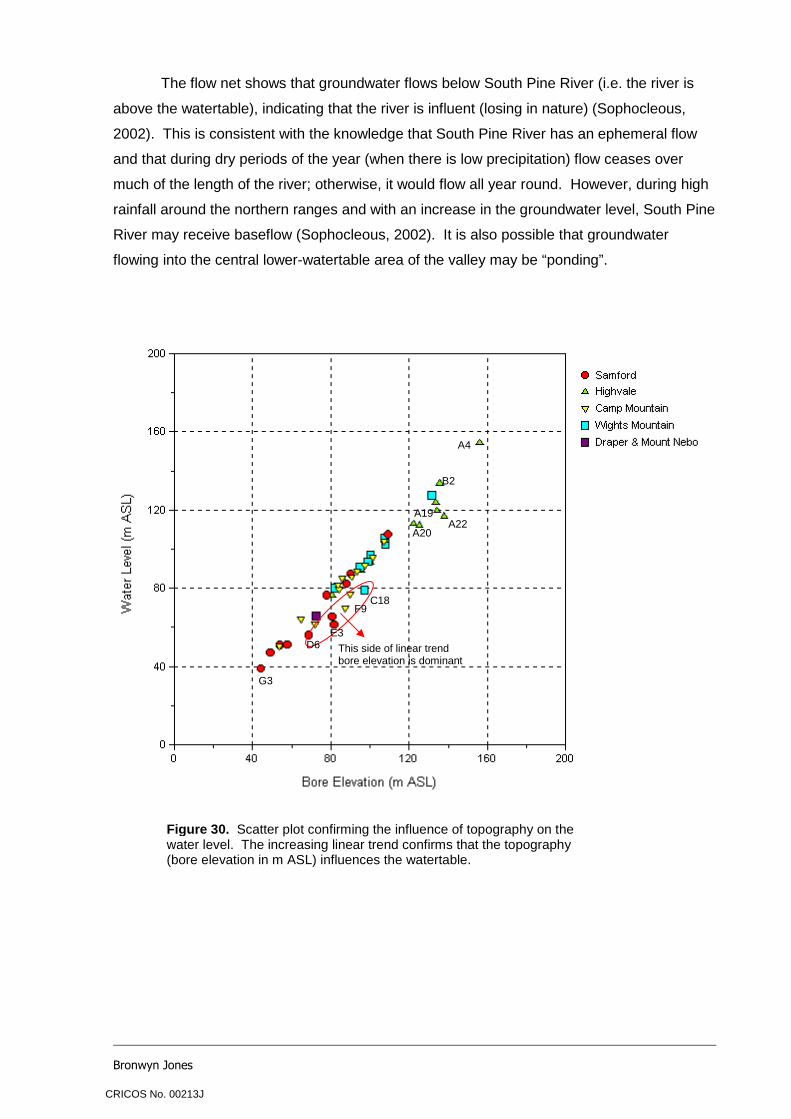
The flow net shows that groundwater flows below South Pine River (i.e. the river is
above the watertable), indicating that the river is influent (losing in nature) (Sophocleous,
2002). This is consistent with the knowledge that South Pine River has an ephemeral flow
and that during dry periods of the year (when there is low precipitation) flow ceases over
much of the length of the river; otherwise, it would flow all year round. However, during high
rainfall around the northern ranges and with an increase in the groundwater level, South Pine
River may receive baseflow (Sophocleous, 2002). It is also possible that groundwater
flowing into the central lower-watertable area of the valley may be “ponding”.
Figure 30. Scatter plot confirming the influence of topography on the water level. The increasing linear trend confirms that the topography (bore elevation in m ASL) influences the watertable.
This side of linear trend bore elevation is dominant
C18
A4
B2
A22 A20
G3
F9
A19
E3 D6
CRICOS No. 00213J
Bronwyn Jones
Groundwater pH
Rainfall in the Brisbane region is acidic from CO2 and typically has a pH of 4.5 to 5.5
(Cox et al., 1996). The groundwaters with more direct recharge and low electrical
conductivity (such as at Mount Nebo) typically have a slightly acid pH of 5.8 to 6.7 (Figure
14); the migration of groundwater towards the centre of the valley has produced more
alkaline-natured water with a pH of up to ~8 (Figure 15).
The low EC of the recharging rainwater reflects the low content of total dissolved
solids or soluble salts (Water Commission, 1988). The increase in alkalinity of the measured
pH values in groundwater samples distributed towards the centre of the valley is attributed to
an increase in the amount of bicarbonate in the groundwater (as evidenced by the correlation
between pH and bicarbonate [Figure 15]). Bicarbonate is derived from carbon dioxide (CO2)
dissolved in rainwater in the atmosphere or extracted from the air through natural weathering
(Al-Khashman, 2007). Hiscock (2005) also states that dissolved carbon dioxide (CO2) in the
groundwater produces a weakly acidic solution of carbonic acid (H2CO3), which promotes the
weathering of silicate minerals. Thus, the weathering of silicate minerals such as augite in
the granodiorite over time may have released Ca2+ and HCO3– ions to the groundwater,
resulting in an increase in pH (Locsey and Cox, 2003). It is also possible that the cement
grout used during construction of the bore, which is composed of a limestone-clay mixture
(that forms concrete when mixed with water, sand and aggregate), may have leached and
raised the pH and alkalinity for a few bores (ADITC, 1992).
Elevated pH and alkalinity is an indication of mature groundwater (Banks et al.,
1998), thus this initially indicates that the groundwaters in the centre of the valley may be
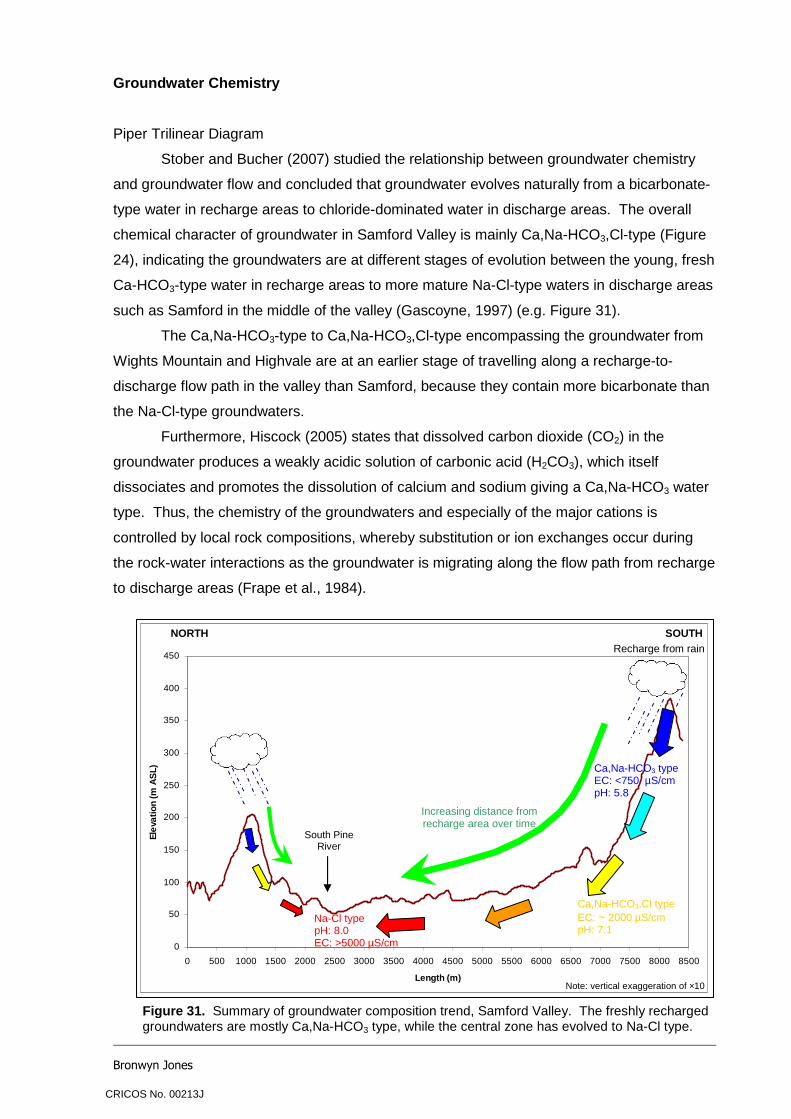
Stober and Bucher (2007) studied the relationship between groundwater chemistry
and groundwater flow and concluded that groundwater evolves naturally from a bicarbonate-
type water in recharge areas to chloride-dominated water in discharge areas. The overall
chemical character of groundwater in Samford Valley is mainly Ca,Na-HCO3,Cl-type (Figure
24), indicating the groundwaters are at different stages of evolution between the young, fresh
Ca-HCO3-type water in recharge areas to more mature Na-Cl-type waters in discharge areas
such as Samford in the middle of the valley (Gascoyne, 1997) (e.g. Figure 31).
The Ca,Na-HCO3-type to Ca,Na-HCO3,Cl-type encompassing the groundwater from
Wights Mountain and Highvale are at an earlier stage of travelling along a recharge-to-
discharge flow path in the valley than Samford, because they contain more bicarbonate than
the Na-Cl-type groundwaters.
Furthermore, Hiscock (2005) states that dissolved carbon dioxide (CO2) in the
groundwater produces a weakly acidic solution of carbonic acid (H2CO3), which itself
dissociates and promotes the dissolution of calcium and sodium giving a Ca,Na-HCO3 water
type. Thus, the chemistry of the groundwaters and especially of the major cations is
controlled by local rock compositions, whereby substitution or ion exchanges occur during
the rock-water interactions as the groundwater is migrating along the flow path from recharge
to discharge areas (Frape et al., 1984).
Figure 31. Summary of groundwater composition trend, Samford Valley. The freshly recharged groundwaters are mostly Ca,Na-HCO3 type, while the central zone has evolved to Na-Cl type.
Recharge from rain
Na-Cl type pH: 8.0 EC: >5000 µS/cm
Ca,Na-HCO3 type EC: <750 µS/cm pH: 5.8
Ca,Na-HCO3,Cl type EC: ~ 2000 µS/cm pH: 7.1
Increasing distance from recharge area over time
NORTH SOUTH
South Pine River
Note: vertical exaggeration of ×10
CRICOS No. 00213J
Bronwyn Jones
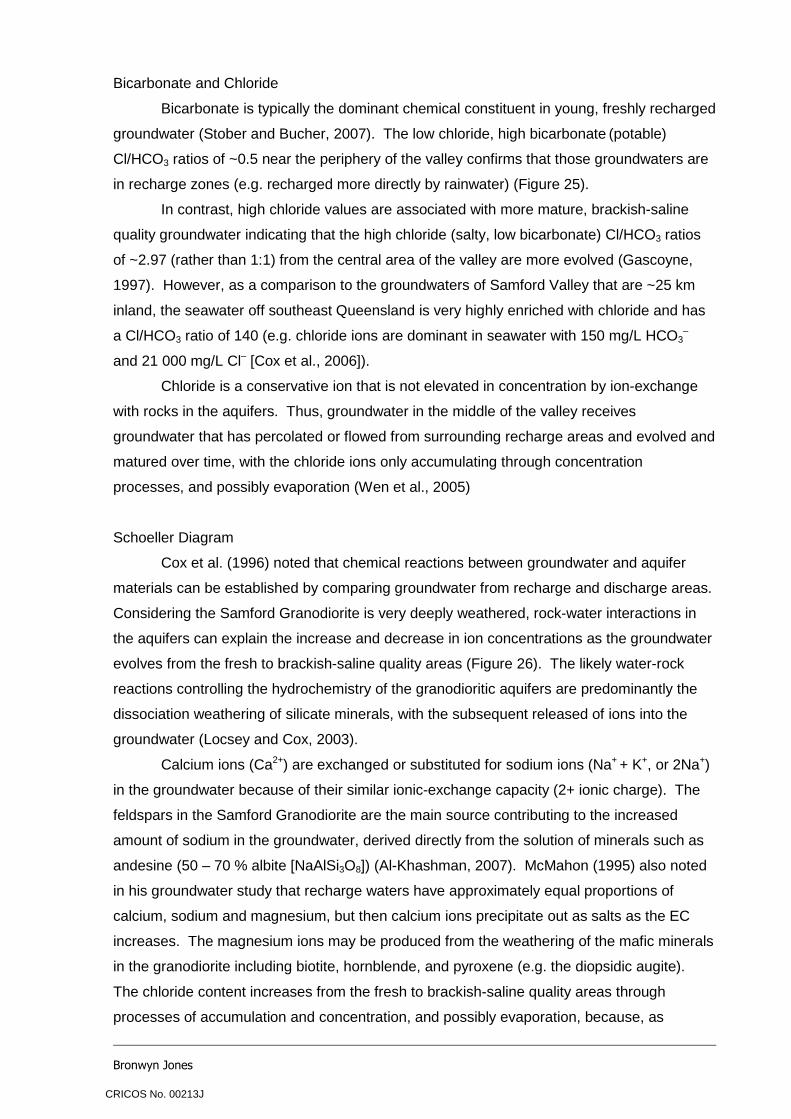
Bicarbonate and Chloride
Bicarbonate is typically the dominant chemical constituent in young, freshly recharged
groundwater (Stober and Bucher, 2007). The low chloride, high bicarbonate (potable)
Cl/HCO3 ratios of ~0.5 near the periphery of the valley confirms that those groundwaters are
in recharge zones (e.g. recharged more directly by rainwater) (Figure 25).
In contrast, high chloride values are associated with more mature, brackish-saline
quality groundwater indicating that the high chloride (salty, low bicarbonate) Cl/HCO3 ratios
of ~2.97 (rather than 1:1) from the central area of the valley are more evolved (Gascoyne,
1997). However, as a comparison to the groundwaters of Samford Valley that are ~25 km
inland, the seawater off southeast Queensland is very highly enriched with chloride and has
a Cl/HCO3 ratio of 140 (e.g. chloride ions are dominant in seawater with 150 mg/L HCO3–
and 21 000 mg/L Cl– [Cox et al., 2006]).
Chloride is a conservative ion that is not elevated in concentration by ion-exchange
with rocks in the aquifers. Thus, groundwater in the middle of the valley receives
groundwater that has percolated or flowed from surrounding recharge areas and evolved and
matured over time, with the chloride ions only accumulating through concentration
processes, and possibly evaporation (Wen et al., 2005)
Schoeller Diagram
Cox et al. (1996) noted that chemical reactions between groundwater and aquifer
materials can be established by comparing groundwater from recharge and discharge areas.
Considering the Samford Granodiorite is very deeply weathered, rock-water interactions in
the aquifers can explain the increase and decrease in ion concentrations as the groundwater
evolves from the fresh to brackish-saline quality areas (Figure 26). The likely water-rock
reactions controlling the hydrochemistry of the granodioritic aquifers are predominantly the
dissociation weathering of silicate minerals, with the subsequent released of ions into the
groundwater (Locsey and Cox, 2003).
Calcium ions (Ca2+) are exchanged or substituted for sodium ions (Na+ + K+, or 2Na+)
in the groundwater because of their similar ionic-exchange capacity (2+ ionic charge). The
feldspars in the Samford Granodiorite are the main source contributing to the increased
amount of sodium in the groundwater, derived directly from the solution of minerals such as
in his groundwater study that recharge waters have approximately equal proportions of
calcium, sodium and magnesium, but then calcium ions precipitate out as salts as the EC
increases. The magnesium ions may be produced from the weathering of the mafic minerals
in the granodiorite including biotite, hornblende, and pyroxene (e.g. the diopsidic augite).
The chloride content increases from the fresh to brackish-saline quality areas through
processes of accumulation and concentration, and possibly evaporation, because, as
CRICOS No. 00213J
Bronwyn Jones
mentioned in the previous section, chloride ions are not elevated in concentration by ion-
exchange in rocks (Wen et al., 2005).
In addition to the rock-water ionic-exchanges as groundwater migrates, the
composition or quality of the source (recharge) water may also influence the hydrochemistry
(Misra and Mishra, 2006). Considering a rainfall source in Samford Valley (Figure 5), a
prevailing wind and rain from the coming from the southeast direction of the coast may be
depositing slightly more sodium and chloride than rain falling in the northwestern ranges
(where rainfall is ~1400 mm/year). The minute quantities of Cl–, Na+ and other salts
dissolved in the rainwater from the coast would be added to the groundwater in the southeast
and east of the valley, thus influencing the groundwater chemistry to a degree (Misra and
Mishra, 2006). Conversely, the concentration of salts in the northwestern ranges rainfall may
be negligible and the recharge source would contain a higher proportion of bicarbonate.
Calcium and Sulphate
Highvale, Wights Mountain and Camp Mountain around the valley edges
predominantly have relatively lower calcium and sulphate than central areas of the valley
(Figure 27). These are recharge areas because fresh, geochemically immature recharge
waters are calcium-bicarbonate-type but increase in calcium and accumulate more sulphate
only as the groundwaters evolve as they flow from recharge to discharge areas (Ophori and
Toth, 1989).
The much higher calcium groundwaters in the centre of the valley are largely due to
an accumulation of calcium ions over time. The groundwater has flowed slowly from the
recharge areas and calcium has become concentrated due to the long residence times, and
possibly by evaporation of the shallow groundwater. It is also possible that the high calcium
is artificial, and that cement grout (a limestone-clay mixture) used during construction of the
bore, may have leached minor amounts of calcium ions to the groundwater in a few bores
(ADITC, 1992).
The comparatively high sulphate in the groundwater from the Samford areas of the
middle of the valley is either from a lithological source (e.g. pyrite-derived sulphate), or
possibly due to anthropogenic activities (Al-Khashman, 2007). Hiscock (2005) and Ophori
and Toth (1989) have stated that groundwaters tend to have higher sulphate the further they
have travelled long a flow path, and in the valley, groundwater flows from peripheral recharge
areas towards higher sulphate areas around the central zone and Samford. The oxidation of
sulphide minerals during groundwater migration can serve as a lithological source of
sulphate (SO42–). Pyrite (FeS2) is commonly a minor accessory mineral in igneous rocks and
its oxidation in the aquifers may have contributed to the higher sulphate levels in some areas
(Al-Khashman, 2007). Gradwell (1955) also suggested that there may be minor pyrrhotite
(Fe1–xS [x = 0 – 0.2]) in association with the magnetite in the Samford Granodiorite.
CRICOS No. 00213J
Bronwyn Jones
Some groundwaters in the area may have suffered sulphate contamination,
especially considering horses or livestock are allowed in the immediate vicinity of the
boreholes on many properties. The Samford showgrounds is one such location where
sulphate is relatively high and horses regularly train. Thus, in these areas the horses are
generating manure, which contains sulphur (a portion of which is readily available as
sulphate) that may be washed into the groundwater. However, considering only Samford
Village is connected to a sewerage system and the remainder of the valley uses some form
of septic system, the elevated sulphate ions are most likely due to percolation from septic
tanks or domestic effluents. It is known that the surface waters of Samford Creek and South
Pine River are degraded with nutrients and coliform bacteria (Figure 32; Nolte and Loose,
2004), and human faecal material contains large numbers of coliform bacteria and sulphur,
which supports the conclusion that the higher sulphate content in some groundwaters may
be non-lithological, from leaking septic tanks.
Figure 32. The degraded upper reaches of Samford Creek, Samford Valley. The creek is of poor water quality and degraded with nutrients and coliform bacteria. Blue-green algae (cyanobacteria) such as Nostoc sp. are abundant (Nolte and Loose, 2004).
CRICOS No. 00213J
Bronwyn Jones
Calcium, Magnesium and Chloride
Calcium and magnesium ions increased in concentration in the groundwater with
increasing chloride (Figure 28), reflecting that as the groundwater evolves towards the centre
of the valley, Ca2+ and Mg2+ ions in the groundwater may be derived from secondary
sources, such as rock-water interactions (Wen et al., 2005). The chloride ions concentrate in
groundwater along flowpaths over time, and the feldspars, calcic-magnesium silicates, and
clay minerals within the deeply weathered granodiorite are substituting or exchanging ions to
account for the increase in Ca2+ and Mg2+ as the groundwater migrates (Trainer, 1988).
Calcium and magnesium salts would also be precipitating as the groundwater becomes
saturated with the ions (Stober and Bucher, 2007).
In addition, Misra and Mishra (2006) found from their study in India that the
concentrations of some chemical constituents can escalate in an aquifer with time, especially
with low precipitation and high evaporation. The high calcium and magnesium “hard”
groundwaters at the lower topographic elevations in the centre of the valley may be reflecting
the effect of evaporation.
Sodium, Calcium and Total Dissolved Solids
The recharge groundwaters around the margins of the valley have a lower amount of
total dissolved solids and are less hard than groundwaters further down flow (Figure 29). As
flow towards the low-lying areas may be slow (e.g. compared to surface water), the
groundwater is in contact with the weathered granodioritic material for a long time, and
soluble salts in the weathered granodiorite are dissolved and carried in the groundwater in
solution (Wen et al., 2005). Thus, groundwater carries more total dissolved solids (TDS)
over time, which results in brackish-saline and “hard” waters (high in calcium and magnesium
carbonates) (ADITC, 1992). Higher amounts of TDS in the central zone of the valley may
also be from salts concentrated in the shallow groundwater by evaporation.
Therefore, at the early stages of groundwater evolution, the fresh, geochemically
immature Ca-HCO3-type water from around the edges of the valley has a low content of
soluble salts (Rao et al., 1997). During migration downslope along flow paths towards the
middle of the valley, the initial low mineralisation gradually increases as Na+ replaces Ca2+ in
solution, evolving the groundwater to a more highly Na-HCO3 and Na-Cl-type (high Na/Ca
ratio) water (Hiscock, 2005; Stober and Bucher, 2007).
CRICOS No. 00213J
Bronwyn Jones
Distribution of Salinity
Electrical conductivity (EC) reflects the amount of soluble salts in a water sample, and
is one way of measuring salinity (Water Commission, 1988). About two-thirds of
groundwater in the valley has an EC below 2000 µS/cm, predominantly at higher water table
elevations towards the margins of the valley (Figure 17, Figure 18), indicating that these
waters have a low content of soluble salts, supporting more direct recharge (Rao et al.,
1997). The low EC recharging rainwater groundwater has filled fracture systems around the
edges of the valley and is being extracted before it has been allowed to percolate to any
great depth or distance (Sukhija et al., 2006). In contrast, the groundwater in the centre of
the valley has flowed there over time and evolved to be more geochemically mature and
hence more saline than the young, fresh, immature and generally good quality recharge
groundwaters around the margins of the valley.
There are several further explanations for the elevated EC central to the valley.
Dissolved salts occur naturally in groundwater, and although the conductivity test does not
identify the particular salts involved, the major ions responsible for the salinity are usually
Na+, K+, Ca2+, Mg2+ and Cl– (Misra and Mishra, 2006). The origin of the salinity (high EC) is
also the result of rock-water interactions, and ion exchanges due to a long period of contact
with rocks and minerals (Al-Khashman, 2007). The results from the hydrogeology of
Samford Valley revealed that, in general, the areas in the centre of the valley (with the
highest EC values), such as around bore D4 have the thickest weathered zone (29 m thick).
Thus, the abundant silicate minerals, feldspars and clay minerals within the deeply
weathered granodiorite have undergone ion-exchange and weathered to solution. In
particular, the amount of sodium ions has been elevated as the groundwater travels along
the flow paths to the low lying area. Thus, the salinity of the groundwater in the central part
of the valley is mainly due to the accumulation of the salts, as a result of rock-water
interactions, by the continual movement of groundwater flowing towards and through the
central lower-elevation area and concentrating dissolved ions (Rao et al., 1997).
Low precipitation and high evaporation are also dominant processes determining the
water composition and enhancing salinity (Wen et al., 2005). Misra and Mishra (2006)
determined in their hydrochemical study in India that salinity and some chemical constituents
(namely Na, Cl, TDS, K, F) can escalate with time in the aquifer, especially with low
precipitation and high evaporation. This is because when moisture is evaporated from the
shallow unsaturated zone, the remaining water is concentrated with dissolved ions from
chemical weathering, leading to the precipitation of salts and enhanced salinity (Sreedevi et
al., 2006). The low precipitation and slow groundwater flow in the present study area may
have therefore made the groundwater more prone to enhanced evaporation and salinisation
(Misra and Mishra, 2006).
CRICOS No. 00213J
Bronwyn Jones
CONCLUSIONS
In Samford Valley, groundwater occurs under unconfined or semi-confined conditions
and the aquifers are mainly in highly weathered or fractured granodiorite. There is a central
zone of salinity, with associated Na-Cl-type groundwater, elevated pH, high amount of total
dissolved solids (TDS), comparatively higher sulphate content, and high Cl–/HCO3– ratios, all
indicative of mature and evolved groundwater. The central zone of mature, saline
groundwater is attributed to the accumulation of salts as the groundwater evolved along
flowpaths from the higher-elevation recharge areas at the edges of the valley to the low lying
central discharge area. The salts are a product of rock-water interactions and ion exchanges
within the feldspars, silicate minerals and clay minerals of the deeply weathered granodioritic
aquifers, which have concentrated in the centre of the valley over time. It has also been
concluded that the low rainfall and high evaporation climatic conditions have enhanced
salinity over time.
The results also suggested that the low EC, fresh, bicarbonate-type groundwater in
fracture systems around the edges of the valley is recharging more directly from rainwater
and is extracted early in its migration. Thus, the Ca,Na-HCO3-type to Ca,Na-HCO3-Cl-type
groundwaters have not evolved far from the fresh rainwater that recharged them.
The groundwater flow is driven by a gently sloping watertable that is influenced by the
surface topography, whereby groundwater flows from the margins of the valley, towards and
through the central area, out of the valley mouth, and discharges into South Pine River in the
northeast. It is possible that the central low-watertable area may be ponding groundwater.
Shallow permeability and bore yields are highest around the valley edges and lowest
in the central zone, however the thickest weathered zone is in the centre of the valley. The
prolonged in situ weathering history of the granodiorite and the formation of silica, kaolinite
and clays as remnant material may have reduced shallow permeability in the centre of
Samford Valley. Connective fracture systems draining the porous weathered rock have
contributed to the high permeability and high yield of the bores around the northern and
southern valley edges.
Overall, useful information was gained with respect to the chemical quality, chemical
variations, bore yields and occurrence of the groundwater in the valley. This groundwater
study has provided important groundwater resource maps, including maps of the generalised
distribution of shallow permeability and salinity, which will allow a better assessment of the
potential groundwater resources of the valley. Most importantly, a comprehensive
groundwater bore inventory for Samford Valley was compiled, and it will be a useful record or
reference for future studies. Further studies may be needed in order to assess the relative
importance of the findings of this groundwater study, so that the local resource can be
managed for the future.
CRICOS No. 00213J
Bronwyn Jones
REFERENCES
AL-KHASHMAN, O. 2007. Study of water quality of springs in Petra region, Jordan: A
three-year follow-up. Water Resource Management. 21, 1145 – 1163.
AUSTRALIAN DRILLING INDUSTRY TRAINING COMMITTEE (ADITC). 1992. Australian
Drilling Manual, Third Edition. J. S. McMillan Publishing, Australia.
BANKS, D., REIMANN, C., & SKARPHAGEN, H. 1998. The comparative hydrochemistry of
two granitic island aquifers: The Isles of Scilly, UK and the Hvaler Islands, Norway.
The Science of the Total Environment. 209, 169 – 183.
BUREAU OF METEOROLOGY. 2007. Climate Averages for Australian Sites – Averages for
Samford CSIRO. Commonwealth of Australia.
COOK, P. G. 2003. A guide to Regional Groundwater Flow in Fractured Rock Aquifers.
CSIRO Land and Water, South Australia.
COSSER, P.R. 1989. Nutrient Concentration-Flow Relationships and Loads in the South
Pine River, South-eastern Queensland. I. Phosphorous Loads. Australian Journal of
Marine and Freshwater Resources. 40, 613 – 630.
COX, M. E., HILLIER, J., FOSTER, L., & ELLIS, R. 1996. Effects of a rapidly urbanising
environment on groundwater, Brisbane, Queensland, Australia. Hydrogeology
Journal. 4 (1), 30 – 47.
CRANFIELD, L. C., SCHWARZBOCK, H., & DAY, R. W. 1976. Geology of the Ipswich and
Other Possible Bores in Samford Valley Table……………….………………………………………………….77
CRICOS No. 00213J
Bronwyn Jones
REGISTRATION TABLE
INTRODUCTION
The records in the registration table give general registration details of the bore.
Column Names
Bore
Government Registered Number (RN)
Property Name
Field Location
Lot
Office
Shire Code
Parish
Post Code
County
Basin
Facility Type
Facility Status
District Office File Number
Regional Office File Number
Head Office File Number
File ID
Object ID
Map Scale
Map Series
Map Number
Registered Plan (RP)
Original Description
Driller Name
Drilling Company
Driller Licence Number
Drilled Date
Log Rec Date
Method of Construction
Present Equipment
Original Bore Name
Bore Role
Confidential
Data Owner
CRICOS No. 00213J
Bronwyn Jones
Formation Name
Created By
Created Date
Updated By
Updated Date
Elevation
Bore
The bore column is the identifier common to all the tables and maps. It allows the rows in different
tables for a particular bore to be linked together. The bore values were determined as follows:
A1 - An = Bores in Highvale South of Mount Glorious Road
B1 - Bn = Bores in Highvale North of Mount Glorious Road
C1 - Cn = Bores in Wights Mountain
D1 - Dn = Bores in Samford Valley South of Mount Glorious Road
E1 - En = Bores in Samford Valley North of Mount Glorious Road
F1 - Fn = Bores in Camp Mountain
G1 - Gn = Bores in Samford Village & bores in Samford Valley to the East of
Samford Road/Main Street
H1 - Hn = Other Bores, e.g. in Draper, Mt Nebo.
Government Registered Number (RN)
The government registered number is unique. Each bore, even those on the same property, are all
allocated a five or six number Registration Number (RN).
E.g.
The following list shows the Registered Number block for a few offices (30/10/2003):
Brisbane 120000 - 120999
Gatton 106000 - 106999
Oil Bores 100000 - 101999
Toowoomba 119000 - 119999
Property Name
This stores the name of the person/people who are at the property on which the bore is situated. It
can prove useful in finding all bores located on the one property. The name is either of the
person/people living at the property where the bore is located, the name of the person who owns the
property, or the person who was originally living at that address when the bore was drilled.
Field Location
The field location is used to help locate the bore in the field. It may be the residential address of the
land or property on which the bore is located, or a landmark that the bore is near.
CRICOS No. 00213J
Bronwyn Jones
Lot
The lot is the number of the lot on a registered plan on which the bore is located.
Office
The office bore data is administered by each regional office. This column is a compulsory field in the
database. E.g. BNE = Brisbane
Shire
A shire represents an area of Local Government in Queensland. Each shire is named and given a
number.
Parish
The parish is required to define the location of a bore. It is necessary to code parish because there is
a number of parishes in Queensland with the same name.
E.g. 3749 = Parker,
4150 = Samford
Post Code
The post code is of the region where the bore is located.
County
The county is required to define the location of a bore. The county will be recorded by name and not
coded because county names are unique.
Basin
The basin is a four-digit number that is consistent with those numbers used by the Department to
define the surface water drainage sub-basins in Queensland. For definition of these drainage sub-
basins you should refer to the Department’s WRC plans, V38883 to V38900, or to Water Resources
basin maps.
Facility Type
This column is required to describe the type of bore about which we are recording data. The break-up
is relatively simple in that the basic distinction is between surface water and groundwater bores. A
further break-up of the groundwater bores is whether they are artesian in various conditions or sub-
artesian. This column is a compulsory field in the database.
E.g.
SF = Sub-artesian Bore
AU = Artesian Bore, Uncontrolled Flow
AC = Artesian Bore, Ceased to Flow
CRICOS No. 00213J
Bronwyn Jones
AS = Artesian Bore, Seasonal Flow
Facility Status
The facility status defines whether the bore is proposed, existing, abandoned and destroyed or
abandoned but still useable. The ‘proposed’ status refers mainly to private bores that have not been
constructed. The ‘existing’ status is important for both private and Commission bores. The two states
of abandonment shown in the codes are mainly required for observation bores that are not in use but
could be re-activated easily.
Private bores that are constructed but not equipped are recorded as existing, if the intention is to use
the bore in the future. If the bore is useable but temporarily abandoned such as a stand-by bore or a
replacement bore the facility status should be recorded as abandoned but useable i.e. code ‘AU’. If it
has been destroyed it is coded ‘AD’, abandoned and destroyed.
E.g.
EX = Existing
AD = Abandoned and Destroyed
AU = Abandoned but still useable
PR = Proposed
District Office File Number
The identification of the District Office paper file in which details about the bore are contained is
entered here.
Regional Office File Number
The identification of the Regional Office paper file in which details about the bore are contained is
entered here.
Head Office File Number
The head office file number referring to the bore should be stored here.
File Number
All correspondence regarding the bore should be stored on file and the file number entered into the
GWDB for reference.
Object ID
The object ID is given by the Department of NR&W when the bore from each driller’s logbook is put
on the file, and I haven’t added any new data into this column.
Map Scale
The map scale code is a three-digit number defined in such a way that it will tell you what the actual
scale is. Consider the following examples:
CRICOS No. 00213J
Bronwyn Jones
1. 1:2 500 Scale
The first two digits of the 2 500 are recorded as the first and second digit of the 3 digit number. The
number of trailing zeros after the first two digits is then recorded. i.e. 2 for the above scale. Thus the
code for 1:2 500 is 252.
2. 1:100 00 Scale
The first two digits are 10 and there are three trailing zeros therefore the code will be 103.
For the old ‘Imperial’ type maps that were used to record groundwater details the approach is simply
to use 4ML for four mile.
E.g.
1:2 500 = 252
1:5 000 = 502
1:10 000 = 103
1:25 000 = 253
1:50 000 = 503
1:100 000 = 104
4 Mile Series = 4ML
Map Series
Use this column to record the series the map used to locate the bore belongs.
E.g. M = Metric Series: These are all metric scale maps produced on the
National Mapping System.
Map Number
This is a character field, i.e. accepts both alphabetic and numeric characters. All maps have or should
have a unique identifying formatting of the numbers in this column as required for subsequent
retrieval and grouping of all the bores on a map or plan. Some maps also have names. These names
must not be entered in this column.
E.g.
The smallest scale maps are 1:250 000 and these numbers are 2 letters, 2 digits, a dash and
digits 1 to 16 e.g. SP54-8. All other maps are divisions of the 1:100000 map, which are 4
digits only. The 1:50 000 maps (e.g. 5286-2) are 4 digits, a dash and a number 1, 2, 3 or 4
where the 4 digit number is the 1:100 000 sheet and the numbers 1 to 4 are NE, SE, SW and
NW quarters respectively. Thus a 1:50 000 number looks like 5286-2. 1:25 000 maps are an
extension of the same quartering system. Thus a 1:25 000 number looks like 9443-23. 1:10
000 maps are the next breakdown and would look like 9443-224 and so forth down to the
largest scale produced.
Registered Plan
The plan or registered plan is the number of the plan that contains the lot on which the bore is
located.
CRICOS No. 00213J
Bronwyn Jones
Description
This column is for the Real Property Description of the land on which the bore is located, other than a
lot and registered plan number which is provided for separately. If a lot and registered plan have been
entered in their designated columns, this column may be used to record the original portion number.
It should be noted that it is not a property description of all the land owned; it simply describes the
land on which the bore is located.
Driller Name
This column records the licence number and name of the driller who drilled the initial bore at the site.
The standard format for entering a drillers name is Lastname, Firstname Secondname (eg. Scells,
Neville Graham).
Drilling Company
The drilling company is the name of the company who drilled the initial bore at the site.
Driller Licence
This column records the licence number of the Driller who drilled the initial bore at the site.
Date Drilled
The date drilled is the date on which the drilling of the bore was completed. It stores the initial
completion date and not the date of subsequent deepening’s. The drilled date must not be greater
than the Log Rec Date.
Log Rec Date
This column records the date the drillers log has been received by the departmental office. The format
for the date must be DD/MM/YYYY (eg. 01/01/2005).
Method of Construction
The method used to construct the bore is recorded in this column.
E.g. CABLE TOOL, ROTARY AIR, PICK AND SHOVEL.
Present Equipment
This coded column is to describe the equipment on a bore. Generally it applies to the type of pump.
Allowance has also been made for automatic recorders on observation bores. A code is available for
staff gauges used to record surface water levels in groundwater investigations.
E.g.
SP = Submersible
NE = No equipment/headworks
CL = Centrifugal Pump
JP = Jet or Pressure Pump
CRICOS No. 00213J
Bronwyn Jones
WL = Windmill and Cylinder Pump
WA = Windmill and Cylinder Pump, additional power
OR = Other Pump
AR = Automatic Recorder
HW = Headworks (Artesian Bores)
Original Bore Name
This column mentions the original owner of the bore, if known.
Bore Role
The bore role column stores a comment about the bore role.
E.g. WS = Water Supply
SI = Stratigraphic Investigation
PE = Petroleum or Gas Exploration
ME = Mineral or Coal Exploration
OE = Other Exploration/Investigation
Confidential
A bore which contains details that must not be released to the public is confidential. Any details on
unlicensed bores which have been collected by PWF surveys, or Groundwater Advisory jobs, or
obtained from mining companies (not on open file) fall into the category of confidential. This
information cannot be released, without the owners consent.
Data Owner
The data owner is the organisation that owns all of the data that relates to the bore and is usually
responsible for the collection of that data. Only data belonging to DNR should be released to the
public. E.g. DNR = Department of Natural Resources
Formation Name
Formation Name is the name of the geological unit containing the aquifer being recorded. The source
of data to be entered in this column is the formation name on published maps or in published
documents from either the Bureau of Mineral Resources or the Department of Mines and Energy.
Alluvium is to be treated as a lithological formation. The formation name is to consist of the name of
the river, creek or geographic feature commonly used to describe the alluvium of an area. All
formation names entered into this column are to be validated.
Created By
This column is simply from the original Department of NR&W database and includes the original
entries such ‘GW_LOAD’ and ‘BLS’, no new data has been added into this column.
CRICOS No. 00213J
Bronwyn Jones
Created Date
This column has not been edited or modified from the original Department NR&W database.
Updated By
This column is simply from the original Department NR&W database and includes the original entries
such ‘GW’, and I haven’t added any new data into this column.
Updated Date
This column is simply from the original Department NR&W database and includes the original entries,
and I haven’t added any new data into this column.
Elevation
The elevation value is the elevation of the natural ground surface immediately surrounding the
borehole, either taken by a handheld GPS unit or extracted from a raster Digital Elevation Model
(DEM) of the valley using the bore co-ordinates.
CRICOS No. 00213J
Bronwyn Jones
FIELD WATER QUALITY MEASUREMENT TABLE
INTRODUCTION
This table records water quality measurements that have been taken in the field. This will commonly
be from groundwater pumped straight out of the bore, or from a tap at the bore.
Column Names
Bore
Pipe
Date
Sampling Method
Source
pH
Redox Potential
Conductivity
Quality Remark
Bore
The bore column is the identifier common to all the tables and maps. It allows the rows in different
tables for a particular bore to be linked together. The bore values were determined as follows:
A1 - An = Bores in Highvale South of Mount Glorious Road
B1 - Bn = Bores in Highvale North of Mount Glorious Road
C1 - Cn = Bores in Wights Mountain
D1 - Dn = Bores in Samford Valley South of Mount Glorious Road
E1 - En = Bores in Samford Valley North of Mount Glorious Road
F1 - Fn = Bores in Camp Mountain
G1 - Gn = Bores in Samford Village & bores in Samford Valley to the East of
Samford Road/Main Street
H1 - Hn = Other Bores, e.g. in Draper, Mt Nebo.
Pipe
There can be single or multiple pipe bores. A single pipe refers to one that operates as if it has a
single length of casing. However, by definition in the Groundwater Database, a bore with several
different diameter casings joined concentrically to effectively form a single pipe will be called a single
pipe bore. The single pipe bore is filled in with an ‘A’.
E.g. A = Single Pipe (Operates as, or effectively forms, a single pipe bore)
CRICOS No. 00213J
Bronwyn Jones
Date
The date to be entered is the date on which the field measurement was taken.
Sampling Method
This column describes the method used to collect the sample.
E.g.
PU = Pump - Other or Flowing Bore
PF = Pump – Air Forced
BT = Bailer – Teflon
BA = Bailer – Other
DH = Downhole Probe
XX = Unknown
NR = Not Recorded
Source
This column describes the source of the sample. The available codes are:
GB = Groundwater - Sample from bore
GS = Groundwater - Sample from stream or spring
GR = Groundwater - Sample from remote source eg. Tank, dam
pH
The pH of the groundwater/borewater measured in the field is stored as a number.
Redox Potential (Eh)
The Eh of the groundwater taken in the field is entered here. The data must be entered in the unit of
millivolts (MV).
Conductivity
The conductivity measurement must always be converted to the correct units. The unit is
microSiemens per centimetre (µS/cm) at 25 degrees Celsius (°C).
For conversion of the conductivity measurements to µS/cm at 25 degrees Celsius (°C) from different
temperatures, the conductivity conversion multipliers are as follows:
DEGREES CELSIUS MULTIPLIERS
15 Multiply reported conductivity by 1.2
16 Multiply reported conductivity by 1.18
17 Multiply reported conductivity by 1.16
18 Multiply reported conductivity by 1.14
19 Multiply reported conductivity by 1.12
20 Multiply reported conductivity by 1.10
CRICOS No. 00213J
Bronwyn Jones
21 Multiply reported conductivity by 1.08
22 Multiply reported conductivity by 1.06
23 Multiply reported conductivity by 1.04
24 Multiply reported conductivity by 1.02
25 No conversion required
26 Multiply reported conductivity by 0.98
27 Multiply reported conductivity by 0.96
28 Multiply reported conductivity by 0.94
29 Multiply reported conductivity by 0.92
30 Multiply reported conductivity by 0.90
Quality Remark
This column is used to indicate the quality of water in the aquifer. A simple comment regarding the
quality of the water is made. E.g. SALTY, POTABLE, BRACKISH, FRESH, etc.
CRICOS No. 00213J
Bronwyn Jones
STRATA LOG TABLE
INTRODUCTION
The records in this table are a transcription of the strata encountered in a bore as described on the
strata log sheet completed by the driller, geologist, etc. This table must not be used for storing notes
(notes or remarks can be stored in the Drilling Contractor Remarks Table).
Column Names
Bore
Government Registered Number (RN)
Record
Strata Description or Notes
Top of Strata
Bottom of Strata
Bore
The bore column is the identifier common to all the tables and maps. It allows the rows in different
tables for a particular bore to be linked together. The bore values were determined as follows:
A1 - An = Bores in Highvale South of Mount Glorious Road
B1 - Bn = Bores in Highvale North of Mount Glorious Road
C1 - Cn = Bores in Wights Mountain
D1 - Dn = Bores in Samford Valley South of Mount Glorious Road
E1 - En = Bores in Samford Valley North of Mount Glorious Road
F1 - Fn = Bores in Camp Mountain
G1 - Gn = Bores in Samford Village & bores in Samford Valley to the East of
Samford Road/Main Street
H1 - Hn = Other Bores, e.g. in Draper, Mt Nebo.
Government Registered Number (RN)
The government registered number is unique. Each bore, even those on the same property, are all
allocated a five or six number Registration Number (RN).
E.g.
The following list shows the Registered Number block for a few offices (30/10/2003):
Brisbane 120000 - 120999
Gatton 106000 - 106999
Oil Bores 100000 - 101999
Toowoomba 119000 - 119999
Record
CRICOS No. 00213J
Bronwyn Jones
The record is the next highest level of unique identification after date. E.g. In the example below,
the records in examples 1 and 2 can be the same because they are distinguished by date. Records in
examples 2 and 3 must be different because they are on the same date.
RN Date Record No.
Example 1 100 01/01/1980 1
Example 2 100 02/01/1980 1
Example 3 100 02/01/1980 2
Strata Description
The description of strata in the interval defined by top of strata and bottom of strata fields is entered
here. If the description requires more than one record, the required records can be added without top
of strata and bottom of strata fields being repeated.
When entering strata log details into the database, the whole log, as recorded by the driller or
hydrologist is entered. Do not abbreviate the logs, i.e. do not leave out colour, granularity, or any
descriptive terms.
Top of Strata
The depth from the natural surface to the top of the strata described is recorded in this column. The
top of the strata log value must not be greater than the bottom value. Values are stored in metres
(m) to two decimal places.
Bottom of Strata
The depth from the natural surface to the bottom of the strata described is recorded in this column.
The bottom of the strata log value must not be marked with a minus sign eg. -6.00. Values are stored
in metres (m) to two decimal places.
CRICOS No. 00213J
Bronwyn Jones
CASING TABLE
INTRODUCTION
This table records the bore's casing details, as detailed by the drilling contractor.
Column Names
Bore
Pipe
Date
Record
Material Description
Material Size
Material Size Description
Outside Diameter
Top of Material
Bottom of Material
Bore
The bore column is the identifier common to all the tables and maps. It allows the rows in different
tables for a particular bore to be linked together. The bore values were determined as follows:
A1 - An = Bores in Highvale South of Mount Glorious Road
B1 - Bn = Bores in Highvale North of Mount Glorious Road
C1 - Cn = Bores in Wights Mountain
D1 - Dn = Bores in Samford Valley South of Mount Glorious Road
E1 - En = Bores in Samford Valley North of Mount Glorious Road
F1 - Fn = Bores in Camp Mountain
G1 - Gn = Bores in Samford Village & bores in Samford Valley to the East of
Samford Road/Main Street
H1 - Hn = Other Bores, e.g. in Draper, Mt Nebo.
Pipe
There can be single or multiple pipe bores. A single pipe refers to one that operates as if it has a
single length of casing. However, by definition in the Groundwater Database, a bore with several
different diameter casings joined concentrically to effectively form a single pipe will be called a single
pipe bore. The single pipe bore is filled in with an ‘A’.
E.g. A = Single Pipe (Operates as, or effectively forms, a single pipe bore)
CRICOS No. 00213J
Bronwyn Jones
Date
The date to be entered is the date on which the bore was completed.
Record
The record is the next highest level of unique identification after date. E.g. In the example below,
the records in examples 1 and 2 can be the same because they are distinguished by date. Records in
examples 2 and 3 must be different because they are on the same date.
RN Date Record No.
Example 1 100 01/01/1980 1
Example 2 100 02/01/1980 1
Example 3 100 02/01/1980 2
Material Description
Material description defines the type of material described in the record. It could be steel casing, PVC
casing, etc. Some of the coded values for material description include:
E.g.
PVC = Polyvinyl Chloride
PERF = Perforated or Slotted Casing Section
GRAV = Gravel Pack
FILL = Cuttings or other fill between casing
GROU = Cement Grout
STEL = Steel Casing (unspecified)
BNSL = Bentonite Seal
PLAS = Plastic Casing (unspecified)
SCRN = Screen
OPEN = Open Hole (Section of bore uncased)
SSL = Stainless Steel
FRP = Fibreglass Reinforced Plastic
Material Size
The material size describes the wall thickness of a length of casing or aperture of a screen, etc. For a
gravel pack, the nominal gravel size (i.e. sieve size that all gravel passes) is entered. Values are
stored in millimetres (mm) to three decimal places.
CRICOS No. 00213J
Bronwyn Jones
Material Size Description
The material size description identifies what attribute the material size field is measuring. It must have
one of the following three codes.
E.g. WT = Wall Thickness of casing (e.g. PVC casing is WT)
AP = Aperture Size for Screens, Slots, Perforations (eg Perforated sections are AP)
GR = Gravel Packs; Nominal gravel size (e.g. Gravel Packing is GR)
Note: If you have a material description of GRAV (gravel) you can not have a size description of AP or
WT. Also if you have a material description of PERF or SCRN you can not have a size description of GR
or WT.
Outside Diameter
The outside diameter of the material is entered in this column. The term diameter has been chosen
because the majority of the bores are circular in shape. Values are stored in mm’s.
Top of Material
This column defines the depth from the natural surface to the top of the material being described in
the record. The top of the casing value must not be greater than the bottom value. For a string of
casing with slots/perforations the total length of the string is entered as one record (perforated
section included). A further record/s is then entered identifying where the slots/perforations occur.
Values are stored in metres (m) to one decimal place.
Bottom of Material
This column defines the depth from the natural surface to the bottom of the material being described
in the record. The bottom of the casing value must not be marked with a minus sign eg. -6.00. For a
string of casing with slots/perforations the total length of the string is entered as one record
(perforated section included). A further record/s is then entered identifying where the
slots/perforations occur. Values are stored in metres (m) to one decimal place.
CRICOS No. 00213J
Bronwyn Jones
AQUIFER TABLE
INTRODUCTION
The purpose of this table is to record information about the permeable water bearing beds
encountered by a bore penetrating a single geological unit or a number of geological units.
Column Names
Bore
Date
Record
Condition
Total Bore Depth
Water Struck At
Standing Water Level
Yield
Top of Aquifer
Bottom of Aquifer
Contributing Aquifer
Flow Indicator
Water Table (ASL)
General Aquifer Material
Other Notes
Bore
The bore column is the identifier common to all the tables and maps. It allows the rows in different
tables for a particular bore to be linked together. The bore values were determined as follows:
A1 - An = Bores in Highvale South of Mount Glorious Road
B1 - Bn = Bores in Highvale North of Mount Glorious Road
C1 - Cn = Bores in Wights Mountain
D1 - Dn = Bores in Samford Valley South of Mount Glorious Road
E1 - En = Bores in Samford Valley North of Mount Glorious Road
F1 - Fn = Bores in Camp Mountain
G1 - Gn = Bores in Samford Village & bores in Samford Valley to the East of
Samford Road/Main Street
H1 - Hn = Other Bores, e.g. in Draper, Mt Nebo.
Date
The date is the date on which the drilling of the bore was completed. It stores the initial completion
date and not the date of subsequent deepening’s.
CRICOS No. 00213J
Bronwyn Jones
Record
The record is the next highest level of unique identification after date. E.g. In the example below,
the records in examples 1 and 2 can be the same because they are distinguished by date. Records in
examples 2 and 3 must be different because they are on the same date.
RN Date Record No.
Example 1 100 01/01/1980 1
Example 2 100 02/01/1980 1
Example 3 100 02/01/1980 2
Condition
Condition refers to the hydrological and physical condition of the material in the bed. However, the
hydrological aspect is dominant. Basically, the condition is determined by the mechanism by which
water is transmitted in the rock mass, i.e. is the water transmitted via pores, between grains or via
fractures in the rock mass?
E.g.
Porous Rocks
UC = Unconsolidated
PS = Consolidated
SC = Semi-Consolidated
Fractured Rocks
FR = Fractured
VS = Vesicular
CV = Cavernous
WZ = Weathered Zone
Total Bore Depth
This column gives the total depth of the bore in metres (m) below the ground when the bore was
drilled.
Water Struck At
This column states the depth/s that water was struck at in metres below ground level (m bgl) when
the bore was drilled.
CRICOS No. 00213J
Bronwyn Jones
Standing Water Level
The standing water level (SWL) of the aquifer when drilled is used to record the water level or static
head measured from the natural surface for each aquifer when the bore was drilled. Water levels
below ground level must be entered as a negative. If the bore is flowing the static head is entered as
a positive measurement above ground level. Values are stored in metres (m) to two decimal places.
Yield
The yield from an aquifer is stored as an estimate of the yield from the aquifer. The estimate may be
obtained by bailing, air test, pump test, flow test, etc. Values are stored in litres/second (L/sec) to
two decimal places.
Top of Aquifer
The depth from the natural surface to the top of the aquifer described is recorded in this column. The
top of the aquifer value must not be greater than the bottom value. Values are stored in metres (m)
to two decimal places.
Bottom of Aquifer
The depth from the natural surface to the bottom of the aquifer described is recorded in this column.
The bottom of the aquifer value must not be marked with a minus sign, e.g. -6.00. Values are stored
in metres (m) to two decimal places.
Contributing Aquifer
The contributing aquifer column is completed with ‘Y’ (Yes) if the Aquifer contributes to the supply in
the completed bore. If the aquifer is not contributing to the supply of the completed bore then it is
completed with ‘N’ (No).
Flow Indicator
In many cases it is known that an aquifer has yielded a flowing water supply, however there are no
details of the static head. This column indicates whether or not the water level of the aquifer rose
above ground level, i.e. whether or not a flow was encountered. If a flow is encountered in the
aquifer specified, ‘Y’ is entered. If the water level is below ground level ‘N’ is entered.
Water Table (ASL)
This column provides the elevation of the water table above sea level. It has been calculated from
the standing water level (SWL) and elevation data.
CRICOS No. 00213J
Bronwyn Jones
General Aquifer Material
The material the water is in is simply the aquifer material. E.g. Deco or Weathered granite, Fresh
granite, Fractured granite, Alluvium, Metamorphic Rock, etc.
Other Notes
In this column a brief comment can be made about the bore or aquifer, etc. E.g. the location of the
bore such as in a natural gully; or in backyard, a flat area with all trees; etc.
CRICOS No. 00213J
Bronwyn Jones
WATER ANALYSIS TABLE
INTRODUCTION
The water analysis table stores the results of chemical analyses performed on the
groundwater/borewater samples by an analyst.
Column Names
Bore
Pipe
Date Tested
Record
Analyst
Analysis Number
Sampling Method
Source
Depth
Figure of Merit (Ratio) *
Sodium Adsorption Ratio *
Residual Alkalinity Hazard *
Total Dissolved Ions *
Total Dissolved Solids *
Hardness
Alkalinity
Silica (SiO2)
Aluminium (Al)
Strontium (Sr)
Manganese (Mn)
Iron (Fe)
Magnesium (Mg)
Sodium (Na)
Calcium (Ca)
Zinc (Zn)
Copper (Cu)
Potassium (K)
Bicarbonate (HCO3-)
Carbonate (CO32-)
Chloride (Cl-)
Fluoride (F-)
Bromide (Br-)
CRICOS No. 00213J
Bronwyn Jones
Nitrate (NO3-)
Phosphate (PO43-)
Sulphate (SO42-)
* Note: These values are calculated (See ‘Chemical Data – IONS’ below)
Bore
The bore column is the identifier common to all the tables and maps. It allows the rows in different
tables for a particular bore to be linked together. The bore values were determined as follows:
A1 - An = Bores in Highvale South of Mount Glorious Road
B1 - Bn = Bores in Highvale North of Mount Glorious Road
C1 - Cn = Bores in Wights Mountain
D1 - Dn = Bores in Samford Valley South of Mount Glorious Road
E1 - En = Bores in Samford Valley North of Mount Glorious Road
F1 - Fn = Bores in Camp Mountain
G1 - Gn = Bores in Samford Village & bores in Samford Valley to the East of
Samford Road/Main Street
H1 - Hn = Other Bores, e.g. in Draper, Mt Nebo.
Pipe
There can be single or multiple pipe bores. A single pipe refers to one that operates as if it has a
single length of casing. However, by definition in the Groundwater Database, a bore with several
different diameter casings joined concentrically to effectively form a single pipe will be called a single
pipe bore. The single pipe bore is filled in with an ‘A’.
E.g. A = Single Pipe (Operates as, or effectively forms, a single pipe bore)
Date Tested
The date to be entered is the date on which the water sample was analysed in the lab.
Record
The record is the next highest level of unique identification after date. E.g. In the example below,
the records in examples 1 and 2 can be the same because they are distinguished by date. Records in
examples 2 and 3 must be different because they are on the same date.
RN Date Record No.
Example 1 100 01/01/1980 1
Example 2 100 02/01/1980 1
Example 3 100 02/01/1980 2
CRICOS No. 00213J
Bronwyn Jones
Analyst
The analyst column defines who performed the chemical analysis of the water sample.
E.g.
GCL = Government Chemical Laboratory
DPI = Qld Department of Primary Industries Agricultural Chemist
B Jones@QUT = QUT NRS Honours Student (2007) Miss Bronwyn Jones
PRSC = Pine Rivers Shire Council
Analysis Number
Insert the DNR Analysis Number quoted on the certificate. Where an analyst leaves the DNR Analysis
Number field blank, a DNR Analysis Number should be issued. A new number should also be issued
when an old analysis is located with no DNR Analysis Number.
Sampling Method
This column describes the method used to collect the sample.
E.g.
PU = Pump - Other or Flowing Bore
PF = Pump – Air Forced
BT = Bailer – Teflon
BA = Bailer – Other
DH = Downhole Probe
XX = Unknown
NR = Not Recorded
Source
This column describes the source of the sample. The available codes are:
GB = Groundwater - Sample from bore
GS = Groundwater - Sample from stream or spring
GR = Groundwater - Sample from remote source eg. Tank, dam
Depth
The depth column is the depth in metres from the reference point to the point at which the sample
was taken. The only unit allowed is metres (m). It should be noted that only GCL (Government
Chemical Laboratory) has measured the depth at which the sample was taken; in the other cases, the
samples may have been taken from the groundwater pumped out by the bore or from a tap at the
bore.
CRICOS No. 00213J
Bronwyn Jones
Chemical Data – MAJOR IONS
Chemical data is directly from the laboratory chemical analysis results. Where an analysis is
presented partly in milligrams per litre (mg/L) and partly in some other unit such as parts per million
(ppm), all data is converted to the one set of units. The data is stored as either milligrams per litre or
parts per million for all quantities except:
1. Residual Alkalinity stored as milli-equivalents per litre.
2. Sodium Adsorption Ratio stored as a number.
3. Figure of Merit stored as a number.
4. For Fluoride, only values between zero and 30 milligrams per litre are valid.
For the calculated values, the following notes are given by QUEENSLAND HEALTH SCIENTIFIC
SERVICES and apply to their analyses:
• Total Dissolved Ions = Total Cations + Total Anions.
• Total Dissolved Solid = 1. Silica + Total Cations + Total Anions - (HCO3- x
0.583); i.e. Bicarbonate is expressed as Carbonate.
= 2. Electrical Conductivity (EC) x 0.583
• Hardness is (Ca++ + Mg++) as CaCO3.
• Residual Alkalinity = meq (HCO3- + CO3
--) -meq (Ca++ + Mg++).
• Sodium Adsorption Ratio = meqNa+/vmeq(Ca++ + Mg++)/2.
• Figure of Merit (Ratio) = meq (Ca++ + Mg++)/meqNa+.
CRICOS No. 00213J
Bronwyn Jones
ELEVATION & CO-ORDINATE TABLE
INTRODUCTION
The coordinate information recorded in this table is vital for locating the bore geographically. This
table also records the elevation of the ground immediately surrounding the borehole.
Column Names
Bore
Elevation
GIS_ Latitude
GIS_ Longitude
NR&W Checked
Easting
Northing
Zone
Co-ordinate System
Latitude
Longitude
Accuracy
GPS Accuracy
Bore
The bore column is the identifier common to all the tables and maps. It allows the rows in different
tables for a particular bore to be linked together. The bore values were determined as follows:
A1 - An = Bores in Highvale South of Mount Glorious Road
B1 - Bn = Bores in Highvale North of Mount Glorious Road
C1 - Cn = Bores in Wights Mountain
D1 - Dn = Bores in Samford Valley South of Mount Glorious Road
E1 - En = Bores in Samford Valley North of Mount Glorious Road
F1 - Fn = Bores in Camp Mountain
G1 - Gn = Bores in Samford Village & bores in Samford Valley to the East of
Samford Road/Main Street
H1 - Hn = Other Bores, e.g. in Draper, Mt Nebo.
CRICOS No. 00213J
Bronwyn Jones
Elevation
The elevation value is the elevation of the natural ground surface immediately surrounding the
borehole, either taken by a handheld GPS unit or extracted from a raster Digital Elevation Model
(DEM) of the valley using the bore co-ordinates.
GIS_Latitude
Latitude is derived from the bore location system. It is the location with respect to the boundaries
stored in the Departmental Digital Cadastral Database (DCDB). It gives the Latitude as a decimal.
GIS_Longitude
Longitude is derived from the bore location system. It is the location with respect to the boundaries
stored in the Departmental Digital Cadastral Database (DCDB). It gives the Longitude as a decimal.
NR&W Checked
This column indicates whether or not the location of the bore has been validated by the NR&W Bore
Location System. The column can only be updated by the Bore Location System.
Easting
The easting is required to define the Map Grid of Australia (MGA) co-ordinates.
Northing
The northing is required to define the Map Grid of Australia (MGA) co-ordinates. The northing must
be a 7-digit number.
Zone Number
The zone number is required to define the Map Grid of Australia (MGA) coordinates. The zone must
be a 2-digit number and be between zone 53 and zone 56. E.g. 56J.
Co-ordinate System
The co-ordinate system is that given by the hand-held GPS unit when taking easting and northing co-
ordinates.
E.g. UTM = Universal Transverse Mercator, is the most widely used plane
coordinate system and is based on the transverse Mercator projection.
CRICOS No. 00213J
Bronwyn Jones
Latitude
Latitude is used to describe the position of the bore on the earth's surface. Enter as degrees, minutes
and seconds, e.g. 27°23'33'' S. Fractions of a second are not allowed. All latitudes are stored as
South.
Longitude
Latitude is used to describe the position of the bore on the earth's surface. Enter as degrees, minutes
and seconds, e.g. 152°51'02'' E. Fractions of a second are not allowed. All longitudes are stored as
East.
Accuracy
This column records how accurately the bore has been located. There are 6 accuracy codes.
E.g.
GPS = Global Positioning System: The bores location has been determined by a global
positioning system (GPS).
UNKN = Unknown: It is unknown how the bore’s position has been determined.
GPS Accuracy
The GPS Accuracy column is the accuracy of the global positioning system. E.g. 100 means a GPS
with an accuracy of +100 metres has been used.
CRICOS No. 00213J
Bronwyn Jones
DRILLING CONTRACTOR REMARKS TABLE
INTRODUCTION
This table provides the short notes or remarks that the drilling contractor has made in his logbook.
They are predominantly those remarks written in the logbook of N. Scells from the drilling company S.
H. Scells, because the logbooks of other drilling contractors who drilled in the area were unable to be
obtained.
Column Names
Bore
Government Registered Number (RN)
Driller Remarks
Bore
The bore column is the identifier common to all the tables and maps. It allows the rows in different
tables for a particular bore to be linked together. The bore values were determined as follows:
A1 - An = Bores in Highvale South of Mount Glorious Road
B1 - Bn = Bores in Highvale North of Mount Glorious Road
C1 - Cn = Bores in Wights Mountain
D1 - Dn = Bores in Samford Valley South of Mount Glorious Road
E1 - En = Bores in Samford Valley North of Mount Glorious Road
F1 - Fn = Bores in Camp Mountain
G1 - Gn = Bores in Samford Village & bores in Samford Valley to the East of
Samford Road/Main Street
H1 - Hn = Other Bores, e.g. in Draper, Mt Nebo.
Government Registered Number (RN)
The government registered number is unique. Each bore, even those on the same property, are all
allocated a five or six number Registration Number (RN).
E.g.
The following list shows the Registered Number block for a few offices (30/10/2003):
Brisbane 120000 - 120999
Gatton 106000 - 106999
Oil Bores 100000 - 101999
Toowoomba 119000 - 119999
Driller Remarks
The remark is simply a short note made by the drilling contractor in his logbook.
CRICOS No. 00213J
Bronwyn Jones
OTHER POSSIBLE BORES IN SAMFORD VALLEY TABLE
This table lists the location of other probable groundwater bores. I have provided co-ordinates for
them but no data, because they haven’t been confirmed/checked to be bores.
Column Names
Bore
Latitude
Longitude
Field Location
Bore
The bore column is the identifier common to all the tables and maps. It allows the rows in different
tables for a particular bore to be linked together.
Latitude
Latitude is used to describe the position of the bore on the earth's surface. Enter as degrees, minutes
and seconds, e.g. 27°23'33'' S. Fractions of a second are not allowed. All latitudes are stored as
South.
Longitude
Latitude is used to describe the position of the bore on the earth's surface. Enter as degrees, minutes
and seconds, e.g. 152°51'02'' E. Fractions of a second are not allowed. All longitudes are stored as
East.
Field Location
The field location is used to help locate the bore in the field. It may be the residential address of the
land or property on which the bore is located, or a landmark that the bore is near.
CRICOS No. 00213J
Bronwyn Jones
REFERENCE
• Queensland Government Department of Natural Resources and Mines. 2005. Groundwater
Database: Data Dictionary & Standards. Version 6.
CRICOS No. 00213J
Bronwyn Jones
APPENDIX 2
Groundwater Inventory
CRICOS No. 00213J
Field Water Quality Measurement Table
BORE PIPE RDATE SAMP METHOD SOURCE pH Eh (in MV) EC (µS/cm ) QUALITYF1F2 A 30/07/2007 PU GB 7.15 .+ 21 871 FRESHF3F4F5 A 26/06/2007 PU GB 6.78 142 POTABLEF6 A 15/08/2005 PU GB 2200 BRACKISHF7F8F9 A 20/05/2003 PU GB 6.45 3100 BRACKISHF10 7.40 1100 FRESHF11 A 13/10/2004 PU GB 1300 FRESHF12 A 28/06/2006 PU GB 6.30 .+ 71 572 POTABLEF13 A 25/01/2004 PU GB 620 POTABLEF14 A 23/03/2006 GB - - -F15 A 18/06/2007 PU GB 6.56 .+ 57 215 POTABLEF16 A 1/06/1993 GB 8.00 .+ 46 3250 (1826*) BRACKISHF17 A 16/10/2006 GB - - -F18 POTABLEF19 A 5/09/2006 GB - - -F20F21 A 13/09/2004 PU GB 650 POTABLEF22F23 A 26/06/2007 PU GB 6.54 .+ 23 435 POTABLEF24 - - -F25 A 15/06/2006 PU GB 520 POTABLEF26F27F28 A 18/05/2007 PU GB 6.63 .+ 29 886 FRESHF29F30 POTABLEF31 A 26/06/2006 GB 6.40 869 FRESHF32F33F34 A 29/08/2003 PU GB 550 POTABLEF35F36 A 1/12/2005 PU GB 520 POTABLEF37 POTABLEF38H1 A 2/02/2004 PU GB 2600 BRACKISHH2 8.50 890 FRESHA1A2 A 5/10/2004 PU GB 620 POTABLE
Bronwyn Jones Page 100
CRICOS No. 00213J
Field Water Quality Measurement Table
A3 A 15/07/2004 PU GB 7.13 .+ 23 550 POTABLEA4 A 10/01/2005 PU GB 6.58 .+ 54 661 POTABLEB1 A 15/08/2006 PU GB 660 POTABLEA5A6A7 A 8/07/2005 GB - - -A8 A 16/07/2007 PU GBA9 A 19/05/2007 PU GB 7.14 1011 FRESHA10 A 11/08/2006 GB - - -B2 A 4/11/2003 PU GB 380 POTABLEA11A12A13 A 29/07/2007 PU GB 7.25 .+ 14 692 POTABLEA14B3 A 18/06/2007 PU GB 6.10 .+ 69 602 POTABLEB4 A 18/06/2007 PU GB 5.80 .+ 96 296 POTABLEB5 7.31 752 FRESHA15A16A17A18 A 18/06/2007 PU GB 6.54 .+ 55 1018 FRESHB6 A 26/06/2006 GB 6.64 317 POTABLEA19 A 4/06/2004 PU GB 440 POTABLEA20 A 21/08/2006 PU GB 700 POTABLEA21 A 19/05/2007 PU GB 6.58 .+ 45 444 POTABLEA22 A 12/11/2003 PU GB 7.02 .+ 7 1210 FRESHA23A24A25A26H3 A 1/01/1950 GB 6.40G1 A 1/01/1990 GB 6.00 1260 FRESHE1 A 6/05/2006 PU GB 6.62 .+ 51 720 POTABLEG2A A 20/02/1988 GB 7.10 570 POTABLEG2B A 20/02/1988 GB 7.00 540 POTABLEE2 A 29/07/2007 PU GB 6.67 .+ 50 2177 BRACKISHE3 A 7/07/2006 PU GB 3800 BRACKISHE4 A 23/10/2006 GB 2200 BRACKISHE5 A 13/06/2006 PU GB 340 POTABLE SOAKE6 A 24/10/2006 GB - - -E7 A 26/10/2006 GB - - -D1D2 A 29/07/2007 PU GB 7.25 .+ 15 5980 SALTYE8 A 29/06/2006 GB 420 POTABLE
Bronwyn Jones Page 101
CRICOS No. 00213J
Field Water Quality Measurement Table
E9 A 18/05/2007 PU GB 6.49 .+ 35 896 FRESHE10E11 A 16/08/2005 PU GB 2900 BRACKISHD3E12 A 5/01/2006 PU GB 6.77 .+ 43 960 FRESHD4 - -D5 A 1/01/1991 GB 8.00 4000 BRACKISHE13 A 1/11/2006 GB 7.05 .+ 26 1010 FRESHG3 A 24/11/2006 GB 360 POTABLED6 A 29/07/2007 PU GB 7.49 2031 BRACKISHE14E15 A 25/10/2006 GB 7.07 .+ 26 5778 SALTYD7 6.70 1950 FRESHE16 A 25/01/2006 PU GB 420 POTABLE SOAKG4 A 13/08/2007 PU GBG5C1 A 29/07/2007 PU GB 7.11 .+ 25 2605 BRACKISHC2 A 2/05/2003 PU GB 1800 FRESHC3C4 A 2/05/2003 GB 1800 FRESHC5 A 9/05/2003 GB - -C6C7C8C9C10C11 A 9/07/2007 PU GB 6.20 .+ 44 162 POTABLEC12 A 3/03/2004 PU GB 350 POTABLEC13 A 20/05/2003 PU GB 440 POTABLEC14 A 18/10/2006 PU GB 560 POTABLEC15 A 20/03/2006 PU GB 7.40 .– 6 598 POTABLEC16 A 20/05/2003 GB 7.04 .+ 29 506 POTABLEC17C18 A 20/06/2005 PU GB 3700 BRACKISHC19C20 A 9/07/2007 PU GB 6.28 .+ 39C21
* After bailing ~30 Litres of water
Bronwyn Jones Page 102
CRICOS No. 00213J
Strata Log Table
BORE RN REC DESCRIPTION TOP BOTTOMF1F2F3F4F5F6 124853 1 LIGHT BROWN TIGHTLY COMPACTED STIFF CLAY 0 2.5
2 LIGHT BROWN VERY SANDY DECOMPOSED GRANITE (ALLUVIUM) 2.5 43 BROWN DECOMPOSED GRANITE WITH HEAVY TRACES OF GRAVEL * 4 5.254 DARK GREY & BLACK MODERATELY HARD SOLID GRANITE * 5.25 11.55 BLACK & GREY VERY HARD GRANITE 11.5 20
F7F8F9 120458 1 BROWN SANDY SOIL 0 0.25
2 LIGHT BROWN COMPACTED STIFF CLAY 0.25 1.53 LIGHT BROWN CLAYEY DECOMPOSED GRANITE 1.5 64 LIGHT & DARK BROWN DECOMPOSED GRANITE WITH SOME SEAMS 6 19
OF DARK BLUE ROCK ALTERNATING BETWEEN HARD & SOFT5 LIGHT & DARK BROWN MODERATELY HARD DECOMPOSED GRANITE 19 22.5
(BREAKING UP INTO CEMENTED PIECES)6 DARK BLUE & BROWN DECOMPOSED GRANITE ALTERNATING WITH 22.5 24.5
LIGHT BLUE GREY ROCK ADHERING TO LIGHT BROWN ROCK WITH GRAIN STRUCTURE (VERY UNUSUAL FOR THIS AREA) *
F10 79159
F11 124206 1 TOP SOIL 0 12 SAND AND GRAVEL * 1 53 DECOMPOSED GRANITE * 5 124 SPOTTED D & G GRANITE 12 25
F12 133877 1 GREY SANDY SOIL 0 0.52 BROWN "COMPACTED" STIFF CLAY, TRACES OF COARSE SAND 0.5 7.53 BROWN MODERATELY CLAYEY M & C DECOMPOSED GRANITE 7.5 94 GREY & WHITE HARD GRANITE 9 135 BROWN HARD DECOMPOSED GRANITE 13 13.56 GREY & WHITE HARD GRANITE 13.5 167 BROWN HARD COARSE DECOMPOSED/WEATHERED GRANITE * 16 18.58 GREY & WHITE HARD GRANITE 18.5 24
F13 120217 1 LIGHT BROWN VERY SANDY CLAY WITH SEAMS OF CLAYEY SAND 0 32 DARK BROWN VERY SANDY CLAY WITH LAYERS OF FINE GRAVEL 3 6.53 BROWN GRAVELY CLAY 6.5 7.54 HARD BLACK AND WHITE GRANITE BOULDER) 7.5 95 LIGHT BROWN SOFT COARSE DECOMPOSED GRANITE WITH SEAMS 9 12.5
OF HARD BLACK & WHITE FRACTURED GRANITE *
Bronwyn Jones Page 102
CRICOS No. 00213J
Strata Log Table
6 VERY HARD BLACK AND WHITE GRANITE 12.5 14.5F14 133792 1 SANDY SOIL OVERLYING BROWN MODERATELY STIFF CLAY 0 0.5
2 LIGHT BROWN CLAYEY DECOMPOSED GRANITE WITH SEAMS OF 0.5 6HARD DECOMPOSED GRANITE
3 DARK BROWN MEDIUM GRAINED GRANITE DECOMPOSED GRANITE 6 124 BLACK & WHITE HARD GRANITE (BOULDER) 12 13.55 BROWN MODERATELY SOFT FINE GRAINED DECOMPOSED GRANITE 13.5 176 HARD BLACK & WHITE GRANITE 17 187 BROWN MODERATELY HARD DECOMPOSED GRANITE 18 198 HARD BLACK & WHITE GRANITE 19 219 BLACK & WHITE SOFT GRANITE 21 21.510 BLACK & WHITE HARD TO VERY HARD GRANITE, NO FRACTURING 21.5 32
F15F16 79713 1 SANDY LOAM 0 2.44
2 DECOMPOSED GRANITE 2.44 13.413 GRANITE 13.41 16.764 FRACTURED GRANITE 16.76 28.955 SOFTER GRANITE 28.95 29.566 SOFTER GRANITE, NO FRACTURES * 29.56 42.677 HARD GRANITE, NO FRACTURES 42.67 45.72
903 WATER STRUCK AT 30m;TOTAL DEPTH 46mF17 134255 1 DARK BROWN SANDY SOIL 0 0.5
2 LIGHT BROWN COMPACTED SANDY CLAY 0.5 23 LIGHT BROWN VERY SANDY DECOMPOSED GRANITE 2 4.754 LIGHT GREY & BLACK HARD GRANITE 4.75 45
2 LIGHT BROWN CLAYBOUND DECOMPOSED GRANITE 2 53 BROWN VERY SANDY 5 114 SEAM OF BROWN FRACTURED ROCK IN DECOMPOSED GRANITE 11 11.55 RED-BROWN FINE & MEDIUM GRAINED VERY SANDY DECO GRANITE 11.5 15.56 GREY & WHITE VERY HARD GRANITE 15.5 227 GREY & WHITE SLIGHTLY SOFTER GRANITE 22 22.58 GREY & WHITE VERY HARD GRANITE 22.5 23.5
F20F21 124005 1 DARK BROWN SANDY CLAY 0 4
2 DARK BLUE & BROWN MODERATELY STIFF CLAY 4 5.53 BROWN CLAYBOUND DECOMPOSED GRANITE 5.5 84 COARSE CLAYBOUND "BASALTIC" GRAVEL 8 8.55 LIGHT BROWN CLAYBOUND DECOMPOSED GRANITE * 8.5 116 DARK BROWN V COARSE DECO GRANITE (V LITTLE CLAYBINDING) * 11 157 HARD GRANITE 15 15
F22F23 120587 1 HARD BROWN CLAY 0 1
Bronwyn Jones Page 103
CRICOS No. 00213J
Strata Log Table
2 HARD BROWN CLAY 1 23 HARD BROWN CLAY 2 64 HARD BROWN CLAY WITH SMALL STONE 6 115 RED & BROWN STONE WET 11 126 RIVER GRAVEL 8-20mm AQUIFER * 12 187 RIVER GRAVEL 3-20mm (STABLE) 18 26.15
F24F25 133875 1 GREY SANDY SOIL 0 0.5
2 DARK GREY TO BLACK VERY STIFF CLAY 0.5 5.53 BROWN SLIGHTLY CLAYEY M & C GRAINED DECOMPOSED GRANITE 5.5 8
WITH BOULDERS & TRACES OF GRAVEL *4 GREY & WHITE VERY HARD GRANITE WITH FRACTURING @ 10.5m * 8 13.75
F26
F27F28F29F30 120589 1 BLACK SOIL 0 1
2 BROWN CLAY 1 33 DECOMPOSED GRANITE * 3 114 HARD BLUE GRANITE FRACTURED 11 21.5
F31F32F33F34 120465 1 BLACK SANDY SOIL 0 1
2 DARK GREY MODERATELY STIFF CLAY 1 4.53 BROWN F TO M GRAINED CLAYBOUND DECOMPOSED GRANITE 4.5 84 LIGHT BROWN VERY PERMEABLE M TO C GRAINED DECO GRANITE * 8 9.55 LIGHT BROWN VERY PERMEABLE DECOMPOSED GRANITE * 9.5 10.56 VERY HARD BROKEN GRANITE * 10.5 10.75
F35F36 133516 1 BROWN MODERATELY SANDY ALLUVIAL CLAYS 0 3
2 BROWN (FRETTING) ALLUVIAL CLAYS WITH COARSE GRAVEL & 3 4SMALL BOULDERS
3 BROWN VERY CLAYBOUND DECOMPOSED GRANITE 4 94 DARK BROWN PERMEABLE COARSE DECOMPOSED GRANITE WITH 9 13
THIN SEAMS OF FINE & MEDIUM GRAINED GRAVEL *5 BLACK & WHITE HARD GRANITE (BOULDER) 13 13.756 BROWN COARSE DECOMPOSED GRANITE * 13.75 14.57 BLACK & WHITE BASEMENT GRANITE, VERY HARD 14.5 16.5
2 DK GREY TO BLACK CLAYBOUND MOD SOFT WEATHERED SCHIST * 1.5 13
Bronwyn Jones Page 104
CRICOS No. 00213J
Strata Log Table
3 DARK BLUE GREY MODERATELY HARD TO HARD SCHIST, SLIGHT 13 24TRACES OF WHITE QUARTZ *
H2 79216
A1A2 124012 1 LIGHT BROWN SANDY SOIL/CLAY 0 0.5
2 LIGHT BROWN STIFF CLAY 0.5 1.53 BROWN CLAYEY DECOMPOSED GRANITE 1.5 34 DARK BROWN SLIGHTLY CLAYEY MEDIUM GRAINED DECO GRANITE 3 65 DARK BROWN HARD DECOMPOSED GRANITE * 6 7.56 GREY & WHITE VERY HARD GRANITE 7.5 127 GREY FRACTURED GRANITE * 12 12.58 GREY & WHITE VERY HARD GRANITE 12.5 17.5
A3 120508 1 LIGHT BROWN STIFF & COMPACTED CLAY 0 22 DARK & LIGHT BROWN FINE GRAINED SL CLAYEY DECO GRANITE 2 123 LIGHT GREY & WHITE HARD GRANITE, SLIGHT FRACTURING @ 20m * 12 32
A4 124245 1 BROWN VERY SANDY ALLUVIAL SOIL 0 1.252 LARGE BOULDERS BOUND WITH SANDY SOIL & SILT 1.25 2.753 LIGHT BROWN CLAYBOUND DECOMPOSED GRANITE (WITH 2.75 7
INTERMITTENT BOULDERS)4 DARK BROWN LESS CLAYBOUND DECO GRANITE * 7 8.55 GREY & WHITE SOLID GRANITE 8.5 10
B1 134096 1 GREY SANDY SOIL 0 0.252 GREY VERY STIFF CLAY 0.25 1.53 BROWN STIFF CLAY 1.5 2.54 BROWN CLAYBOUND DECOMPOSED GRANITE 2.5 65 DARK BROWN MEDIUM & COARSE-GRAINED DECOMPOSED GRANITE* 6 7.56 LIGHT BROWN VERY HARD DECOMPOSED GRANITE 7.5 87 LIGHT BROWN & WHITE SOFT DECO GRANITE (TRACES OF GRAVEL) * 8 98 GREY & WHITE VERY HARD GRANITE 9 11
A5A6A7 124665 1 LIGHT GREY SANDY SOIL 0 0.5
2 BROWN CLAYBOUND DECOMPOSED GRANITE 0.5 3.53 BROWN MODERATELY HARD DECOMPOSED GRANITE 3.5 74 HARD LIGHT GREY & BLACK SOLID GRANITE WITH NO FRACTURING 7 60
A8A9 ~17.68A10 1 GREY SANDY SOIL 0 0.5
2 ORANGE-BROWN VERY COMPACTED SLIGHTLY SANDY CLAY 0.5 23 LIGHT BROWN VERY SANDY DECOMPOSED GRANITE 2 84 BROWN HARD DECOMPOSED GRANITE 8 95 GREY & WHITE HARD GRANITE, NO FRACTURING 9 126 GREY & WHITE HARD GRANITE, NO FRACTURING 12 38
Bronwyn Jones Page 105
CRICOS No. 00213J
Strata Log Table
7 GREY & WHITE & BROWN HARD GRANITE, NO FRACTURING 38 53.5B2 120466 1 LIGHT BROWN STIFF CLAY 0 1.5
2 DARK MODERATELY CLAYEY DECOMPOSED GRANITE 1.5 43 LIGHT GREY & BLACK HARD GRANITE 4 5.54 LIGHT GREY & LIGHT BROWN FRACTURED SOFT GRANITE * 5.5 6.55 LIGHT GREY & BLACK HARD GRANITE, NO FRACTURING 6.5 11.5
A11A12A13 79880
A14B3B4 15.9B5 13A15A16A17A18B6A19 120163 1 DARK BROWN CLAYBOUND DECOMPOSED GRANITE 0 7.5
2 LIGHT BROWN VERY CLAYEY DECOMPOSED GRANITE 7.5 8.75 3 HARD BROWN GRANITE (PROBABLY BOULDER) 8.75 9.25
4 LIGHT BROWN CLAYEY FINE & MEDIUM GRAINED DECO GRANITE 9.25 185 DARK BROWN & GREY MEDIUM GRAINED DECOMPOSED GRANITE* 18 206 LIGHT GREY & BLACK HARD GRANITE 20 24
A20 134181 1 DARK GREY SANDY CLAY & CLAYEY SAND 0 3.52 DARK BROWN CLAYEY DECOMPOSED GRANITE 3.5 5.53 LIGHT BROWN VERY SANDY DECOMPOSED GRANITE 5.5 8.754 LIGHT GREY & WHITE HARD GRANITE, SLIGHT FRACTURING @ 35m * 8.75 415 GREY & WHITE VERY HARD GRANITE 41 44
A21A22 120467 1 DARK BROWN VERY COMPACTED CLAYEY DECOMPOSED GRANITE 0 5.5
2 MID BROWN LESS CLAYEY "SANDY" DECOMPOSED GRANITE 5.5 13.53 LIGHT GREY MODERATELY HARD BLACK & WHITE GRANITE 13.5 144 BROWN MODERATELY HARD DECOMPOSED GRANITE 14 15.5
5 LIGHT GREY & BLACK HARD GRANITE 15.5 176 BROWN & BLACK & WHITE HARD GRANITE * 17 17.57 LIGHT GREY & BLACK MODERATELY HARD GRANITE 17.5 448 LIGHT GREY & BLACK GRANITE WITH SEAMS OF BLACK ROCK * 44 459 LIGHT GREY & BLACK MODERATELY HARD TO HARD GRANITE 45 49
A23 ~36.57A24A25A26
Bronwyn Jones Page 106
CRICOS No. 00213J
Strata Log Table
H3 79699
G1 79861 903 BORE 4m DEEP YIELD 800gall/hr 905 DRILLER NEVILLE SCELLS 902 ADDRESS: LOT 7, 5 BENJAMIN CLOSE, SAMFORD VALLEY
E1 133950 1 BLACK CLAY AND SOIL 0 0.52 BROWN STIFF CLAY, VERY GRAVELY AT INTERVALS 0.5 2.53 BROWN CLAYBOUND MEDIUM-GRAINED DECOMPOSED GRANITE 2.5 64 DARK BROWN FINE-GRAINED DECOMPOSED GRANITE 6 85 DARK & LIGHT BROWN COARSE PERMEABLE DECOMPOSED GRANITE 8 11.5
WITH MODERATE TRACES OFGRAVEL* 6 BLACK & WHITE VERY HARD GRANITE 11.5 13.75
G2 73232 1 STIFF GREY CLAY 0 6.71 2 BROWN DECOMPOSED CLAY 6.71 9.14 3 DECOMPOSED GRANITE & GRAVEL (MAIN WATER BED) * 9.14 10.97 4 DARK GREY SCHIST(WATER BED 12.8-15.9) 10.97 18.59 902 SWL=1.66 BELOW TOP OF CASING 29-02-1988
E2E3 134223 1 SANDY LOAM 0 1
2 DECOMPOSED ROCK 1 83 GRANITE * 8 26.6
E4 1 BROWN SANDY SOIL 0 0.252 ORANGE-BROWN COMPACTED SANDY CLAY 0.25 13 LIGHT BROWN VERY STIFF CLAY 1 24 BROWN CLAYEY MEDIUM GRAINED DECOMPOSED GRANITE 2 5.55 DARK GREY & BROWN MODERATELY HARD DECOMPOSED GRANITE 5.5 7.56 DARK GREY & WHITE HARD TO VERY HARD GRANITE WITH 7.5 33.5
2 BROWN STIFF CLAY 1 1.53 BROWN CLAYEY FINE & MEDIUM GRAINED DECOMPOSED GRANITE 1.5 4.54 BLACK & WHITE GREY VERY HARD GRANITE WITH NO FRACTURING 4.5 34
E6 1 GREY SANDY SOIL 0 0.252 ORANGE-BROWN COMPACTED SANDY CLAY 0.25 1.253 LIGHT BROWN STIFF CLAY 1.25 24 BROWN CLAYEY DECOMPOSED GRANITE 2 5.55 DARK BROWN & GREY MODERATELY HARD DECOMPOSED GRANITE 5.5 7.56 DARK & LIGHT GREY HARD GRANITE, NO FRACTURING 7.5 33.5
E7 1 GREY SANDY SOIL 0 0.252 ORANGE-BROWN COMPACTED SANDY CLAY 0.25 23 LIGHT BROWN STIFF CLAY 2 2.54 LIGHT BROWN CLAYBOUND DECOMPOSED GRANITE 2.5 3.55 DARK & LIGHT GREY HARD GRANITE, NO FRACTURING 3.5 316 DARK & LIGHT GREY HARD GRANITE, NO FRACTURING 31 33
Bronwyn Jones Page 107
CRICOS No. 00213J
Strata Log Table
7 DARK & LIGHT GREY HARD GRANITE, NO FRACTURING 33 36.5D1D2 ~37.8E8 1 ORANGE-BROWN SLIGHTLY SANDY SANDY CLAY (FILL) 0 1
2 DARK BROWN COMPACTED STIFF CLAY WITH DECO ROCK SEAMS 1 3.53 LIGHT BROWN VERY DECOMPOSED ROCK (VIRTUALLY POWDERY), 3.5 14.5
CLAY WITH LAYERS OF VERY WEATHERED DARK BLUE ROCK4 DARK BLUE MODERATELY HARD VERY FRACTURED ROCK * 14.5 175 DARK BLUE HARD ROCK WITH NO FRACTURING, TRACES OF 17 23
QUARTZ & GREY ROCK @ 21mE9 ~20E10 120397 1 BROWN CLAY WITH SMALL 5mm STONE 0 1
2 BROWN CLAY WITH SMALL 5mm STONE 1 23 LIGHT BROWN CLAY WITH SMALL 5mm STONE 2 34 LIGHT GRAY CLAY WITH SMALL 5mm STONE 3 45 GREY CLAY WITH SMALL BROWN STONE FRAC 4 56 GRANITE - QUARTZ WITH BLACK STONE 5 67 GRANITE - QUARTZ WITH BLACK STONE 6 128 GRANITE - QUARTZ WITH BLACK STONE 12 189 FRACTURED RED STONE WITH MOISTURE * 18 2410 GRANITE - QUARTZ WITH BLACK STONE 24 30
E11 124861 1 LIGHT GREY SOIL 0 0.52 BROWN STIFF CLAY 0.5 33 LIGHT & DARK BROWN VERY "SANDY" DECOMPOSED GRANITE 3 64 LIGHT GREY & BLACK HARD GRANITE 6 8.55 LIGHT GREY & BLACK GRANITE WITH SEAMS OF BROWN 8.5 10
DECOMPOSED GRANITE *6 LIGHT GREY & BLACK HARD GRANITE 10 17.57 MAROON-BROWN LIGHT GREY & BLACK MOD HARD GRANITE 17.5 218 BLACK & WHITE HARD GRANITE 21 24
2 LIGHT BROWN MODERATELY HARD DECOMPOSED GRANITE 3 63 BROWN DECO GRANITE WITH SEAMS OF HARD BLACK ROCK * 6 8.54 BLACK & WHITE FRESH GRANITE, VERY HARD, NO FRACTURING 8.5 15.25
E13 1 GREY SANDY SOIL 0 0.252 LIGHT GREY & BROWN COBBLE OVERLYING CLAYBOUND GRAVEL 0.25 3.53 BROWN VERY CLAYEY COARSE DECOMPOSED GRANITE 3.5 6.5
Bronwyn Jones Page 108
CRICOS No. 00213J
Strata Log Table
4 DARK BROWN COARSE TO VERY COARSE VERY PERMEABLE DECO 6.5 7.25GRANITE, WITH MODERATE TRACES OF F & M GRAINED GRAVEL *
5 LIGHT GREY & WHITE HARD GRANITE 8.75 9G3 1 BROWN MOTTLED CLAY, SEAM OF COMPACTED GRAVEL @ 2m 0 2
2 LIGHT BROWN & LIGHT GREY STIFF CLAY 2 43 LIGHT BROWN CLAYBOUND DECOMPOSED GRANITE 4 7.54 DARK GREY F & M GRAINED SLIGHTLY CLAYEY DECO GRANITE * 7.5 115 BLUE-GREY ROCK WITH GRAIN STRUCTURE SIMILAR TO GRANITE 11 20
BUT NOT TYPICAL OF GRANITE IN AREA. MINOR FRACTURING UP TO 13.5m *
2 LIGHT GREY VERY DECOMPOSED ROCK 1 3.53 BROWN & GREY VERY WEATHERED ROCK 3.5 64 STEEL GREY MODERATELY HARD SCHIST-TYPE-OF-ROCK WITH 6 17
SEAMS OF SLIGHTLY DECOMPOSED ROCK *5 BLUE GREY TO BLACK HARD ROCK, NO FRACTURING 17 21.5
G4G5C1C2 120451 1 BROWN SOIL/CLAY COARSE GRAVEL/BOULDER 0 4
2 HARD DARK BLUE TO BLACK ROCK 4 93 WHITE AND BLACK VERY HARD GRANITE 9 174 WHITE TO BLACK MOD HARD GRANITE * 17 215 VERY HARD WHITE TO BLACK GRANITE 21 25
Bronwyn Jones Page 109
CRICOS No. 00213J
Strata Log Table
C3 120455 1 DARK BROWN SANDY SOIL AND CLAY 0 1.52 LIGHT BROWN CLAYBOUND DECOMPOSED GRANITE 1.5 33 BLACK & WHITE HARD GRANITE NO FRACTURING 3 31
C4 1 BROWN SOIL & CLAYBOUND COARSE GRAVEL & BOULDERS 0 42 HARD DARK BLUE TO BLACK ROCK (Typical of MT NEBO - HORNFELS) 4 9
VERY FINE GRAIN STRUCTURE, SOME MINOR FRACTURING3 WHITE & BLACK VERY HARD GRANITE 9 174 WHITE & BLACK MODERATELY HARD GRANITE, CUTTINGS TENDING 17 21
TO BE "SANDY" *5 WHITE & BLACK VERY HARD GRANITE 21 25
C5 1 DARK BROWN SANDY SOIL & CLAY 0 1.52 LIGHT BROWN CLAYBOUND DECOMPOSED GRANITE WITH 1.5 3
ALTERNATING LAYERS OF LESS DECO GRANITE (HARDER SEAMS)3 BLACK & WHITE HARD TO VERY HARD GRANITE 3 31
C6C7C8C9C10C11C12 120224 1 BLACK SANDY ALLUVIAL SOIL 0 1.5
2 LIGHT GREY & BROWN MODERATELY STIFF CLAY 1.5 43 LIGHT BROWN CLAYBOUND SOFT DECOMPOSED GRANITE 4 64 LIGHT BROWN HARD DECOMPOSED GRANITE 6 75 BROWN SLIGHTLY CLAYBOUND DECOMPOSED GRANITE WITH VERY 7 10.5
SOFT SEAMS & HEAVY TRACES OF RED/BROWN ROCK *6 BLUE-GREY & WHITE HARD GRANITE (SL FRACTURED @ 11.5m) 10.5 14
C13 120459 1 DARK BROWN SOIL & FINE, MEDIUM & COARSE SAND/CLAY 0 42 LIGHT BROWN CLAYEY DECO GRANITE 4 73 MED GRAINED DECOMPOSED GRANITE * 7 94 BLUE DARK & WHITE HARD GRANITE FRAC * 9 125 BLACK & WHITE HARD GRANITE NO FRAC 12 14
C14 134256 1 DK BROWN VERY SANDY CLAY & CLAYEY SAND (FRETTING @ 3m) 0 32 BROWN MOIST VERY CLAYEY DECOMPOSED GRANITE 3 4.53 BROWN DECO GRANITE WITH SEAMS OF F & M GRAINED GRAVEL * 4.5 5.754 GREY & WHITE HARD GRANITE 5.75 8.55 GREY, WHITE & BROWN SOFT GRANITE * 8.5 96 GREY & WHITE HARD GRANITE (& TRACES OF BROWN) 9 107 GREY & WHITE HARD GRANITE 10 14
C15 133791 1 DARK BROWN VERY SANDY SOIL & VERY CLAYEY SAND 0 3.52 LIGHT BROWN MODERATELY CLAYBOUND DECOMPOSED GRANITE, 3.5 7.5
VERY PERMEABLE @ 6 - 7.5m *3 DARK GREY MOD HARD FINE GRAINED DECOMPOSED GRANITE * 7.5 10.54 BLACK & WHITE VERY HARD GRANITE, TRACES OF BROWN @ 10.5 15.5
Bronwyn Jones Page 110
CRICOS No. 00213J
Strata Log Table
INTERVALS, NO FRACTURESC16 1 DARK BROWN SOIL & CLAYBOUND F M & C SAND & SANDY CLAY 0 4
2 LIGHT BROWN VERY CLAYEY DECOMPOSED GRANITE 4 73 MEDIUM GRAINED DECOMPOSED GRANITE * 7 94 BLUE (DARK) & WHITE HARD GRANITE FRACTURED ALTERNATING 9 12
WITH BROWN & WHITE SOFTER DECOMPOSED GRANITE *5 BLACK & WHITE HARD GRANITE, NO FRACTURES 12 14
C17C18 124664 1 LIGHT GREY SANDY SOIL 0 0.5
2 BROWN STIFF CLAY 0.5 1.53 BROWN CLAYBOUND COARSE GRAINED DECOMPOSED GRANITE 1.5 10.54 BROWN MODERATELY HARD DECOMPOSED GRANITE 10.5 135 BROWN & DARK GREY MODERATELY HARD SOLID GRANITE * 13 256 GREY-PINK & BROWN MODERATELY HARD SOLID GRANITE WITH 25 40
LENS OF LIGHT GREY SOLUBLE CLAYC19C20C21
* Water found
Bronwyn Jones Page 111
CRICOS No. 00213J
Casing Table
BORE PIPE RDATE REC MATERIAL DESC MATERIAL SIZE SIZE DESC OUT DIAMETER TOP BOTTOMF1F2F3F4F5F6 A 15/08/2005 1 PVC 125 0 8.25
A 15/08/2005 2 STEL 200 0 5.25A 15/08/2005 3 PERF 6 AP 4 8.25A 15/08/2005 4 GRAV 5 GR 3.5 8.25A 15/08/2005 5 FILL 8.25 20A 15/08/2005 6 FILL 3 3.5A 15/08/2005 7 FILL 3.5 4A 15/08/2005 8 GROU 225 0 3
F7F8F9 A 20/05/2003 1 PVC 9 WT 0 24.5
A 20/05/2003 2 PERF 6 AP 21.5 24.5A 20/05/2003 3 FILL 6 24.5A 20/05/2003 4 GROU 175 0 6
A 20/06/2005 2 GRAV 5 GR 8 40A 20/06/2005 3 FILL 6 8A 20/06/2005 4 GROU 225 0 6
C19C20 C21
Bronwyn Jones Page 115
CRICOS No. 00213J
Aquifer Table
BORE RDATE REC CONDITION TOTAL BORE DEPTH WATER STRUCK AT SWL YIELD (L/sec) TOP OF AQ BOTTOM CONTRIB AQ FLOW WATER TABLE (ASL) GENERAL AQUIFER MATERIAL OTHER NOTES
F1F2 metamorphic rockF3F4F5F6 15/08/2005 1 UC 20 4 & 11.5 -3 0.0625 4 Y N 50.67713928000F7F8F9 20/05/2003 1 UC 24.5 22.5 -17.5 0.687 22.5 Y N 69.80635071000F10F11 13/10/2004 1 UC 25 1 -0.2 0.7 1 7 Y N 64.29034119000F12 28/06/2006 1 UC 24 16 -13 0.225 16 Y N 76.88522339000 Bore located in backyard, a flat area with all trees; H2S rotten egg smellF13 25/01/2004 1 14.5 (9 - 12.5) -5.5 0.312 9 95.74707031000F14 23/03/2006 1 32 - .- .- (NIL) .- .- Says he doesn't have a bore (but is on the Gov register)F15 Bore located in corner of front yard in garden bed, under metal cover; Pump is all closed upF16 1/06/1993 1 46 4.5 & 30 -4.5 0.25 4.5 85.99937439000 Bore located down backyard; Very Salty, Never used; Approx flow rate of a garden hose, ~180 gall/hrF17 16/10/2006 1 45 - .- .- (NIL) .- .-F18F19 5/09/2006 1 23.5 - .- .- (NIL) .- .- fresh granite New bore located down yard near/beside gully; Very close to mountain; no sign of finding any waterF20 fresh granite Old bore is located left of front gate/driveway; ~50 gallons/hr ~20 yrs ago; Now only a trickle (none)F21 13/09/2004 1 UC 15 9 -4.5 0.75 9 Y N 88.92050171000 Neighbours have boresF22F23 29/07/2004 1 UC 26.15 18 -10 0.31 18 Y N 61.82234955000F24 - .- .- (NIL) .- No water, but area does some bores with waterF25 15/06/2006 1 UC 13.75 6.5 & 10.5 -4.5 0.75 6.5 10.5 Y N 79.71795654000F26F27F28 weathered granite Bore located down the backyard in natural shallow drainage gully; High iron content, neighbours have boresF29 -5.52 91.67663270000 weathered granite Bore located down the backyard in natural shallow drainage gully; High iron content, neighbours have boresF30 11/06/2004 1 UC 21.5 11 -0.5 1 11 Y N 85.29429626000F31 weathered granite Bore located in front corner of yard, beside driveway (opposite QUT farm slab hut gate); bore damaged/run over by husbandF32F33F34 29/08/2003 1 UC 10.75 8 -1.75 0.75 8 Y N 81.93528748000F35F36 1/12/2005 1 UC 16.5 9.5 -3.25 0.75 9.5 14.5 Y 104.00304413000 metamorphic rockF37 metamorphic rock Bore located in gully way down front yard; Highly Fe stained, Not used in yearsF38H1 2/02/2004 1 UC 24 9 & 18.5 -6.5 0.187 (SOAK) 9 18.5 Y 65.86338806000H2A1A2 5/10/2004 1 UC 17.5 6.8 & 12 -5.75 0.625 6.8 Y N 89.42948914000A3 15/07/2004 1 FR 32 20 -7 0.062 20 Y N 93.23847198000A4 10/01/2005 1 UC 10 7 -1.75 0.187 7 Y N 154.33226013000 Bore located in large natural gully down front of yard/houseB1 15/08/2006 1 UC 11 6 & 9 -3 1 6 Y N 83.79467773000A5A6A7 8/07/2005 1 60 .- .- .- (NIL) .- .-A8 16/07/2007 1A9 ~17.68 Originally 400gallons/hr; Now 160 gallons/hrA10 11/08/2006 1 53.5 .- .- .- (NIL) .- .-B2 4/11/2003 1 FR 11.5 5.5 -2 0.25 5.5 Y N 133.64080811000A11A12A13 1/02/1993 1A14B3 -9.88 123.67584717000B4 15.9 -9.1 * 113.06873932000 Deco Bore located down sloping backyard, under windmill; Neighbours have boresB5 13 8 -4.16 8 76.27265533000 Bore located in front yard, flat area; Depth to water table 4.16m after 2 inches rain; originally 8m & 440 gallons/hrA15
Bronwyn Jones Page 114
CRICOS No. 00213J
Aquifer Table
A16A17A18B6 Bore located on flat ground near front steps of building; Originally 100's gallons/hrA19 4/06/2004 1 UC 24 18 -14.5 0.625 18 Y N 119.70706177000A20 21/08/2006 1 PS 44 35 -13 0.0625 35 Y N 112.18003845000 Fractured granite Bore located in natural gully; Casing has no screen, just slots; originally ~30 gall/hrA21 Bore located down in flat bottom gully; old ones in paddock all run dryA22 12/11/2003 1 UC 49 44 -21 0.25 44 Y N 116.83697510000Hard rock (20-30ft decayed then hit rock)Bore located in front, flat yard; Flow rate of normal garden hose A23 ~36.57 ~27.13 fractures Bore located in natural gully; Up-gully from 44 Smalls Rd bore in gullyA24A25A26 H3 1/01/1950 1G1 1/01/1990 1E1 6/05/2006 1 UC 13.75 8 -2.5 1 8 Y N 87.46067810000 weathered granite Bore located down front yard, next to damG2A 29/02/1988 1 WZ 9.1 -1.66 9.1 10.9 47.19353851000G2B 29/02/1988 2 FR 18.59 12.8 -1.66 12.8 15.8 47.19353851000E2E3 7/07/2006 1 UC 26.6 22.7 -20 0.05 22.7 Y N 61.58985901000E4 23/10/2006 1 33.5 9 NA 0.006 9E5 13/06/2006 1 UC 34 5 (SOAK) NA .- (V. LOW) 5 No water out of it, Not usedE6 24/10/2006 1 33.5 .- .- .- (NIL) .- .-E7 26/10/2006 1 36.5 .- .- .- (NIL) .- .-D1D2 ~37.8 They used a Water DivinerE8 29/06/2006 1 23 16 -15 0.187 16 65.64530945000E9 20 metamorphic rock Bore located in a small, flat bottom drainage gully; Bore within the contact zone of silicified metamorphic schistsE10 22/09/2003 1 30E11 16/08/2005 1 UC 24 8.5 -6.25 0.075 8.5 Y N 51.27365875000D3E12 5/01/2006 1 UC 15.25 7.5 -5.5 0.31 7.5 Y N 82.39140320000D4 3/03/1993 1 38.1 .- .- .- (NIL) .- .- fractured? granite Dry boreD5 1/01/1991 1E13 1/11/2006 1 9 6.5 -1.25 1 6.5 76.53344727000G3 24/11/2006 1 20 9 & 13 -5 0.225 9 39.08166885000D6 27/07/2004 1 FR 36 17 -12.5 0.08 17 Y N 56.03141785000E14E15 25/10/2006 1 39 36 -2.5 0.25 36 51.22098160000D7E16 25/01/2006 1 UC 21.5 12 -1.5 - 12 N 107.60725403000 Only a trickle, not usedG4 13/08/2007 1G5C1C2 2/05/2003 1 UC 25 17 -4 0.02 17 Y N 127.57356262000C3 9/05/2003 1 31C4 2/05/2003 1 25 17 -4 0.025 17 90.87135315000C5 9/05/2003 1 31 .- .- .- (NIL) .- Nil water, bore abandonedC6C7C8C9C10C11 -1.8 80.17336578000 alluvium Bore located near former (now dry) Dam; in paddock; The bore was NOT put in by her (last 5 yrs) or the previous ownerC12 3/03/2004 1 UC 14 9 -5.5 0.437 9 Y N 102.25466156000C13 20/05/2003 1 FR 14 7 0.5 7 12 YC14 18/10/2006 1 UC 14 5 & 9 -3 0.43 5 N 97.18775177000C15 20/03/2006 1 UC 15.5 6 & 10 -5.5 0.162 6 10 Y N 93.51816559000 Bore located in gully down sloping backyardC16 20/05/2006 1 14 7 & 9 -1.75 0.5 7 105.73023987000 Bore located in gully down sloping backyardC17C18 20/06/2005 1 UC 40 25 -18 0.018 25 N 79.03181458000 She reckons bore is only a trickle, or practically none, but it is 0.018L/secC19C20 Bore located near dam in paddock with horses; No pump, just PVC pipe; they only use rainwater tanksC21
* -9.1 in 2007, originally -7.3
Bronwyn Jones Page 115
CRICOS No. 00213J
Water Analysis Table
BORE PIPE TEST DATE REC ANALYST ANALYSIS NO SAMP METHOD S OURCE DEPTH FIG MERIT NA ADS RATIOF1F2 A 31/07/2007 1 B Jones@QUT GBF3F4F5 A 28/06/2007 1 B Jones@QUT GBF6F7F8F9 A 28/06/2007 1 B Jones@QUT GBF10 A 16/12/1982 1 GCL 95968 GB 20 1.8 2.1F11F12 A 21/06/2007 1 B Jones@QUT GBF13F14 - DRY BORE - - - - - - - -F15 A 21/06/2007 1 B Jones@QUT GBF16 A 18/06/1993 1 DPI 93 6 809 PU GB 1 5.5F17 - DRY BORE - - - - - - - -F18F19 - DRY BORE - - - - - - - -F20F21F22F23 A 28/06/2007 1 B Jones@QUT GBF24 - DRY BORE - - - - - - - -F25F26F27F28 A 28/06/2007 1 B Jones@QUT GBF29F30F31 A 28/06/2007 1 B Jones@QUT GBF32F33F34F35F36F37F38H1H2 A 8/09/1988 1 GCL 126647 PU GB 5 0.7 3.8A1A2A3 A 31/07/2007 1 B Jones@QUT GBA4 A 21/06/2007 1 B Jones@QUT GBB1A5A6A7 - DRY BORE - - - - - - - -A8A9 A 5/06/2007 1 B Jones@QUT GBA10 - DRY BORE - - - - - - - -B2A11A12A13 A 31/07/2007 1 B Jones@QUT GBA14B3 A 21/06/2007 1 B Jones@QUT GBB4 A 21/06/2007 1 B Jones@QUT GBB5 A 6/03/2007 1 PRSC HD07NA1696 GB 1.1 2.7A15A16A17A18 A 21/06/2007 1 B Jones@QUT GBB6 A 28/06/2007 1 B Jones@QUT GBA19
Bronwyn Jones Page 120
CRICOS No. 00213J
Water Analysis Table
A20A21 A 5/06/2007 1 B Jones@QUT GBA22 A 5/06/2007 1 B Jones@QUT GBA23A24A25A26H3 A 1/01/1950 1 GCL 1 GB 5G1 A 2/08/1993 1 DPI PU GB 1.1 3.2E1 A 31/07/2007 1 B Jones@QUTG2A A 29/02/1988 1 GCL 123686 PU GB 19 1.1 2.2G2B A 1/03/1988 1 GCL 123688 PU GB 19 1.2 1.9G2C A 21/04/1988 1 GCL 123852 GB 19E2 A 31/07/2007 1 B Jones@QUT GBE3E4E5E6 - DRY BORE - - - - - - - -E7 - DRY BORE - - - - - - - -D1D2 A 31/07/2007 1 B Jones@QUT GBE8E9 A 5/06/2007 1 B Jones@QUT GBE10E11D3E12 A 31/07/2007 1 B Jones@QUT GBD4 - DRY BORE - - - - - - - -D5 A 1/10/1991 1 GCL 140851 BA GB 30 0.4 12.2E13 31/07/2007G3D6 A 31/07/2007 1 B Jones@QUT GBE14E15 A 31/07/2007 1 B Jones@QUTD7 A 1/10/1979 1 GCL 82698 GB 0.5 6.5E16G4G5C1 A 31/07/2007 1 B Jones@QUT GBC2C3C4C5 - DRY BORE - - - - - - - -C6C7C8C9C10C11 A 10/07/2007 1 B Jones@QUT GBC12C13C14C15 A 21/06/2007 1 B Jones@QUT GBC16 A 21/06/2007 1 B Jones@QUT GBC17C18C19C20 A 10/07/2007 1 B Jones@QUT GBC21
Bronwyn Jones Page 121
CRICOS No. 00213J
Water Analysis Table
RES ALK TOTAL IONS TOTAL SOLIDS HARD ALK SiO2 Al Sr Mn Fe Mg
C16 DRILLING CARRIED OUT IN SMALL ALLUVIAL FLAT APPROX. 50m WIDE.
C17C18 124664 THIS PARTICULAR PART OF WIGHTS MT HAS A PROVEN HISTORY OF SALTY WATER. OWNER WAS PREPARED TO DILUTE BY
PUMPING TO HIS DAM. WATER USED FOR GARDEN PURPOSES. OWNER DECIDED TO SUPPLY SUITABLE CASING & CASE BORE
FOR FUTURE DEEPENING IF EVER DECIDED.
C19C20C21
Bronwyn Jones Page 132
CRICOS No. 00213J
Other Bores in Samford Valley Table
BORE LATITUDE LONGITUDE FIELD LOCATION
1 27'24',39" S 152"5 14" E North side of BETTS ROAD, CAMP MOUNTAINa 27'24',41" S 152"5'21 " E South side of BETTS ROAD, CAMP MOUNTAIN3 27"24',39" S 152"5'26" E North side of BETTS ROAD. CAMP MOUNTAIN4 27"24'46" S 152"5'42" E South side of BETTS ROAD, CAMP MOUNTAIN5 27"24'47" S 152"5'46" E South side of BETTS ROAD. CAMP MOUNTAIN
6 27"24'38" S 152"5'53" E West side of BETTS ROAD. CAMP MOUNTAIN7 27"24'37" S 152'5 '57" E West side of BETTS ROAD (Near Mitchell Park). CAMP MOUNTAIN
9 27"24',17" S 152"5'54" E 86 DOMROW ROAD, CAMP MOUNTAIN
0 27"24',21" S 152"5'5 '1" E North side of DOMROW ROAD on corner of UPPER CAMP MOUNTAIN ROAD, CAMP MOUNTAINI 27"24'24" S 152"5'53" E South side of corner of UPPER CAMP MOUNTAIN ROAD & DOMROW ROAD. CAMP MOUNTAIN2 27"24'24" S 152"5 48" E UPPER CAMP MOUNTAIN ROAD (Opp DOMROW ROAD), CAMP MOUNTAIN
27"24'19" S 152"5'47" E UPPER CAMP MOUNTAIN ROAD (Near DOMROW ROAD). CAMP MOUNTAIN4 27'24'18" S 152"5 46" E UPPER CAMP MOUNTAIN ROAD (Near DOMROW ROAD), CAMP MOUNTAIN
27'24'12" S 152"5 '43" E South side of UPPER CAMP MOUNTAIN ROAD. CAMP MOUNTAIh27"24"t1" S 152"5 46" E South side of bend in UPPER CAMP MOUNTAIN ROAD, CAMP MOUNTAIN
7 27"24',09" S 152"5 41" E North side of bend in UPPER CAMP MOUNTAIN ROAD, CAMP MOUNTAIN
8 27"24'42" S 152"5'52" E North side of bend in UPPER CAMP MOUNTAIN ROAD, CAMP MOUNTAIN
I 27"23',59" S 152"5'58', E North side of bend in UPPER CAMP MOUNTAIN ROAD, CAMP MOUNTAIi\20 27'23',27" S 152"52',48" E South side of UPPER CAMP MOUNTAIN ROAD (Near QUT Farm), CAMP MOUNTAIN21 27'23'41" S 152"52'23" E LES-DOUGLAS COURT "Auchen Eden" (Yellow Post 108), CAMP MOUNTAII22 27"23'47" S 152"52',10" E RICHARDS ROAD (NE corner of UPPER CAMP MOUNTAIN ROAD). CAMP MOUNTAIA23 27'23'55" S 152"52'02" E 172 UPPER CAMP MOUNTAIN ROAD "Greenvale", CAMP MOUNTAIT\
24 27'23'56" S 152"52',01" E UPPER CAMP MOUNTAIN ROAD (Yellow Post 178), CAMP MOUNTAIh
25 27'23'13" S 152'53'09" E McCOMBE ROAD, CAMP MOUNTAIT\zo 27"23'48" 5 152"53'32" E McLEAN ROAD SOUTH, CAMP MOUNTAIT\
1 2 7 27'22'55" S 152'53'28" E End of PETERSON ROAD, CAMP MOUNTAIil28 27"22'.51" S 152'53 '31" E Between PETERSON ROAD & SAMFORD ROAD, CAMP MOUNTAIN29 27"23'58" S 152"53',14" E 4 VONNE COURT, CAMP MOUNTAII\?n 27"23'55" S 152"53',17" E 3 VONNE COURT, CAMP MOUNTAII\
1 3 1 27'24',04" S 152"53'.17" E 9 VONNE COURT, CAMP MOUNTAII\
2 1 27'21'09" S 152'53',02" E Next to (North ofl South Pine River & Near Yuqar Park, DRAPEF3 1 27"22'.49" S 152"48',29" E DAWSON CREEK ROAD, HIGHVALE
R 2 27'23'00" S 152"48'16" E West side of DAWSON CREEK ROAD, HIGHVALE
R 3 27"23'05" S 152"48',24" E West side of DAWSON CREEK ROAD, HIGHVALE
3 4 27"23',01" S 152'48'26" E East side of DAWSON CREEK ROAD, HIGHVALE
3 5 27'23',17" S 152"48',13" E South side of DAWSON CREEK ROAD, HIGHVALE
J O 27"23',16" S 152"48'09" E South side of DAWSON CREEK ROAD, HIGHVALE
i 7 27"23',02" S 152"48'30" E 61 DAWSON CREEK ROAD, HIGHVALE
3 7 27"23',17" S 152'47'37" E 242 DAWSON CREEK ROAD, HIGHVALE
3 B 27'22'53" S 152"47'53" E GOAT TRACK, HIGHVALE
J J 27"22',40" S 'r s2'48'09" E Cnr GOAT TRACK & MOUNT GLORIOUS ROAD. HIGHVALE
3 27'21',45" S 152"49',32" E North of HOUSEWOOD COURT. HIGHVALE
1 27"21'47" S 152"49'28" E NOrth Of HOUSEWOOD COURT. HIGHVALE4 2 27"23'08" S 152'49'33" E HULCOMBE ROAD, HIGHVALE3 27"23'31" S 152'49'25" E HULCOMBE ROAD (Oop PACKER LANE). HIGHVALE
4 27"2339'" S 152'49'41" E East side of southern end of HULCOMBE ROAD. HIGHVALE' l 5 27"23'29" S 152"49',54" E Southern end of HULCOMBE ROAD, HIGHVALE
B 27"23'.12" S 152"49',26" E KAREELA DRIVE (Near Cnr HULCOMBE ROAD), HIGHVALE
7 27"23',00" S 152"49'44" E 3 MESSMATE COURT. HIGHVALE
B 8 27"23',01" S 152"49',44" E 5 MESSMATE COURT, HIGHVALE
J 9 27'22',37" S 152'48'09" E MOUNT GLORIOUS ROAD (Ooo GOAT TRACK), HIGHVALE320 27"22',39" S 152"48'39" E MOUNT GLORIOUS ROAD, HIGHVALE
321 27"22',34" S 152"48'09" E East side of bend in MOUNT GLORIOUS ROAD, HIGHVALE
3 2 2 27"22',43" S 152'48',12" E Near bend. south side of MOUNT GLORIOUS ROAD, HIGHVALE
5 t J 27'22'40" S 't52"48'24" E North side of bend in MOUNT GLORIOUS ROAD. HIGHVALE
3 2 4 27"22'39" 5 152"48',32" E North side of bend in MOUNT GLORIOUS ROAD, HIGHVALE
s t J 27"22'24" S 152"48'05" E West side of bend in MOUNT GLORIOUS ROAD, HIGHVALE
326 27'23'35" S 152"49',22" E PACKER LANE, HIGHVALE
3 2 7 27"21'49" S 152"50'03" E REINERS ROAD, HIGHVALE
27"22'14" S 152'48'57" E Next to huqe dam to the west of the SHOWGROUNDS, HIGHVALE
: Z J 27'22'36" S 152"49'35" E Either 10 NORWOOD COURT or house behind i t in 5 SHOWGROUNDS DRIVE, HIGHVALE
: 3 0 27'23',20" S 152"49',14" E Cnr SMALLS ROAD & RYDER ROAD, HIGHVALE
2 3 1 27"23'22" S 152"49',14" E SMALLS ROAD (Opp CHAROLAIS PLACE), HIGHVALE
: J Z 27'2328 5 152"49 '15" E East side of SMALLS ROAD, HIGHVALE
Bronwyn Jones Page 133
CRICOS No. 00213J
Other Bores in Samford Valley Table
13 33 27"23'.28" S 152"49',11" E West side of SMALLS ROAD, HIGHVALE)4 1 27"21'38" 5 152'54'03" E BURTON LANE. SAMFORD VALLE\) 4 2 27"21',42" S 152'54'00" E BURTON LANE, SAMFORD VALLEI) 4 3 27"22',03" S 152'53',34" E CORELLA AVENUE (Opp SERENDIPITY DRIVE), SAMFORD VALLEY) 4 4 27'21'51" S 152"52'01" E End of MAMGANI COURT (Either 31 or 33), SAMFORD VALLE\) 4 5 27"22'27" S 1 52'50'53" E South of MOUNT GLORIOUS ROAD (Between Reqoli Ct & Parkwood Dr), SAMFORD VALLE\1 4 6 27'22',28" S '1 52"50'52" E South of MOUNT GLORIOUS ROAD (Between Reqoli Ct & Parkwood Dr). SAMFORD VALLEY) 4 7 27'22'22" S 152"52',02" E South side of MOUNT GLORIOUS ROAD (Opp 22OMT GLORIOUS ROAD), SAMFORD VALLE\) 4 8 27"21',30" S 152'49'56" E Cnr MAYFIELD & MOUNT O'REILLY ROAD "Jualbren". SAMFORD VALLE\) 4 9 27"23'26" 5 152'51'54" E RICHARDS ROAD (Yellow Post 24?) Opp PONY CLUB & SOCCER CLUB, SAMFORD VALLEY1 4 1 0 27"22',04" S 1 5 2 " 5 1 ' 4 9 " E RIVERINE COURT, SAMFORD VALLE\) 4 1 1 27"22'03" S 152"54'03" E SYLVATERRE COURT, SAMFORD VALLEY)4 12 27"22',44" S 152 ' '5210 'E WIGHTS MOUNTAIN ROAD (Between Furlonqer Road & Sheppard Street), SAMFORD VALLE\) 4 1 3 27"22',4s" S 152"52'.16" E WIGHTS MOUNTAIN ROAD (Between Furlonger Road & Sheppard Street), SAMFORD VALLE\)5 1 27"23',42" S 152'50'05" E 3 JANLEY COURT, WIGHTS MOUNTAIN) 5 2 27"24',00" S 152'50',39" E Bend in OATLANDS ROAD (Near No.68), WIGHTS MOUNTAIN
27'23'55" S 152"50 '39" E Bend in OATLANDS ROAD (Near No.68 & Further up driveway), WIGHTS MOUNTAIN) 5 4 27"23',37" S 152'50'20" E Bend in SMITHS ROAD (Near RIVE COURT). WIGHTS MOUNTAIh1 5 5 27"23',55" 5 152'51'22" E West side of UPPER WIGHTS MOUNTAIN ROAD, WIGHTS MOUNTAIN) 5 6 27'23',48" 5 1 5 2 " 5 1 ' 1 3 " E East side of corner of UPPER WIGHTS MOUNTAIN ROAD. WIGHTS MOUNTAIil
3ronwyn Jones Page 134
CRICOS No. 00213J
Bronwyn Jones
APPENDIX 3
Groundwater Analytical Procedures
CRICOS No. 00213J
Bronwyn Jones
Analysis of ALKALINITY (BICARBONATES) in the ground water samples by:
ACID TITRATION
The alkalinity of a sample is due to the presence of hydroxide, carbonate or
bicarbonate ions. No carbonate or hydroxide alkalinity is recorded for this study since
phenolphthalein alkalinity equals zero (i.e. pH <8.3).
Detection limit
0.25 ppm CaCO3 (mg/L)
Apparatus
• 250 mL conical flasks or beakers
• Calibrated pH meter
• 50 mL pipette and burette
• Spin bar magnet and magnetic stirrer plate
• Reagent: 0.01N Standard HCl (or 0.1N HCl if pH>8.3)
Procedure
1) Pipette 100mL of groundwater sample into a 250 mL beaker. Measure the pH of the
sample. If pH is less than 8.3 then titrate the sample with 0.01N HCl to pH 4.7 (If pH
is >8.3 use 0.1N HCl). All the while, use a magnetic stirrer and leave pH probe in
sample while titrating. Record total volume of HCl used/titrated.
2) Then, continue to titrate the solution further to reduce the pH exactly 0.30 pH units to
pH 4.3 and record the final volume.
NOTE: As the end point is approached make smaller additions of acid and be sure that pH
equilibrium is reached before adding more titrant.
Calculation of Bicarbonate Alkalinity as CaCO 3
T mg/L CaCO 3 = (2B – C) ×××× N ×××× 50 000 / volume of sample
where B = mL of titrant to first recorded pH (e.g. 56 mL HCl to pH 4.7)
C = total mL of titrant to reach pH 0.3 unit lower (e.g. 58.5mL HCl to pH 4.4)
N = normality of acid (e.g. 0.01N HCl)
E.g. (2 × 56 – 58.5) × 0.01 × 50 000 / 100 mL
= (112 – 58.5) × 5
= 267.5 mg/L CaCO3
To convert bicarbonate expressed as alkalinity to concentration of own species to be used in
a mass balance (only if pH >8.3) multiply by the following factor:
Bicarbonate in mg/L HCO 3– = ………mg/L CaCO 3 x 1.22
CRICOS No. 00213J
Bronwyn Jones
Analysis of CATIONS in the groundwater samples by: