Occurrence and Distribution of Cyanobacteria and their Toxins in Silver Lake, New Hampshire Françoise Morison Dept. of Biological Sciences, University of New Hampshire, Durham, NH 03824 UNH Center for Freshwater Biology Research 11 (1): 1-16 (2009) Acknowledgements I would like to thank Dr. Al Baker and Dr. James Haney for their unabated enthusiasm and support in our limnologi- cal studies. I am much indebted to Amanda Murby and Carol Elliott for their encouragements and endless contributions to the class, including the immense task of organizing the lakes data. I am grateful for being able to share my experi- ence with wholehearted and dynamic classmates. They were all dedicated partners in the field, data analysis, and paper review. Introduction The production of toxins by cyanobacteria (Chorus et al., 2000) has magnified the problems blooms create, consequently raising concern about the quality of freshwater resources (Reynolds, 2006). Thorough assessments of the prevalence and spatial distribution of cyanobacteria within bodies of freshwater are needed in order to make well-informed decisions regarding the manage- ment and use of water resources. Cyanobacterial blooms in ponds, lakes, and rivers are not a new occurrence, yet in the past 50 years they have be- come more common (Reynolds, 2006; Carmichael, 2007). Pelagic photosynthetic communities tend to become dominated by cyanobacteria in nutrient enriched systems (Reynolds, 2006). Harmful bloom events and episodes of related fatal in- toxication of cattle (Mez et al., 1997) and dogs (Edwards et al.1992; Hoff et al., 2007; Cadel-Six et al., 2007) have been increasingly documented worldwide. Similar events have happened through- out North America (Carmichael, 2007). Good re- views of the various cyanobacterial toxins exist in the literature (Falconer, 1999; Briand et al., 2003). Microcystis is the most common genus of cya- nobacteria to form blooms (Chorus et al., 2000; de Figueiredo et al., 2004). Along with other genera, it produces the hepatotoxin microcystin (MC). Several cases of illnesses have been attributed to exposure to the toxin both in drinking and recre- ational waters (Chorus et al., 2000). M. aerugi- nosa commonly occurs in New Hampshire lakes. A statewide study detected the presence of the cyanobacteria and of its MC toxin in the 50 lakes surveyed in New Hampshire (Haney and Ikawa, 2001). Risk of exposure to potentially harmful levels of MC may be increased by the tendency of certain Microcystis to form surface scums (Chorus and Bartram, 1999). Surface accumulations may oc- cur as a result of the cells’ ability to regulate their buoyancy by the formation of gas vesicles 1 Abstract A study of Silver Lake, NH was performed as part of a 5-lake assessment of cyanobacteria prevalence and distribution. Multi-parameter fluorescence probe measurements of chlorophyll a and cyanobacteria concentra- tions (PC, phycocyanin fluorescence) were evaluated in addition to physical and chemical characteristics of the lake. Silver Lake did not exhibit summer stratification suggesting a recent mixing event. It had oligotrophic levels of Chlorophyll a (1.93 ± 0.06 mg L -1 ) and of TP (10.10 mg L -1 ), yet PC levels were the highest of all the lakes studied (248691 ± 963 Microcystis cell equivalents mL -1 ). The cyanobacteria Microcystis dominated the phytoplankton community. Microcystin levels varied from a mean 72.43 ± 21.21 pg mL -1 in transect water to 137.69 ± 46.9 pg mL -1 in sediment water. Chlorophyll distribution was rather homogeneous while cyanobacteria levels were highest towards the shallow, embayed NE part of the lake where a section of a State Park beach is located. Implications include potential increase in exposure to toxins by water users. Heterogeneous distribu- tion of cyanobacteria emphasizes the importance of extensive sampling beyond pelagic sampling sites to more accurately inform decision-making regarding health and safety of water bodies. UNH Center Freshwat. Biol. Res. 11(1): 1-16 (2009)
Transcript
Occurrence and Distribution of Cyanobacteria and their Toxinsin Silver Lake, New Hampshire
Françoise MorisonDept. of Biological Sciences, University of New Hampshire, Durham, NH 03824
UNH Center for Freshwater Biology Research 11 (1): 1-16 (2009)
Acknowledgements I would like to thank Dr. Al Baker and Dr. James Haney for their unabated enthusiasm and support in our limnologi-cal studies. I am much indebted to Amanda Murby and Carol Elliott for their encouragements and endless contributions to the class, including the immense task of organizing the lakes data. I am grateful for being able to share my experi-ence with wholehearted and dynamic classmates. They were all dedicated partners in the field, data analysis, and paper review.
Introduction
The production of toxins by cyanobacteria (Chorus et al., 2000) has magnified the problems blooms create, consequently raising concern about the quality of freshwater resources (Reynolds, 2006). Thorough assessments of the prevalence and spatial distribution of cyanobacteria within bodies of freshwater are needed in order to make well-informed decisions regarding the manage-ment and use of water resources. Cyanobacterial blooms in ponds, lakes, and rivers are not a new occurrence, yet in the past 50 years they have be-come more common (Reynolds, 2006; Carmichael, 2007). Pelagic photosynthetic communities tend to become dominated by cyanobacteria in nutrient enriched systems (Reynolds, 2006). Harmful
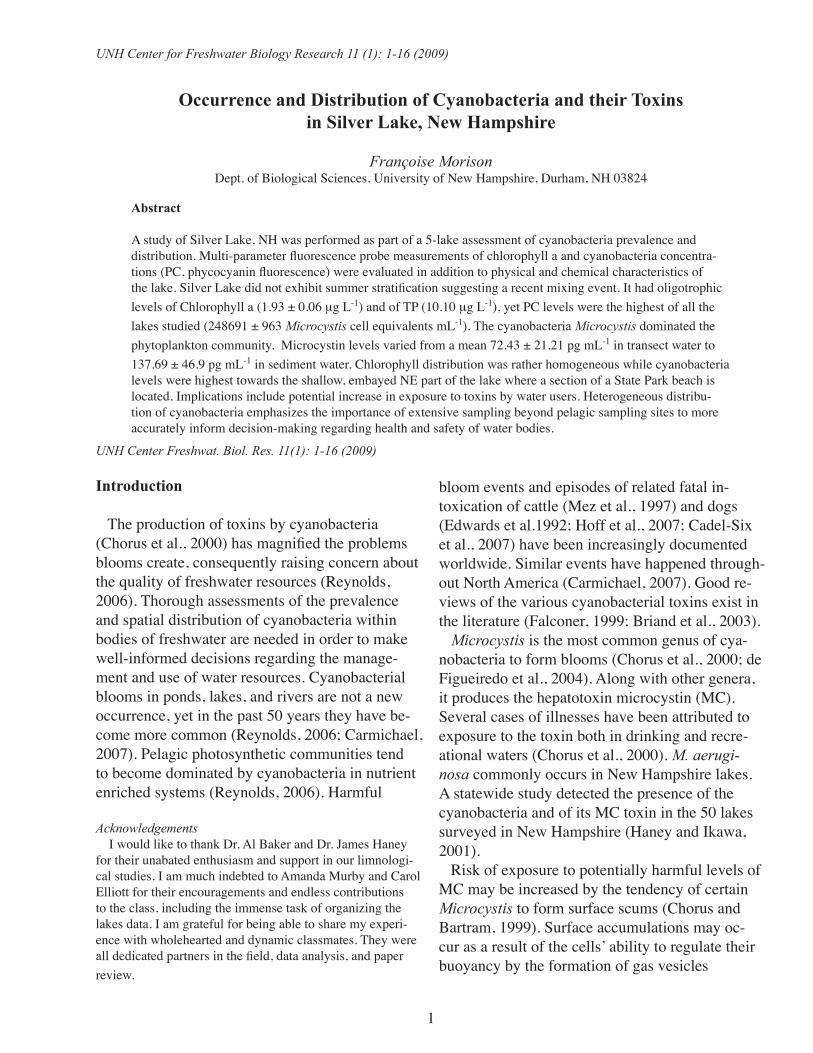
bloom events and episodes of related fatal in-toxication of cattle (Mez et al., 1997) and dogs (Edwards et al.1992; Hoff et al., 2007; Cadel-Six et al., 2007) have been increasingly documented worldwide. Similar events have happened through-out North America (Carmichael, 2007). Good re-views of the various cyanobacterial toxins exist in the literature (Falconer, 1999; Briand et al., 2003). Microcystis is the most common genus of cya-nobacteria to form blooms (Chorus et al., 2000; de Figueiredo et al., 2004). Along with other genera, it produces the hepatotoxin microcystin (MC). Several cases of illnesses have been attributed to exposure to the toxin both in drinking and recre-ational waters (Chorus et al., 2000). M. aerugi-nosa commonly occurs in New Hampshire lakes. A statewide study detected the presence of the cyanobacteria and of its MC toxin in the 50 lakes surveyed in New Hampshire (Haney and Ikawa, 2001). Risk of exposure to potentially harmful levels of MC may be increased by the tendency of certain Microcystis to form surface scums (Chorus and Bartram, 1999). Surface accumulations may oc-cur as a result of the cells’ ability to regulate their buoyancy by the formation of gas vesicles
1
Abstract
A study of Silver Lake, NH was performed as part of a 5-lake assessment of cyanobacteria prevalence and distribution. Multi-parameter fluorescence probe measurements of chlorophyll a and cyanobacteria concentra-tions (PC, phycocyanin fluorescence) were evaluated in addition to physical and chemical characteristics of the lake. Silver Lake did not exhibit summer stratification suggesting a recent mixing event. It had oligotrophic levels of Chlorophyll a (1.93 ± 0.06 mg L-1) and of TP (10.10 mg L-1), yet PC levels were the highest of all the lakes studied (248691 ± 963 Microcystis cell equivalents mL-1). The cyanobacteria Microcystis dominated the phytoplankton community. Microcystin levels varied from a mean 72.43 ± 21.21 pg mL-1 in transect water to 137.69 ± 46.9 pg mL-1 in sediment water. Chlorophyll distribution was rather homogeneous while cyanobacteria levels were highest towards the shallow, embayed NE part of the lake where a section of a State Park beach is located. Implications include potential increase in exposure to toxins by water users. Heterogeneous distribu-tion of cyanobacteria emphasizes the importance of extensive sampling beyond pelagic sampling sites to more accurately inform decision-making regarding health and safety of water bodies.
UNH Center Freshwat. Biol. Res. 11(1): 1-16 (2009)
(Reynolds, 2006). The detection of any heteroge-neous distribution of cyanobacteria or their toxins would mandate sampling lakes more extensively, so that collected data can accurately inform local decision-making about the management of a lake and its use. The objective of the present study was to collect data to assess the current physical, chemical, and biological conditions of Silver Lake, a southern New Hampshire body of water popular for sum-mer recreation. We sought to gain an understand-ing of the distribution of cyanobacteria and of MC in the lake, their relationship with each other, with the lake’s trophic status, and with wind and water currents. We expanded upon traditional lake assessments, whose protocols limit measurements of parameters at a deep sampling site. We sampled along horizontal transects in order to detect poten-tial localized surface accumulations of cyanobacte-ria using a fluorescent probe, and investigated the effect of wind and currents using wind drogues.
Methods and Materials
The field investigation of Silver Lake was per-formed on 20 September 2007, as part of a broader assessment of New Hampshire lakes, each under various development-pressure and of different trophic status, including Barbadoes Pond (BP), Lower Sawyer Pond (LSP), Mirror Lake (ML), and Willand Pond (WP) (App. I, table 1).
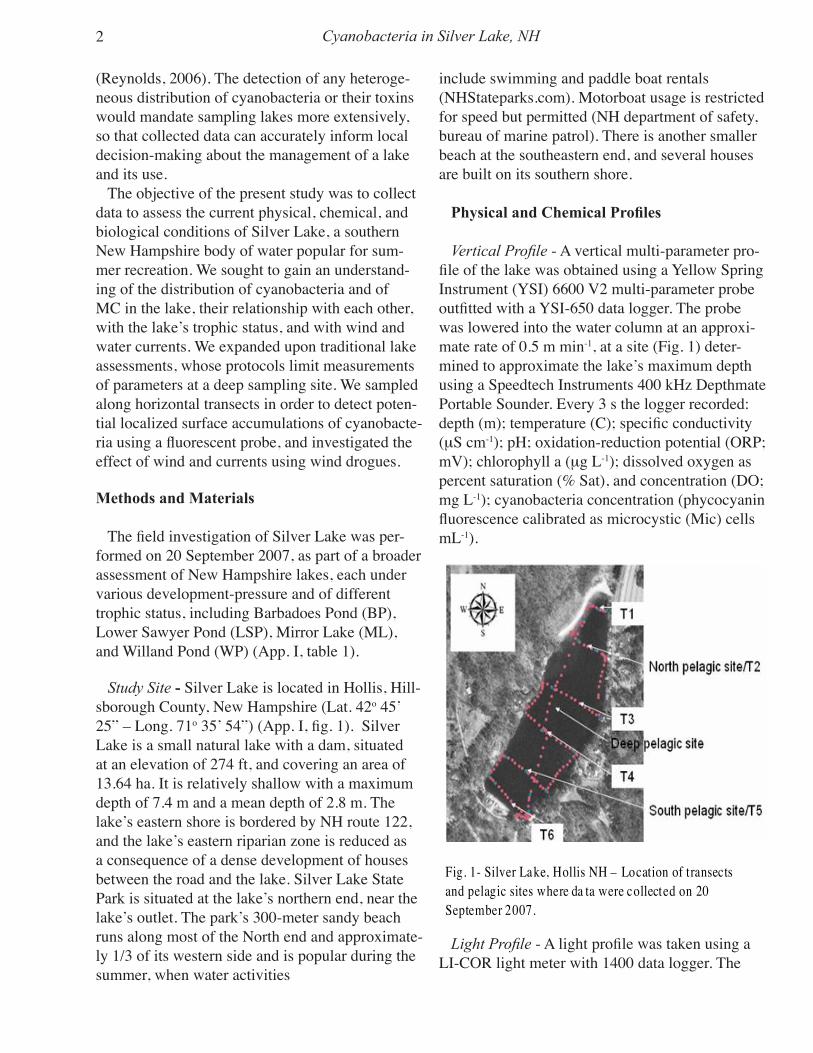
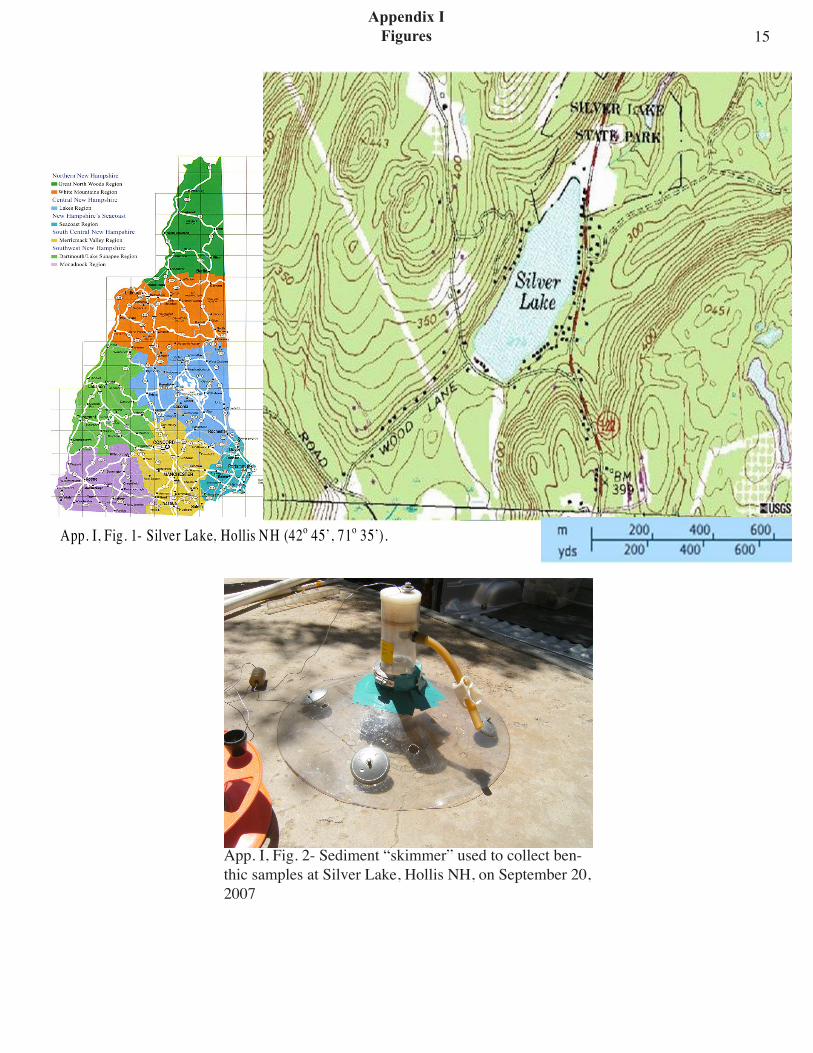
Study Site - Silver Lake is located in Hollis, Hill-sborough County, New Hampshire (Lat. 42o 45’ 25” – Long. 71o 35’ 54”) (App. I, fig. 1). Silver Lake is a small natural lake with a dam, situated at an elevation of 274 ft, and covering an area of 13.64 ha. It is relatively shallow with a maximum depth of 7.4 m and a mean depth of 2.8 m. The lake’s eastern shore is bordered by NH route 122, and the lake’s eastern riparian zone is reduced as a consequence of a dense development of houses between the road and the lake. Silver Lake State Park is situated at the lake’s northern end, near the lake’s outlet. The park’s 300-meter sandy beach runs along most of the North end and approximate-ly 1/3 of its western side and is popular during the summer, when water activities
include swimming and paddle boat rentals (NHStateparks.com). Motorboat usage is restricted for speed but permitted (NH department of safety, bureau of marine patrol). There is another smaller beach at the southeastern end, and several houses are built on its southern shore.
Physical and Chemical Profiles
Vertical Profile - A vertical multi-parameter pro-file of the lake was obtained using a Yellow Spring Instrument (YSI) 6600 V2 multi-parameter probe outfitted with a YSI-650 data logger. The probe was lowered into the water column at an approxi-mate rate of 0.5 m min-1, at a site (Fig. 1) deter-mined to approximate the lake’s maximum depth using a Speedtech Instruments 400 kHz Depthmate Portable Sounder. Every 3 s the logger recorded: depth (m); temperature (C); specific conductivity (mS cm-1); pH; oxidation-reduction potential (ORP; mV); chlorophyll a (mg L-1); dissolved oxygen as percent saturation (% Sat), and concentration (DO; mg L-1); cyanobacteria concentration (phycocyanin fluorescence calibrated as microcystic (Mic) cells mL-1).
Fig. 1- Silver Lake, Hollis NH – Location of transectsand pelagic sites where da ta were collected on 20September 2007.
Light Profile - A light profile was taken using a LI-COR light meter with 1400 data logger. The
Cyanobacteria in Silver Lake, NH2
light probe was lowered through the water column on the sunny side of the sampling boat. Readings were recorded every 0.5 m down to the measured bottom depth. Water transparency was measured using a standard 20 cm diameter Secchi disk. Measurement and recording of Secchi disk depth (SDD) were performed following the stan-dard protocol (Lind, 1974). In order to eliminate interference of surface glare and wind-action, read-ings were taken through a view scope.
Horizontal Profile - A horizontal multi-parameter profile was obtained for each of six linear transects conducted across the lake at even intervals (Fig. 1). Multi-parameter data collection was performed using the YSI multi-parameter probe and data logger used in the vertical profile. Transects were run at a rate of ~3 mph while maintaining the YSI multi-parameter probe at a depth of approx. 0.80 m for data collection. The logger recorded data at 3 s intervals. Time was noted and GPS waypoints were marked to accurately determine the track of each transect. Simultaneously lake-bottom topography and plankton spatial distribu-tion were charted using a sonar system consisting of a high frequency (200-kHz) Lowrance LCX 25 echosounder and a Loran-C navigation receiver. All multi-parameter data and light meter data were uploaded into Microsoft® Office Excel and transferred to Systat SigmaPlot. Sonar files were uploaded and viewed in Sonar Viewer (Lowrance LCX-25C).
Water Currents - Water currents were measured using 4 GPS-tracked drogues made of four nylon panels attached to a PVC frame at right angle to each other. Each drogue was pre-set at a different depth (0.5 m, 1.5 m, 2.5 m, or 3.5 m) and con-nected to a Garmin® Geko 201GPS unit placed in a floating waterproof housing. Drogues were deployed at the same deep pelagic station where the vertical profiling was performed (Fig. 1). Time was recorded and GPS waypoint was marked at drogues release and retrieval. Wind velocity and air temperature were measured using an Extech In-strument mini thermo-anemometer. Wind direction was measured using a hand-held compass.
Water Samples for MC and Total Phosphorus Analyses - Whole lake water (WLW) samples were collected for analysis of both horizontal and verti-cal MC concentrations. For horizontal MC, one 500 ml WLW sample per transect was obtained us-ing a portable Masterflex® peristaltic water sam-pling pump. These samples were collected concur-rently with and from the same depth (approx. 0.80 m) as the multi-parameters gathered during the horizontal profiling. For vertical MC, three 500 ml integrated (0-3 m) water samples (IT WLW) were collected from each of the three pelagic sites (Fig. 1) lowering an integrated sampler (weighted ~2 cm diameter Tygon tube) to a depth of 3 m. Three oth-er integrated (0-3 m) WLW samples were collected from the deep pelagic station for total phosphorus (TP) analysis. All water samples were kept on ice until they were brought to the laboratory, where they were kept frozen until analysis.
Benthic Sediment Samples Collection for MC Analysis - Three sediment samples were obtained from the benthos at each of the three pelagic sta-tions using a “sediment skimmer” (App. I, fig. 2; Will Young, Aquatic Instruments Inc. new design, 2007). The skimmer is designed to collect sedi-ment from the upper 2-3 cm layer. Samples were transferred into 500 ml opaque bottles that were stored on ice in a dark cooler until further process-ing in the laboratory. The sediments in each bottle were allowed to settle and transferred to 90 ml histology jars. These and 20-ml samples of excess sediment water were frozen until analysis.
Water and Sediment Samples Analyses - In prep-aration for MC analysis, the frozen WLW integrat-ed samples underwent three freeze-thaw cycles to lyse the cyanobacterial cells and release the endo-toxins. Three 10-mL subsamples were then trans-ferred to borosilicate glass serum bottles, which were then frozen at a 30o angle to maximize the exposed surface area. Samples were then lyophi-lized (LabConco Freezone 4.5) under a vacuum (~30 x 10-3 mbar) for 18-24 h at -50oC. In order to achieve a 10-fold concentration of materials and increase the sensitivity range of the performed as-say, the dried samples were rehydrated
Cyanobacteria in Silver Lake, NH 3
with 1.0 mL of double distilled Milli-Q water and placed on an orbital shaker for 60 min and the vials were rotated every 15 min. Approx. 1.0 mL of each sample was then filtered through a 13-mm diam, 0.2 mm Whatman PTFE syringe filter into a 1.5 mL centrifuge tube, and frozen. MC analyses were performed on all frozen water samples using Microcystin 96-Well-Plate Kits (EnviroLogix Inc. Portland, ME) Enzyme-Linked Immunosorbent Assay (ELISA). Sediment and sediment water samples for MC analysis underwent a similar preparation excluding the lyophylization, and were also assayed for MC using ELISA. The New Hampshire Lakes Lay Monitoring Program per-formed the TP analyses.
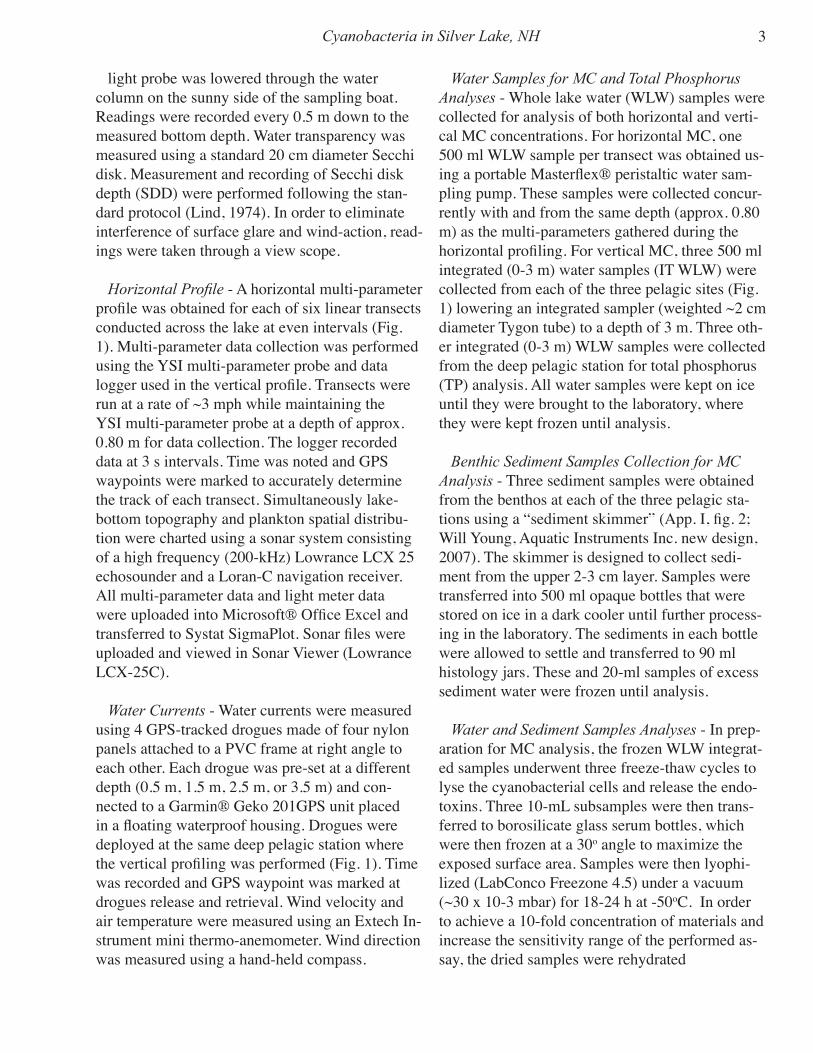
Graphics and Statistics - Statistic analyses were performed (p<0.05) and graphics were generated using SigmaStat and SigmaPlot softwares respec-tively. ORP was corrected for pH (Lampert and Sommer, 1997). Averages of the vertical and hori-zontal profiles’ various parameters were calculated from the data recorded by the multi-parameter probe, and are reported ± standard error. To allow for comparison of triplicate values using ANOVA, North (N), Middle (MNS), and South (S) regions were assigned data as follows: N: T1 to T3; MNS: T3 to T5; S: T4-T6 (Fig. 2).
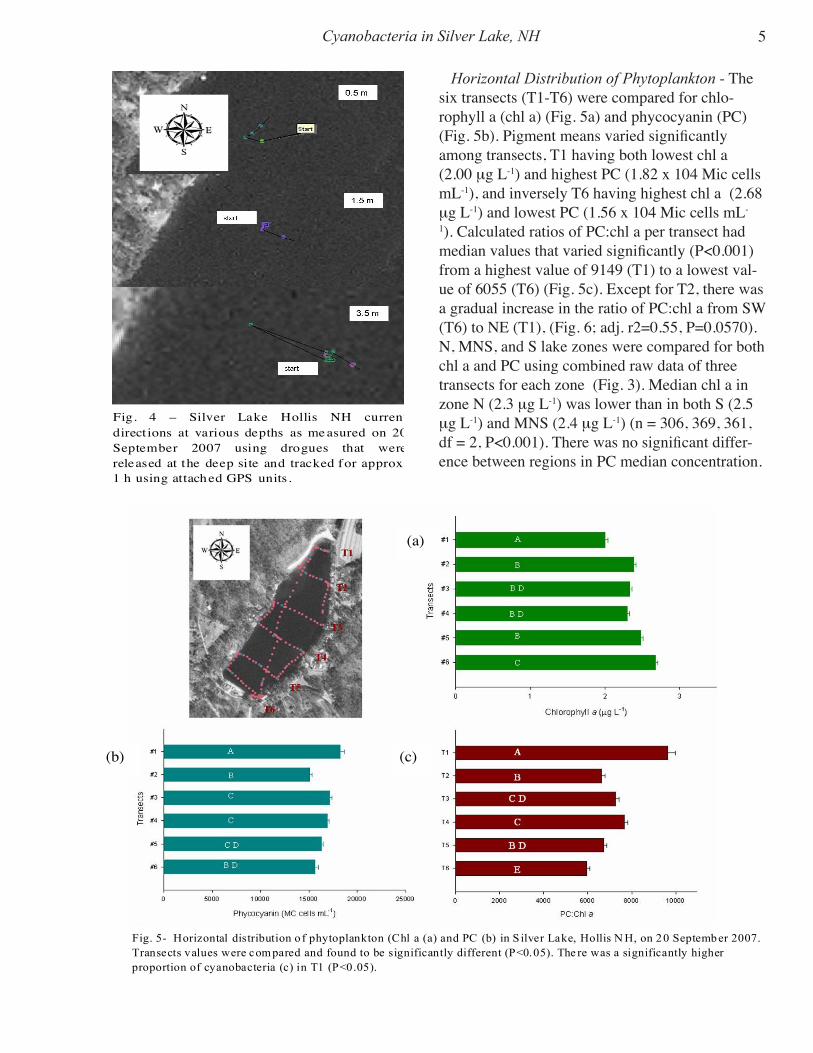
Results Wind Direction and Movement of Drogues- On the day of the sampling, a breeze was blowing from the SW at 0.6 kn. Drogue movement at all depths was limited. The overall trajectory of the surface drogue (0.5 m) was N, the drogue first moving to the NW and changing course towards the NE to return at the same longitude. The 1.5 m drogue main direction was SE and the 3.5 m drogue started out to the NW to return almost ex-actly over its track to its starting point (Fig. 4).
Fig. 2- Diagram of Silver Lake, Hollis NHShowing arbitrary division into 3 lakes zones(N, MNS, S) for analysis of data collected on20 Septemb er 2007.
T1
T2
T3
T4
T5
T6
North (N)
South (S)
Middle (M NS )
T1
T2
T3
T4
T5
T6
North (N)
South (S)
Middle (M NS )
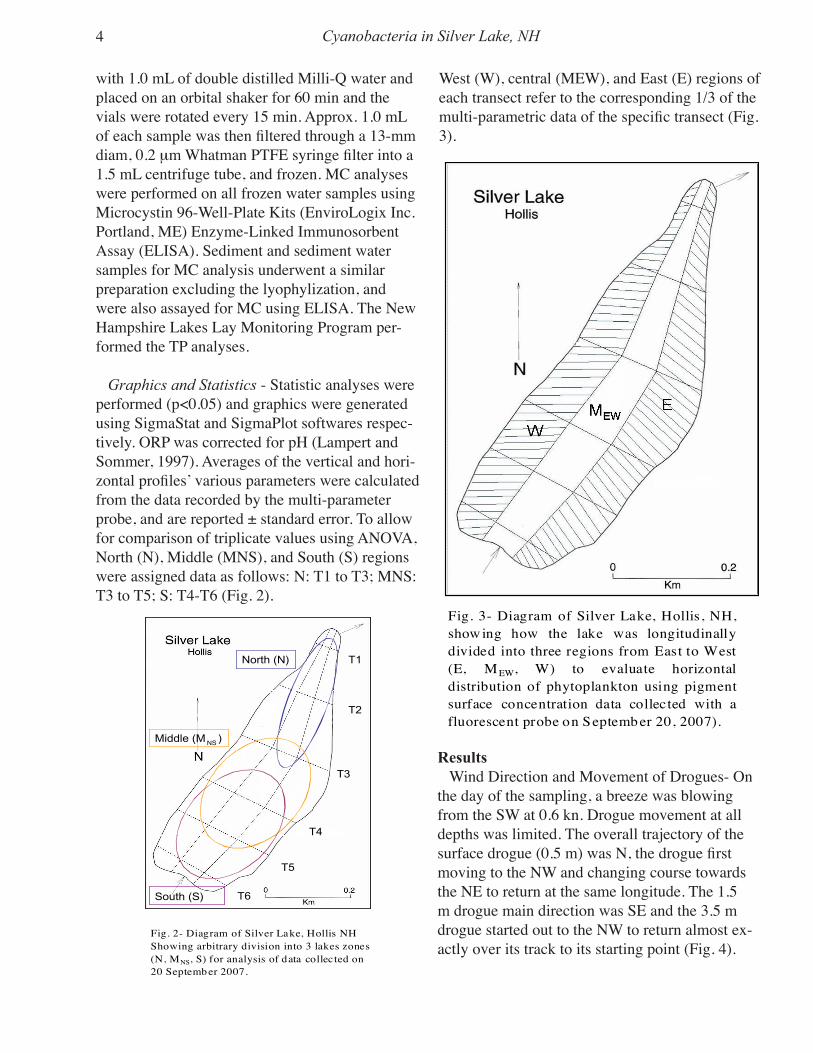
Fig. 3- Diagram of Silver Lake, Hollis, NH,show ing how the lake was longitudinallydivided into three regions from East to West(E, MEW, W) to evaluate horizontaldistribution of phytoplankton using pigmentsurface concentration data collected with afluorescent probe on Septemb er 20, 2007).
West (W), central (MEW), and East (E) regions of each transect refer to the corresponding 1/3 of the multi-parametric data of the specific transect (Fig. 3).
Cyanobacteria in Silver Lake, NH4
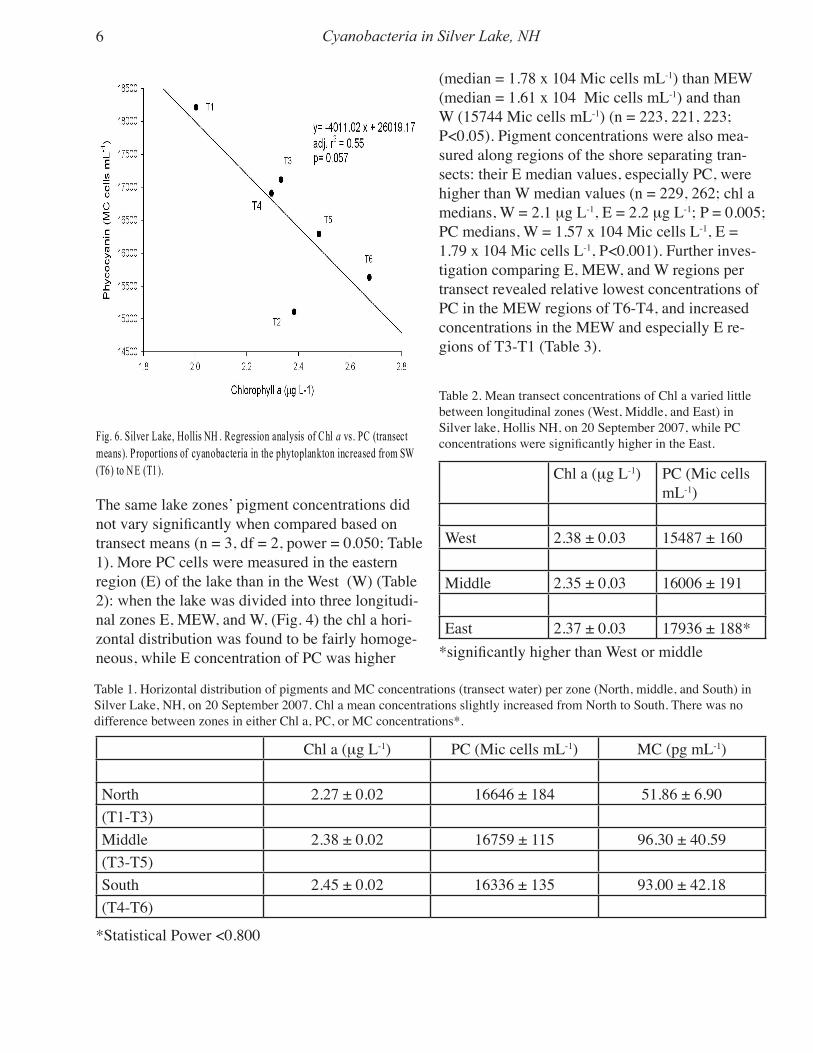
Horizontal Distribution of Phytoplankton - The six transects (T1-T6) were compared for chlo-rophyll a (chl a) (Fig. 5a) and phycocyanin (PC) (Fig. 5b). Pigment means varied significantly among transects, T1 having both lowest chl a (2.00 mg L-1) and highest PC (1.82 x 10⁴ Mic cells mL-1), and inversely T6 having highest chl a (2.68 mg L-1) and lowest PC (1.56 x 10⁴ Mic cells mL-
1). Calculated ratios of PC:chl a per transect had median values that varied significantly (P<0.001) from a highest value of 9149 (T1) to a lowest val-ue of 6055 (T6) (Fig. 5c). Except for T2, there was a gradual increase in the ratio of PC:chl a from SW (T6) to NE (T1), (Fig. 6; adj. r2=0.55, P=0.0570). N, MNS, and S lake zones were compared for both chl a and PC using combined raw data of three transects for each zone (Fig. 3). Median chl a in zone N (2.3 mg L-1) was lower than in both S (2.5 mg L-1) and MNS (2.4 mg L-1) (n = 306, 369, 361, df = 2, P<0.001). There was no significant differ-ence between regions in PC median concentration.
Fig. 4 – Silver Lake Hollis NH currentdirect ions at various depths as me asured on 20September 2007 using drogues that werereleased at the deep site and tracked for approx.1 h using attached GPS units.
Fig. 5- Horizontal distribution o f phytoplankton (Chl a (a) and PC (b) in S ilver Lake, Hollis N H, on 20 Septemb er 2007.Transects values were com pared and found to be significantly different (P<0.05). The re was a significantly higherproportion of cyanobacteria (c) in T1 (P<0.05).
(b) (c)
(a)
Cyanobacteria in Silver Lake, NH 5
The same lake zones’ pigment concentrations did not vary significantly when compared based on transect means (n = 3, df = 2, power = 0.050; Table 1). More PC cells were measured in the eastern region (E) of the lake than in the West (W) (Table 2): when the lake was divided into three longitudi-nal zones E, MEW, and W, (Fig. 4) the chl a hori-zontal distribution was found to be fairly homoge-neous, while E concentration of PC was higher
Table 1. Horizontal distribution of pigments and MC concentrations (transect water) per zone (North, middle, and South) in Silver Lake, NH, on 20 September 2007. Chl a mean concentrations slightly increased from North to South. There was no difference between zones in either Chl a, PC, or MC concentrations*.
Chl a (mg L-1) PC (Mic cells mL-1)
West 2.38 ± 0.03 15487 ± 160
Middle 2.35 ± 0.03 16006 ± 191
East 2.37 ± 0.03 17936 ± 188*
Table 2. Mean transect concentrations of Chl a varied little between longitudinal zones (West, Middle, and East) in Silver lake, Hollis NH, on 20 September 2007, while PC concentrations were significantly higher in the East.
(median = 1.78 x 10⁴ Mic cells mL-1) than MEW (median = 1.61 x 10⁴ Mic cells mL-1) and than W (15744 Mic cells mL-1) (n = 223, 221, 223; P<0.05). Pigment concentrations were also mea-sured along regions of the shore separating tran-sects: their E median values, especially PC, were higher than W median values (n = 229, 262; chl a medians, W = 2.1 mg L-1, E = 2.2 mg L-1; P = 0.005; PC medians, W = 1.57 x 10⁴ Mic cells L-1, E = 1.79 x 10⁴ Mic cells L-1, P<0.001). Further inves-tigation comparing E, MEW, and W regions per transect revealed relative lowest concentrations of PC in the MEW regions of T6-T4, and increased concentrations in the MEW and especially E re-gions of T3-T1 (Table 3).
*significantly higher than West or middle
Fig. 6. Silver Lake, Hollis NH . Regression analysis of Chl a vs. PC (transectmeans). Proportions of cyanobacteria in the phytoplankton increased from SW(T6) to N E (T1).
Table 3. Comparison of Silver Lake NH PC concentration per transect region, 20 Sept. 2007. Bold numbers indicate significant difference. From South to North, up to T4 the middle values are lower, and from T3 North, middle and especially East values increase, suggesting that surface cells might have been displaced in a S-N/NE fashion, resulting in accumulations in the NE corner.
*Median values were compared
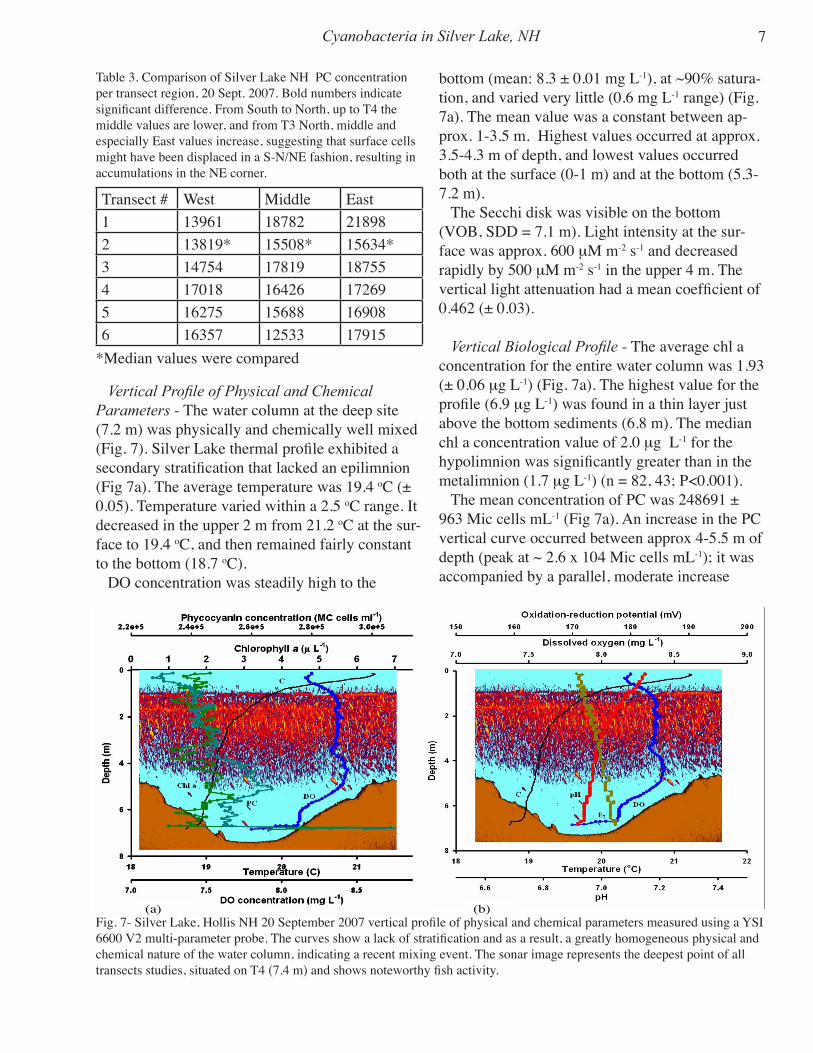
Vertical Profile of Physical and Chemical Parameters - The water column at the deep site (7.2 m) was physically and chemically well mixed (Fig. 7). Silver Lake thermal profile exhibited a secondary stratification that lacked an epilimnion (Fig 7a). The average temperature was 19.4 oC (± 0.05). Temperature varied within a 2.5 oC range. It decreased in the upper 2 m from 21.2 oC at the sur-face to 19.4 oC, and then remained fairly constant to the bottom (18.7 oC). DO concentration was steadily high to the
bottom (mean: 8.3 ± 0.01 mg L-1), at ~90% satura-tion, and varied very little (0.6 mg L-1 range) (Fig. 7a). The mean value was a constant between ap-prox. 1-3.5 m. Highest values occurred at approx. 3.5-4.3 m of depth, and lowest values occurred both at the surface (0-1 m) and at the bottom (5.3-7.2 m). The Secchi disk was visible on the bottom (VOB, SDD = 7.1 m). Light intensity at the sur-face was approx. 600 mM m-2 s-1 and decreased rapidly by 500 mM m-2 s-1 in the upper 4 m. The vertical light attenuation had a mean coefficient of 0.462 (± 0.03).
Vertical Biological Profile - The average chl a concentration for the entire water column was 1.93 (± 0.06 mg L-1) (Fig. 7a). The highest value for the profile (6.9 mg L-1) was found in a thin layer just above the bottom sediments (6.8 m). The median chl a concentration value of 2.0 mg L-1 for the hypolimnion was significantly greater than in the metalimnion (1.7 mg L-1) (n = 82, 43; P<0.001). The mean concentration of PC was 248691 ± 963 Mic cells mL-1 (Fig 7a). An increase in the PC vertical curve occurred between approx 4-5.5 m of depth (peak at ~ 2.6 x 10⁴ Mic cells mL-1); it was accompanied by a parallel, moderate increase
Cyanobacteria in Silver Lake, NH 7
(a) (b)Fig. 7- Silver Lake, Hollis NH 20 September 2007 vertical profile of physical and chemical parameters measured using a YSI 6600 V2 multi-parameter probe. The curves show a lack of stratification and as a result, a greatly homogeneous physical and chemical nature of the water column, indicating a recent mixing event. The sonar image represents the deepest point of all transects studies, situated on T4 (7.4 m) and shows noteworthy fish activity.
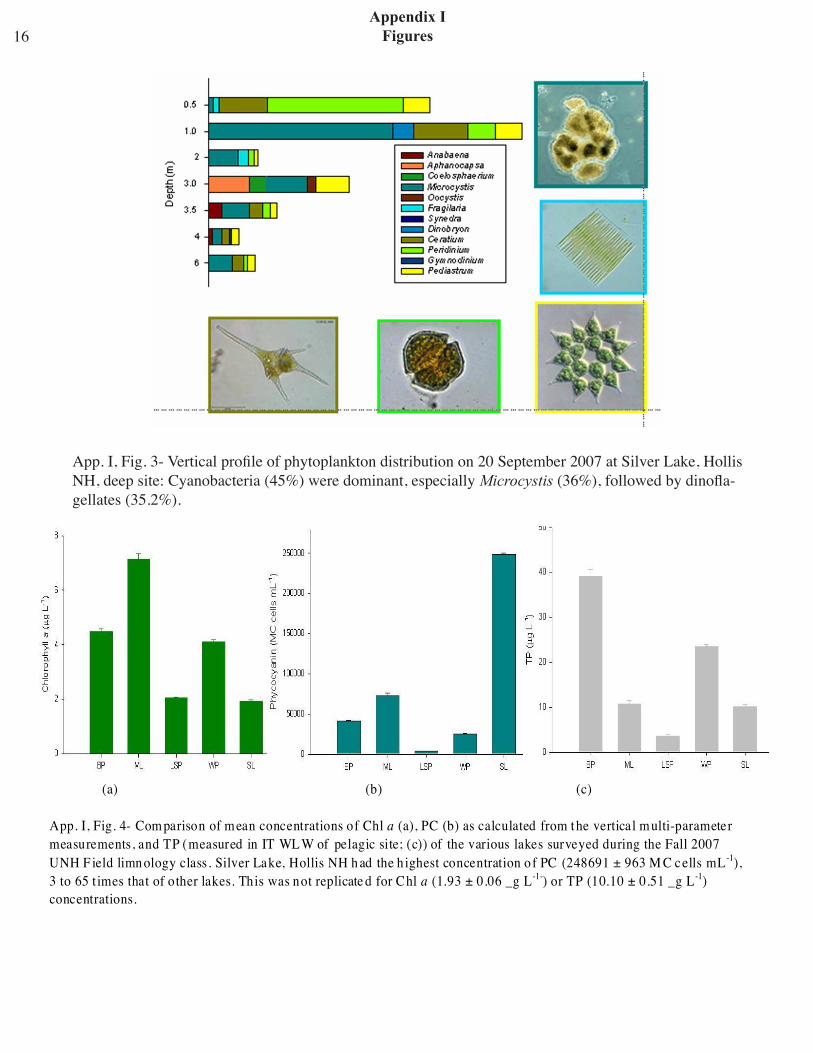
in DO. A major peak (max. concentration: 307348 Mic cells mL-1) inflated the calculated average for the water column; it occurred right above the bottom sediments in unison with the bottom chl a peak. The difference between the median PC concentrations of the metalimnion (2.41 x 10⁴ Mic cells mL-1) and the hypolimnion (2.51 x 10⁴ Mic cells mL-1) was significant (n = 43, 82; P<0.001). The phytoplankton deep-site samples were domi-nated by cyanobacteria (~45%), Microcystis being the most abundant representative (36%; 133.8 cells/colonies L-1). The majority of their total count was located at 1-m depth. Other well represented genera were Peridinium (20%; 74.4 cells L-1), 75% of which were concentrated at 0.5 m, Ceratium (15.2%; 56.3 cells L-1), and Pediastrum (12.7%; 47.1 cells L-1). Other genera occurred sparingly. Both Ceratium and Pediastrum were found at all depths sampled (App. I, fig. 3). Cyanobacterial dominance was also confirmed by the fact that they were the most active members of the phyto-plankton on the sampling day (Fig. 8: T2 treated as outlier; P = 0.008, r2 = 0.90).
Fig. 8- Positive correlation between ra tios of PC :Chl a and dissolvedoxygen indicates that cyanobac teria were the m ost active oxygenproducing me mbers of the phytoplankton in S ilver Lake on 20 September2007 .
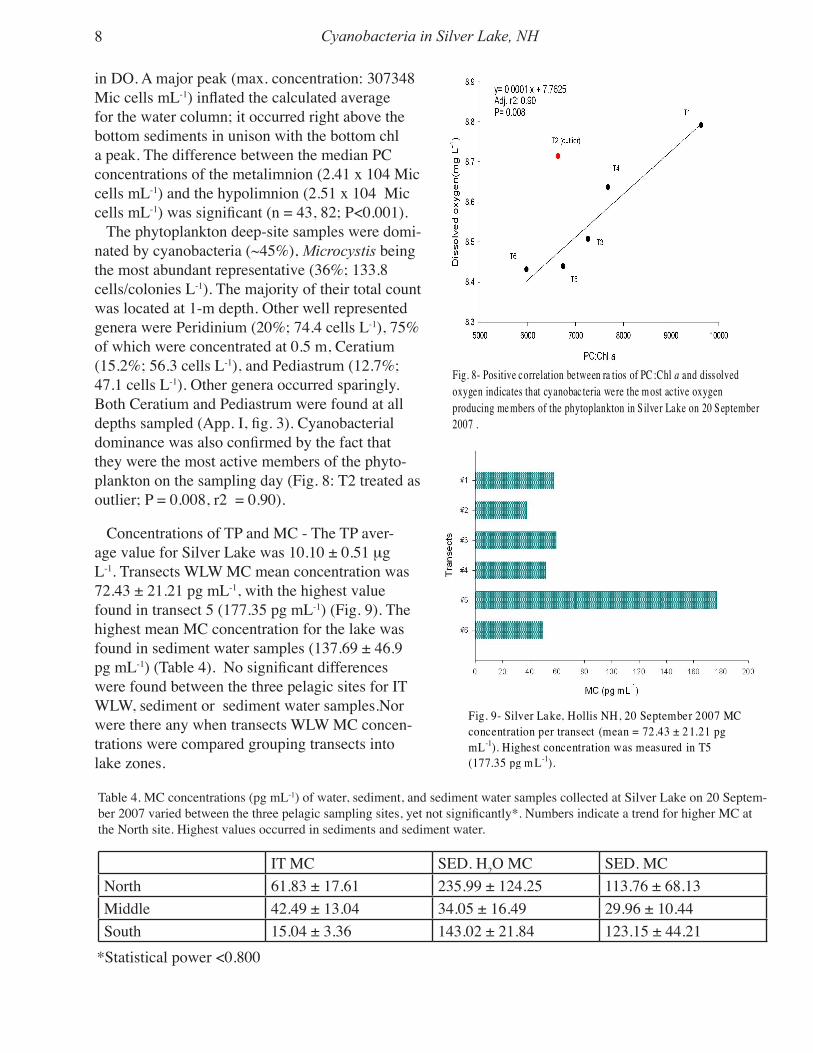
Concentrations of TP and MC - The TP aver-age value for Silver Lake was 10.10 ± 0.51 mg L-1. Transects WLW MC mean concentration was 72.43 ± 21.21 pg mL-1, with the highest value found in transect 5 (177.35 pg mL-1) (Fig. 9). The highest mean MC concentration for the lake was found in sediment water samples (137.69 ± 46.9 pg mL-1) (Table 4). No significant differences were found between the three pelagic sites for IT WLW, sediment or sediment water samples.Nor were there any when transects WLW MC concen-trations were compared grouping transects into lake zones.
Fig. 9- Silver Lake, Hollis NH, 20 September 2007 MCconcentration per transect (mean = 72.43 ± 21.21 pgmL-1). Highest concentration was measured in T5(177.35 pg m L-1).
Table 4. MC concentrations (pg mL-1) of water, sediment, and sediment water samples collected at Silver Lake on 20 Septem-ber 2007 varied between the three pelagic sampling sites, yet not significantly*. Numbers indicate a trend for higher MC at the North site. Highest values occurred in sediments and sediment water.
Except for T5, which was treated as an outlier in the regression analysis, there was a relatively strong (Adj. r2 = 0.66) positive relationship between PC and MC, yet the trend was not signifi-cant (P = 0.060) (Fig. 10).
Fig. 10- Silver Lake, H ollis NH. Excep t for T5 which wastreated as an outlier in the regression analysis , there was areasonably s trong (y = 0.0059 x - 4 7.0467, adj. r2 = 0.66)positive relationship between PC and MC , yet the trend w as notsignificant (P = ~0.060)
Discussion Horizontal Distribution of Cyanobacteria and toxins - With the increase in the occurrence of po-tentially toxic cyanobacterial blooms (Carmichael, 2007), freshwater resource managers are increas-ingly confronted with the need to make important decisions regarding the safe use of bodies of water. Sampling is traditionally performed at a lake’s deepest point. Results of such sampling can be used as an informative tool in the management of lakes and ponds. Data provided by a deep-water sampling may however misrepresent the true state of a lake when distribution of cyanobacteria is patchy. Detection of heterogeneous distribution of both cyanobacteria and their toxins is essential for sound lake management. Our analysis of cyanobacteria distribution across Silver Lake both in a North/South and an East/West direction pointed to their accumulation towards the eastern shore, and in particular in the northeastern end of T1. Mixing and the calm
weather on and around the day of sampling sug-gest that accumulations may have formed at the surface. This phenomenon can occur when buoy-ant cells lose their entrainment in the water column in calm weather following a period of turbulence; it has been recognized for cyanobacterial species that produce gas vesicles to regulate their vertical position in the water column (Reynolds, 2006). Cells that are brought to the surface are then driven to the downwind shores and bays where they form scums (Chorus and Bartram, 1999). The overall NE direction of the surface drogue (depth 0.5 m) suggests that the accumulation of cyanobacterial cells was induced by wind. So does the finding that surface levels of PC in the middle regions of T6-T4 were low in comparison to E and W, and were highest in the middle and E regions of T3-T1. Several studies have demonstrated patchiness of phytoplankton, indicating wind as the essential factor (George and Edwards, 1976; Baker and Baker, 1976). Microcystis appear to be particularly susceptible to accumulation downwind (Yuwei et al., 2003). Velocities of surface currents are highest at moderate wind speed and patchy accumulations generally do not form at wind speed above 400 cm sec-1 (George and Edwards, 1976). This corresponds to a wind-speed of 0.78 knots. The 0.6 knots SW wind velocity recorded on the sampling day could be representative of recent wind conditions, under which localized cell aggre-gations could have developed. Wind data collected over a longer period of time preceding the sample date, together with longer deployment of the wind drogues, would have greatly improved our ability to evaluate the effect of wind and currents on cyanobacterial cell accu-mulations. Long-term wind data were not available for the precise location. Regular monitoring of wind conditions may enhance the ability to predict when accumulations may occur. The observed accumulation could have impor-tant implications, especially if accompanied by high concentrations of MC, because part of the State Park beach is located at the lake’s end where high concentrations of PC were found. Exposure to MC has been linked to human illnesses in many countries. The toxin was responsible for the death
Cyanobacteria in Silver Lake, NH 9
of 76 dialysis patients in Brazil, who received hospital treatment that used a toxin-contaminated water source (Carmichael et al., 2001). MC have also been found to have a cumulative damaging effect on the liver (Chorus et al., 2000) and chronic exposure has been correlated with greater inci-dence of cancer (Falconer, 1999). The main route of exposure to MC is through ingestion of drinking water, but recreational use of bodies of water pres-ents health hazards as well, through direct contact, accidental ingestion, or inhalation (Chorus et al., 2000). Our study found that horizontal distribution of MC was also patchy; however MC concentrations did not directly correlate with distribution of PC. The highest MC concentration in WLW from hori-zontal transects was recorded at T5. The lack of correlation between PC and MC distribution may be due to a mixed Microcystis population, with interspecific variation in toxin production. For example, a study of the spatial and temporal varia-tions of Microcystis species and MC concentration in lake Biwa, Japan, found that MC concentrations depends less on the total number of Microcystis cells than on the proportion of toxic M. aeruginosa (Ozawa et al., 2005). Our method does not dis-criminate between cyanobacterial species and this may contribute to the lack of correlation we found between PC and MC. It is possible that vertical mixing increased the surface MC concentration at T5. While it is usually assumed that the return flow in shallow lakes consists of surface currents along the lake’s periphery rather than in a deeper return current, areas of downwelling and upwell-ing have also been observed (George and Edwards, 1976). Movement of the deeper drogues gave no evidence of a “cycloidal path” (Baker and Baker, 1976). A returning bottom current could presum-ably re-suspend benthic MC from senescing cells if an upwelling was created by its encounter with a shallower depth. The change in depth from ~7.4 m at T4 to ~4.8 m at T5 as observed by sonar record-ings may be sufficient to generate such an upwell-ing. Vertical concentrations of PC at the sediment interface, accompanied by a decrease in DO, sug-gest that such cells might have been present. So do the MC values for sediment and sediment water.
MC-related human illnesses in many countries prompted the World Health Organization (WHO) to establish a guideline of 1.0 mg L-1 as the maxi-mum allowable concentration of MC in drinking water (WHO, 1998). Overall, MC values for Silver Lake were well below the WHO recommended guidelines. However there have been past reports of children with stomach ailments, ear infections and skin rashes associated with scum-forming M. aeruginosa (Hollis conservation commission, 2006). No data of MC concentrations at the time of the reports were available, however occurrences of illness suggest that either MC concentrations can vary, or be sufficient to have harmful effects.
Lake Trophic State - Cyanobacteria tend to domi-nate in eutrophic systems (Reynolds, 2006). Hence a lake’s trophic status presumably could help pre-dict the occurrence of cyanobacteria. The results of the present study however show that determining a lake’s trophic status based on chl a and nutri-ent parameters should not exclude an extensive sampling of PC. Indeed, based on criteria of SDD, Chl a, and TP used in Carlson’s trophic classifica-tion of lakes, on the day of the sampling, Silver Lake rated as oligotrophic (App. I, Table 2). The various measured physical, chemical, and biologi-cal parameters showed great stability throughout the water column and the lake was not thermally stratified, suggesting a recent mixing event. Previ-ous assessments of the lake had found a similar situation (EPA trophic report; September 1998, February 1999). Because of its shallow depth it is possible that Silver Lake is polymictic as shal-low lakes often are, allowing frequent mixing of the water column while periods of thermal strati-fication may occur during the summer (Scheffer, 1998). Supporting the latter idea, the temperature curve indicated a secondary stratification with a shallow metalimnion with a rapid decrease in temperature occurring within the upper 2 m before stabilizing to the bottom. Silver Lake vertical profile contrasted with the other lakes assessed (App. I, Fig. 4). Its 2.5 oC temperature range was much smaller than the aver-age temperature range for other lakes (12.3 oC ± 1.72). All other lakes exhibited stratification into
Cyanobacteria in Silver Lake, NH10
an epilimnetic and a hypolimnetic layers separated by a metalimnion with an average thermocline at 8m. The chl a concentration was the lowest in the lakes group, less than the group’s average (4.45 mg L-1 ± 1.05). Both BP and WP had higher TP levels than Silver Lake (39.13 mg L-1 ±1.46 and 23.40 mg L-1 ±0.51 respectively). Paradoxically, despite Silver Lake’s apparent oligotrophic status and its condition in relation to other lakes, its mean concentration of PC not only was the highest of all lakes, it also was three times (compared to ML) to 65 times (compared to LSP) their concentra-tion, almost seven times their average. A shift in the structure and composition of a lake’s phyto-plankton community to one where cyanobacteria are dominant has been attributed to the addition of nutrients, phosphorus in particular, resulting in an increase in the total phytoplankton biomass (Ha-vens, 2007; Reynolds, 2006). In the present study, the results confound the assumption that high lev-els of PC are associated with high levels of chl a. Two reasons can be suggested to explain the con-trasting levels of PC and chl a in Silver Lake. The first one concerns the method used to measure the lake’s pigment concentrations. The system used by the probe to measure pigments is based on fluores-cence. Fluorescence depends on the fact that when a photon excites a pigment, the pigment returns to its ground state by emitting a fluorescence photon of longer wavelength than the photon absorbed, which is measured by the probe. All phytoplankton groups contain chl a, which has two absorption maxima at 425 nm and 675 nm. Cyanobacteria and cryptomonads also contain PC. The phycobilin pigment provides them with a species-variable ad-ditional absorption spectrum found in deeper water that peaks at a wavelength of approx. 620 nm, and at which chl a has lower absorption capacity (MacColl, 1998). In the presence of cyanobacteria, some of the wavelengths emitted by the excitation of chl a may be absorbed by cyanobacterial cells, resulting in readings of chl a that are negatively affected by the interference. Contrasting levels of PC and chl a can also be explained by a phytoplankton community consist-ing mostly of cyanobacteria, as our calculated ratios of PC:chl a suggest, and which our own
observations in the field, and the phytoplankton counts identified as Microcystis. This agreed with a previous study (1998-2000) that found it to be the lake’s dominant phytoplankton (Haney and Ikawa, 2001). While the genus constituted only 36% of the total counted phytoplankton, microscopic enumeration of cyanobacterial cells is often chal-lenged by the presence of large colonies consisting of thousands of cells that are difficult to quantify. Our own enumeration did not discriminate be-tween cells and colonies. On the day of the sampling, Silver Lake’s mea-sured parameters classified it as oligotrophic, how-ever PC cell counts were high. Our findings that cyanobacteria were not homogeneously distributed throughout the lake, emphasizes the importance of extending sampling beyond the traditional deep site where sampling usually occurs, in order to determine safe water usage. With extensive sam-pling, patterns of distribution may be revealed, which in turn can help understand the intricacies of a lake’s system and contribute to better manage-ment practices.
References
BAKER A. L. AND K. K. BAKER. 1976. Estima- tion of planktonic wind drift by transmis- sometry. Limol. Oceanogr. 21(3): 447-452
BRIAND J. F., S. JACQUT, C. BERNARD, AND J. F. HUMBERT. 2003. Health hazards for terrestrial vertebrates from toxic cyanobac teria in surface water systems. Vet. res. 34:361-377
CADEL-SIX S., C. PEYRAUD-THOMAS, L. BRIENT, N. TANDEAU DE MARSAC, R. RIPPKA, AND A. MEJEAN. 2007. Dif ferent genotypes of Anatoxin- producing cyanobacteria coexist in the Tarn River, France. Appl. Environ. Microbiol. 73(23): 7605-7614
CARMICHAEL W.W. 2007. A world overview– One-hundred-twenty-seven years of re search on toxic cyanobacteria – Where do we go from here?: 95-115. In Hudnell,
Cyanobacteria in Silver Lake, NH 11
H. Kenneth [ed.], Proceedings of the Interagency, International Symposium on Cyanobacterial Harmful Algal Blooms. Advances in experimental medicine & biology
CARMICHAEL W.W., S.M.F.O. AZEVEDO, J.S. AN, R.J.R. MOLICA, E.M., JOCHIMSEN, S. LAU, K. L. RINEHART, G.R. SHAW, AND G.K. EAGLESHAM. 2001. Human fatalities from cyanobacteria: Chemical and biological evidence for cyanotoxins. EHP 109: 663-668
CHORUS I., I.R. FALCONER, H.J. SALAS, and J. BARTRAM. 2000. Health risks caused by freshwater cyanobacteria in recreational waters. J. Toxicol. Environ. Health, Part B, 3: 323-347
CHORUS I. and J. BARTRAM. 1999. Toxic cyanobacteria in water: a guide to their public health consequences, monitoring, and management. WHO.
De FIGUEIREDO D. R., U. M. AZEITEIRO, S. M. ESTEVES, F. J. M. GONÇALVES, and M. J. PEREIRA. 2004. Microcystin-pro- ducing blooms-a serious global public health issue. Ecotoxicol. Environ. Saf. 59: 151-163
EDWARDS. C., K.A. BEATTIE, C. M. SCRIM GEOUR, and G. A. CODD. 1992. Identifi cation of anatoxin-A in benthic cyanobacteria (blue-green algae) and in associated dog poisonings at Loch Insh, Scotland. Toxicon 10:1165-1175
FALCONER I. R. 1999. An overview of problems caused by toxic blue-green algae (cyano- bacteria) in drinking and recreational water. Environ. Toxicol. 14: 5-12.
GEORGE D. G. and R. W. EDWARDS. 1976. The effect of wind on the distribution of chlorophyll a and crustacean plankton in a
shallow eutrophic reservoir. J. appl. ecol. 13: 667-690
HANEY, J.F AND M.A. IKAWA. 2001. A survey of 50 NH lakes for Microcystis (MCs). Report 65, New Hampshire Water Resources Research Center.
HAVENS K.E. 2007. Cyanobacteria blooms: effects on aquatic ecosystems: 721-735. In Hudnell, H. Kenneth [ed.]Proceeding of the Interagency, International Symposium on Cyanobacterial Harmful Algal Blooms. Advances in Experimental Medicine & Biology
HOFF B., G. THOMSON and K. GRAHAM. 2007. Ontario: Neurotoxic cyanobacterium (blue-green alga) toxicosis in Ontario. Can. Vet. J. 48(2):147
LAMPERT W. and U. SOMMER. 1997. Limno ecology: the ecology of lakes and streams. Oxford University Press
LIND O.T. 1934. Handbook of common methods in limnology. Henry Kimpton
MacCOLL, R. 1998. Cyanobacterial phy cobilisomes. Journal of Structural Biology 124: 311-334
MEZ K., K. A. BEATTIE, G. A. CODD, K. HAN SELMANN, B. HAUSER, H. NAEGELI, and H. R. PREISIG. 1997. Identification of a microcystin in benthic cyanobacteria linked to cattle deaths on alpine pastures in Switzerland. Eur. J. Phycol. 32:111-117
OZAWA K., H. FUJIOKA, M. MURANAKA, A. YOKOYAMA, Y. KATAGAMI, T. HOMMA, K. ISHIKAWA, S. TSUJIMU RA, M. KUMAGAI, M. F. WATANABE, and H-D. PARK. 2005. Spatial distribution and temporal variation of Microcystis species composition and microcystin concentration in lake Biwa.
Cyanobacteria in Silver Lake, NH12
Wiley InterScience, doi: 10.1002/tox.20117
REYNOLDS, C. 2006. Ecology of Phytoplankton. Cambridge University Press
SCHEFFER M. 1998. Ecology of shallow lakes. Chapman & Hall
YUWEI C., B. QIN, K. TEUBNER, and M. T. DOKULIL. 2003. Long-term dynamics of phytoplankton assemblages: Microcystis- domination in Lake Taihu, a large shallow lake in China. J. Plank. Res. 25: 445-453
Cyanobacteria in Silver Lake, NH 13
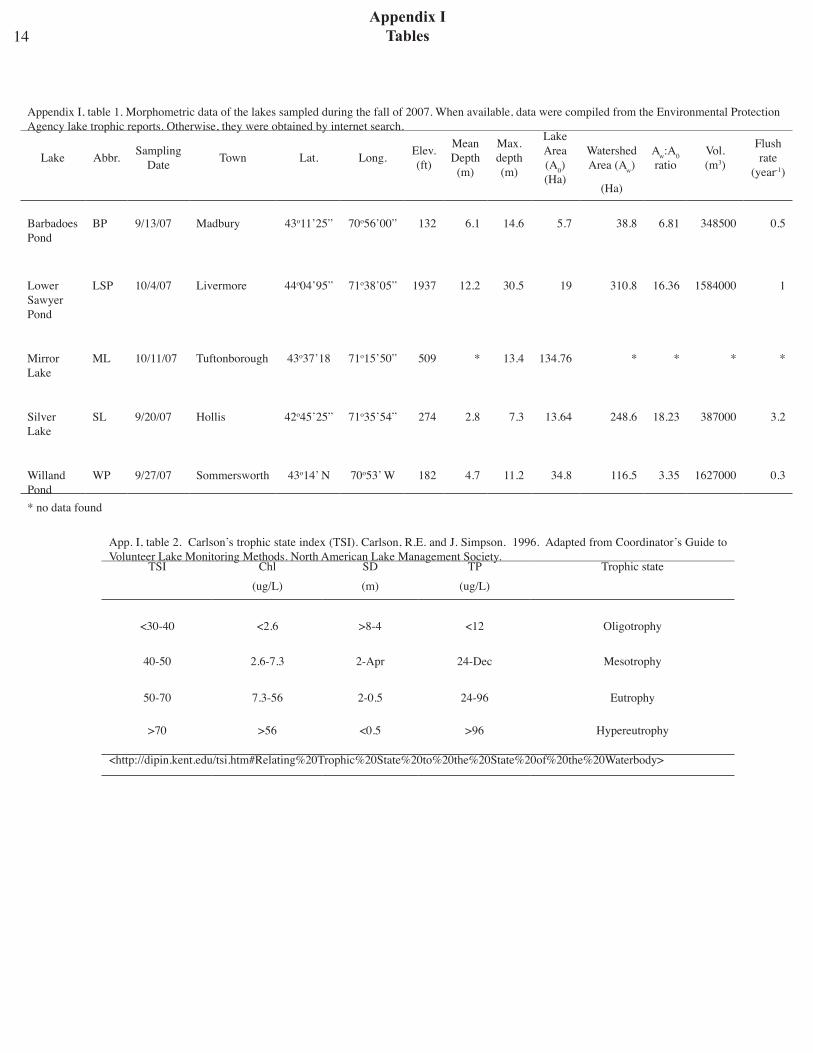
Appendix I, table 1. Morphometric data of the lakes sampled during the fall of 2007. When available, data were compiled from the Environmental Protection Agency lake trophic reports. Otherwise, they were obtained by internet search.
WP 9/27/07 Sommersworth 43o14’ N 70o53’ W 182 4.7 11.2 34.8 116.5 3.35 1627000 0.3
* no data found
App. I, table 2. Carlson’s trophic state index (TSI). Carlson, R.E. and J. Simpson. 1996. Adapted from Coordinator’s Guide to Volunteer Lake Monitoring Methods. North American Lake Management Society.
App. I, Fig. 1- Silver Lake, Hollis NH (42o 45’, 71o 35’).
App. I, Fig. 2- Sediment “skimmer” used to collect ben-thic samples at Silver Lake, Hollis NH, on September 20, 2007
15
(a) (b) (c)
App. I, Fig. 4- Com parison of mean concentrations of Chl a (a), PC (b) as calculated from the vertical multi-parametermeasurements, and TP (measured in IT WL W of pelagic site; (c)) of the various lakes surveyed during the Fall 2007UNH F ield limn ology class. Silver Lake, Hollis NH h ad the h ighest concentration o f PC (248691 ± 963 M C c ells mL-1),3 to 65 t imes that of other lakes. This was not replicate d for Chl a (1.93 ± 0.06 _g L-1-) or TP (10.10 ± 0.51 _g L-1)concentrations.
Appendix IFigures
App. I, Fig. 3- Vertical profile of phytoplankton distribution on 20 September 2007 at Silver Lake, Hollis NH, deep site: Cyanobacteria (45%) were dominant, especially Microcystis (36%), followed by dinofla-gellates (35.2%).