Earth and Planetary Science Letters 388 (2014) 18–26 Contents lists available at ScienceDirect Earth and Planetary Science Letters www.elsevier.com/locate/epsl Ocean-atmosphere climate shift during the mid-to-late Holocene transition Audrey Morley a,∗,1 , Yair Rosenthal a , Peter deMenocal b a Institute of Marine and Coastal Sciences and Department of Earth and Planetary Sciences, Rutgers, The State University of New Jersey, 71 Dudley Road, New Brunswick, NJ 08901, USA b Earth and Environmental Sciences, Lamont–Doherty Earth Observatory, Columbia University, Earth Institute, 61 Route 9W, PO Box 1000, Palisades, NY 10964-8000, USA article info abstract Article history: Received 6 May 2013 Received in revised form 14 November 2013 Accepted 19 November 2013 Available online xxxx Editor: J. Lynch-Stieglitz Keywords: paleoceanography ocean-atmosphere climate linkages mid-Holocene climate optimum Eastern North Atlantic Central water circulation NAO orbital insolation Climate records of the mid-to-late Holocene transition, between 3–4 thousand years before present (ka), often exhibit a rapid change in response to the gradual change in orbital insolation. Here we investigate North Atlantic Central Water circulation as a possible mechanism regulating the latitudinal temperature gradient (LTG), which, in turn, amplifies climate sensitivity to small changes in solar irradiance. Through this mechanism, sharp climate events and transitions are the result of a positive feedback process that propagates and amplifies climate events in the North Atlantic region. We explore these linkages using an intermediate water temperature record reconstructed from Mg/Ca measurements of benthic foraminifera (Hyalinea balthica) from a sediment core off NW Africa (889 m depth) between 0 to 5.5 ka. Our results show that Eastern North Atlantic Central Waters (ENACW) cooled by ∼1 ◦ ± 0.7 ◦ C and densities decreased by σ θ = 0.4 ± 0.2 between 3.3 and 2.6 ka. This shift in ENACW hydrography illustrates a transition towards enhanced mid-latitude atmospheric circulation after 2.7 ka in particular during cold events of the late-Holocene. The presented records demonstrate the important role of ENACW circulation in propagating the climate signatures of the LTG by reducing the meridional heat transfer from high to low latitudes during the transition from the Holocene Thermal Maximum to the late-Holocene. In addition, the dynamic response of ENACW circulation to the gradual climate forcing of LTGs provides a prime example of an amplifying climate feedback mechanism. Published by Elsevier B.V. 1. Introduction Observations over the past century indicate that changes in the North Atlantic Oscillation (NAO), exert the dominant control on the path and strength of the mid-latitude Westerlies and climate in the North Atlantic on interannual to decadal timescales (Hurrell, 1995; Visbeck et al., 2003). The region with the strongest response to NAO-modulated wind-stress is the northeastern subpolar basin of the Atlantic Ocean, where the strength of the Icelandic Low en- hances westerly air flow by up to 8 ms −1 (Hurrell, 1995) and thereby lowers sea surface temperatures (SST) by several tenths of degrees (∼0.7 ◦ C) during extremely positive NAO (+) years (Furevik and Nilsen, 2005; Johnson and Gruber, 2007). Subpolar Mode Water (SPMW) which forms in this region during winter convection (Tomczak and Godfrey, 1994) is thus highly suscepti- ble to NAO phase shifts, and carries the signature of the atmo- spheric NAO pattern in its properties (e.g. temperature and salin- * Corresponding author. Tel.: +1 848 932 3401. E-mail address: [email protected](A. Morley). 1 Now at School of Geography and Archaeology, National University of Ireland Galway, Galway, Ireland. ity) (Johnson and Gruber, 2007). After formation SPMW comprises a large fraction of Eastern North Atlantic Central Water (ENACW) (Iselin, 1936; Poole and Tomczak, 1999). ENACW integrates interannual NAO variability as smoother, longer-term multidecadal (60-to-90-year) oscillations (Morley et al., 2011). On these timescales the oceanic signature of positive NAO phases is associated with a tripole pattern of cold SST anoma- lies in the subpolar North Atlantic, warm anomalies in the West Atlantic between 20 and 45 ◦ N, and cold anomalies between 0 and 30 ◦ N in the East Atlantic (Marshall et al., 2001). On multidecadal timescales the oceanic signature of the NAO is captured by the At- lantic Multidecadal Oscillation (AMO) (Grossmann and Klotzbach, 2009; Marshall et al., 2001). The AMO describes basin-wide SST and sea level pressure anomalies, with warm anomalies during positive and cold anomalies during negative phases (Knight et al., 2005; Knudsen et al., 2011; Kushnir, 1994; Olsen et al., 2012). The intensity of mid-latitude Westerlies, strongest during positive NAO phases reinforce cold SST anomalies during AMO (−)(Häkkinen, 2000). In this way long-term positive phases of the NAO are linked to the negative phase of the AMO. However the precise forc- ing mechanism behind multidecadal SST variability in the North Atlantic including natural variability in the Atlantic Meridional 0012-821X/$ – see front matter Published by Elsevier B.V. http://dx.doi.org/10.1016/j.epsl.2013.11.039
Transcript
Earth and Planetary Science Letters 388 (2014) 18–26
Contents lists available at ScienceDirect
Earth and Planetary Science Letters
www.elsevier.com/locate/epsl
Ocean-atmosphere climate shift during the mid-to-late Holocenetransition
Audrey Morley a,∗,1, Yair Rosenthal a, Peter deMenocal b
a Institute of Marine and Coastal Sciences and Department of Earth and Planetary Sciences, Rutgers, The State University of New Jersey, 71 Dudley Road,New Brunswick, NJ 08901, USAb Earth and Environmental Sciences, Lamont–Doherty Earth Observatory, Columbia University, Earth Institute, 61 Route 9W, PO Box 1000, Palisades, NY10964-8000, USA
a r t i c l e i n f o a b s t r a c t
Article history:Received 6 May 2013Received in revised form 14 November 2013Accepted 19 November 2013Available online xxxxEditor: J. Lynch-Stieglitz
Keywords:paleoceanographyocean-atmosphere climate linkagesmid-Holocene climate optimumEastern North Atlantic Central watercirculationNAOorbital insolation
Climate records of the mid-to-late Holocene transition, between 3–4 thousand years before present (ka),often exhibit a rapid change in response to the gradual change in orbital insolation. Here we investigateNorth Atlantic Central Water circulation as a possible mechanism regulating the latitudinal temperaturegradient (LTG), which, in turn, amplifies climate sensitivity to small changes in solar irradiance. Throughthis mechanism, sharp climate events and transitions are the result of a positive feedback process thatpropagates and amplifies climate events in the North Atlantic region. We explore these linkages using anintermediate water temperature record reconstructed from Mg/Ca measurements of benthic foraminifera(Hyalinea balthica) from a sediment core off NW Africa (889 m depth) between 0 to 5.5 ka. Our resultsshow that Eastern North Atlantic Central Waters (ENACW) cooled by ∼1◦ ±0.7 ◦C and densities decreasedby σθ = 0.4 ± 0.2 between 3.3 and 2.6 ka. This shift in ENACW hydrography illustrates a transitiontowards enhanced mid-latitude atmospheric circulation after 2.7 ka in particular during cold eventsof the late-Holocene. The presented records demonstrate the important role of ENACW circulation inpropagating the climate signatures of the LTG by reducing the meridional heat transfer from high to lowlatitudes during the transition from the Holocene Thermal Maximum to the late-Holocene. In addition,the dynamic response of ENACW circulation to the gradual climate forcing of LTGs provides a primeexample of an amplifying climate feedback mechanism.
Published by Elsevier B.V.
1. Introduction
Observations over the past century indicate that changes in theNorth Atlantic Oscillation (NAO), exert the dominant control on thepath and strength of the mid-latitude Westerlies and climate in theNorth Atlantic on interannual to decadal timescales (Hurrell, 1995;Visbeck et al., 2003). The region with the strongest response toNAO-modulated wind-stress is the northeastern subpolar basin ofthe Atlantic Ocean, where the strength of the Icelandic Low en-hances westerly air flow by up to 8 m s−1 (Hurrell, 1995) andthereby lowers sea surface temperatures (SST) by several tenthsof degrees (∼0.7 ◦C) during extremely positive NAO (+) years(Furevik and Nilsen, 2005; Johnson and Gruber, 2007). SubpolarMode Water (SPMW) which forms in this region during winterconvection (Tomczak and Godfrey, 1994) is thus highly suscepti-ble to NAO phase shifts, and carries the signature of the atmo-spheric NAO pattern in its properties (e.g. temperature and salin-
1 Now at School of Geography and Archaeology, National University of IrelandGalway, Galway, Ireland.
ity) (Johnson and Gruber, 2007). After formation SPMW comprisesa large fraction of Eastern North Atlantic Central Water (ENACW)(Iselin, 1936; Poole and Tomczak, 1999).
ENACW integrates interannual NAO variability as smoother,longer-term multidecadal (60-to-90-year) oscillations (Morley etal., 2011). On these timescales the oceanic signature of positiveNAO phases is associated with a tripole pattern of cold SST anoma-lies in the subpolar North Atlantic, warm anomalies in the WestAtlantic between 20 and 45◦ N, and cold anomalies between 0 and30◦ N in the East Atlantic (Marshall et al., 2001). On multidecadaltimescales the oceanic signature of the NAO is captured by the At-lantic Multidecadal Oscillation (AMO) (Grossmann and Klotzbach,2009; Marshall et al., 2001). The AMO describes basin-wide SSTand sea level pressure anomalies, with warm anomalies duringpositive and cold anomalies during negative phases (Knight et al.,2005; Knudsen et al., 2011; Kushnir, 1994; Olsen et al., 2012). Theintensity of mid-latitude Westerlies, strongest during positive NAOphases reinforce cold SST anomalies during AMO (−) (Häkkinen,2000). In this way long-term positive phases of the NAO are linkedto the negative phase of the AMO. However the precise forc-ing mechanism behind multidecadal SST variability in the NorthAtlantic including natural variability in the Atlantic Meridional
0012-821X/$ – see front matter Published by Elsevier B.V.http://dx.doi.org/10.1016/j.epsl.2013.11.039
A. Morley et al. / Earth and Planetary Science Letters 388 (2014) 18–26 19
Overturning Circulation, solar variability, and/or volcanism remainsuncertain (Booth et al., 2012; Grossmann and Klotzbach, 2009;Ottera et al., 2010; Sicre et al., 2011). On centennial timescales,there is evidence (Ammann et al., 2007; Knudsen et al., 2009;Lockwood et al., 2010; Lohmann et al., 2004; Swingedouw etal., 2010) for the existence of similar ocean-atmosphere linkagesthat communicate and amplify relatively small changes in totalsolar irradiance (#TSI) into a climate signal extending beyondthe northeastern Atlantic region (Lean, 2010; Morley et al., 2011;Shindell et al., 2001). A common approach to identify and interpretpast climate records is to match proxy based climate reconstruc-tions with modern ocean-atmosphere circulation modes such asthe oceanic expressions of the NAO-AMO (Luterbacher et al., 2004;Mann et al., 2009; Trouet et al., 2009) or #TSI (Lean, 2010;Shindell et al., 2001; Steinhilber et al., 2012, 2009), recognizingthat often these trends are far longer than the intrinsic interan-nual or multidecadal NAO-AMO variability.
The presence of non-NAO-AMO-like atmospheric variability inmodern instrumental records provides a first indication that thefocus on the NAO-AMO for past climate reconstructions may betoo simplistic. Instrumental observations show for example thatthe relationship between the NAO and the strength of the mid-latitude Westerlies periodically breaks down, most prominentlyduring the 1930s (American Dust Bowl) and more recently overthe last decade (2000 to 2012) indicating the possibility of a differ-ent atmospheric circulation pattern operating during these times(Bengtsson et al., 2004; Drinkwater, 2006; Overland and Wang,2005; Wood and Overland, 2010). During both periods, high lat-itudes experienced peak warming and sea ice loss (Barents Sea)in the absence of a positive NAO mode (Bengtsson et al., 2004;Overland and Wang, 2005). Similarly, high latitude warming andreduced Arctic sea ice extent prevailed during the Holocene Ther-mal Maximum (HTM) between 11 and 4 ka (Andersen et al.,2004a; Koç et al., 1993; Polyak and Mikhailov, 1996; Voronina etal., 2001), when high northern summer insolation was strongerand the latitudinal temperature gradient (LTG) (e.g. the differ-ence in temperature between the high Arctic and the Tropics) wasweaker than today (Davis and Brewer, 2009; Fischer and Jungclaus,2011). The most recent analogue to a decrease in the LTG occurredduring the 1930s (Rind, 1998) and more prominently during thepast decade (Section 5.2).
Unlike the 1930s however several proxy and numerical basedclimate reconstructions propose that strong mid-latitude Wester-lies (NAO +) prevailed during the warm HTM. Likewise the coolerlate-Holocene is often associated with weaker westerly airflow(NAO −) (Renssen et al., 2005b; Rimbu et al., 2003, 2004; Wanneret al., 2008) whereas other records provide evidence for en-hanced atmospheric circulation over North Atlantic mid- and high-latitudes during the late-Holocene (Brayshaw et al., 2010; De An-gelis et al., 1997; Jennings et al., 2011; Moros et al., 2012; Renssenet al., 2005a). These conflicting interpretations suggest that the fo-cus on the NAO-AMO as a modern analogue for the Holocene mayoversimplify past climate dynamics (Pinto and Raible, 2012).
Morley et al. (2011) showed that past temperatures and theoxygen isotopic composition (δ18Osw) of ENACW recorded off theNorthwest African continental margin are determined by SPMWformation south and west of Iceland on both instrumental, multi-decadal and multicentennial timescales over the past millennium.Essentially, ENACW circulation provides an ‘oceanic tunnel’ (Liuand Alexander, 2007) transmitting subpolar ocean-atmospheric cli-mate anomalies to lower latitudes. Here we extend the inves-tigation of ENACW variability over the past 5.5 ka to test thehypothesis that ENACW cooling (warming) during the Holoceneenhances (reduces) the LTG and thereby amplifies climate sensi-tivity to small changes in insolation, creating a positive feedbackloop that propagates and amplifies climate events in the North
Fig. 1. Map of core location and schematic representation of the shallow overturn-ing circulation in the North East Atlantic. The Eastern North Atlantic Central Water(ENACW) formation region is marked in light grey hatching and represents the areawhere SPMW form and winter surface water densities range between σΘ = 27.3and 27.7 (adapted from McCartney and Talley, 1982). The influence and circulationof ENACW (blue) represents potential density surfaces between σΘ = 27.3 and 27.7at mid-depth (adapted from Keffer, 1985). The location and flow of the East Green-land Current (EGC) and the Irminger Current (IC) are marked in blue and red arrowsrespectively. (For interpretation of the references to color in this figure legend, thereader is referred to the web version of this article.)
Atlantic region. To test this hypothesis we present a combinationof modern observations alongside a 5.5 ka long paleotemperatureand stable isotopic record based on benthic foraminifera collectedwithin ENACW (889 m water depth) from the northwest Africancontinental shelf in the eastern boundary of the subtropical gyre(STG) (Fig. 1). By analyzing and comparing our data with a widerange of proxy records in our discussion (both in terms of ge-ographic locations and in proxy variety) we will investigate thepossible link between gradually changing LTGs during the winterand the transmission of North Atlantic climate change at centralwater depth. Specifically, we focus on the transition from the HTMto the colder late-Holocene (or the mid-to-late Holocene transi-tion) at subpolar latitudes between 3.5 and 4 ka (Came et al., 2007;Giraudeau et al., 2010; Ólafsdóttir et al., 2010; Pena et al., 2010).
2. Materials and methods
2.1. Oceanographic setting
Gravity core OC437-7 24GGC was collected at 889 m waterdepth [30.854◦ N, 10.272◦ W] in the eastern boundary of theSTG during the CHEETA (Changing Holocene Environments of theEastern Tropical Atlantic) coring cruise on the R/V Oceanus inJuly 2007 (McGee et al., 2013). At 889 m water depth ENACWis the dominant water mass at the core site, with average tem-perature and salinity values near 7.8–7.9 ◦C and 35.45 psu re-spectively. Cross-gyre transfer of subsurface ENACW (Keffer, 1985;McCartney and Talley, 1982; McDowell et al., 1982) occurs viaSPMW formation in the eastern SPG between density surfaces σθ
27.3 and 27.6 kg/m3 (Levitus, 1989; McCartney and Talley, 1982).ENACW formation and circulation thus establishes a direct link be-tween both gyres and allows us to investigate the influence ofsubpolar ocean-atmosphere climate linkages on ENACW proper-ties and cross gyre climate signal propagation. ENACW is under-lain by a salinity minimum signaling the upper limit of Antarc-tic Intermediate Water (AAIW) between 900 and 1300 m (Knollet al., 2002). Below this, the very high salinity MediterraneanOutflow Water (MOW) occurs near 1300 m (Arhan et al., 1994;
20 A. Morley et al. / Earth and Planetary Science Letters 388 (2014) 18–26
Table 1AMS 14C radiocarbon dates for OC437-7 24GGC.
Lab ID* Core Depth(cm)
Species(planktic)
Radiocarbon age ±1σ error(yr BP)
Calibrated age WMA(cal. kyr BP)
2σ range(cal. kyr BP)
Adjusted agemodel
Reference for originalradiocarbon dates
158 069 OC437-7 24GGC 32.5 G. bulloides 1005 ± 35 586 524–647 586 This study158 070 OC437-7 24GGC 118.5 G. bulloides 2430 ± 45 2070 1930–2218 2218 This study158 071 OC437-7 24GGC 222.5 G. bulloides 4120 ± 40 4180 4054–4339 4339 This study158 072 OC437-7 24GGC 294.5 G. bulloides 4890 ± 110 5183 4875–5458 5420 This study
* Center for Accelerator Mass Spectrometry, Lawrence Livermore National Laboratory.
Knoll et al., 2002). Modern seasonal and inter-annual variability intemperature and salinity are small at 900 m water depth (Knoll etal., 2002) and there is no indication for changing water masses atthe core site over the past 6 ka. Please see Appendix A for a de-tailed discussion on the possible influence of AAIW and MOW atour core site during the past 6 ka.
2.2. Paired Mg/Ca δ18O measurements
We reconstructed ENACW temperature during the past 5.5 kaby measuring Mg/Ca and oxygen isotopic values (δ18Oc) on thebenthic foraminifera Hyalinea balthica, a shallow infaunal benthicforaminifera living within the top 1.5 cm of oxygenated, nutri-ent rich, fine grained sediments (Schmiedl et al., 2000; VillanuevaGuimerans and Cervera Currado, 1999). Rosenthal et al. (2011)found no significant difference in Mg/Ca and δ18Oc between spe-cific size fractions from the same sample. Accordingly we mea-sured approximately 5 to 10 specimens of H. balthica (>150 µm)from each sample for stable oxygen isotope analysis at the De-partment of Earth and Planetary Sciences at Rutgers University.All samples were reacted in phosphoric acid at 90 ◦C (for 15 min)in an automated peripheral attached to a Micromass Optima massspectrometer and stable isotope values of calcite are reported ver-sus V-PDB. The 1σ precision of standards analyzed during auto-mated runs is 0.08❤ for δ18Oc. Comparing the δ18Oc record ofH. balthica from OC437-7 24GGC to GeoB6007-2 (Morley et al.,2011) we adjusted the former by adding 0.1❤ to all the data toaccount for an inter-laboratory offset (Rosenthal et al., 2011).
For trace metal analysis, we analyzed up to 25 (mean: 20 in-dividuals) H. balthica tests from the 250–350 µm size fraction,using a modified reductive, oxidative cleaning protocol (Barker etal., 2003) and a Sector Field Inductively Coupled Plasma MassSpectrometer (Thermo Element XR) at Rutgers Inorganic Analyti-cal Laboratory, following the methods outlined in Rosenthal et al.(1999). The long-term analytical precision of Mg/Ca ratios is basedon repeated analysis of three consistency standards of Mg/Ca con-centrations of 1.10, 2.40 and 6.10 mmol mol−1. Over the course ofthis study, the precision for the consistency standards was 0.29,0.64 and 0.62% RSD (relative standard deviation) respectively. Forpaleotemperature reconstructions the equation Mg/Ca = 0.49 T(◦C) was used (Rosenthal et al., 2011). For standard-error esti-mates for paleotemperature, the oxygen isotopic composition ofseawater (δ18Osw), salinity and density values (±0.7 ◦C, ±0.3❤,±0.7 psu and σθ = ±0.3), we followed standard error propagationcalculations for a quadratic paleotemperature equation (Shackleton,1974). For salinity reconstructions of ENACW we use the relation-ship of δ18Osw (❤SMOW) = 0.55S–18.98, which we derived fromthe LeGrande and Schmidt (2006) gridded δ18Osw dataset for theCape Ghir region. Using this relationship and paired Mg/Ca–δ18Ocmeasurements on H. balthica from the core-top sample in OC437-724GGC, we obtain a modern bottom water salinity of 35.69 psu.Compared to modern salinity values at Cape Ghir (35.45 psu) ourreconstructed salinity is well within the calculated error estimateof ±0.7 psu. Following the study of Morley et al. (2011) we as-sumed a constant δ18Osw-salinity relationship to calculate down-core salinity values.
3. Chronology
The age model for OC437-7 24GGC is constrained by a com-bination of four accelerator mass spectrometry (AMS) radiocarbonmeasurements (14C) (Lawrence Livermore National Laboratory seeTable 1) and a cross correlation between magnetic susceptibil-ity records from nearby core GeoB6007-2 (30.850◦ N, 10.268◦ W;899 m water depth) (Bleil and Dillon, 2008) and OC437-7 24GGC.The four samples for radiocarbon measurements consist of theplanktonic foraminifera Globigerina bulloides picked at 32, 118,222, and 294 cm depth (Table 1). All raw radiocarbon dates wereconverted into calendar years with the CALIB 6.1.1 software andthe MARINE 09 calibration dataset (Stuiver and Reimer, 1993;Stuiver et al., 1998). We applied the implicit reservoir age correc-tion (#R = 0) for all dates because the precise reservoir correctionfor Northwest Africa is uncertain (Kim et al., 2007). In Table 1 wereport the weighted mean averages (WMA) of the calibrated proba-bility distribution for each age with their respective 2σ confidencerange.
The availability of two overlapping magnetic susceptibilityrecords for OC437-7 24GGC and GeoB6007-2 allows us to provideadditional chronological constrain for OC437-7 24GGC by tying ourcore to the well-dated record of GeoB6007-2 (Kuhlmann et al.,2004; Morley et al., 2011) (Fig. 3). At the core breaks magnetic sus-ceptibility readings for OC437-7 24GGC are faulty due to the lossin density where the gravity core was cut on the ship. Accordinglywe removed these values from Fig. 3. We proceeded to calculatethe most significant cross correlation at zero lag for each core sec-tion of OC437-7 24GGC in relation to the well dated GeoB6007-2record. The resultant age model confirms the chronology obtainedby AMS 14C dating as it places the four calibrated dates within theWMA and the +2σ range (Fig. 3). Final ages used in our age modelas well as correlation coefficients between both magnetic suscep-tibility records are reported in Table 1 and Fig. 3. Ages betweendates were obtained by linear interpolation. For the past 1.3 kawe test this chronology by comparing Mg/Ca values measured inH. balthica from OC437-7 24GGC with GeoB6007-2 and multicoreGeoB6007-1 (Morley et al., 2011) (Fig. A1). The strong consistencyin timing between the independently measured Mg/Ca records inaddition to the apparent overlap of OC437-7 24GGC with multicoreGeoB6007-1 validates the age control for OC437-7 24GGC for thepast 1.3 ka and the use of a modern age for the core top. Overall,sedimentation rates range from ∼49 to 55 cm per ka, which cor-responds to a temporal resolution of 18 ± 3 years per cm (Fig. 3).By sampling one cm sample slices every two cm throughout thecore, we obtained an average temporal resolution of ∼36 years persample.
4. Results
4.1. Geochemical analysis on OC437-7 24GGC
Mg/Ca measurements based on H. balthica reveal multidecadalto multicentennial intermediate water temperature oscillations ofroughly ±1 ◦C which exceed the propagated Mg/Ca analytical un-certainty of ±0.7 ◦C (Fig. 2c). Our record documents a major
A. Morley et al. / Earth and Planetary Science Letters 388 (2014) 18–26 21
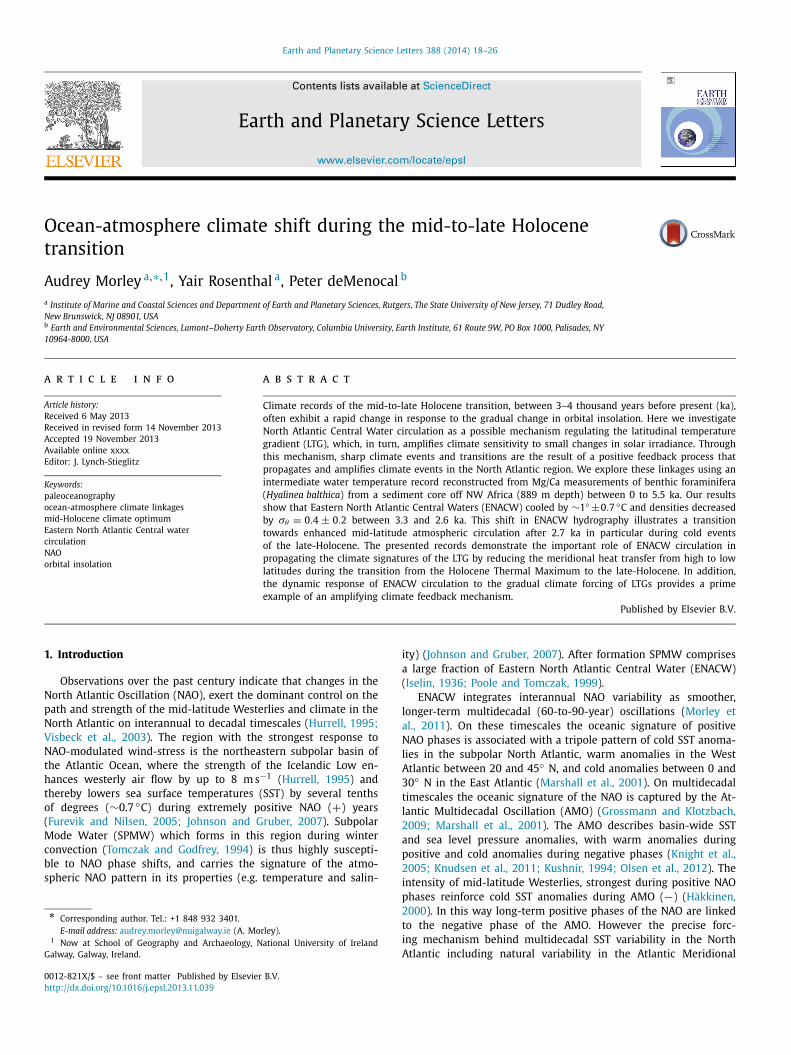
Fig. 2. ENACW properties compared to changes in LTG and #TSI: Here we show(a) a 200-year low pass filter of reconstructed solar variability #TSI [W m−2]adapted from Steinhilber et al. (2009) and (b) reconstructed winter LTG (Dec–Jan–Feb) adapted from Fischer and Jungclaus (2011). These records are compared toENACW properties from OC437-7 24GGC including, (c) Mg/Ca based intermediatewater temperatures (IWT), (d) measured δ18Oc values, (e) calculated δ18Osw valuesderived from paired Mg/Ca–δ18Oc measurements, and (f) calculated density recon-structions using modern δ18Osw – salinity relationships and Mg/Ca derived IWT. Allgraphs are plotted versus age and 200-year low-pass filters are shown in bold. Alsoshown are the error envelopes for all 200-year low pass filtered time series. Theyellow bars indicate the timing of (i) Maunder and Spör Solar Minima (LIA), (ii)Wolf Solar Minima, (iii) Dark Ages Cold Period (DACP), and (iv) the transition fromthe HTM to the late-Holocene. (For interpretation of the references to color in thisfigure legend, the reader is referred to the web version of this article.)
ENACW cooling of 1.2 ◦C from ∼9.6 ◦C to ∼8.6 ◦C between 3.3 and2.6 ka (Fig. 2c) followed by distinct century scale cooling eventscentered at, 1.3, 0.8 and 0.4 ka. These events correspond to thecommonly referenced Dark Ages Cold Period (DACP), Wolf solarminima (end of Viking colonization in Greenland), and the Maun-der and Spörer solar minima or the Little Ice Age (LIA) (Fig. 2,Fig. A1). Warm intervals correspond to a plateau between 2.1 and1.7 ka the so called Roman Warm Period (RWP), and centennialwarm peaks centered during solar maxima at 1.1 (Medieval WarmPeriod), 0.6 and 0.2 ka. In addition, we note an increase in overallvariability of reconstructed temperatures, with amplitudes of justunder 2 ◦C during the late-Holocene and of ∼1 ◦C during the HTM.The good agreement with late-Holocene ENACW temperature re-
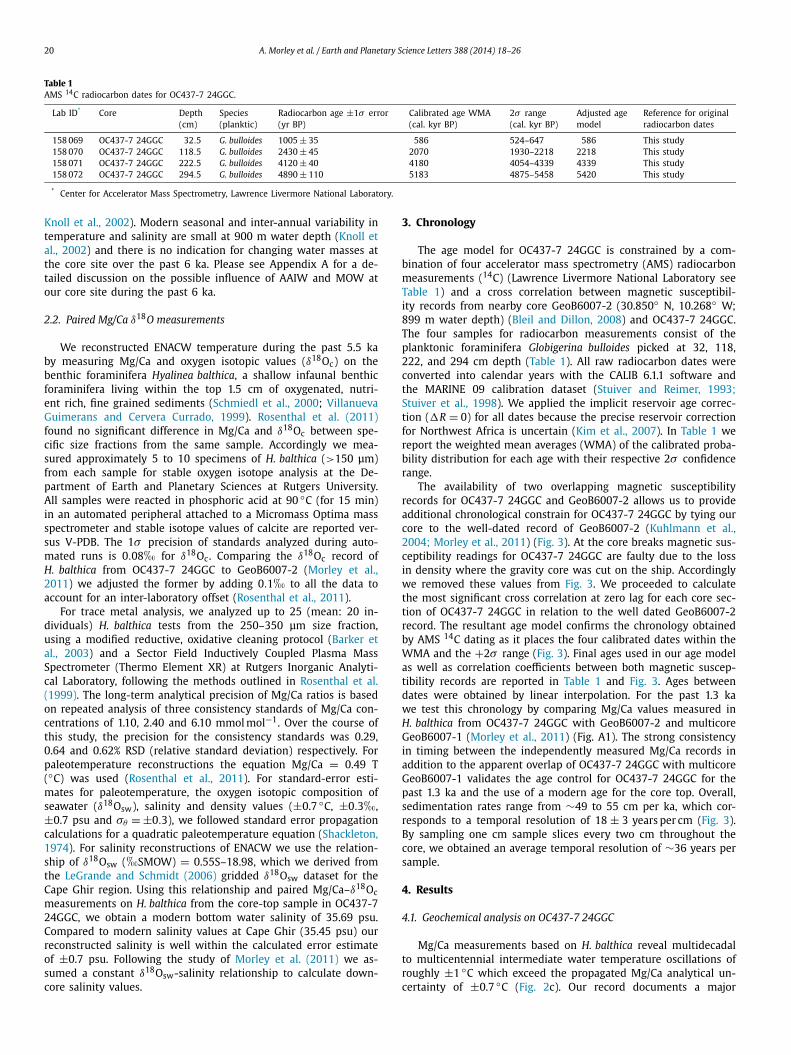
Fig. 3. Age model: In panel (a) we show the age-depth relationship betweencalibrated AMS 14C radiocarbon dates (±2σ ) and sediment core depth for bothOC437-7 24GGC (black) and GeoB6007-2 (light blue). In panel (b) we compare twomagnetic susceptibility records from OC437-7 24GGC in grey (5 point moving av-erage in black) and GeoB6007-2 (light blue). The black dotted lines shows whereOC437-7 24GGC was cut on the ship and magnetic susceptibility readings are faultydue to the loss in density at the core breaks (10 cm on either side). Also includedare calibrated AMS 14C radiocarbon dates (±2σ ) for OC437-7 24GGC (black trian-gles) and GeoB6007-2 (light blue triangles) as well as final calibrated ages used forthe age model (open red triangles). Correlation coefficient and p values betweenboth magnetic susceptibility records are also included. (For interpretation of thereferences to color in this figure legend, the reader is referred to the web version ofthis article.)
constructions from GeoB6007-2 (Morley et al., 2011) in both valuesand amplitude shows that Mg/Ca values measured on H. balthicatests are reproducible and reliable at the core site (Fig. A1).
Stable oxygen isotope values (δ18Oc) measured on H. balthicarange between ∼1.8 and 1.4❤ (Fig. 2d). When combined withpaleotemperatures, reconstructed δ18Osw values indicate a 0.4❤drop associated with the cooling between 3.3 and 2.6 ka (Fig. 2e).Based on the modern δ18Osw-salinity relationship this equates toa salinity decrease of ∼0.5 psu. The combination of, temperature
22 A. Morley et al. / Earth and Planetary Science Letters 388 (2014) 18–26
and salinity results suggest a density decrease of ∼0.4σθ after the3.3–2.6 ka transition (Fig. 2f). During all cold events of the late-Holocene ENACW tended to be fresher and lighter than duringwarm intervals. Superimposed on this multicentennial variability,ENACW became increasingly denser and saltier over the past 2 kato regain mid-Holocene values of ∼27.8 in the early 20th century(Fig. 2f).
5. Discussion
In the following section we use our proxy ENACW record toassess the relationship between orbitally-derived changes in thelatitudinal temperature gradient (LTG), ocean-atmosphere climatelinkages and ENACW circulation. First, we will outline the climateresponse to changing LTGs at high northern latitudes by reviewingclimate reconstructions of the HTM and the climate state duringthe 1930s (most recent example of a reduced LTG). The describedclimate background will then serve to test if our reconstructionsare consistent with the ocean-atmosphere climate response of achanging LTG over the mid-to-late Holocene transition.
5.1. Climate impact of changing LTGs during the mid-to-late Holocenetransition
A meridional temperature gradient arises from differential ra-diative heating between tropical and polar latitudes. The climatesystem restores this imbalance through the meridional transportof heat via atmospheric and ocean circulation systems (e.g. theintensity and position of mid-latitude storms, the tropical Hadleycell, subtropical and subpolar atmospheric pressure centers, andsurface ocean gyres) that control the poleward flux of latent andsensible heat (Jain et al., 1999; Raymo and Nisancioglu, 2003;Rind, 1998). Both model analysis and proxy data suggest that peakhigh-latitude summer insolation and reduced low-latitude win-ter insolation reduced LTGs by warming the Arctic (Andersen etal., 2004a, 2004b; Calvo et al., 2002; Davis and Brewer, 2009;Jansen et al., 2009; Kerwin et al., 1999; Masson et al., 1999;Renssen et al., 2005a, 2005b; Rind, 1998; Vinther et al., 2009)and cooling the Tropics during the HTM (Bonfils et al., 2004;Davis and Brewer, 2009; Masson et al., 1999). Further, model anal-ysis suggest that the relative decrease in winter insolation nearthe tropics cooled continental land masses and thereby reducedprecipitation at the Intertropical Convergence Zone especially overmajor continents of the Atlantic sector (Brayshaw et al., 2010). As aresult the Hadley Cell was narrower, shallower, and stronger duringHTM winters (Brayshaw et al., 2010). The key atmospheric changecaused by the modified ascent patterns of the winter Hadley Cellwas the southward displacement of the Subtropical Jet Stream re-sulting in weaker mid-latitude storm intensities (Brayshaw et al.,2010; Renssen et al., 2005a, 2005b) and a more southerly posi-tion of winter storm tracks. In a positive feedback loop, weakerstorm intensities reduced wind-stress, sea surface heat loss (evap-oration), and moisture content in the atmosphere, which fur-ther weakened mid-latitude storm intensities (Bonfils et al., 2004;Brayshaw et al., 2010; Jansen et al., 2009). In addition to thesemodel analysis, southern European pollen data sets, North Africanlake level records and archaeological reconstructions support thesuggested southward displacement of winter storm tracks result-ing in cooler and wetter Mediterranean and North African win-ters during the HTM (Bonfils et al., 2004; Kropelin et al., 2008;Kuper and Kropelin, 2006; Masson et al., 1999).
5.2. Modern analogue to a weak LTG
Computing LTGs over the past 130 years allows us to examineassociated historical changes in atmospheric circulation patterns
Fig. 4. Changes in the observed latitudinal temperature gradient are calculated bysubtracting latitudinal temperature anomalies between 64◦–90◦ N and 0◦–24◦ N,since 1880. The yellow bars indicate the weak LTG during the 1930s and more re-cently from 2000–2012 (e.g. when the temperature difference between the highArctic and the tropics was smallest). These are also the periods when polar andsubpolar latitudes experience enhanced warming and the link between the NAO andWesterlies breaks down. Data obtained from the Goddard Institute for Space Studies(GISS) Surface Temperature Analysis (GISTEMP). The base period for anomaly calcu-lations was set between 1951 and 1980. Positive (negative) values reflect weaker(stronger) LTGs relative to this time interval. (For interpretation of the references tocolor in this figure legend, the reader is referred to the web version of this article.)
over the instrumental record. Fig. 4 illustrates two prominent de-creases in LTGs over the past century centered during the 1930sand more recently during the past decade. Both periods are charac-terized by extensive high latitude warming (2.2 ◦C) with the largestchanges occurring north of 60◦ N (Polyakov et al., 2003) leading toArctic and subarctic sea-ice retreat and elevated SSTs during thewinter (Overland and Wang, 2005). Most of the observed warmingwas linked to a westward extension of the Siberian High allowinganomalous southeasterly winds into the Bering Sea warming SSTsand delaying winter sea ice formation (Fig. 5) (Cassou et al., 2004;Overland and Wang, 2005; Wood and Overland, 2010). Over sub-polar latitudes, an eastward shift and heightening of the IcelandicLow weakened pressure gradients between the Greenland Highand the Icelandic Low reducing northerly winds along the eastGreenland coastline and thereby the strength of the East Green-land Current (EGC) (Blindheim and Malmberg, 2005). The weakerEGC/Icelandic Low allowed the Irminger Current (IC) to penetratefurther north into the Denmark Strait (Fig. 6b) (Beverton andLee, 1965; Dickson and Brander, 1993; Kushnir, 1994) warmingsurface waters off southeast Greenland and northern Iceland by∼2 ◦C during the 1930s to late 1950s (NOAA_ERSST_V3; Smithet al., 2008; Xue et al., 2003). The northward penetration of ICwaters into the Denmark Strait was favored by a weak SPG cir-culation, a north-south gyre orientation and a northwestward re-treat of the Subarctic front (SAF) (Fig. 6b). A Strong east–westoriented SPG on the other hand favors the inflow of EGC wa-ters into the Irminger and Iceland Seas and a southeastern ad-vance of the SAF (Fig. 6a) (Bersch et al., 1999; Flatau et al., 2003;Hatun et al., 2005).
A. Morley et al. / Earth and Planetary Science Letters 388 (2014) 18–26 23
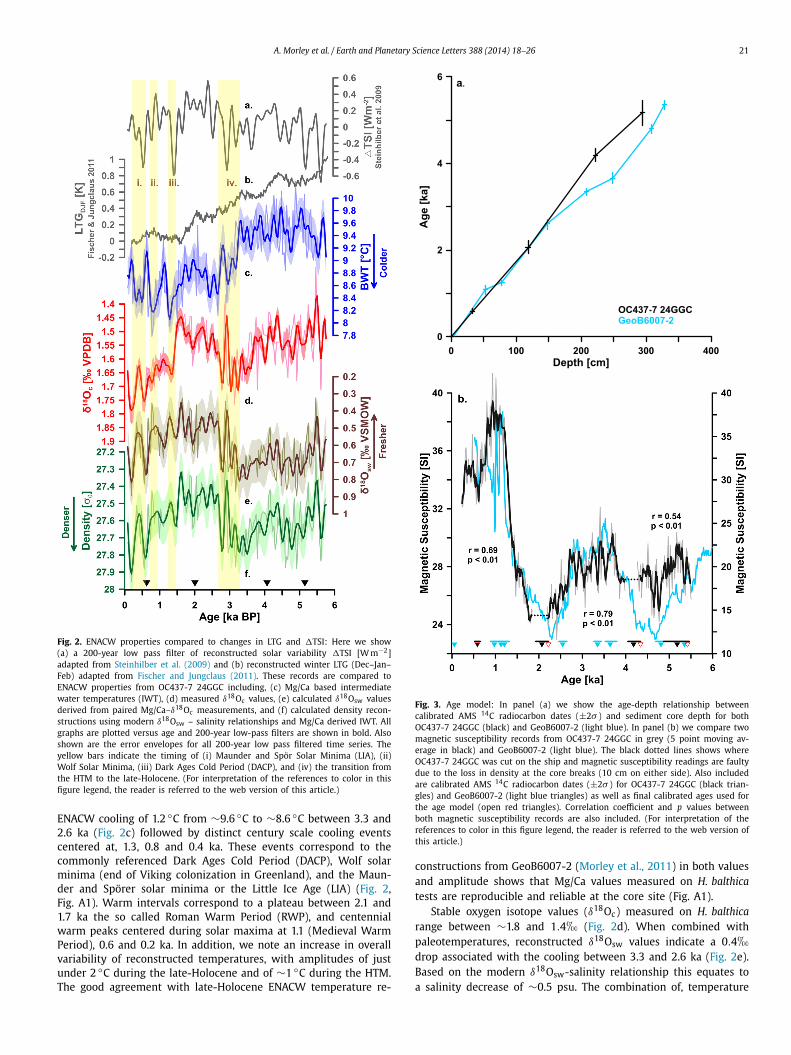
Fig. 5. Comparison of the NAO (top and middle) dipole with the atmospheric con-figuration of the 1930s (bottom): The bottom panel illustrates the distribution ofatmospheric pressure centers and climate over Northern Latitudes during the 1930satmospheric regime shift as described by Overland and Wang (2005). In addition,all panels show the ENACW formation region marked in grey hatching and core lo-cation of OC437-7 24GGC (adapted from McCartney and Talley, 1982).
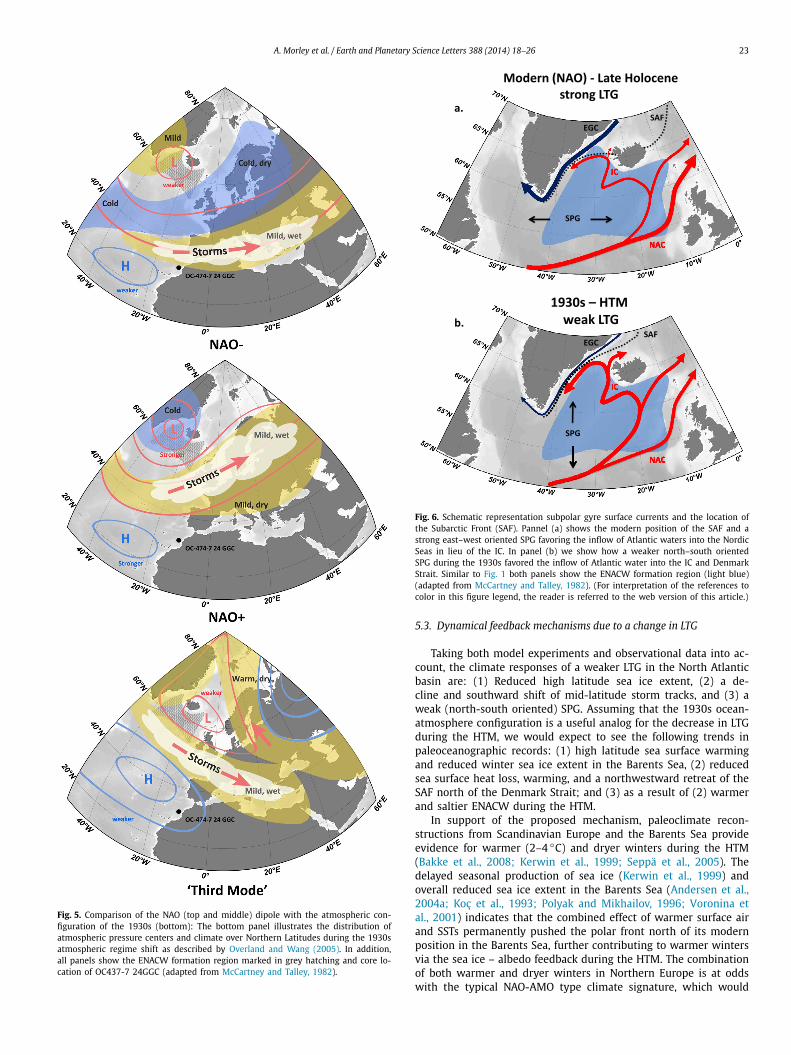
Fig. 6. Schematic representation subpolar gyre surface currents and the location ofthe Subarctic Front (SAF). Pannel (a) shows the modern position of the SAF and astrong east–west oriented SPG favoring the inflow of Atlantic waters into the NordicSeas in lieu of the IC. In panel (b) we show how a weaker north–south orientedSPG during the 1930s favored the inflow of Atlantic water into the IC and DenmarkStrait. Similar to Fig. 1 both panels show the ENACW formation region (light blue)(adapted from McCartney and Talley, 1982). (For interpretation of the references tocolor in this figure legend, the reader is referred to the web version of this article.)
5.3. Dynamical feedback mechanisms due to a change in LTG
Taking both model experiments and observational data into ac-count, the climate responses of a weaker LTG in the North Atlanticbasin are: (1) Reduced high latitude sea ice extent, (2) a de-cline and southward shift of mid-latitude storm tracks, and (3) aweak (north-south oriented) SPG. Assuming that the 1930s ocean-atmosphere configuration is a useful analog for the decrease in LTGduring the HTM, we would expect to see the following trends inpaleoceanographic records: (1) high latitude sea surface warmingand reduced winter sea ice extent in the Barents Sea, (2) reducedsea surface heat loss, warming, and a northwestward retreat of theSAF north of the Denmark Strait; and (3) as a result of (2) warmerand saltier ENACW during the HTM.
In support of the proposed mechanism, paleoclimate recon-structions from Scandinavian Europe and the Barents Sea provideevidence for warmer (2–4 ◦C) and dryer winters during the HTM(Bakke et al., 2008; Kerwin et al., 1999; Seppä et al., 2005). Thedelayed seasonal production of sea ice (Kerwin et al., 1999) andoverall reduced sea ice extent in the Barents Sea (Andersen et al.,2004a; Koç et al., 1993; Polyak and Mikhailov, 1996; Voronina etal., 2001) indicates that the combined effect of warmer surface airand SSTs permanently pushed the polar front north of its modernposition in the Barents Sea, further contributing to warmer wintersvia the sea ice – albedo feedback during the HTM. The combinationof both warmer and dryer winters in Northern Europe is at oddswith the typical NAO-AMO type climate signature, which would
24 A. Morley et al. / Earth and Planetary Science Letters 388 (2014) 18–26
bring either cold and dry (NAO −) or warm and wet (NAO +)winters to this region (Fig. 5). Alternatively, an atmospheric cir-culation regime similar to the 1930s with a westward extensionof the Siberian High and anomalous southeasterly winds (Fig. 5)would be able to explain observations of warmer and dryer win-ters over Northern Europe and the Bering Sea during the HTM.
Paleoreconstructions of surface water properties in the Den-mark Strait region mark a distinct shift from warm and salinesurface waters of subtropical origins to cool and fresher polar wa-ters after the mid-to-late Holocene transition (Giraudeau et al.,2010; Ólafsdóttir et al., 2010). There is common consensus thata stronger influence of the EGC in the Irminger and Iceland Seascoupled with a southeastward advance of the SAF and a strongereast–west oriented SPG were responsible for this shift (Fig. 6b)(Giraudeau et al., 2000; Jennings et al., 2011; Ólafsdóttir et al.,2010; Solignac et al., 2004). Thornalley et al. (2009) discuss theprocesses responsible for a shift from a weak north–south ori-ented (e.g. HTM) to a strong east–west oriented SPG (e.g. late-Holocene) and identify local wind stress as the controlling mecha-nism for SPG strength and orientation (Häkkinen and Rhines, 2004;Thornalley et al., 2009). If this hypothesis is correct westerly windswere weaker over the Irminger and Iceland Seas during the HTMand increased over the mid-to-late Holocene transition into thelate-Holocene. An intensification of mid-latitude storm intensitiesagrees well with the predicted model response to a strength-ening of LTG during the late-Holocene (Brayshaw et al., 2010;Renssen et al., 2005a, 2005b).
The influence of stronger sea surface heat loss (mid-latitudeWesterlies) and the southeastern advance of the SAF is capturedby a 1.2 ◦C and 0.4❤ drop in ENACW temperature and δ18Oswvalues over the mid-to-late Holocene transition. Similarly, sev-eral paleoceanographic datasets from subpolar latitudes record ashift in EGC/IC strength after 4 ka (Farmer et al., 2011; Hall etal., 2004; Moros et al., 2012; Thornalley et al., 2009) indicatingthat the SAF reached its modern position across the DenmarkStrait after the mid-to-late Holocene transition (Berner et al., 2008;Giraudeau et al., 2000; Hall et al., 2004; Moros et al., 2012;Rasmussen et al., 2002). Additional evidence for fresher subpo-lar surface waters also come from the Denmark Strait after 4 ka(Ólafsdóttir et al., 2010) and the Reykjanes Ridge after 3.7 ka(Came et al., 2007).
Morley et al. (2011) discussed the sensitivity of ENACW circu-lation to solar variability on multidecadal to centennial timescalesover the past 1.3 ka. Fig. 2 suggests that the sensitivity of ENACWcirculation to solar variability increased during the late-Holocenewith temperature amplitudes of just under 2 ◦C especially after1.5 ka compared to 1◦C changes during the HTM. Similarly, sev-eral other paleoceanographic records (Andersen et al., 2004a; Calvoet al., 2002; Jansen et al., 2009; Moros et al., 2012; Rasmussen etal., 2002) also discuss an increase in climate sensitivity or variabil-ity of subpolar and polar sea surface ocean properties during thelate-Holocene. In a coupled climate model Renssen et al. (2005b)explain this increase in climate sensitivity by linking the expan-sion of high latitude sea ice formation and enhanced sea ice exportalong the East Greenland margin with stronger temperature andsalinity gradients north and south of the SAF after 4 ka. This grad-ual increase in gradients potentially forced higher amplitude shiftsof the SAF (Renssen et al., 2005b) resulting in the increased sensi-tivity observed in subpolar surface ocean properties to solar forcingduring the late-Holocene. The combined effect of (1) stronger mid-latitude Westerlies, (2) a strong east–west oriented SPG with a SAFlocated across the Denmark Strait and (3) high amplitude swingsof the SAF thus provide an explanation for the increased sensitivityof ENACW circulation to solar variability during the late-Holocene.
In addition to the apparent amplification of climate variabilityafter the mid-to-late Holocene transition we also record a trend
towards denser EANCW that is linked to increasing δ18Osw valuesover the past 3 ka and especially after 1.5 ka. There are two pos-sible mechanisms that could have increased salinity values in sub-polar surface waters during the late-Holocene. The inflow of freshEGC waters into the SPG may have progressively decreased, orthe influence of warm and saline subtropical waters progressivelyincreased over the past 3 ka. Our discussion highlights the un-likely scenario of a weaker or saltier EGC during the late-Holocene.On the other hand, several SPG thermocline records provide evi-dence for a seasonal (summer) thermocline warming trend afterthe HTM (Farmer et al., 2011; Hall et al., 2004; Moros et al., 2012;Thornalley et al., 2009). It is therefore more likely that the ob-served trend in δ18Osw values was linked to the overall increasein northward transport of warm and saline Atlantic waters duringHolocene (Farmer et al., 2011; Hall et al., 2004; Moros et al., 2012;Thornalley et al., 2009). Interestingly, the salinity trend in theENACW record is not paralleled by warmer temperatures over thesame interval. This decoupling between temperature and salinitymay also be linked to two processes. Either sea surface heat lossassociated with stronger mid-latitude Westerlies counteracted thewarming brought in by Atlantic waters or enhanced sea ice ex-port along the East Greenland margin cooled but not significantlyfreshened SPMW over the past 3 ka.
6. Conclusions
Observations at subpolar latitudes provide us with a detailedaccount of ocean-atmospheric circulation changes over the mid-to-late Holocene transition. Our analysis suggests that westerly windsover subpolar latitudes were weaker during HTM winters, indicat-ing that the Icelandic Low was weaker and/or shifted in locationrelative to today. As a result, SPG circulation strength was weakerallowing warm and salty Atlantic waters (IC) to influence north-eastern SPG surface water properties during the HTM. Comparedto modern observations such a climate signature in ENACW prop-erties is typically recorded during negative NAO years (Johnson andGruber, 2007; Morley et al., 2011). However, NAO (−) like atmo-spheric circulation patterns are unlikely to have caused warm anddry conditions in Northern Europe and the Barents Sea during theHTM. Instead a 1930s-like atmospheric circulation regime mightbest reconcile climate records from both Northern Europe and sub-polar latitudes.
Finally, the presented data illustrates the dynamic response ofENACW circulation to a gradual change in the LTG during the mid-to-late Holocene transition. This ocean-atmosphere response is aprime example of an amplifying feedback mechanism within theclimate system and its identification will help to advance our un-derstanding of how regional climate change is transferred and am-plified to affect hemispheric wide climate linkages.
Acknowledgements
We would like to thank the editor and two anonymous review-ers for thoughtful discussion and comments. Core OC437-7 24GGCwas collected as part of the Changing Holocene Environments ofthe Eastern Topical Atlantic (CHEETA) coring transect along NWAfrica and was supported by NSF award OCE04-02348 to PdeMand Tim Eglinton. We acknowledge the exceptional efforts of thecaptain, crew and shipboard scientists abroad the R/V Oceanus. Ad-ditional support came from NSF award OCE0902977 to YR.
Appendix A. Supplementary material
Supplementary material related to this article can be found on-line at http://dx.doi.org/10.1016/j.epsl.2013.11.039.
A. Morley et al. / Earth and Planetary Science Letters 388 (2014) 18–26 25
References
Ammann, C.M., Joos, F., Schimel, D.S., Otto-Bliesner, B.L., Tomas, R.A., 2007. Solarinfluence on climate during the past millennium: Results from transient sim-ulations with the NCAR Climate System Model. Proc. Natl. Acad. Sci. USA 104,3713–3718.
Andersen, C., Koç, N., Jennings, A., Andrews, J.T., 2004a. Nonuniform response of themajor surface currents in the Nordic Seas to insolation forcing: Implications forthe Holocene climate variability. Paleoceanography 19, 2003.
Andersen, C., Koç, N., Moros, M., 2004b. A highly unstable Holocene climate in thesubpolar North Atlantic: evidence from diatoms. Quat. Sci. Rev. 23, 2155–2166.
Arhan, M., Colin De Verdiére, A., Mémery, L., 1994. The eastern boundary of thesubtropical North Atlantic. J. Phys. Oceanogr. 24, 1295–1316.
Bakke, J., Lie, Ø., Dahl, S.O., Nesje, A., Bjune, A.E., 2008. Strength and spatial patternsof the Holocene wintertime westerlies in the NE Atlantic region. Glob. Planet.Change 60, 28–41.
Barker, S., Greaves, M., Elderfield, H., 2003. A study of cleaning procedures used forforaminiferal Mg/Ca paleothermometry. Geochem. Geophys. Geosyst. 4, 8407.
Bengtsson, L., Semenov, V.A., Johannessen, O.M., 2004. The early twentieth-centurywarming in the Arctic—a possible mechanism. J. Climate 17, 4045–4057.
Berner, K.S., Koç, N., Divine, D., Godtliebsen, F., Moros, M., 2008. A decadal-scaleHolocene sea surface temperature record from the subpolar North Atlantic con-structed using diatoms and statistics and its relation to other climate parame-ters. Paleoceanography 23, PA2210.
Bersch, M., Meincke, J., Sy, A., 1999. Interannual thermohaline changes in the north-ern North Atlantic 1991–1996. Deep-Sea Res., Part 2, Top. Stud. Oceanogr. 46,55–75.
Beverton, R., Lee, A., 1965. Hydrographic fluctuations in the North Atlantic Oceanand some biological consequences. Symp. Inst. Biol. 14, 79–109.
Bleil, U., Dillon, M., 2008. Holocene Earth’s magnetic field variations recorded in ma-rine sediments of the NW African continental margin. Stud. Geophys. Geod. 52,133–155.
Blindheim, J., Malmberg, S.A., 2005. The mean sea level pressure gradient across theDenmark Strait as an indicator of conditions in the North Icelandic Irminger cur-rent, The Nordic Seas: An integrated perspective oceanography. In: Climatology,Biogeochemistry, and Modeling. AGU, Washington, DC, pp. 65–71.
Bonfils, C., de Noblet-Ducoudré, N., Guiot, J., Bartlein, P., 2004. Some mechanisms ofmid-Holocene climate change in Europe, inferred from comparing PMIP modelsto data. Clim. Dyn. 23, 79–98.
Booth, B.B.B., Dunstone, N.J., Halloran, P.R., Andrews, T., Bellouin, N., 2012. Aerosolsimplicated as a prime driver of twentieth-century North Atlantic climate vari-ability. Nature 484, 228–232.
Brayshaw, D.J., Hoskins, B., Black, E., 2010. Some physical drivers of changes inthe winter storm tracks over the North Atlantic and Mediterranean during theHolocene. Philos. Trans. R. Soc. A, Math. Phys. Eng. Sci. 368, 5185–5223.
Calvo, E., Grimalt, J., Jansen, E., 2002. High resolution U37K sea surface temperaturereconstruction in the Norwegian Sea during the Holocene. Quat. Sci. Rev. 21,1385–1394.
Came, R.E., Oppo, D.W., McManus, J.F., 2007. Amplitude and timing of temperatureand salinity variability in the subpolar North Atlantic over the past 10 k.y. Ge-ology 35, 315–318.
Cassou, C., Terray, L., Hurrell, J.W., Deser, C., 2004. North Atlantic winter climateregimes: spatial asymmetry, stationarity with time, and oceanic forcing. J. Cli-mate 17, 1055–1068.
Davis, B., Brewer, S., 2009. Orbital forcing and role of the latitudinal insolation/tem-perature gradient. Clim. Dyn. 32, 143–165.
De Angelis, M., Steffensen, J.P., Legrand, M., Clausen, H., Hammer, C., 1997. Pri-mary aerosol (sea salt and soil dust) deposited in Greenland ice during thelast climatic cycle: Comparison with east Antarctic records. J. Geophys. Res. 102,26681–26698.
Dickson, R.R., Brander, K.M., 1993. Effects of a changing windfield on cod stocks ofthe North Atlantic. Fish. Oceanogr. 2, 124–153.
Drinkwater, K.F., 2006. The regime shift of the 1920s and 1930s in the North At-lantic. Prog. Oceanogr. 68, 134–151.
Farmer, E.J., Chapman, M.R., Andrews, J.E., 2011. Holocene temperature evolution ofthe subpolar North Atlantic recorded in the Mg/Ca ratios of surface and ther-mocline dwelling planktonic foraminifers. Glob. Planet. Change 79, 234–243.
Fischer, N., Jungclaus, J.H., 2011. Evolution of the seasonal temperature cycle ina transient Holocene simulation: orbital forcing and sea-ice. Clim. Past 7,1139–1148.
Flatau, M.K., Talley, L., Niiler, P.P., 2003. The North Atlantic oscillation, surface cur-rent velocities, and SST changes in the subpolar North Atlantic. J. Climate 16,2355–2369.
Furevik, T., Nilsen, J.E., 2005. Large-scale circulation variability and its impacts onthe Nordic Seas ocean climate – a review. In: Drange, H., Dokken, T., Fure-vik, T., Gerdes, R., Berger, W. (Eds.), The Nordic Seas: An Integrated PerspectiveOceanography, Climatology, Biogeochemistry and Modelling. The American Geo-physical Unioin, Washington, DC, pp. 105–136.
Giraudeau, J., Cremer, M., Manthé, S., Labeyrie, L., Bond, G., 2000. Coccolith evidencefor instabilities in surface circulation south of Iceland during Holocene times.Earth Planet. Sci. Lett. 179, 257–268.
Giraudeau, J., Grelaud, M., Solignac, S., Andrews, J.T., Moros, M., Jansen, E., 2010.Millennial-scale variability in Atlantic water advection to the Nordic Seasderived from Holocene coccolith concentration records. Quat. Sci. Rev. 29,1276–1287.
Grossmann, I., Klotzbach, P.J., 2009. A review of North Atlantic modes of naturalvariability and their driving mechanisms. J. Geophys. Res., Atmos. 114, D24107.
Häkkinen, S., 2000. Decadal air–sea interaction in the North Atlantic based on ob-servations and modeling results. J. Climate 13, 1195–1219.
Häkkinen, S., Rhines, P.B., 2004. Decline of subpolar North Atlantic circulation duringthe 1990s. Science 304, 555–559.
Hall, I.R., Bianchi, G.G., Evans, J.R., 2004. Centennial to millennial scale Holoceneclimate-deep water linkage in the North Atlantic. Quat. Sci. Rev. 23, 1529–1536.
Hatun, H., Sando, A.B., Drange, H., Hansen, B., Valdimarsson, H., 2005. Influenceof the Atlantic subpolar gyre on the thermohaline circulation. Science 309,1841–1844.
Hurrell, J.W., 1995. Decadal tends in the North Atlantic oscillation: regional temper-atures and precipitation. Science 269, 676–679.
Iselin, C.O.D., 1936. A study of the circulation of the western North Atlantic. Pap.Phys. Oceanogr. Meteorol. 4, 101.
Jain, S., Lall, U., Mann, M.E., 1999. Seasonality and interannual variations of north-ern hemisphere temperature: Equator-to-pole gradient and ocean–land contrast.J. Climate 12, 1086–1100.
Jansen, E., Andersson, C., Moros, M., Nisancioglu, K.H., Nyland, B.F., Telford, R.J., 2009.The Early to Mid-Holocene Thermal Optimum in the North Atlantic, Natural Cli-mate Variability and Global Warming. Wiley Blackwell, pp. 123–137.
Jennings, A., Andrews, J., Wilson, L., 2011. Holocene environmental evolution of theSE Greenland Shelf North and South of the Denmark Strait: Irminger and EastGreenland current interactions. Quat. Sci. Rev. 30, 980–998.
Johnson, G.C., Gruber, N., 2007. Decadal water mass variations along 20◦ W in theNortheastern Atlantic Ocean. Prog. Oceanogr. 73, 277–295.
Keffer, T., 1985. The ventilation of the World’s Oceans: Maps of the potential vortic-ity field. J. Phys. Oceanogr. 15, 509–523.
Kerwin, M.W., Overpeck, J.T., Webb, R.S., DeVernal, A., Rind, D.H., Healy, R.J., 1999.The role of oceanic forcing in mid-Holocene Northern Hemisphere climaticchange. Paleoceanography 14, 200.
Kim, J.-H., Meggers, H., Rimbu, N., Lohmann, G., Freudenthal, T., Muller, P.J., Schnei-der, R.R., 2007. Impacts of the North Atlantic gyre circulation on Holocene cli-mate off northwest Africa. Geology 35, 387–390.
Knight, J.R., Allan, R.J., Folland, C.K., Vellinga, M., Mann, M.E., 2005. A signature ofpersistent natural thermohaline circulation cycles in observed climate. Geophys.Res. Lett. 32, L20708.
Knoll, M., Hernández-Guerra, A., Lenz, B., Laatzen, F.L., Machín, F., Müller, T.J., Siedler,G., 2002. The eastern boundary current system between the Canary Islands andthe African Coast. Deep-Sea Res., Part 2, Top. Stud. Oceanogr. 49, 3427–3440.
Knudsen, M.F., Riisager, P., Jacobsen, B.H., Muscheler, R., Snowball, I., Seidenkrantz,M.-S., 2009. Taking the pulse of the Sun during the Holocene by joint analysisof 14C and 10Be. Geophys. Res. Lett. 36.
Knudsen, M.F., Seidenkrantz, M.-S., Jacobsen, B.H., Kuijpers, A., 2011. Tracking theAtlantic Multidecadal Oscillation through the last 8,000 years. Nat. Commun. 2,178.
Koç, N., Jansen, E., Haflidason, H., 1993. Paleoceanographic reconstructions of surfaceocean conditions in the Greenland, Iceland and Norwegian seas through the last14 ka based on diatoms. Quat. Sci. Rev. 12, 115–140.
Kropelin, S., Verschuren, D., Lezine, A.M., Eggermont, H., Cocquyt, C., Francus, P.,Cazet, J.P., Fagot, M., Rumes, B., Russell, J.M., Darius, F., Conley, D.J., Schuster, M.,von Suchodoletz, H., Engstrom, D.R., 2008. Climate-driven ecosystem successionin the Sahara: the past 6000 years. Science 320, 765–768.
Kuhlmann, H., Meggers, H., Freudenthal, T., Wefer, G., 2004. The transition ofthe monsoonal and the N Atlantic climate system off NW Africa during theHolocene. Geophys. Res. Lett. 31, L22204.
Kuper, R., Kropelin, S., 2006. Climate-controlled Holocene occupation in the Sahara:motor of Africa’s evolution. Science 313, 803–807.
Kushnir, Y., 1994. Interdecadal variations in North Atlantic Sea surface temperatureand associated atmospheric conditions. J. Climate 7, 141–157.
Lean, J.L., 2010. Cycles and trends in solar irradiance and climate. Wiley Interdiscip.Rev.: Clim. Change 1, 111–122.
LeGrande, A.N., Schmidt, G.A., 2006. Global gridded data set of the oxygen isotopiccomposition in seawater. Geophys. Res. Lett. 33, L12604.
Levitus, S., 1989. Interpentadal variability of temperature and salinity at intermedi-ate depths of the North Atlantic Ocean, 1970–1974 versus 1955–1959. J. Geo-phys. Res. 94, 6091–6131.
Liu, Z., Alexander, M., 2007. Atmospheric bridge, oceanic tunnel, and global climaticteleconnections. Rev. Geophys. 45, RG2005.
Lockwood, M., Harrison, R.G., Woollings, T., Solanki, S.K., 2010. Are cold winters inEurope associated with low solar activity?. Environ. Res. Lett. 5, 024001.
Lohmann, G., Rimbu, N., Dima, M., 2004. Climate signature of solar irradiance vari-ations: analysis of long-term instrumental, historical, and proxy data. Int. J.Climatol. 24, 1045–1056.
Luterbacher, J., Dietrich, D., Xoplaki, E., Grosjean, M., Wanner, H., 2004. Europeanseasonal and annual temperature variability, trends, and extremes since 1500.Science 303, 1499–1503.
26 A. Morley et al. / Earth and Planetary Science Letters 388 (2014) 18–26
Mann, M.E., Zhang, Z., Rutherford, S., Bradley, R.S., Hughes, M.K., Shindell, D., Am-mann, C., Faluvegi, G., Ni, F., 2009. Global signatures and dynamical origins ofthe little ice age and medieval climate anomaly. Science 326, 1256–1260.
Marshall, J., Kushnir, Y., Battisti, D., Chang, P., Czaja, A., Dickson, R., Hurrell, J., Mc-Cartney, M., Saravanan, R., Visbeck, M., 2001. North Atlantic climate variability:phenomena, impacts and mechanisms. Int. J. Climatol. 21, 1863–1898.
Masson, V., Cheddadi, R., Braconnot, P., Joussaume, S., Texier, D., PMIP participants,1999. Mid-Holocene climate in Europe: what can we infer from PMIP model-data comparisons?. Clim. Dyn. 15, 163–182.
McCartney, M.S., Talley, L.D., 1982. The subpolar mode water of the North AtlanticOcean. J. Phys. Oceanogr. 12, 1169–1188.
McDowell, S., Rhines, P., Keffer, T., 1982. North Atlantic potential vorticity and itsrelation to the general circulation. J. Phys. Oceanogr. 12, 1417–1436.
McGee, D., deMenocal, P.B., Winckler, G., Stuut, J.-B.W., Bradtmiller, L.I., 2013. Themagnitude, timing and abruptness of changes in North African dust depositionover the last 20,000 yr. Earth Planet. Sci. Lett. 371–372, 163–176.
Morley, A., Schulz, M., Rosenthal, Y., Mulitza, S., Paul, A., Rühlemann, C., 2011. Solarmodulation of North Atlantic central water formation at multidecadal timescalesduring the late Holocene. Earth Planet. Sci. Lett. 308, 161–171.
Moros, M., Jansen, E., Oppo, D.W., Giraudeau, J., Kuijpers, A., 2012. Reconstructionof the late-Holocene changes in the Sub-Arctic Front position at the ReykjanesRidge, North Atlantic. Holocene 22, 877–886.
Ólafsdóttir, S., Jennings, A.E., Geirsdóttir, Á., Andrews, J., Miller, G.H., 2010. Holocenevariability of the North Atlantic Irminger current on the south- and northwestshelf of Iceland. Marine Micropaleontology 77, 101–118.
Olsen, J., Anderson, N.J., Knudsen, M.F., 2012. Variability of the North Atlantic Oscil-lation over the past 5,200 years. Nat. Geosci. 5, 808–812.
Ottera, O.H., Bentsen, M., Drange, H., Suo, L., 2010. External forcing as a metronomefor Atlantic multidecadal variability. Nat. Geosci. 3, 688–694.
Overland, J.E., Wang, M., 2005. The Arctic climate paradox: The recent decrease ofthe Arctic Oscillation. Geophys. Res. Lett. 32, L06701.
Pena, L.D., Francés, G., Diz, P., Esparza, M., Grimalt, J.O., Nombela, M.A., Alejo, I.,2010. Climate fluctuations during the Holocene in NW Iberia: High and lowlatitude linkages. Cont. Shelf Res. 30, 1487–1496.
Pinto, J.G., Raible, C.C., 2012. Past and recent changes in the North Atlantic oscilla-tion. Wiley Interdiscip. Rev.: Clim. Change 3, 79–90.
Polyak, L., Mikhailov, V., 1996. Post-glacial environments of the southeastern BarentsSea: foraminiferal evidence. Geol. Soc. (Lond.) Spec. Publ. 111, 323–337.
Polyakov, I.V., Bekryaev, R.V., Alekseev, G.V., Bhatt, U.S., Colony, R.L., Johnson, M.A.,Maskshtas, A.P., Walsh, D., 2003. Variability and trends of air temperature andpressure in the Maritime Arctic, 1875–2000. J. Climate 16, 2067–2077.
Poole, R., Tomczak, M., 1999. Optimum multiparameter analysis of the water massstructure in the Atlantic Ocean thermocline. Deep-Sea Res., Part 1, Oceanogr.Res. Pap. 46, 1895–1921.
Rasmussen, T.L., Bäckström, D., Heinemeier, J., Klitgaard-Kristensen, D., Knutz, P.C.,Kuijpers, A., Lassen, S., Thomsen, E., Troelstra, S.R., van Weering, T.C.E., 2002.The Faroe–Shetland Gateway: Late quaternary water mass exchange betweenthe Nordic seas and the northeastern Atlantic. Mar. Geol. 188, 165–192.
Raymo, M.E., Nisancioglu, K., 2003. The 41 kyr world: Milankovitch’s other unsolvedmystery. Paleoceanography 18, 1011.
Renssen, H., Goosse, H., Fichefet, T., 2005a. Contrasting trends in North Atlanticdeep-water formation in the Labrador Sea and Nordic Seas during the Holocene.Geophys. Res. Lett. 32, L08711.
Renssen, H., Goosse, H., Fichefet, T., Brovkin, V., Driesschaert, E., Wolk, F., 2005b.Simulating the Holocene climate evolution at northern high latitudes using acoupled atmosphere-sea ice-ocean-vegetation model. Clim. Dyn. 24, 23–43.
Rimbu, N., Lohmann, G., Kim, J.-H., Arz, H.W., Schneider, R., 2003. Arctic/North At-lantic Oscillation signature in Holocene sea surface temperature trends as ob-tained from alkenone data. Geophys. Res. Lett. 30, 1280.
Rimbu, N., Lohmann, G., Lorenz, S.J., Kim, J.H., Schneider, R.R., 2004. Holocene cli-mate variability as derived from alkenone sea surface temperature and coupledocean-atmosphere model experiments. Clim. Dyn. 23, 215–227.
Rind, D., 1998. Latitudinal temperature gradients and climate change. J. Geophys.Res. 103, 5943–5971.
Rosenthal, Y., Field, M.P., Sherrell, R.M., 1999. Precise determination of element/cal-cium ratios in calcareous samples using sector field inductively coupled plasmamass spectrometry. Anal. Chem. 71, 3248–3253.
Rosenthal, Y., Morley, A., Barras, C., Katz, M.E., Jorissen, F., Reichart, G.-J., Oppo, D.W.,Linsley, B.K., 2011. Temperature calibration of Mg/Ca ratios in the intermedi-ate water benthic foraminifer Hyalinea balthica. Geochem. Geophys. Geosyst. 12,Q04003.
Schmiedl, G., de Bovée, F., Buscail, R., Charrière, B., Hemleben, C., Medernach, L.,Picon, P., 2000. Trophic control of benthic foraminiferal abundance and micro-habitat in the bathyal Gulf of Lions, western Mediterranean Sea. Marine Mi-cropaleontology 40, 167–188.
Seppä, H., Hammarlund, D., Antonsson, K., 2005. Low-frequency and high-frequencychanges in temperature and effective humidity during the Holocene in south-central Sweden: implications for atmospheric and oceanic forcings of climate.Clim. Dyn. 25, 285–297.
Shackleton, N., 1974. Attainment of isotopic equilibrium between ocean water andthe benthonic foraminifera genus Uvigerina: Isotopic changes in the ocean dur-ing the last glacial. Colloq. Int. Cent. Natl. Rech. Sci. 219, 203–209.
Shindell, D.T., Schmidt, G.A., Mann, M.E., Rind, D., Waple, A., 2001. Solar forcing ofregional climate change during the Maunder Minimum. Science 294, 2149–2151.
Sicre, M.A., Hall, I.R., Mignot, J., Khodri, M., Ezat, U., Truong, M.X., Eiríksson, J., Knud-sen, K.L., 2011. Sea surface temperature variability in the subpolar Atlantic overthe last two millennia. Paleoceanography 26, PA4218.
Solignac, S., de Vernal, A., Hillaire-Marcel, C., 2004. Holocene sea-surface conditionsin the North Atlantic—contrasted trends and regimes in the western and easternsectors (Labrador Sea vs. Iceland Basin). Quat. Sci. Rev. 23, 319–334.
Steinhilber, F., Abreu, J.A., Beer, J., Brunner, I., Christl, M., Fischer, H., Heikkilä, U.,Kubik, P.W., Mann, M., McCracken, K.G., Miller, H., Miyahara, H., Oerter, H., Wil-helms, F., 2012. 9,400 years of cosmic radiation and solar activity from ice coresand tree rings. Proc. Natl. Acad. Sci. USA 109, 5967–5971.
Steinhilber, F., Beer, J., Fröhlich, C., 2009. Total solar irradiance during the Holocene.Geophys. Res. Lett. 36, L19704.
Stuiver, M., Reimer, P.J., 1993. Extended 14C data-base and revised calib. 3.0 14C agecalibration program. Radiocarbon 35, 215–230.
Stuiver, M., Reimer, P.J., Bard, E., Beck, W., Burr, G.S., Hughen, K.A., Kromer, B., McCor-mac, G., van der Plicht, J., Spurk, M., 1998. INTCAL98 radiocarbon age calibration,24,000-0 cal BP. Radiocarbon 40, 1041–1083.
Swingedouw, D., Terray, L., Cassou, C., Voldoire, A., Salas-Mélia, D., Servonnat, J.,2010. Natural forcing of climate during the last millennium: fingerprint of solarvariability. Clim. Dyn.
Thornalley, D.J.R., Elderfield, H., McCave, I.N., 2009. Holocene oscillations in temper-ature and salinity of the surface subpolar North Atlantic. Nature 457, 711–714.
tent positive North Atlantic oscillation mode dominated the medieval climateanomaly. Science 324, 78–80.
Villanueva Guimerans, P., Cervera Currado, J.L., 1999. Distribution of Planorbulinacea(benthic foraminifera) assemblages in surface sediments on the northern marginof the Gulf of Cadiz. Bol. Inst. Esp. Oceanogr. 15, 181–190.
Vinther, B.M., Buchardt, S.L., Clausen, H.B., Dahl-Jensen, D., Johnsen, S.J., Fisher, D.A.,Koerner, R.M., Raynaud, D., Lipenkov, V., Andersen, K.K., Blunier, T., Rasmussen,S.O., Steffensen, J.P., Svensson, A.M., 2009. Holocene thinning of the Greenlandice sheet. Nature 461, 385–388.
Visbeck, M., Chassignet, E., Curry, R., Delworth, T., Dickson, B., Krahmann, G., 2003.The Ocean’s response to North Atlantic oscillation variability. In: Hurrell, J.W.,Kushnir, Y., Ottersen, G., Visbeck, M. (Eds.), The North Atlantic Oscillation. AGU,pp. 113–146.
Voronina, E., Polyak, L., Vernal, A.D., Peyron, O., 2001. Holocene variations of sea-surface conditions in the southeastern Barents Sea, reconstructed from dinoflag-ellate cyst assemblages. J. Quat. Sci. 16, 717–726.
Wanner, H., Beer, J., Bütikofer, J., Crowley, T.J., Cubasch, U., Flückiger, J., Goosse, H.,Grosjean, M., Joos, F., Kaplan, J.O., Küttel, M., Müller, S.A., Prentice, I.C., Solom-ina, O., Stocker, T.F., Tarasov, P., Wagner, M., Widmann, M., 2008. Mid- to LateHolocene climate change: an overview. Quat. Sci. Rev. 27, 1791–1828.
Wood, K.R., Overland, J.E., 2010. Early 20th century Arctic warming in retrospect.Int. J. Climatol. 30, 1269–1279.
Xue, Y., Smith, T.M., Reynolds, R.W., 2003. Interdecadal changes of 30-yr SST normalsduring 1871–2000. J. Climate 16, 1601–1612.