4 September 2007 MAR 110 Lab 3: Ex 1-3 - PT 1 Laboratory 3: Exercise 1-3 Ocean Basin Physiography & Plate Tectonics 3-1. THE OCEAN BASIN The world ocean basin is an extensive suite of connected depressions (or basins) that are filled with salty water; covering 72% of the Earth’s surface. The ocean basin bathymetric profile in Figure 3-1 highlights features of a typical ocean basin, which is bordered by continental margins at the ocean’s edge. Starting at the coast, the sea floor the slopes slightly across the continental shelf to the shelf break where it plunges down the steeper continental slope to continental rise and the abyssal plain, which is flat because accumulated sediments. The continental shelf is the flooded edge of the continent -extending from the beach to the shelf break, with typical depths ranging from 130 m to 200 m. The sea floor slopes over wide shelves are 1° to 2° - virtually flat- and somewhat steeper over narrower shelves. Continental shelves are generally gently undulating surfaces, sometimes interrupted by hills and valleys (see Figure 3-2).
Transcript
4 September 2007 MAR 110 Lab 3: Ex 1-3 - PT 1
Laboratory 3: Exercise 1-3
Ocean Basin Physiography & Plate Tectonics
3-1. THE OCEAN BASIN The world ocean basin is an extensive suite of connected depressions (or basins) that are filled
with salty water; covering 72% of the Earth’s surface. The ocean basin bathymetric profile in
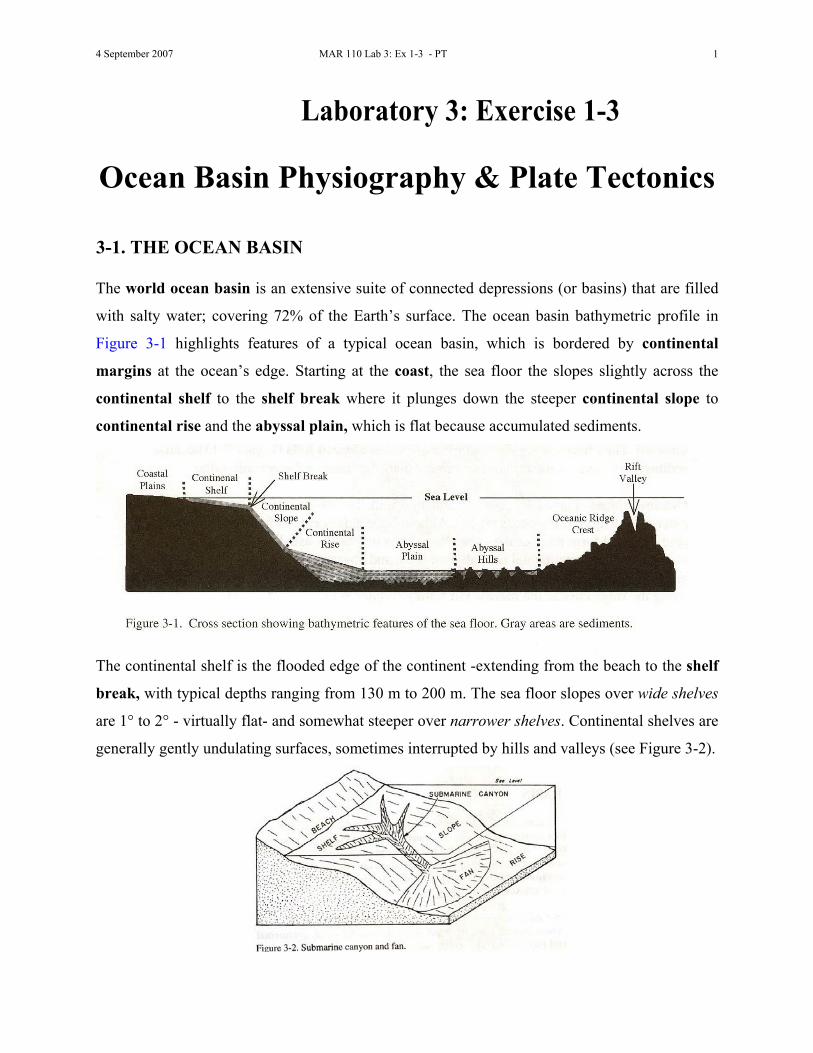
Figure 3-1 highlights features of a typical ocean basin, which is bordered by continental
margins at the ocean’s edge. Starting at the coast, the sea floor the slopes slightly across the
continental shelf to the shelf break where it plunges down the steeper continental slope to
continental rise and the abyssal plain, which is flat because accumulated sediments.
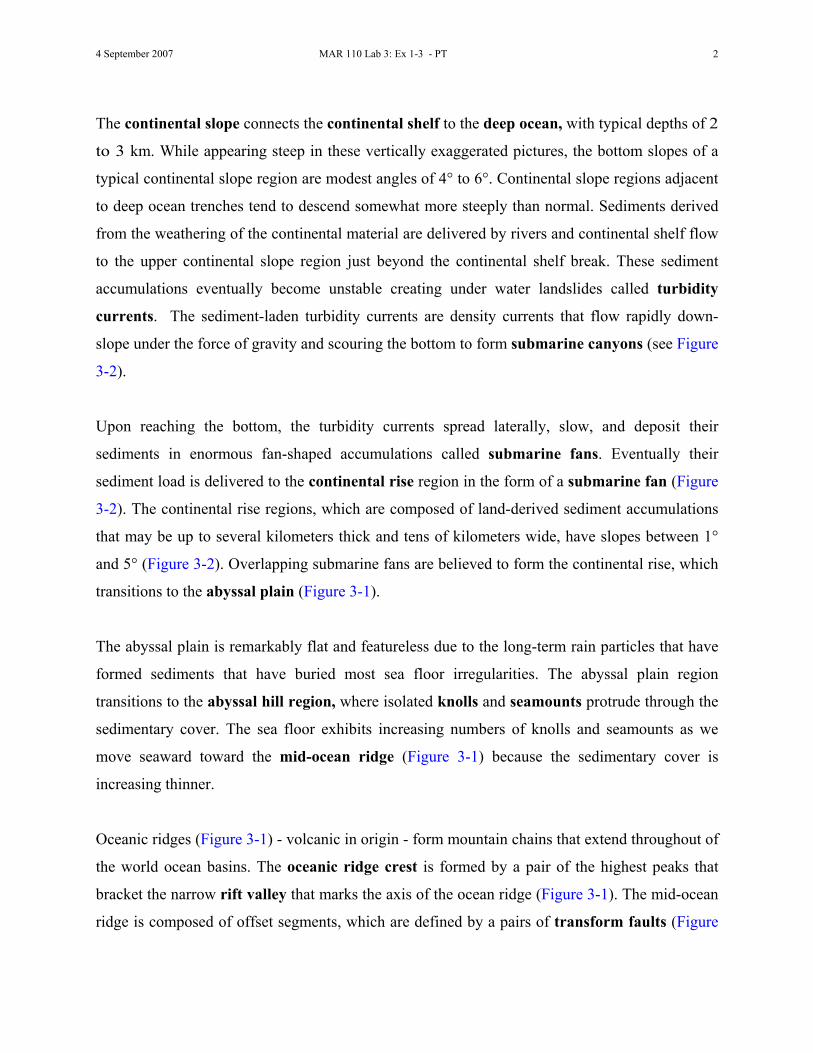
The continental shelf is the flooded edge of the continent -extending from the beach to the shelf
break, with typical depths ranging from 130 m to 200 m. The sea floor slopes over wide shelves
are 1° to 2° - virtually flat- and somewhat steeper over narrower shelves. Continental shelves are
generally gently undulating surfaces, sometimes interrupted by hills and valleys (see Figure 3-2).
4 September 2007 MAR 110 Lab 3: Ex 1-3 - PT 2
The continental slope connects the continental shelf to the deep ocean, with typical depths of 2
to 3 km. While appearing steep in these vertically exaggerated pictures, the bottom slopes of a
typical continental slope region are modest angles of 4° to 6°. Continental slope regions adjacent
to deep ocean trenches tend to descend somewhat more steeply than normal. Sediments derived
from the weathering of the continental material are delivered by rivers and continental shelf flow
to the upper continental slope region just beyond the continental shelf break. These sediment
accumulations eventually become unstable creating under water landslides called turbidity
currents. The sediment-laden turbidity currents are density currents that flow rapidly down-
slope under the force of gravity and scouring the bottom to form submarine canyons (see Figure
3-2).
Upon reaching the bottom, the turbidity currents spread laterally, slow, and deposit their
sediments in enormous fan-shaped accumulations called submarine fans. Eventually their
sediment load is delivered to the continental rise region in the form of a submarine fan (Figure
3-2). The continental rise regions, which are composed of land-derived sediment accumulations
that may be up to several kilometers thick and tens of kilometers wide, have slopes between 1°
and 5° (Figure 3-2). Overlapping submarine fans are believed to form the continental rise, which
transitions to the abyssal plain (Figure 3-1).
The abyssal plain is remarkably flat and featureless due to the long-term rain particles that have
formed sediments that have buried most sea floor irregularities. The abyssal plain region
transitions to the abyssal hill region, where isolated knolls and seamounts protrude through the
sedimentary cover. The sea floor exhibits increasing numbers of knolls and seamounts as we
move seaward toward the mid-ocean ridge (Figure 3-1) because the sedimentary cover is
increasing thinner.
Oceanic ridges (Figure 3-1) - volcanic in origin - form mountain chains that extend throughout of
the world ocean basins. The oceanic ridge crest is formed by a pair of the highest peaks that
bracket the narrow rift valley that marks the axis of the ocean ridge (Figure 3-1). The mid-ocean
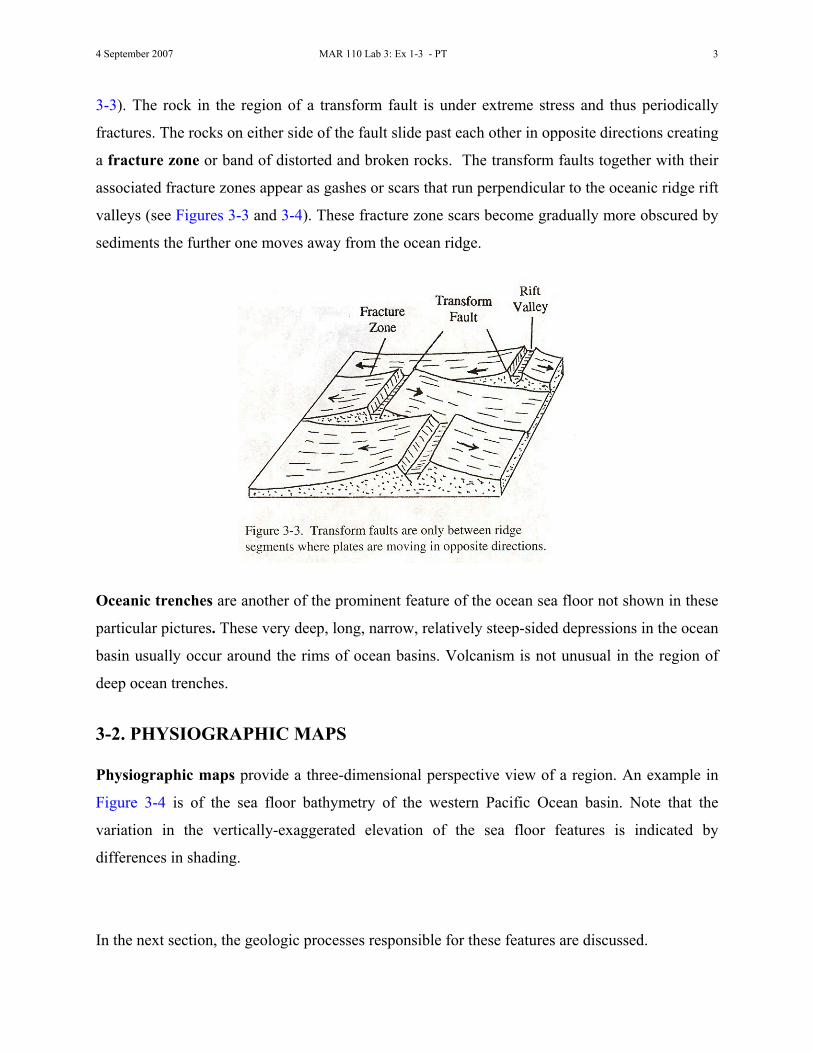
ridge is composed of offset segments, which are defined by a pairs of transform faults (Figure
4 September 2007 MAR 110 Lab 3: Ex 1-3 - PT 3
3-3). The rock in the region of a transform fault is under extreme stress and thus periodically
fractures. The rocks on either side of the fault slide past each other in opposite directions creating
a fracture zone or band of distorted and broken rocks. The transform faults together with their
associated fracture zones appear as gashes or scars that run perpendicular to the oceanic ridge rift
valleys (see Figures 3-3 and 3-4). These fracture zone scars become gradually more obscured by
sediments the further one moves away from the ocean ridge.
Oceanic trenches are another of the prominent feature of the ocean sea floor not shown in these
particular pictures. These very deep, long, narrow, relatively steep-sided depressions in the ocean
basin usually occur around the rims of ocean basins. Volcanism is not unusual in the region of
deep ocean trenches.
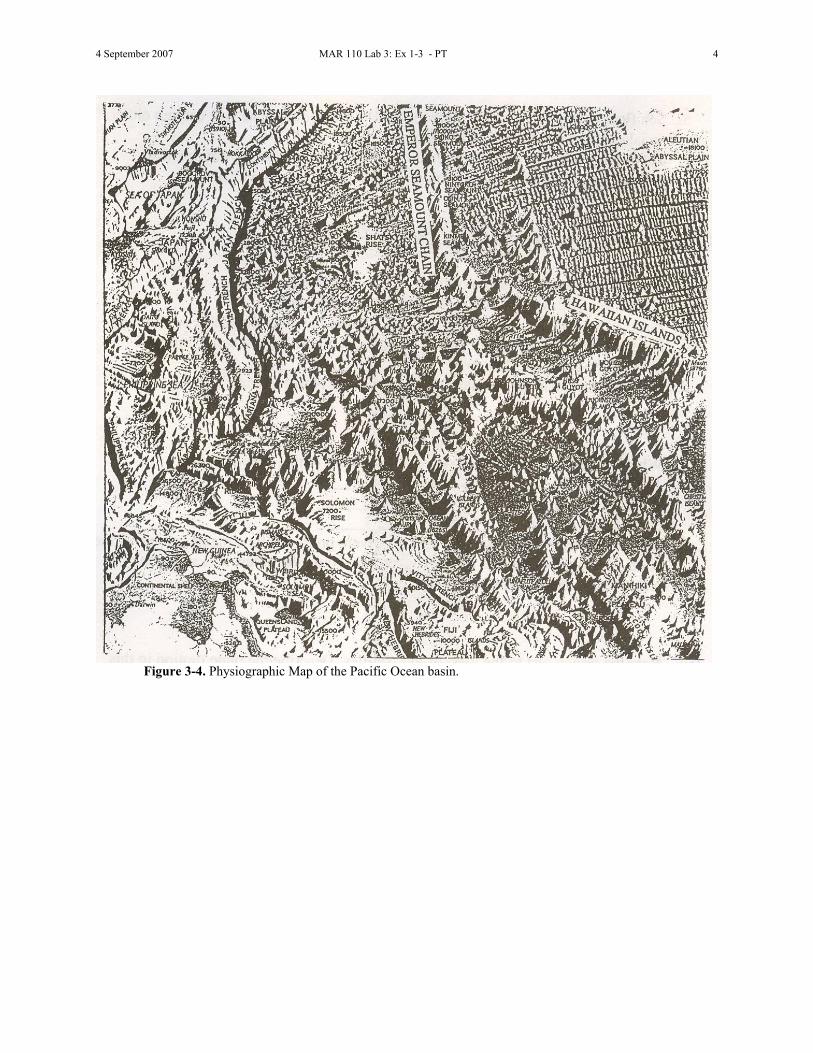
3-2. PHYSIOGRAPHIC MAPS Physiographic maps provide a three-dimensional perspective view of a region. An example in
Figure 3-4 is of the sea floor bathymetry of the western Pacific Ocean basin. Note that the
variation in the vertically-exaggerated elevation of the sea floor features is indicated by
differences in shading.
In the next section, the geologic processes responsible for these features are discussed.
4 September 2007 MAR 110 Lab 3: Ex 1-3 - PT 4
Figure 3-4. Physiographic Map of the Pacific Ocean basin.
4 September 2007 MAR 110 Lab 3: Ex 1-3 - PT 5
3-3. PLATE TECTONICS Plate tectonics is the dynamic response of the Earth’s surface crust to the processes deep within
the Earth that facilitate the upward escape of heat generated within. The ocean basin bathymetric
features that we actually observe are the result of the competition between plate tectonics and
sedimentation. Plate tectonic processes involve the creation, movement and destruction of the
Earth’s crust – all of which tend to produce sharp, jagged crustal features. But these features are
partially or fully buried by a rain of small sediment particles – a mixture of inorganic particles
produced by weathering of terrestrial rocks and organic particles produced by oceanic biology.
Because the sea floor is 10s to 100s of millions of years old, the sedimentary processes have the
time to build-up sediment layers that smooth and even bury the jagged features. Next we explore
the plate tectonic processes that produce the jagged features of the ocean sea floor.
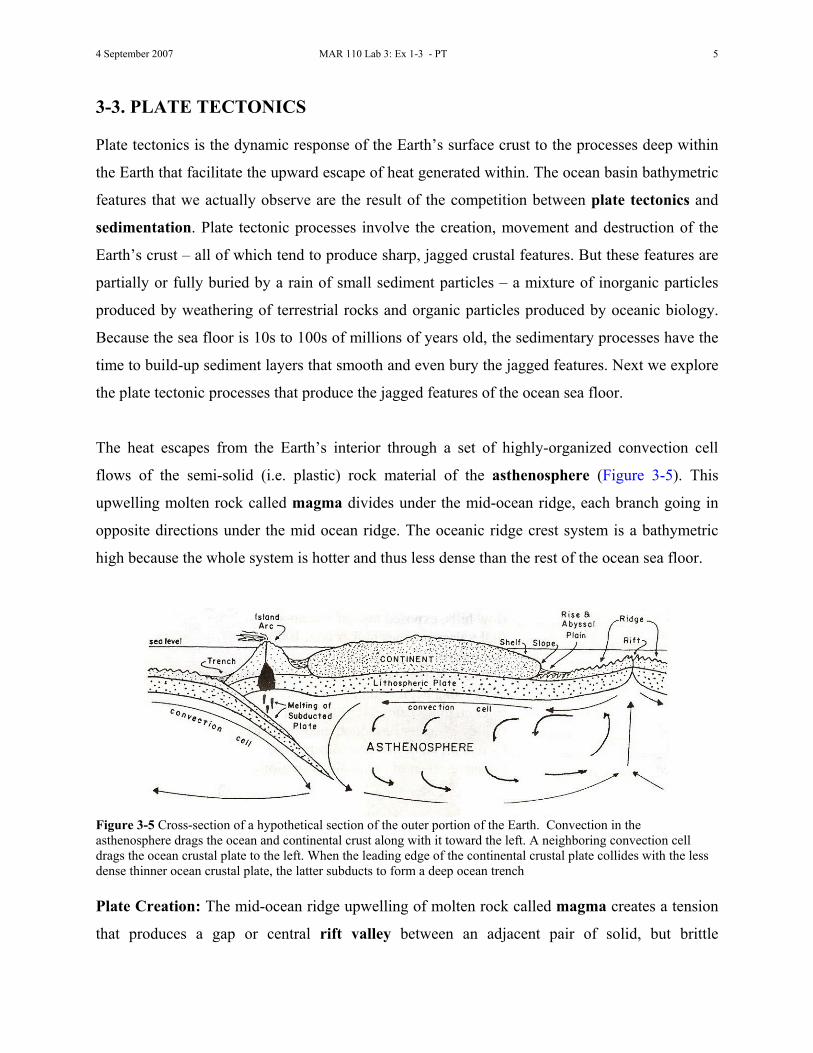
The heat escapes from the Earth’s interior through a set of highly-organized convection cell
flows of the semi-solid (i.e. plastic) rock material of the asthenosphere (Figure 3-5). This
upwelling molten rock called magma divides under the mid-ocean ridge, each branch going in
opposite directions under the mid ocean ridge. The oceanic ridge crest system is a bathymetric
high because the whole system is hotter and thus less dense than the rest of the ocean sea floor.
Figure 3-5 Cross-section of a hypothetical section of the outer portion of the Earth. Convection in the asthenosphere drags the ocean and continental crust along with it toward the left. A neighboring convection cell drags the ocean crustal plate to the left. When the leading edge of the continental crustal plate collides with the less dense thinner ocean crustal plate, the latter subducts to form a deep ocean trench Plate Creation: The mid-ocean ridge upwelling of molten rock called magma creates a tension
that produces a gap or central rift valley between an adjacent pair of solid, but brittle
4 September 2007 MAR 110 Lab 3: Ex 1-3 - PT 6
lithospheric plates. Magma upwells into the rift valley (Figure 3-5), solidifies rapidly as it hits
the cold water, adding this new rock called basalt to the edges of both lithospheric plates. Thus
this pair of lithospheric plates diverge as they move away in opposite directions from the rift
valley and mid-ocean ridge zone of plate divergence.
Plate Movement and Evolution: On both sides of the mid-ocean ridge, the deeper
asthenospheric rock, which is moving horizontally as part of the convection cell, drags the
lithospheric plates above it along (see Figure 3-5). The geometry of plates moving away (or
diverging) from a mid-ocean ridge over the spherical Earth’s surface, causes the mid-ocean
ridge to be segmented by pairs of transform faults (see Figure 3-3). Earthquakes are formed
when the plates on either side of the transform fault move relative to each other.
With time the asthenospheric and lithospheric rock above it move horizontally, they cool and
become denser, and thus sink deeper into the Earth’s interior (Figure 3-5). With time the moving
ocean crust gradually accumulates a thick sediment layer that may obscure the mountainous
features of its youth. This process explains the gradual change from rugged oceanic ridge crest to
abyssal hills to the abyssal plains; only interrupted by isolated islands, island chains, undersea
seamounts, and seamount chains.
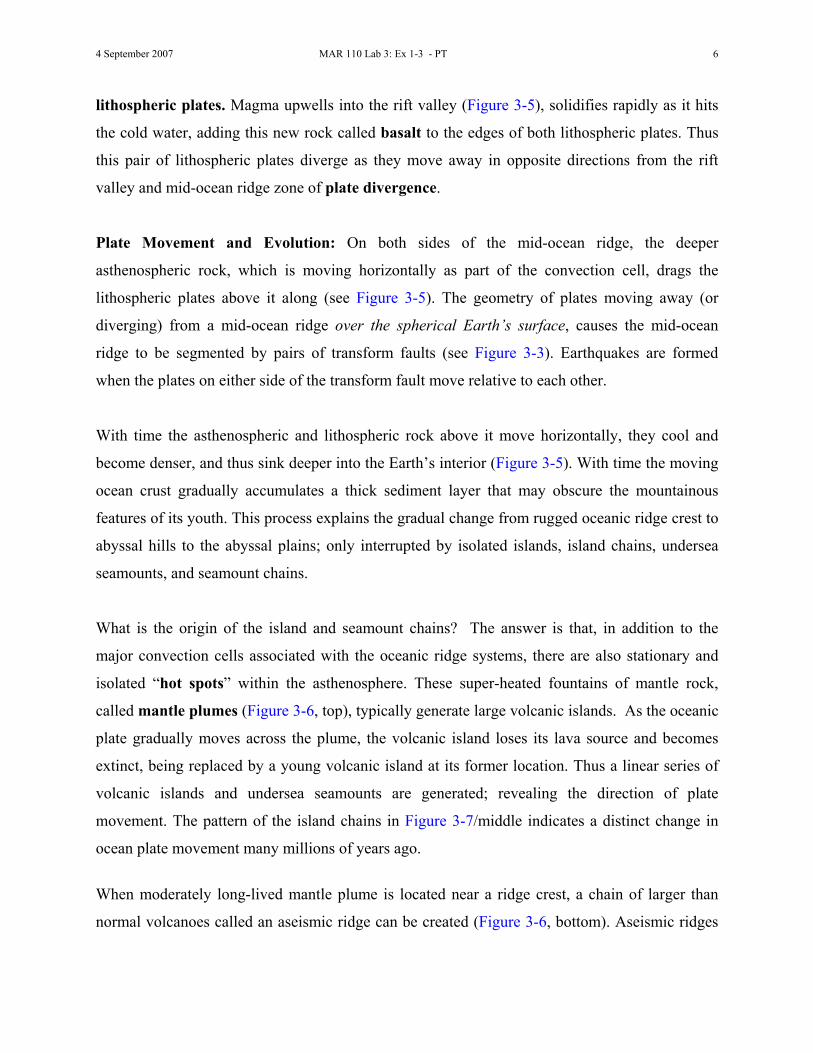
What is the origin of the island and seamount chains? The answer is that, in addition to the
major convection cells associated with the oceanic ridge systems, there are also stationary and
isolated “hot spots” within the asthenosphere. These super-heated fountains of mantle rock,
called mantle plumes (Figure 3-6, top), typically generate large volcanic islands. As the oceanic
plate gradually moves across the plume, the volcanic island loses its lava source and becomes
extinct, being replaced by a young volcanic island at its former location. Thus a linear series of
volcanic islands and undersea seamounts are generated; revealing the direction of plate
movement. The pattern of the island chains in Figure 3-7/middle indicates a distinct change in
ocean plate movement many millions of years ago.
When moderately long-lived mantle plume is located near a ridge crest, a chain of larger than
normal volcanoes called an aseismic ridge can be created (Figure 3-6, bottom). Aseismic ridges
4 September 2007 MAR 110 Lab 3: Ex 1-3 - PT 7
tend to be aligned perpendicularly to the ridge crest and parallel to transform faults and fracture
zones. Aseismic ridges can also indicate if there has been a change in direction of plate motion.
Occasionally short-lived or weak mantle plumes is located near a ridge crest generate undersea
volcano (or seamount) which then will ride on the moving oceanic crustal plate away form the
oceanic ridge.
Plate Destruction: At some point the laterally moving asthenospheric material converges with
that of a neighboring convection cell (left in Figure 3-5). The associated lithospheric plates
collide in what is called a plate convergence zone and generally one of the plates slides below
the other. However, there are there are distinctly different examples of how the different plates
that make up the Earth’s crust are destroyed.
Figure 3-6. (top) Cross section showing how a mantle plume can produce a sequence of volcanic islands and undersea seamounts. (middle) Map view of the volcanic island chain and the indicated change of plate movement direction. (bottom) Map view of aseismic ridge of volcanic islands and seamounts produced by a mantle plume near a mid-ocean ridge.
4 September 2007 MAR 110 Lab 3: Ex 1-3 - PT 8
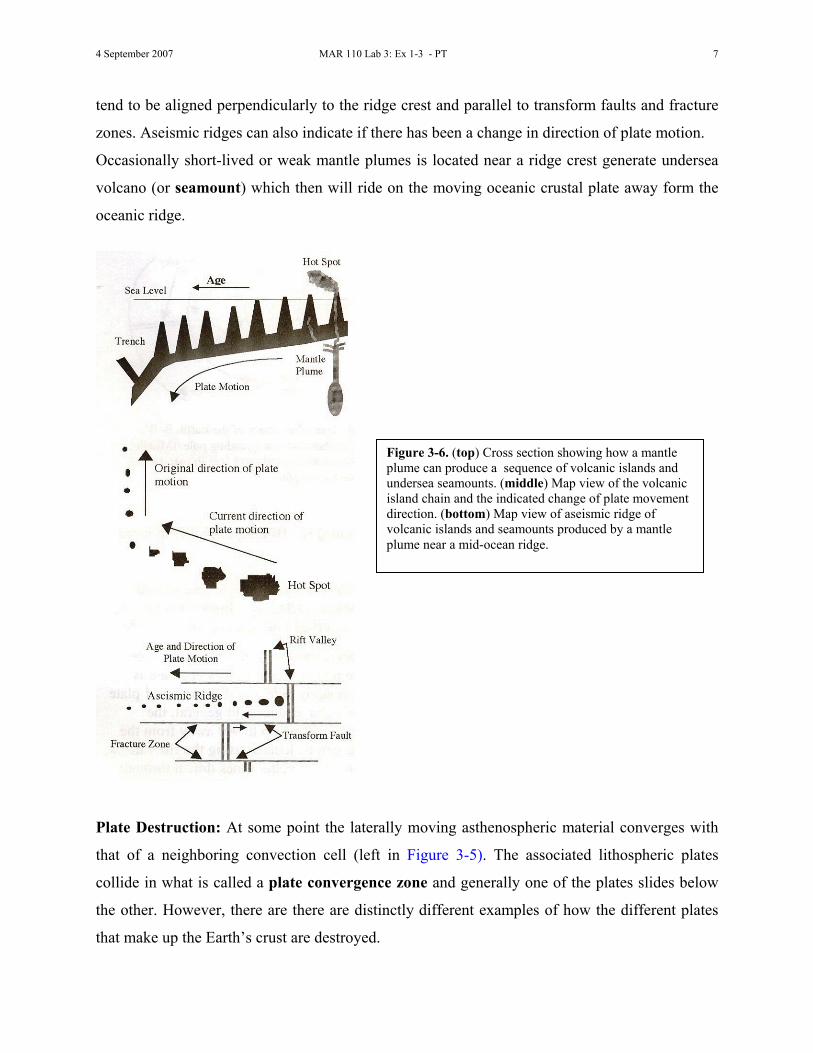
Plate Configuration: The Earth’s crustal lithospheric layer is composed of 12 major plates as
illustrated in the Figure 3-7. These evolving oceanic plates collide in a variety of ways. Where
plates converge, the sea floor is greatly depressed and forms a trench (Figure 3-5), where one
plate descends below or subducts beneath the other (e.g., Pacific and North American plate
boundary along the Aleutian Trench). Such areas are called subduction zones. When the
collisions occur between relatively thin and denser oceanic plate and the thicker less dense
continental crust the oceanic plate subducts (e.g., Nazca and South American plate boundary
along the Peru-Chile Trench).
Figure 3-7 Lithoshperic plates of the Earth. If the overriding plate in the area of subduction zone is oceanic crust (e.g., Eurasian and
Australian plate boundary along the Java Trench), then a chain of islands, called an island arc, is
formed parallel the trench. This happens because as the subducting plate plunges deeper into the
asthenosphere, it melts to become magma. Because hot magma is less dense than surrounding
rocks, it migrates upward, melting its way through the overlying lithosphere to form volcanoes of
the island arc chain.
4 September 2007 MAR 110 Lab 3: Ex 1-3 - PT 9
If the overriding plate in the area of subduction is a continent, a volcanic mountain chain
paralleling the trench (e.g., Peru-Chile Trench) forms on the continent. Subduction can
eventually eliminate an entire ocean basin causing continents to collide, forming large, structural,
non-volcanic mountain chains. The collision of India and Asia formed the Himalayas and
eliminated the ocean basin between them.
Summary
Oceanic lithospheric plates are:
1. Created at ocean ridges, which consist of a central rift valley that is
paralleled by a pair of ridge crest mountain ranges; 2. Dragged away from oceanic ridges (parallel to the transform faults
in the ridge) by underlying convection-driven flow of a semi-molten asthenosphere;
3. Are youngest at the oceanic ridge and progressively older away
from the ridge.
4. Covered by thicker layers of sediment near the continents
5. Penetrated by mantle hot spot plumes that create chains of volcanic islands/seamounts that can indicate the directions of past and present plate movement;
6. Moving toward deep ocean trenches;
7. Are destroyed in ocean trenches, with either an island arc or
volcanic mountain chain forming in the overriding plate.
4 September 2007 MAR 110 Lab 3: Ex 1-3 - PT 10
3-4. ESTIMATING RATES OF OCEAN BASIN EXPANSION It is possible to determine the average rate at which the sea floor is spreading outward from the
rift valley, if the age of sea floor volcanic rocks at different distances from the spreading center is
known. Average rate of sea floor spreading (ASFSR) is equal to the distance the rocks have
traveled (one way or the other) from the rift valley (Distance) divided by the time (Time)
according to the relation:
Average Sea Floor Spreading Rate = ASFSR = Distance / Time
The ASFSR that we are computing here applies to one side of the oceanic ridge. If the ocean
basin is symmetrical about the mid-ocean ridge, like the Atlantic Ocean, then the ASFSR will be
the same on either side of the ridge. Thus Average Ocean Basin rate of Expansion Rate
(AOBSR) will be equal to twice the ASFSR according to:
Average Ocean Basin Expansion Rate = AOBSR = 2 x (Distance/Time)
Example 1:
Volcanic sea floor rocks, which are located 400 km west of the mid-ocean ridge rift valley are
determined (by magnetic anomalies) to be 20 million years old.
What is the Average Sea Floor Spreading Rate (ASFSR) over the last 20 million years?
ASFSR = Distance / Time = 400 km / 20,000,000 yr = 400 km/20 x 106 yr = 20 x 10-6 km/yr = 2 x 10⁻⁵ km/yr = 2 x 10⁻⁵ km/yr x 103 m/km x 102 = 2 cm/yr
What is the Average Ocean Basin Expansion Rate (AOBSR) average yearly ocean basin
expansion rate over the last 20 million years for this ocean basin
AOBSR = 2 x (Distance / Time)
= 2 x 2 cm/yr = 4 cm/yr
These spreading rates estimated above may be deceptive however, because spreading rates can
change with time. For example, the sea floor may have spread rapidly to a distance of 400km
4 September 2007 MAR 110 Lab 3: Ex 1-3 - PT 11
during the first 10 million years and then ceased to spread at all for the next 10 million years.
Our 20 million year average rate obscure such shorter-term variations in the spreading rates. The
way to determine the more detailed history of ocean basin spreading rates, it is necessary to work
with shorter segments of the sea floor (with age ranges less than 20 million years) ..as we will do
next.
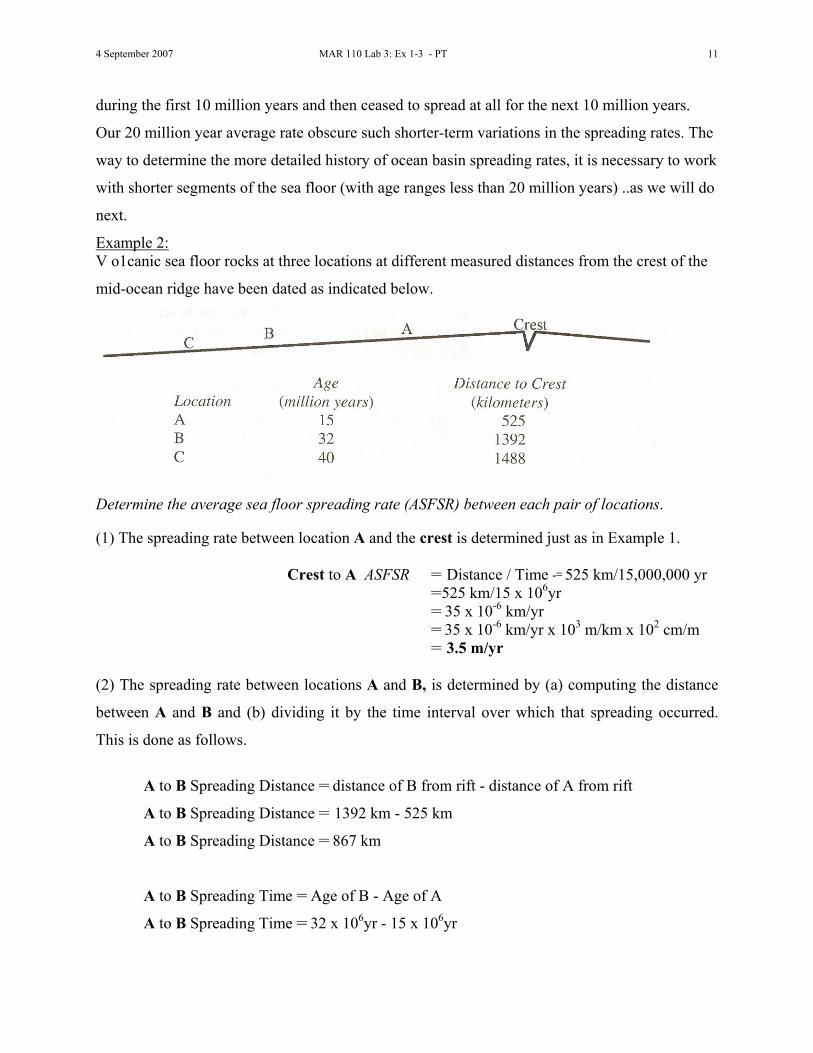
Example 2: V o1canic sea floor rocks at three locations at different measured distances from the crest of the
mid-ocean ridge have been dated as indicated below.
Determine the average sea floor spreading rate (ASFSR) between each pair of locations. (1) The spreading rate between location A and the crest is determined just as in Example 1.
Crest to A ASFSR = Distance / Time -= 525 km/15,000,000 yr =525 km/15 x 106yr = 35 x 10-6 km/yr = 35 x 10-6 km/yr x 103 m/km x 102 cm/m = 3.5 m/yr
(2) The spreading rate between locations A and B, is determined by (a) computing the distance
between A and B and (b) dividing it by the time interval over which that spreading occurred.
This is done as follows.
A to B Spreading Distance = distance of B from rift - distance of A from rift
A to B Spreading Distance = 1392 km - 525 km
A to B Spreading Distance = 867 km
A to B Spreading Time = Age of B - Age of A
A to B Spreading Time = 32 x 106yr - 15 x 106yr
4 September 2007 MAR 110 Lab 3: Ex 1-3 - PT 12
A to B Spreading Time = 17 x 106yr
Crest to A ASFSR = 867 km/17 x 106yr
= 51 x10-6 km/yr = 51 x10-6 km/yr x 103 m/yr x 102 m/km = 5.1 cm/yr
(3) Similarly, the spreading rate between locations B and C is 1.2 cm/yr. (4) Thus, the average sea floor spreading rate in this hypothetical ocean basin varied between
1.2 and 5.1 cm/yr.
4 September 2007 MAR 110 Lab 3: Ex 1-3 - PT 13
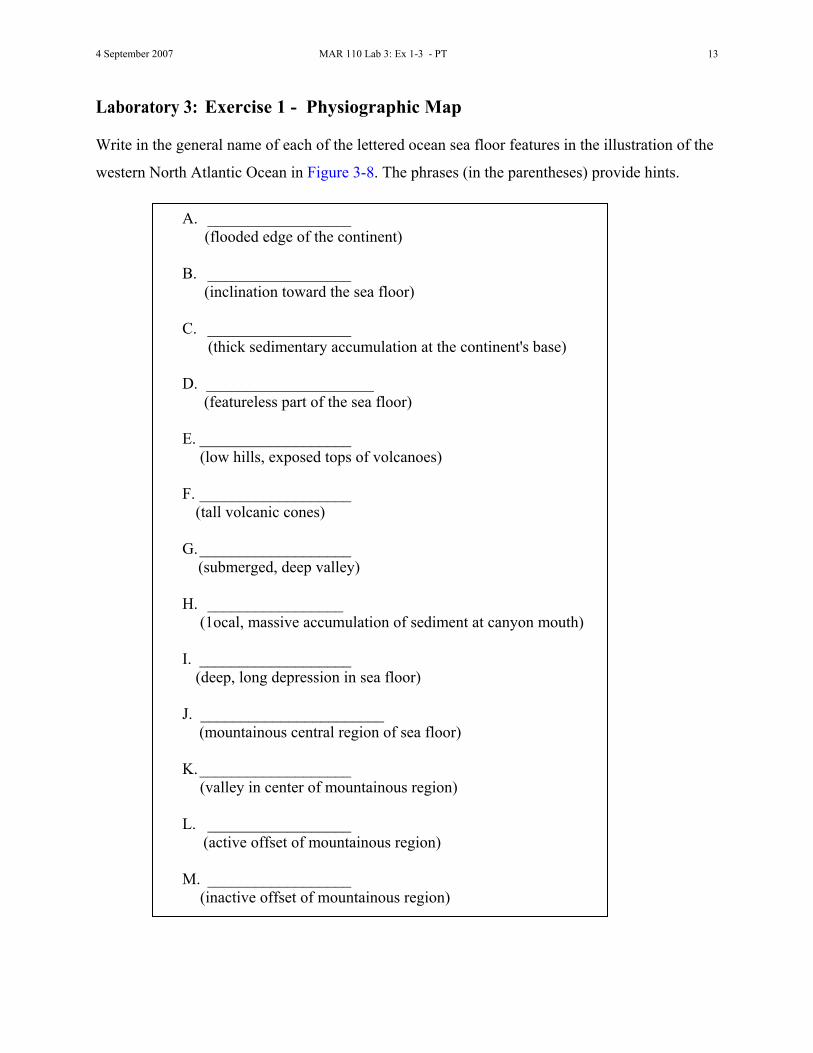
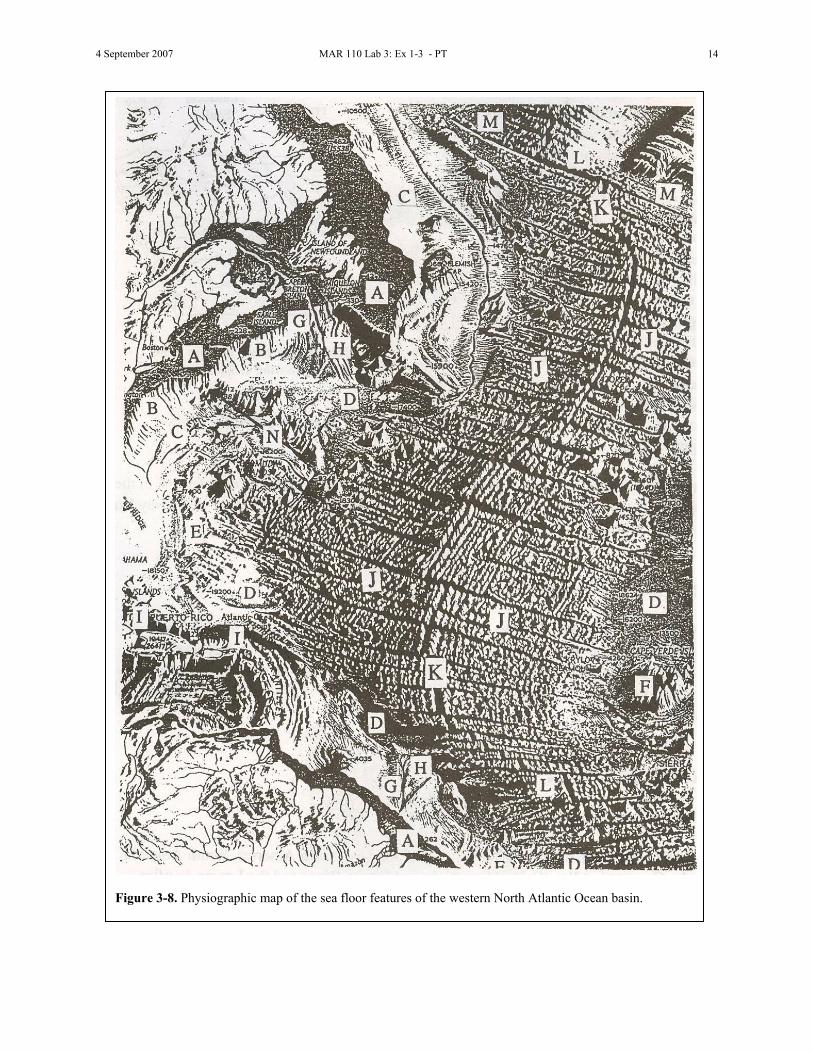
Laboratory 3: Exercise 1 - Physiographic Map Write in the general name of each of the lettered ocean sea floor features in the illustration of the
western North Atlantic Ocean in Figure 3-8. The phrases (in the parentheses) provide hints.
A. __________________ (flooded edge of the continent) B. __________________ (inclination toward the sea floor) C. __________________ (thick sedimentary accumulation at the continent's base) D. _____________________ (featureless part of the sea floor) E. ___________________ (low hills, exposed tops of volcanoes) F. ___________________ (tall volcanic cones) G.___________________ (submerged, deep valley) H. _________________ (1ocal, massive accumulation of sediment at canyon mouth) I. ___________________ (deep, long depression in sea floor) J. _______________________ (mountainous central region of sea floor) K.___________________ (valley in center of mountainous region) L. __________________ (active offset of mountainous region) M. __________________ (inactive offset of mountainous region)
4 September 2007 MAR 110 Lab 3: Ex 1-3 - PT 14
Figure 3-8. Physiographic map of the sea floor features of the western North Atlantic Ocean basin.
4 September 2007 MAR 110 Lab 3: Ex 1-3 - PT 15
Laboratory 3: Exercise 2 - Plate Tectonics 1. Physiographic Map of the Western North Atlantic Ocean Basin
a. On the Figure 3-8 map, draw lines that indicate the edges of the plates that are relevant to this part of the ocean. (Reference to Figure 3-7 may be helpful).
b. Place arrows on the map indicating the direction in which these plates are moving.
c. For the Figure 3-8 portion of the North Atlantic, where would the oldest part of the sea
floor be located? d. Why is the ridge in the middle of the ocean in the North Atlantic (see Figure 3-7)?
e. Where would the following be expected to occur in this ocean basin?
f. The linear series of seamounts at location N in Figure 3-8 was produced as the plate moved slowly across a mantle “hot spot” plume. Knowing what you know about the western Atlantic Ocean oceanic plate movement direction: Where would the oldest volcano in the series be located? Why?
g. Note the deep ocean trench just to the west of the Antilles and east of Puerto Rico. Describe the plate motion in this area, including which plate is beings subducted and evidence supporting your answer.
4 September 2007 MAR 110 Lab 3: Ex 1-3 - PT 16
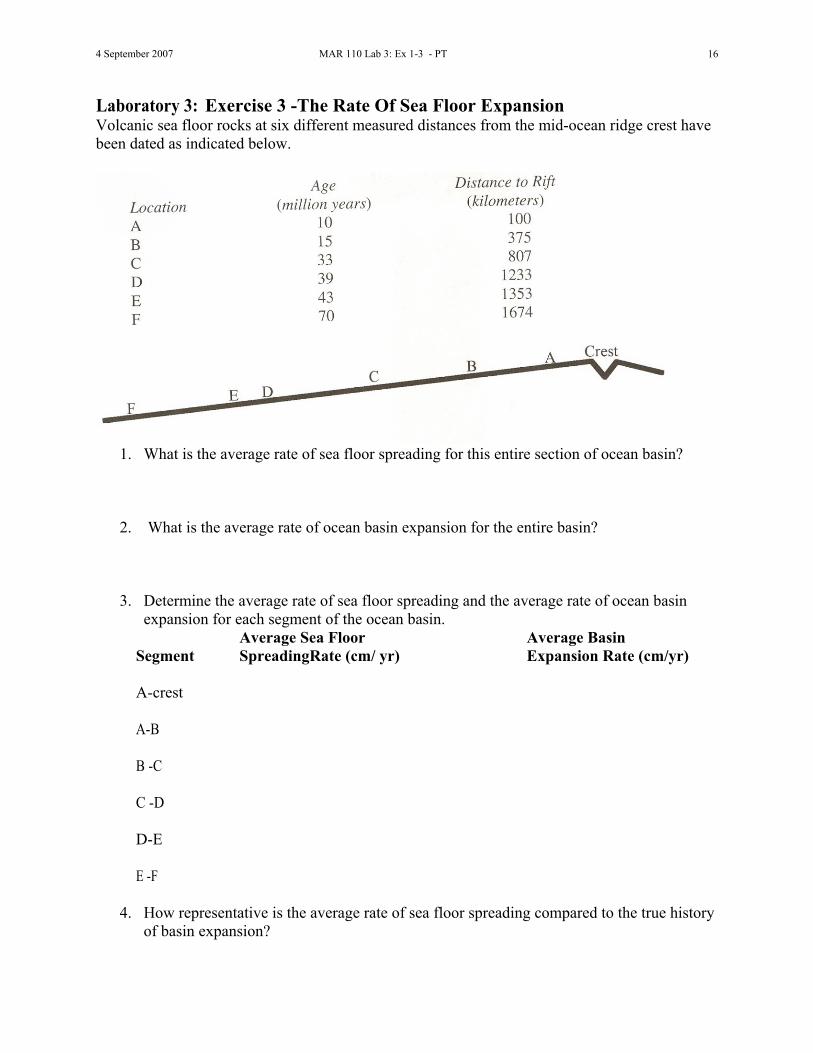
Laboratory 3: Exercise 3 -The Rate Of Sea Floor Expansion Volcanic sea floor rocks at six different measured distances from the mid-ocean ridge crest have been dated as indicated below.
1. What is the average rate of sea floor spreading for this entire section of ocean basin?
2. What is the average rate of ocean basin expansion for the entire basin?
3. Determine the average rate of sea floor spreading and the average rate of ocean basin expansion for each segment of the ocean basin.
Average Sea Floor Average Basin Segment SpreadingRate (cm/ yr) Expansion Rate (cm/yr) A-crest A-B B -C C -D D-E E -F
4. How representative is the average rate of sea floor spreading compared to the true history