EUROPEAN PARLIAMENT Workshop on Assessment of Potential and Promotion of New Generation of Renewable Technologies 22 March 2011 OCEAN ENERGIES Some Basic Ideas and Facts António F. O. Falcão Instituto Superior Técnico Lisbon, Portugal [email protected]
Transcript
EUROPEAN PARLIAMENT
Workshop on Assessment of Potential and Promotionof New Generation of Renewable Technologies
The wind velocity profile extends over several km.
A wind farm explores a tiny sublayer
20m
WAVES
Most of the wave energy flux is concentrated near the surface
A wave farm can absorb a large part of the wave energy flux.
Like wind energy, the extensive exploitation of waveenergy will require large farms of offshore converters, rated about 0.2 to 5 MW each
Waves are a more concentrated form of energy thanwind.
Tidal stream velocity (up to about 4m/s) islower than wind speed.
But water density is 800 larger than airdensity.
The energy density is muchlarger in tidal streams.
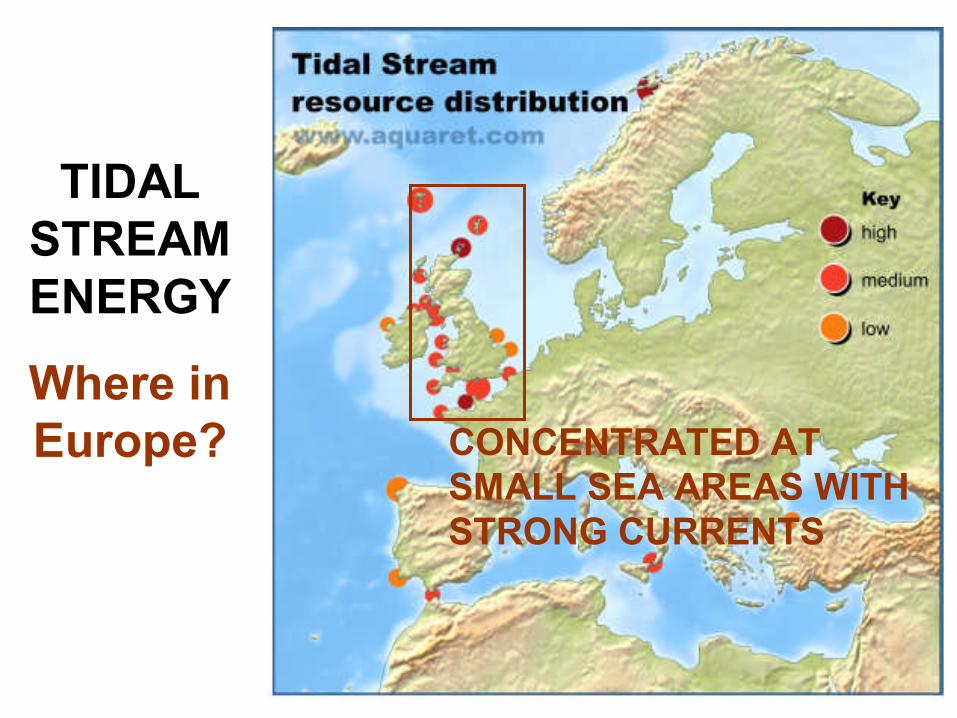
TIDAL STREAM ENERGY VERSUS WIND ENERGY
PROTOTYPE TESTING UNDER REAL SEA CONDITIONS IS ESSENTIAL
Test sites for wave and tidal energy systems in Europe
Source: EQUIMAR – Draft report on the state of ocean energy in Europe: technologies, test sites, and joint projects, 2011
Theoretical Resource - A top level statement of the energycontained in the entire resource
Technical Resource – Part that can be exploited based onexisting technologies
Accessible resource – What can be exploited afterconsideration of external constraints (impractical areas, competing uses, environmentally protected areas, …)
Economic resource – What can becommercially atractive depending on marketconditions
THE ENERGY RESOURE (WAVES, TIDAL STREAMS, …)
ASSESSMENTS WILL DEPEND
STRONGLY ON SCENARIOS
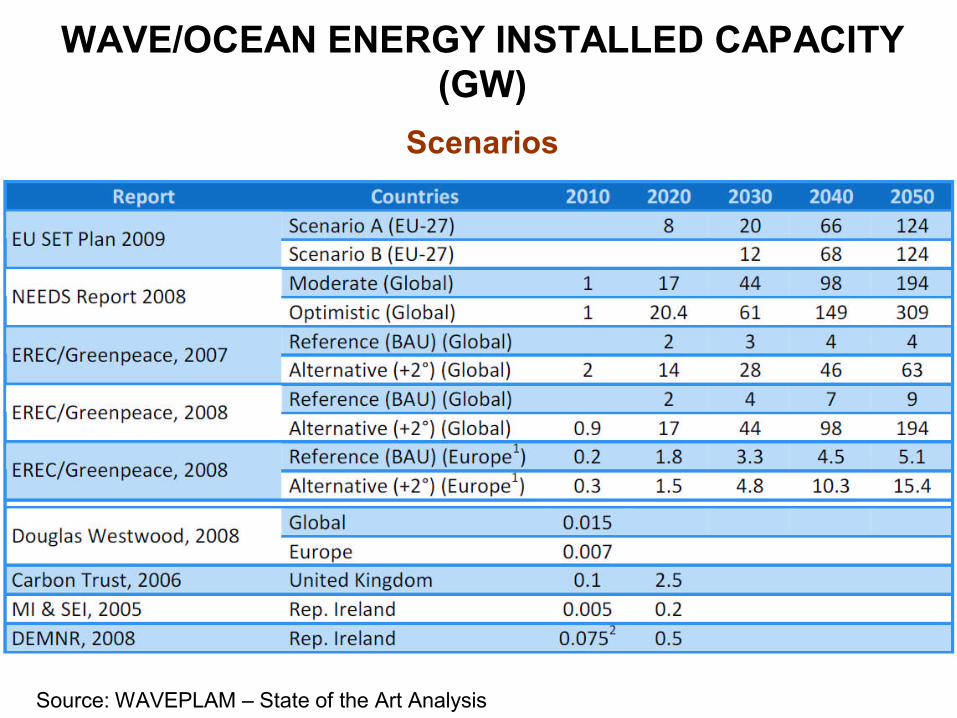
WAVE/OCEAN ENERGY INSTALLED CAPACITY (GW)
Scenarios
Source: WAVEPLAM – State of the Art Analysis
Portugal: how much electrical power fromthe waves?
500km
Estimates : 2.5 – 5 GW installed power fromwaves,mostly offshore
From onshore wind ~ 6-8 GW
(presently ~ 4 GW)
Cost of energy (2006)Capital costs of first prototypesand first production models
Source: Carbon Trust, 2006
The technology is more difficult than wind.
Except for a few shoreline plants (Pico 1999, Islay 2000), there is little or no experience of maintenance, reliability and survival(under extreme conditions) in real open-ocean, for more than a fewmonths.
Scarce reliable information on costs and economics.
Wave Energy: Present Situation(partly applicable to Tidal Streams)
For most technologies, the capacity factor: annual-averaged powerdivided by rated power, is similar to wind (~0.3) (larger for tidal streams).
At the present stage of technology development, the unit cost of electricityfrom waves ranges between wind and large photovoltaics.
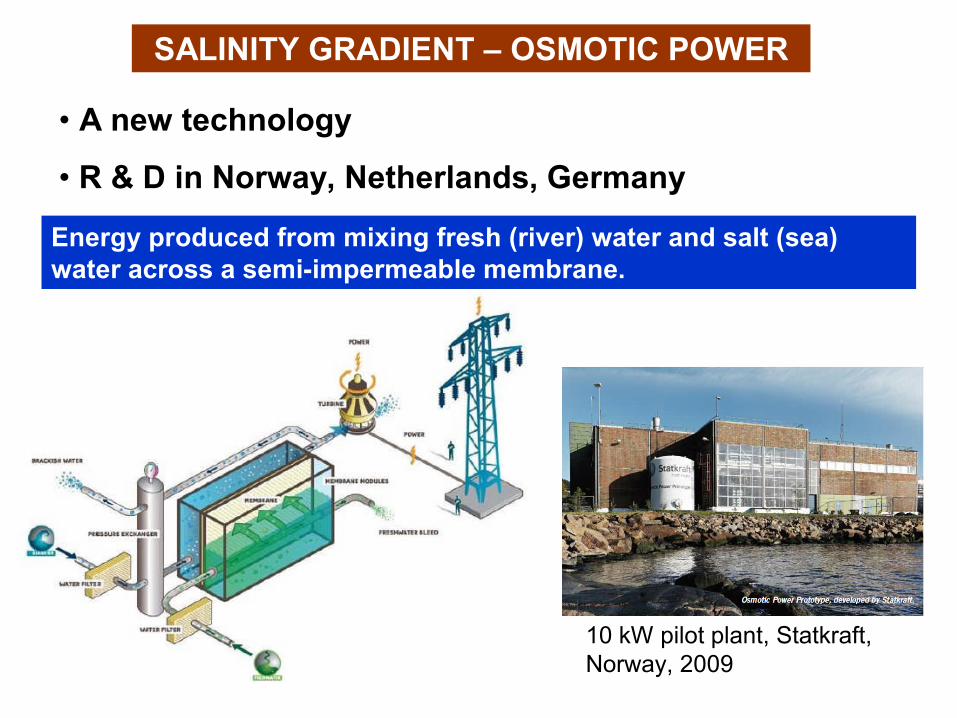
10 kW pilot plant, Statkraft, Norway, 2009
SALINITY GRADIENT – OSMOTIC POWER
• A new technology
• R & D in Norway, Netherlands, Germany
Energy produced from mixing fresh (river) water and salt (sea) water across a semi-impermeable membrane.
Environmental impacts of ocean energy
• Dependent on– Site natural characteristics– Technology specificity– Project phase (installation, operation and
• Magnitude / severity is uncertain due to early stage oftechnology development.
Types of environmental impactsReceptors Stressors Effects and / or ecological issues
•Physical environment
•Pelagic (water column) habitat
•Benthic (sea floor) habitat
•Fish and fisheries
•Marine birds
•Marine mammals
•Humans (users)
•Physical presence of the devices
•Chemical effects
•Lighting
•Acoustics
•Electromagnetic fields
•Cumulative effects
Alteration of currents and waves due to the energy extraction and or physical presence of the devices
Alteration of substrates and sediment transport and deposition which may alter coastline processes and morphology
Benthic habitat disturbance or destruction Water contamination due to e.g. effluent or
waste discharge, oil leaks Collision, strike, entrapment and
entanglement of marine invertebrates, fish, mammals and birds with the equipment (mainly with tidal stream rotor blades)
Interference with animal movements and migration
Displacement of marine species Noise disturbance Effects of electromagnetic on fish (sharks,
rays and skates) orientation and reproduction
Environmental and economic cost impacts duringocean projects life cycle
• Several Life Cycle Assessment procedures have beenapplied for wave and tidal energy projects (e.g.Pelamis, SeaGen, Wave Dragon)
• Life Cycle Assessment: permits assessment of the environmental impacts of each life stage (e.g. raw material extraction, transportation, maintenance process, final disposal, recycling) in terms of CO2 emissions in the device manufacturing
Goaldefinitionand scope
Inventoryanalysis
Impactassessment
LCA Framework
Detailed product life cycle for Pelamis
Some comparative results on LCA regarding energyprojects life cycle
Previous results from the few LCA studies on wave and tidal devices show good environmental performance relative to conventional power plants or renewables such as solar PV or biomass
The technologies that have the lowest life cycle Green House Gas emissions to date are nuclear, large hydro and wind, followed by wave and tidal energy
Tidal energy(SeaGen)
Wave energy(Pelamis)
Some sources of information(most are available at internet)
• Future Marine Energy: Results of the Marine Energy Challenge. Carbon Trust Report, UK, 2006.• Marine Renewable Energy. State of the Industry Report. BWEA, UK, 2009.• The Benefits of Marine Technologies within a Diversified Renewables Mix. BWEA, UK, 2009.• Oceans of energy European Ocean Energy Roadmap 2010-2050. European Ocean Energy Association, 2009.• Marine Energy Roadmap. Forum for Renewable Energy Development in Scotland (FREDS), 2009.• Annual Reports (2008-), IEA-Implementing Agreement on Ocean Energy Systems.• Raventós, A., Simas, T. et al. Life Cycle Assessment for Marine Renewables. Equimar Project, European Commission, 2010. http://www.equimar.org/equimar-project-deliverables.html• Falcão, A.F.O. Wave energy utilization: A review of the technologies. Renewable and Sustainable Energy Reviews, vol. 14, p. 899-918, 2010.• Braein, S., Skramsto, O. et al. Osmotic power. From prototype to industry – what will it take? 3rd International Conference on Ocean Energy, Bilbao, 2010.