35
Intergovernmental Oceanographic Commission Manuals and Guides No. 32 Oceanographic Survey Techniques and Living Resources Assessment Methods UNESCO 1996
Intergovernmental Oceanographic Commission
Manuals and Guides No. 32
Oceanographic Survey Techniques andLiving Resources Assessment Methods
UNESCO 1996

Intergovernmental Oceanographic Commission
Manuals and Guides No. 32
Oceanographic Survey Techniques andLiving Resources Assessment Methods
Philip Tortell and Larry Awosika
UNESCO 1996
The designations employed and the presentation o fthematerial in this publication do not imply the expression ofany opinion whatsoever on the part of the Secretariat sofUNESCO and IOC concerning the legal status of an ycountry, territory, or its authorities, or concerning th edelimitations of the frontiers of any country or territory.
For bibliographic purposes this documentshould be cited as follows :
Oceanographic Survey Techniques andLiving Resources Assessment MethodsIOC Manuals and Guides No. 32. UNESCO 1996(English)
Published in 1996by the United Nations Educational,Scientific and Cultural Organization,7, place de Fontenoy, 75700 Paris
Printed in UNESCO's Workshops
© UNESCO 1996Printed in France

TABLE OF CONTENTS
PART 1 : INTRODUCTION 5
1.1 THE EASTERN AFRICAN ACTION PLAN 5
1.2 INTEGRATED COASTAL AREA MANAGEMENT 5
1.3 PRINCIPLES AND DEFINITIONS 6
1.4 ACKNOWLEDGEMENTS 6
PART 2 : OCEANOGRAPHIC SURVEY TECHNIQUES 7
2.1 NAVIGATIONAL SYSTEMS 72.1.1 Shore based radio navigation system 72.1.2 Transit satellite navigation system 72.1.3 Global Positioning System (GPS) 72.1.4 Speed logging system 72.1.5 Integrated navigation systems 8
2.2 MARINE PROCESSES 82.2.1 Tides 82.2.2 Waves 92.2.3 Wave reflection, refraction and diffraction 102.2.4 Currents 112.2.5 Oceanic circulation 11
2.3 OCEANOGRAPHIC TECHNIQUES 122.3.1 Bathymetry 122.3.2 Measurement of tide (water level variation) 132.3.3 Measurement of ocean surface waves 132.3.4 Measurement of currents 142.3.5 Drift measurements 142.3.6 Water sampling devices 142.3.7 Measurement of temperature 142.3.8 Measurement of salinity 152.3.9 Measurement of sound velocity 152.3.10 Measurement of density 152.3.11 Measurement of the content of suspended materials 152.3.12 Measurement of dissolved substances 15
2.4 COASTAL PROCESSES SURVEY 162.4.1 Introduction 162.4.2 Causes of beach erosion 162.4.3 Beach erosion monitoring 172.4.4 Beach profiling 172.4.5 Profile of the underwater beach 192.4.6 Littoral environment observations 20
REFERENCES 20
1

PART 3 : LIVING RESOURCES ASSESSMENT METHODS 22
3.1 ECOLOGICAL SURVEY 223.1.1 Macro scale survey 223.1.2 Rapid rural appraisal 223.1.3 Remote sensing 233.1.4 “On the ground” survey 233.1.5 Some common sampling approaches 24
3.2 MONITORING 283.2.1 Objectives and principles of monitoring 283.2.2 Indicator species 29
3.3 INFORMATION MANAGEMENT 293.3.1 Simple tabulation 293.3.2 Matrix 293.3.3 Graphics 313.3.4 Databases 313.3.5 Maps and plans 313.3.6 Geographic Information Systems (GIS) 33
3.4 WORKED EXAMPLE 333.4.1 The existing situation 333.4.2 Proposed development 34
REFERENCES 34

5
PART 1 : INTRODUCTION______________________________________________________
1.1 THE EASTERN AFRICAN ACTION 1.2 INTEGRATED COASTAL AREAPLAN MANAGEMENT
More than 25% of the population of the Eastern It is the task of administrators and managers toAfrican Region today lives along its coastal areas seek a wise balance between the many conflictingor not far inland. Most seek employment around demands being made on the coastal environment,the coast as well as unrestricted access to and from ensuring that its limits of tolerance and its capacitythe foreshore, the freedom of navigation on any for sustainability are not exceeded. In order to dowaters, the right to anchor and seek shelter, the this successfully they need a comprehensiveright to fish and gather shellfish and other living management approach giving them a holistic viewresources for their livelihood or sustenance and the of the resources, the demands, and the variousright to seek their leisure and recreation. In direct and indirect physical interrelationships.addition, coastal areas provide the landfall or take Integrated coastal area management is anoff point for imports and exports respectively, they approach that allows such a comprehensive andare often the focus for industrial development and, holistic view to be taken of the multiple, oftenincreasingly, they are promoted as the sites for conflicting, demands that are made on coastaltourism developments which have become the resources. It provides decision-makers, plannerschief foreign currency earner in many of these and managers with a practical methodology forcountries. resolving conflicts and assigning priorities and for
These multiple demands on coastal resources balancing protection and development. require the best management strategies to ensure The Regional Workshop on the Development ofsustainability. Coastal Area Management Plans, Surveying
The Governments of the Eastern African Techiniques and Marine Resources Assessment,Region (Somalia, Kenya, Tanzania, Mozambique, brought together a number of participants fromComoros, Madagascar, Mauritius, Seychelles and throughout the Eastern African Region withFrance (Reunion)), recognizing the importance of planning, management and related responsibilitiestheir marine and coastal areas and, at the same for coastal and marine resources. The participationtime, the environmental threats that they face, of the Intergovernmental Oceanographicadopted the Action Plan for the Protection, Commission (IOC) of UNESCO comprisedManagement and Development of the Marine and sessions on oceanographic and ecological surveyCoastal Environment of the Eastern African techniques for coastal area planning andRegion. Through the Plan they seek regional management. solutions to region-wide problems. This manual arises from those sessions and it is
The governments are assisted with the being published in the belief that the methodologiesimplementation of the Action Plan by a number of and techniques provided to the Workshopmultilateral aid agencies. These include UN, participants, are of much broader interest and canUNDP, ECA, FAO, UNESCO, IOC, WHO, be applied successfully beyond the Eastern AfricanWMO, IMO, UNIDO, IAEA, IUCN, EU, and region in order to achieve a wiser use of coastalUNEP. resources, to reduce wastage of non-renewable
The protection and management of the marine resources, to avoid conflicts and to ensureand coastal areas in the Eastern African Region sustainability for future generations.(EAF/5) is a key component of the Action Plan and The section on oceanographic survey techniquesit was under this component that FAO/PAP- is the work of Dr Larry Awosika of the NigerianRAC/IUCN/IOC/UNEP Regional Workshop on the Institute of Oceanography and Marine Research,Development of Coastal Area Management Plans, Lagos, Nigeria, while the section on livingSurveying Techiniques and Marine Resources resources assessment methods was contributed byAssessment, was held in Mombasa, Kenya, in Dr Philip Tortell of Environmental Management1993.

6
Limited, Wellington, New Zealand. Dr Tortell was takes a comprehensive view and does not sacrificealso responsible for overall editing of the manual unknowingly some resources for the sake of others;and preparing it for publication. if such sacrifices have to be made, they are not
1.3 PRINCIPLES AND DEFINITIONS
Survey, monitoring, assessment and similarmeasurements are only a means to an end. Theyachieve little in themselves except, maybe add aquantum of knowledge and some understanding.What is even more important, is the use of theresults of survey and monitoring - how and when touse the information and knowledge obtainedthrough survey and monitoring.
Since survey and monitoring can consume agreat deal of time, staff and funds, it is essential toestablish clear objectives before survey and focuson those objectives throughout. Survey,monitoring, assessments and measurement can turninto an expensive “black hole” into which 1.4 ACKNOWLEDGEMENTSresources are poured at ever increasing amounts.It is often the view that more data are needed and The authors first presented this material tothat there is not enough information - in effect, participants at the Regional Workshop on thethere are never “enough” data and the important Development of Coastal Area Management Plans,thing is to make the judgement as to how much Surveying Techniques and Marine Resourcesdata and information are “essential” in order to Assessment. The excellent discussions andmeet the objectives. questioning generated by participants during the
Some Definitions “Coastal area” is the areaor zone which spans the interface between land andwater; it includes both land and water and itextends inland as far as the expected influences onthat interface; it extends seaward as far as one canmeaningfully manage.
“Management” means planned, rational andwise use of land and water and all their resourcesand values in a sustainable, long-term manner so asto obtain the maximum benefits with the minimumof impacts which are kept within tolerable limits.
“Integrated” is a management approach which
made in ignorance, but only after carefulconsideration and after clear objectives have beenset in order of priority, and after careful assessmentof the comparative values and impacts.
“Integrated coastal area management” is a shiftfrom the reactionary, problem-oriented approach toa planned, pre-emptive, management-basedapproach; it is a comprehensive and holisticapproach which addresses the multiple demands onboth terrestrial and marine resources; it providesthe conceptual framework within which thecumulative, multisectoral environmentalconsequences of development can be managed toremain within assessed, pre-determined, tolerablelimits.
Workshop have helped us to focus better andimprove our material for this manual.
We are grateful to the Secretariat of theIntergovernmental Oceanographic Commission(IOC) of UNESCO for encouraging us to presentour material for publication and for their supportduring the preparation of this manual.
A number of the techniques and methodologiesdescribed in the manual were taken from a varietyof other works. We wish to record ourappreciation to the authors and publishers of theseother works which are listed in the references at theend of each section.
7
PART 2 : OCEANOGRAPHIC SURVEY TECHNIQUES_____________________________________________________
2.1 NAVIGATIONAL SYSTEMS
Collection and monitoring of oceanographicdata most often takes place on board researchvessels or other craft. The accuracy of suchinformation depends on the ability of the vessel tolocate its exact position either to repeat previousstations where data collection has already takenplace in the past, or to undertake newinvestigations. To meet this objective, specialnavigational systems have been developed and themore important ones are described below.
Conventional methods can be used to fixpositions rather simply but the level of accuracy isvery low. Radar, compass and sextant angles canbe related to land based known positions orfeatures to give rather rough positions. Such landbased features can be hills, steep headlands, bays,identifiable outstanding buildings or other markedfeatures on existing maps.
2.1.1 Shore based radio navigation system
In coastal areas, shore-based transmitterstations can be used for more accurate positioning.The receiver onboard determines the distancedifference between the vessel and two pairs oftrisponders onshore. An example of this system isthe Decca chain which provides good positioninginformation over distances of a few hundredkilometres. The Omega navigation system, withvery long wavelengths, is another type of shorebased radio navigation system but this type is bestsuited for submarines down to 20m below thesurface.
Trisponder navigation systems are widely usedfor local work in small areas in the open sea.They are usually deployed at three or moresuitable points in the working area. Acousticinterrogator pulses are sent from onboard to theshore stations and these are answered bytrisponders with pulses at different frequencies.The system on the ship computes the distance toall trisponders and the exact position of the vesselcan hence be fixed. Trisponder systems can alsobe used for the positioning of deep-towedsampling or surveying devices and submersibles.
2.1.2 Transit satellite navigation system
Transit satellites circle the earth at an altitudeof 1100km corresponding to a revolution time ofabout 108 minutes. They transmit electromagneticwaves with approximate frequencies of 150mHzand 400mHz. Every two minutes, the satellitesalso transmit accurate time signals and phasedmodulated waves with orbital parameters of theirpath and elevation. From these, the satellite itselfprovides the information necessary for the precisedetermination of its path. The satellite receiver onthe ship decodes this information and computesthe position of the ship.
2.1.3 Global Positioning System (GPS)
This satellite navigation project developed bythe US Department of Defence was originallyconceived as a target control for weapon systems.Its use has however been extended to civilianland, marine and air navigation, providingincredibly accurate, world-wide navigationalcapabilities. The GPS overcomes the limitationsof other navigational systems such as the frequentproblems of electronic signal interference due toweather storms experienced by Loran-C andDecca. The GPS consist of 21 active satellites andthree spares, each orbiting the earth twice a day.Each GPS satellite transmits precise time andposition data. Land based control stationsconstantly monitor the GPS satellites to ensureaccuracy of information. GPS operates 24 hours aday without delays between fixes that arecommonplace with transit satellite navigation.
2.1.4 Speed logging system
This system utilises Doppler sonar and inertialaids. For modest accuracy, the standard shipspeed log, in combination with the gyro compass,can be used for positioning. The Doppler sonarsystem is a sonar transducer containing fourcrystals which generate supersonic sonar beams inthe fore, aft, port and starboard directions. Aftertransmission of a pulse train, the crystals receive

8
the back scatter and part of the signal. Theobserved frequency shift serves to determine thevelocity vector of the ship in relation to the sea The term "tide" describes the periodic andbed or, in water deeper than about 400m, relative regular variations in sea level which have ato a layer in the water column which scatters a coherent amplitude and phase relationship to somesufficient percentage of the wave. periodic geophysical forces. The moon and, to a
2.1.5 Integrated navigation systems
An integrated navigation system (INS) water masses to be set in motion. These tidalcombines the output of several systems. The main motions of water masses are a form of very longadvantage of this is that it combines sensors with period wave motion, resulting in a rise and fall ofdifferent navigational characteristics, with the the water surface giving rise to episodes of highweak points of one subsystem as the strong parts tide and low tide. The change in level occursof another. For example the Transit system can twice each day in the case of diurnal tides suchbe used in conjunction with Doppler sonar. The that there are two "high waters" and two "lowTransit satellite provides accurate fixes every few waters" in each lunar day (about 24.8 hours).hours while the Doppler sonar enables dead Where there is a long bay or a river mouth, thereckoning between fixes. rise in water level is accompanied by an inward
2.2 MARINE PROCESSES
The marine environment is a dynamicenvironment and this dynamism must be takeninto account when undertaking coastal and marinesurvey work.
2.2.1 Tides
lesser extent, the sun, create ocean tides bygravitational forces. These forces of attractionand the fact that the sun, the moon and the earthare in motion in relation to each other, cause
flow of water termed the “flood” while thesubsequent outward flow is termed the “ebb”.The state where the sea water is at the lowest levelis termed “low water” while the state where thesea water is at its maximum level is termed “highwater”. The difference between the low and highwater is termed the “tidal range”.

9
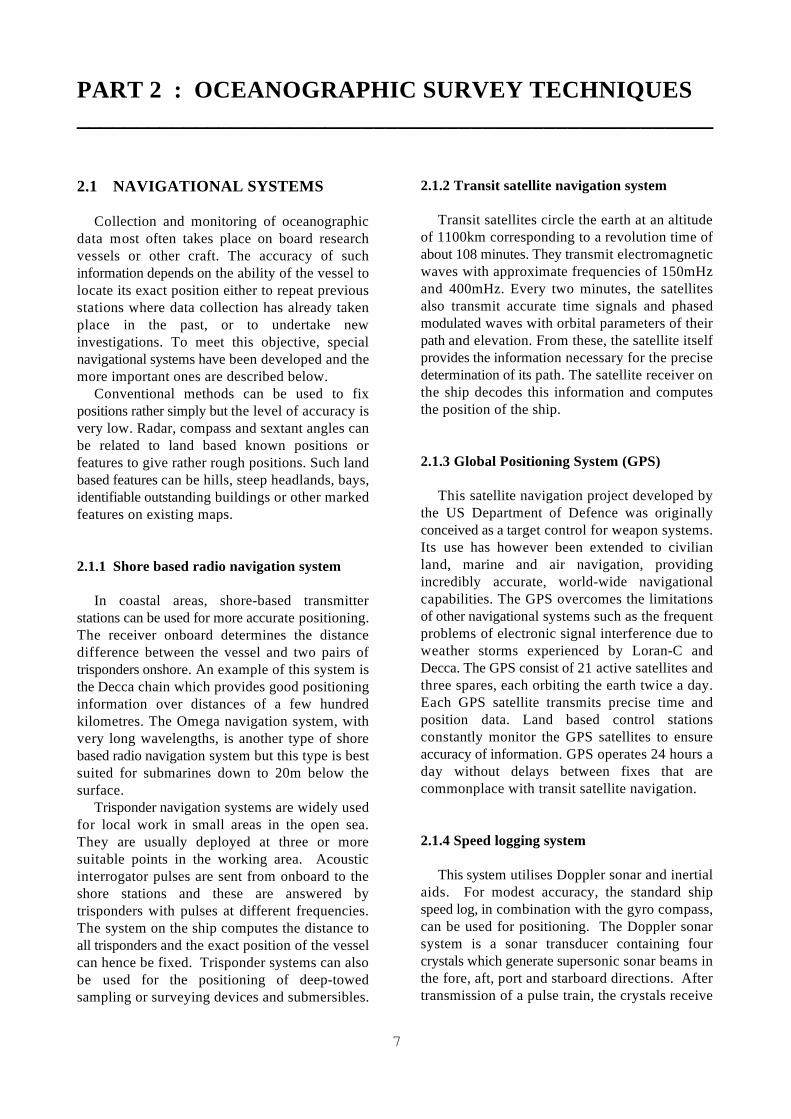
Figure 2. The tidal curve for semidiurnal tides with two sets of springs and two of neaps, over a period of one month.
Tides of highest magnitude occur at new moon periodic motion which is particularly apparent atand again during full moon when the positions of the surface. The observed alternate elevations andthe moon, sun and earth are aligned. This means depressions of the surface above and below itsthat the gravitational forces of the sun and moon mean position is merely indicative of the passagecome into phase and the range of the tide of energy. In wave motion, the medium throughincreases to a maximum. These are known as which the wave passes does not move along with“spring tides”. the wave. If a cork was left on the surface, the
Minimal tides occur during the first and third cork bobs up and down but does not travellunar quarters when the sun and moon are acting horizontally even though the ripples arein opposition to each other or are aligned at right propagated horizontally across the surface. Theangles. These are known as ”neap tides”. horizontal movement of the wave results from theSuccessive spring and neap tides occur at intervals vertical oscillations of the water column with theof about 15 days. same frequency but with a progressively
In localities subjected to semi-diurnal tides increasing phase lag the further the waves arethere are two high and two low waters in each from the source.lunar day. For semi-diurnal tides in some regions, The generation and subsequent propagation oftwo successive high waters will have nearly the waves can result from changes in air pressuresame height and two successive low waters will caused for example by wind acting directly on,have nearly the same (lower) height. In other and putting some stress on, the water surface.regions successive high and low waters will each Another possible cause is any significanthave different height. In some areas a disturbance of the basin (i.e. the earth's crust)predominantly semi-diurnal tide becomes diurnal holding sea water such as during an earthquakefor a short time each month during neap tides. with the resulting tsunami. Most waves are
The tidal oscillations generate currents termed caused by the former. “tidal currents”. Tidal currents are generally in Wave parameters of importance and whichphase with tidal direction and are stronger during may need to be recorded during a survey include:ebb tides than during flood tides. Wave Height: The wave height (H) is the
2.2.2 Waves
Waves involve water motions which are largely Wavelength: The wavelength (L) is the(but not exclusively) confined to the surface and horizontal distance between neighbouringmay be described as the surface disturbance of a crests or troughs in the direction of wavefluid medium. There are also waves that form travel.below the surface. Wave Period: The wave period (T) is the time
Waves are typified by an up and down bobbing interval between the occurrence of successive
vertical distance between a crest and anadjacent trough.Amplitude: This is a measure of the intensityof oscillation. It is defined as H/ .2
10
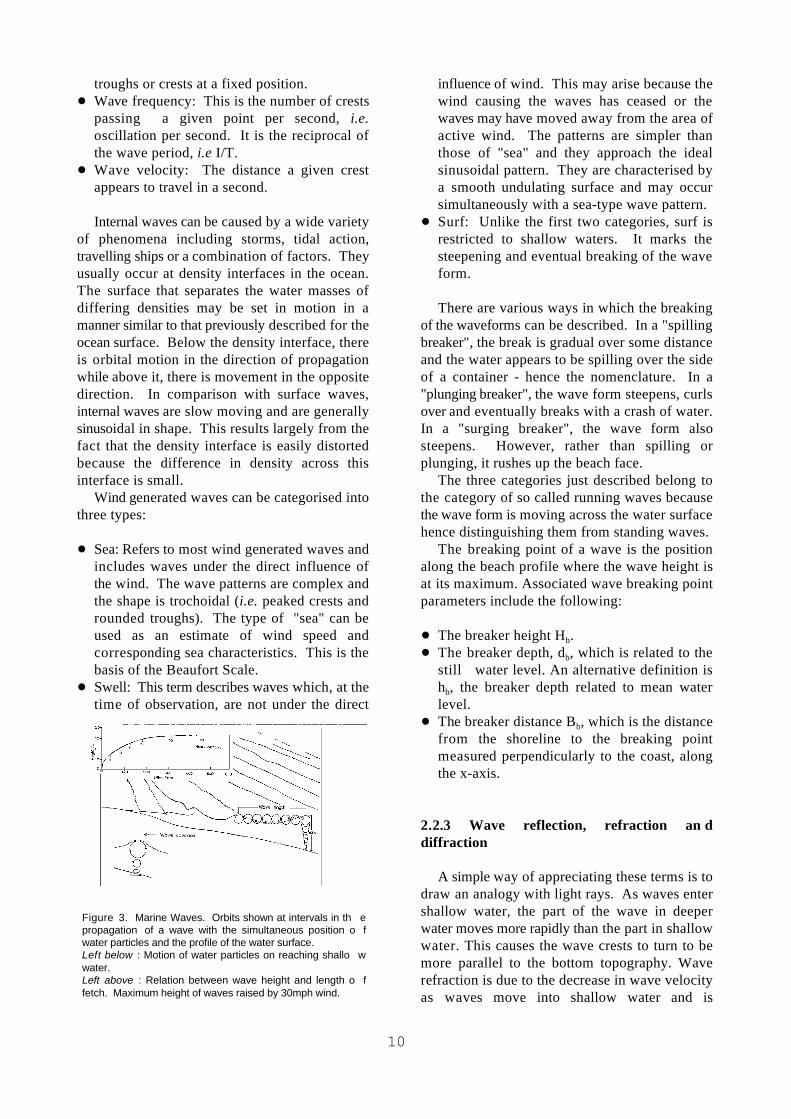
Figure 3. Marine Waves. Orbits shown at intervals in th epropagation of a wave with the simultaneous position o fwater particles and the profile of the water surface.Left below : Motion of water particles on reaching shallo wwater.Left above : Relation between wave height and length o ffetch. Maximum height of waves raised by 30mph wind.
troughs or crests at a fixed position. influence of wind. This may arise because theWave frequency: This is the number of crests wind causing the waves has ceased or thepassing a given point per second, i.e. waves may have moved away from the area ofoscillation per second. It is the reciprocal of active wind. The patterns are simpler thanthe wave period, i.e I/T. those of "sea" and they approach the idealWave velocity: The distance a given crest sinusoidal pattern. They are characterised byappears to travel in a second. a smooth undulating surface and may occur
Internal waves can be caused by a wide variety Surf: Unlike the first two categories, surf isof phenomena including storms, tidal action, restricted to shallow waters. It marks thetravelling ships or a combination of factors. They steepening and eventual breaking of the waveusually occur at density interfaces in the ocean. form. The surface that separates the water masses ofdiffering densities may be set in motion in a There are various ways in which the breakingmanner similar to that previously described for the of the waveforms can be described. In a "spillingocean surface. Below the density interface, there breaker", the break is gradual over some distanceis orbital motion in the direction of propagation and the water appears to be spilling over the sidewhile above it, there is movement in the opposite of a container - hence the nomenclature. In adirection. In comparison with surface waves, "plunging breaker", the wave form steepens, curlsinternal waves are slow moving and are generally over and eventually breaks with a crash of water.sinusoidal in shape. This results largely from the In a "surging breaker", the wave form alsofact that the density interface is easily distorted steepens. However, rather than spilling orbecause the difference in density across this plunging, it rushes up the beach face.interface is small. The three categories just described belong to
Wind generated waves can be categorised into the category of so called running waves becausethree types: the wave form is moving across the water surface
Sea: Refers to most wind generated waves and The breaking point of a wave is the positionincludes waves under the direct influence of along the beach profile where the wave height isthe wind. The wave patterns are complex and at its maximum. Associated wave breaking pointthe shape is trochoidal (i.e. peaked crests and parameters include the following:rounded troughs). The type of "sea" can beused as an estimate of wind speed and The breaker height H .corresponding sea characteristics. This is the The breaker depth, d , which is related to thebasis of the Beaufort Scale. still water level. An alternative definition isSwell: This term describes waves which, at the h , the breaker depth related to mean watertime of observation, are not under the direct level.
simultaneously with a sea-type wave pattern.
hence distinguishing them from standing waves.
b
b
b
The breaker distance B , which is the distanceb
from the shoreline to the breaking pointmeasured perpendicularly to the coast, alongthe x-axis.
2.2.3 Wave reflection, refraction an ddiffraction
A simple way of appreciating these terms is todraw an analogy with light rays. As waves entershallow water, the part of the wave in deeperwater moves more rapidly than the part in shallowwater. This causes the wave crests to turn to bemore parallel to the bottom topography. Waverefraction is due to the decrease in wave velocityas waves move into shallow water and is

11
analogous to refraction of light. Refraction can when the freshwater flow becomes so great as toalso be observed in deep waters. When a wave prevent the surface marine current from flooding,crosses a current, if it has a component of motion it may still flood below the surface. The ebbagainst the current, it tends to be refracted into a speed and strength usually decrease graduallystream. If it has a component of motion with the from top to bottom, but the speed of flood tide iscurrent, there is a tendency for it to be turned often stronger at subsurface depths than at theaside. surface.
Waves can also be reflected and diffracted in Wave generated currents: When waves breakshallow water. For example, waves moving obliquely to the shoreline, they generate currentsagainst a vertical sea wall or a steep cliff will be in the direction of the wave opening. Thesereflected back towards sea. Wave diffraction currents are called longshore currents which movecauses energy to be transferred along a wave parallel to the general orientation of the shoreline.crest. Wave diffraction can cause waves to effect Longshore currents are mainly responsible forwater far to the lee of the interfering structure. moving sediments as well as other suspendedDiffraction may however be complicated by matter along the shore. Longshore movementrefraction depending on the topography of the takes place primarily in two zones. Beach driftingbottom surrounding the barrier. occurs along the upper limit of the wave action
2.2.4. Currents
The main types of currents responsible for currents.transport in the ocean are tidal currents, wave Rip currents: Rip currents flow seawardsgenerated longshore currents, rip currents and (though not too far seawards) perpendicular to theoceanic currents. shoreline, when waves break. Rip currents are
Tidal currents: The rise and fall in sea level responsible for transporting sediments out to seagenerate currents which are called tidal currents. particularly in the surf zone. When currents and tides are both semi-diurnal,there is a definite relationship between times ofcurrent and the times of high and low water in thelocality. Tidal currents that attain maximumvelocity during the time from low water to high The totality of the systems of water movementwater are called flood currents and those that is a very complex one. This is probably soattain their maximum velocity during the time because the factors which govern these variousfrom high water to low water are called ebb movements in both the vertical and horizontalcurrents. The variation in the speed of the tidal directions are themselves subject to considerablecurrent from place to place is not necessarily variations. Besides, describing the motion of aconsistent with the range of the tide. fluid which is itself in a basin that is rotating as
In general, the current turns earlier near shore well as being in orbit and which is at the samethan in midstream, where the speed is greater. time influenced by the wind is bound to beThe speed of the current also varies across a complicated. These motions are perhaps bestchannel, being usually greater in midstream or described in terms of their complex mathematicsmidchannel than nearshore. In winding rivers or some of which can be found in any standard textchannels the strongest currents occur near the on dynamic physical oceanography.concave shore and are weak or may eddy near the Oceanic circulation can be considered fromopposite (convex) shore. two angles - wind driven (mostly surface)
Tidal currents also vary with depth. In a tidal circulation and thermohaline (mostly intermediateestuary, particularly in the lower reaches where and deep) circulation. These divisions are verythere is considerable difference in density from useful for descriptive purposes. top to bottom, flood usually begins earlier near the Wind driven circulation : Wind drivenbottom than at the surface. The difference may be circulation is directly influenced by atmosphericas much as one or two hours or as little as a few circulation. Atmospheric circulation has solarminutes, depending on the estuary, the location in radiation as its driving force and so radiation fromthe estuary and the freshwater conditions. Even the sun can be regarded as the ultimate driving
and is related to the swash and backwash of thewaves. The other zone is the surf zone where thelargest quantity of material is in suspension andwhich can be carried by relatively weak longshore
2.2.5 Oceanic circulation

z 1pg
12
force of oceanic circulation. Surface currents Upwelling and the associated phenomenon ofgenerally have a horizontal component. downwelling can also result from surface wind
When the wind blows over the water surface, stress causing divergence or convergence. Thethere is friction between moving air and term upwelling sometimes leads people intomotionless water. Apart from causing ripples and thinking that water is upwelled from the bottom.waves, the stress of the wind results in the transfer This is rarely the case and characterization ofof energy which causes water motion (currents). water masses in upwelling areas in terms of theirThey may be turbulent or laminar depending on physical, chemical and biological characteristicsthe velocity of the causative wind. Because these has revealed that water is upwelled from depthscurrents are generated at the air-water interphase, that rarely exceed 400m.their strength decreases with depth. Upwelling is very important in fisheries since
The direct influence of atmospheric parameters cool upwelled water usually contains relativelyon surface ocean circulation is apparent if one high concentrations of nutrients especially nitrateexamines the relationship between the major gyres and phosphate. Upwelling areas are thereforein the northern and southern hemispheres. The usually fertile and may support rich fisheries.currents, although following the wind pattern Examples of some rich fishing grounds based onclosely, are at an angle to it (45 ) to the right and upwelling include the Pacific coasts of Californiao
left of the wind directions in the northern and and Peru and the Atlantic coast of southern Africasouthern hemispheres respectively. This is due to and off the coast of Ghana.the Coriolis or geostrophic effect. Otherpeculiarities include the tendency for westwardcurrent intensification. This is due to thelatitudinal variation in the magnitude ofacceleration associated with a solid rotating earthunder liquid oceans irrespective of hemisphere.
Thermohaline circulation: This type ofcirculation is associated with deep waters belowthe major wind driven currents and as the nameimplies, it is due to temperature and salinitydifferences. These differences result in densityvariations which set up movement akin to aconvection current. Thermohaline forcing can alsobe achieved by freshwater runoff from land whichsets up a salinity gradient normal to the coast.
Upwelling: Upwelling may be defined as theupward transport of sub-surface (often nutrientrich) cold water to the sea surface. It is caused bya variety of factors and varies in duration andextent. In some coastal areas, the vertical temperatureprofile sometimes appears to be anomalous andreflects a breakdown in thermal stratification.This apparent anomaly can be caused bymovement of water in response to the Corioliseffect according to the Ekman Spiral during whichsurface winds result in the net horizontal transportof surface water, causing deeper, colder water torise (upwell) to the surface. In the northernhemisphere for example, where surface windsblow in a north-south direction on the western sideof a land mass, the wind results in the nettransport of surface water westwards making wayfor the deeper colder water to upwell. This settingis particularly true of coastal inshore upwelling.
2.3 OCEANOGRAPHIC TECHNIQUES
Instruments for oceanographic measurementsand data gathering must have certain qualities -
High sensitivity and good reproducibility sothat even small fluctuations in thermodynamicvariables can be identified.Salt resistance.Ability to withstand hydrostatic pressure andsupply data not affected by pressure effects.Sufficiently robust to cope with rough fieldconditions.
2.3.1 Bathymetry
Bathymetry is the distance (water depth)between the water surface and the sea bottom.Methods that are used to determine water depthsare as follows:
i) Measurement of hydrostatic pressure. Fromhydrostatic pressure “p” of a water column themean density of which is known, the depth “z” isobtained according to the hydrostatic basicequation
here “g” = acceleration due to gravity andpressure measurements can be made with

D 0.5VT
13
Bourdon tubes or Well tubes. A depth recorder can also be used to measureii) Measurement of sinking time of a free- tides from submerged capsules and platforms. For
falling probe offers a very simple method for the accuracy, tidal readings must be related to a determination of depth. datum, the commonest being the chart datum.
iii) Special measurement by means of an echosounder which sends a pulse through the water tothe sea bed. This pulse returns to the receiverwhere conversion of the speed and time is made toobtain the depth (D) based on the formula: Waves can be measured from the sea floor, at
where V = velocity of the pulse (1500m/s), accordance with the linear wave theory. Inand T = time of travel of pulse. pressure gauges, the pressure sensor reacts
The bottom profile of the sea is printed on the exclusively on any variations of the hydrostaticecho sounder paper as an echogram. pressure. Another method, though of less
2.3.2 Measurement of tide (water leve lvariation)
Two types of gauges are used for measuring bridges at the coast or pole research towers. Floattidal variations : non-registering and self- gauges are similar to those used for theregistering. Non-registering gauges require the measurement of tides. With electrical devices,presence of an observer to measure and record the variations of water level are converted intoheight of the tide. Self-registering, or automatic changes in electrical resistance capacitance. Ingauges, automatically record the rise and fall of the capacitive method, an insulated wire isthe tide while unattended. stretched in a vertical position with a cylindrical
Non-registering gauges include the tide staff, capacitor in the range where it is wetted withthe simplest kind of which consists of a plain staff water. The variation in length of wetted clinger,or board about 2-5cm thick and 5-15cm wide and or the variations in size of the capacitorgraduated. The length of the staff should be respectively, correspond to the variations in watersufficient to extend from the lowest to the highest level.tide in the locality where the staff is to be used. Wave observations from a ship can be carriedThe staff is secured in a vertical position by out visually, photographically or by means offastening it to a pile or other suitable support. The built-in measuring devices (slip burner recorders).height of tides can be read from the graduations Accelerometer instrumented buoys are oftenon the staff. used for wave measurements in deeper waters
Self-recording tide gauges include : where pressure sensors cannot be used and whereFloat gauges - with direct mechanical structures are not available for attachment of otherregistration of the water level. types of wave sensors. Accelerometers canPneumatic gauge - in which a diving bell lies transmit wave measurements to a shore-basedon the sea floor at such a depth that pressure receiving station where wave data are recorded orvariations due to surface waves can be ignored. monitored in real time.By means of an air-filled tube, the hydrostatic Aircraft and satellites which orbit the earthpressure is connected with a recording carry sensors which can measure sea waves.manometer on shore on a measuring pole. However, the resolution and accuracy of waveAcoustic gauge - by means of acoustic signals data from atmospheric measurements is still poorsent to the seabed, the depth being determined when compared with that from sea-basedby the time required for a sound wave to travel instruments described above. A promising recentfrom the ship or boat (acoustic transmitter) to development permits recording of the state of thethe bottom and for the echo to return. sea from simultaneous measurements of the sea
2.3.3 Measurement of ocean surface waves
the sea surface or from an aircraft. The mostimportant method of measuring waves from thesea floor is the recording of bottom pressurefluctuations that reflect surface waves and whichcan be used to calculate surface displacements in
importance, is the measurement with a reversingecho sounder.
Float gauges and electrical measuring devicesare suited for measurement from the sea surface.They are deployed from fixed platforms, like

14
surface temperature through infrared and coastal station.microwave radiation. Fluorescent dye is also used to measure surface
2.3.4 Measurement of currents
Two quantities must be determined by sensors by the use of a fluorimeter from a ship.for current measurements. These are the absolute Drift measurements in the bottom current canvalue and the direction of the velocity or its be performed with specially designed mushroomcomponents in a right angled coordinate system. shaped floats made out of plastic. The “foot”The absolute value is usually obtained by which is weighted to result in a minimum degreemeasuring the rotation rate of mechanical sensors of negative buoyancy, touches the sea floorsuch as propellers, rotors, paddle wheels, or slightly and the mushroom is carried along inturnstiles with hemispherical bowls. The direction small hops by the bottom current. Distance andis determined by means of a current vane relative time are obtained when they are retrieved into the north direction (magnetic compass, bottom trawls.induction compass) or to the bearing of a fixedmeasuring stand.
The acoustic current metre, which makes useof the fact that sound is carried along with movingseawater, consists of two sonar paths for each co- Properties of seawater are best measured inordinate direction through which the sound situ. If this is not possible, the water has to bepropagates in opposite directions. The difference collected and analysed in the laboratory. In suchin the travel times is a measure of the carrier circumstances three precautions are necessary:velocity. the sample must be taken at known depths and
Measurements of currents can also be made position,from a moored vessel with the current metre it must be protected from any falsification, andlowered into the water. it should be adequately preserved by keeping it
Current measurements are ideally made at in the freezer until analysed.three depth levels i.e. near the surface (within1.0m from the surface), mid-depth and near the Water samplers differ in the release mechanismbottom (within 1.0m from bottom). Such of the closing valve at the desired depth which canmeasurements provide a good current profile of be triggered by one of the following devices :the column of water. a messenger (usually a weight),
2.3.5 Drift measurements
Drift measurements are made on the surface by reached,a variety of floats. Systematic drift measurements an electric remote control achieved through ain the near surface layers are carried out with drift connecting cable.bottles or with drift cards in plastic envelopes -they drift ashore. This method only gives the A number of sampling bottles can be attachedstarting and final points and a rough estimate of to the same wire of a hydrographic winch tothe time span of the drift. obtain multiple samples simultaneously. The
Parachute buoys used for drift measurements most common types of sampling bottles are thecarry a mark, a radar reflector or a radio Nansen and spilhaus types.transmitter. The buoys are connected by a thinrope with a floating body at the selected depth tobe measured. A parachute or another structurewith high flow resistance is fixed to the float. Its An ordinary mercury thermometer is thetrajectory can be tracked by taking the bearings of simplest way of obtaining the temperature of athe surface buoys by means of optical, radar or surface water sample taken in a bucket. At theradio direction finding either from a ship or a other extreme, sea surface temperature can also be
currents. Powdered dye is released on the surface,often in packets, and it dissolves leaving a readilyvisible patch. Its propagation can be tracedvisually and photographically from an aircraft or
2.3.6 Water sampling devices
a propeller that activates the valve as soon asthe sampler is hoisted,hydrostatic pressure that activates the closingvalve when a certain pressure (depth) is
2.3.7 Measurement of temperature

C xt
x.f
f 1t
C l.f xn
.f
15
read from aircraft and satellites by observing theintensity of the infrared radiation of sea waterwithin the wavelength range of 8-12 m.
Water temperature in deeper waters ismeasured with reversing thermometers with anaccuracy of up to ±0.01 C. The wave length measurement is based on theo
Recently, electrical methods of measuring relation between sound velocity “C”, wavelengthwater temperature have gained importance. For “l” and frequency “f”.this purpose, platinum resistance thermometers orthermistors are used almost exclusively as sensorsand there is a variety of instruments with platinumthermometers or thermistors which usuallyemploy Wheatstone Bridge methods.
2.3.8 Measurement of salinity
Salinity can be calculated on the basis of well- indirectly through salinity, temperature andknown functional relationships by determining pressure.physical properties such as density, optical Direct measurements of the specific weight,refractive index, electrical conductivity, or sound however are required for fundamentalvelocity and, in addition, temperature and determinations and also in cases when it is notpressure. certain that the content of sea water is constant.
Chemical methods, based on chlorine (Cl) Methods that might be applied for thiscontent, can also be used to calculate the salinity determination include the weighing of aof water samples. This involves chlorine titration pycnometer (a glass vessel with exactlyusing silver nitrate. determined volume), the hydrostatic weight of a
Progress in electronic measuring techniques float, or the frequency determination of thehave resulted in electrical conductivity characteristic oscillation of a body that issalinometers almost replacing most other methods dependent upon the density of sea water.of determining salinity. In situ salinometersknown as "Bathy sonde", "STD", "CTD" and"Multisonale", permit the simultaneousmeasurement of electrical conductivity (salinity),temperature, and pressure.
2.3.9 Measurement of sound velocity
Sea water distribution of sound velocity in samples with the subsequent weighing andspace is determined either indirectly from examination of the residue.measurements of temperature, salinity and Indirect methods are based on the measurementpressure, or directly from measurements of travel of the attenuation and the scattering of light astime or wave length. well as the reflection of sound by the particles
For the determination of travel time, the time suspended in seawater.interval "t" is measured by the time it takes for the Attenuation measuring devices, called turbiditysound signal to travel to and fro between meters or transparency meters, record thetransducers. The sound velocity "C" results from attenuation of a light beam over a certain
with and the scattered light is measured at various
2.3.10 Measurement of density
In coastal waters with strong differences inhydrographic stratification, density is determined
2.3.11 Measurement of the content o fsuspended materials
Suspended particles are of different sizes andshapes and may be organic or inorganic. Methodsof measurements are either direct or indirect.
Direct methods involve the filtration of water
measuring distance - spectral photometers areemployed for laboratory work.
To measure scattered light, an installation isrequired whereby a selected volume of water issubjected to irradiation by a parallel light beam
16
angles relative to the beam. moves forward as a line of foam which carries
2.3.12 Measurement of dissolved substances
Dissolved substances in sea water are measured gravity flow down the beach taking sand with it.for two principal purposes - the first is to At the point where this flow meets the forwarddetermine the basic composition of these moving water of the next incoming wave, thecomponents which are only slightly influenced by outgoing material is deposited forming a lowbiological processes, if at all. The second is to seaward facing beach slope that changes positionrecord whole ocean areas in space and time and to with wave conditions. observe biochemical processes in a delimited Continuous pounding of beaches, especiallyregion. sandy ones, results in beach profiles developing
Gravimetric proportion analysis, volumetric with time since the sediments are composed ofand colorimetric methods were earlier used to movable particles.measure the dissolved substances in water. More Ocean waves affect beaches in two ways.recently, spectral photometric methods are used Firstly, relatively steep wind waves cause beachfor the direct determination of nutrients and for erosion by taking sand and other materials fromthe measurement of several trace elements after the area just above the water level andthey have been enriched and extracted. These transporting them into deeper water. Secondly,methods include, atomic absorption waves approaching the beach at an angle breakspectrophotometry and neutron activation near the beach and generate a current that movesanalysis, gas chromatography, potentiometric parallel to the shore line. This is called littoralmethods with ion-specific electrodes, inverse current or longshore current and is mostpolarography and microbiological assays. noticeable in the surf zone. Longshore current is
2.4 COASTAL PROCESSES SURVEY
2.4.1 Introduction
Coastal processes are those processes thataffect the morphology of beaches (includingcoastal areas) and shallow nearshore waters. Suchprocesses are usually the result of interactionsbetween marine and fluvial processes andmeteorological conditions. Suchland/sea/atmosphere interactions can be modifiedby human activities and can lead to significantchanges in coastal morphology.
Probably the most important natural forceshaping coastlines is the force of waves. In deepwater, fluid particles move in nearly closedexponential decaying circular orbits. But when thewater depth decreases to about one-half of thewave length, waves approaching the coast start to"feel" the bottom. Particle motion becomes moreand more elliptical and a velocity develops alongthe bottom that moves the bottom sediments. Asthe waves continue towards the beach, shoalingcauses wave steepness to increase until a pointwhere the depth is about 0.78 of the wave height.At this depth waves break. As waves break, water
fine sand in suspension toward the inner beach.When the foam line slows down, sand is depositedon the beach. Some of the remaining water,which has not percolated into the beach, returns as
an important coastal process since it carries largeamounts of beach sand, stirred into suspension bythe breaking waves, along the beach.
2.4.2 Causes of beach erosion
Beach erosion can be caused by both naturaland human activities. These causes however, varyfrom area to area and in intensity. Some of thenatural causes include: low lying topography,intense wave climate, vulnerable soilcharacteristics, nature of shelf width andtopography and the occurrence of offshorecanyons.
Anthropogenic activities causing beach erosioninclude : damming of rivers which reduces thesediment reaching the shoreline, construction ofharbour protection structures and jetties, beachsand mining, removal of coastal vegetation anddredging activities.
Subsidence which may be induced by naturalcompaction of sediments or by human activitiessuch as oil and groundwater extraction can alsoexacerbate rates of coastal erosion. Furthermore,the problems of coastal erosion worldwide areexpected to be exacerbated by predicted sea levelrise.

Mz16 50 84
3
O I84 16
495 56.6
SK I16 84 2 502( 84 16)
5 95 2 502( 95 5)
KG95 5
2.44( 75 25)
17
2.4.3 Beach erosion monitoring
Monitoring of beach erosion involves theanalysis of beach sediment characteristics. Beachsediment samples taken at designated points onthe beach should be analysed for theirgranulometric characteristics. This is done for Beach profiling can be done either by levellingsand by passing through sieves stacked up either or by sighting, using a surveyor’s graduated staff.in 0.25mm or 0.5mm intervals. For silt and clay Levelling involves establishing transect linesparticles, granulometric analysis is performed by paced at specific intervals to cover the stretch ofpipette analysis or by using a sedigraph. The shore. Each transect line is referenced by two ormethod of Folk is normally used to calculate the more permanent markers placed above high watergranulometric characteristics of sediment samples. mark whose position and heights are accuratelyStatistical parameters of importance in this regard surveyed. Each transect line is then levelled fromare: mean grain size, standard deviation, skewness the shore as far into the water as possible at low(measure of asymmetry) and kurtosis or tide. The distance between each profile stationpeakedness. will depend on the general morphology of the
There are two methods for obtaining statistical beach as well as the severity of the erosionparameters. The most commonly used, is to plot problem. The interval of profiling could alsothe cumulative curve of the sample and read the range from weekly to monthly, however profilingdiameter represented by various cumulative should be done immediately after any big storm.percentages (e.g. what grain size value The equipment needed to conduct this type ofcorresponds to 25% of the sediment). Much more beach profiling comprises an engineer’s level withaccurate results can be achieved if one plots the tripod, a levelling staff and 100m steel measuringcumulative curve on probability paper. The tape. equations for deriving these parameters from the The profile line which should be perpendicularsieve data are shown below. to the general orientation of the beach should start
Mean grain size (M ) the beach. The levelling procedure is as follows :z
Incl. Graphic Std Dev (O ) adjustments,I
Incl. Graphic Skewness (SK ) position, move the instrument ahead of it so thatI
Kurtosis (K ) distance into the water.G
For very good coverage of the beach at adesignated station, it is recommended that
sediment samples for analysis be taken at theforeshore, the berm crest and from the backshore.
2.4.4 Beach profiling
as far back as the bench mark installed far behind
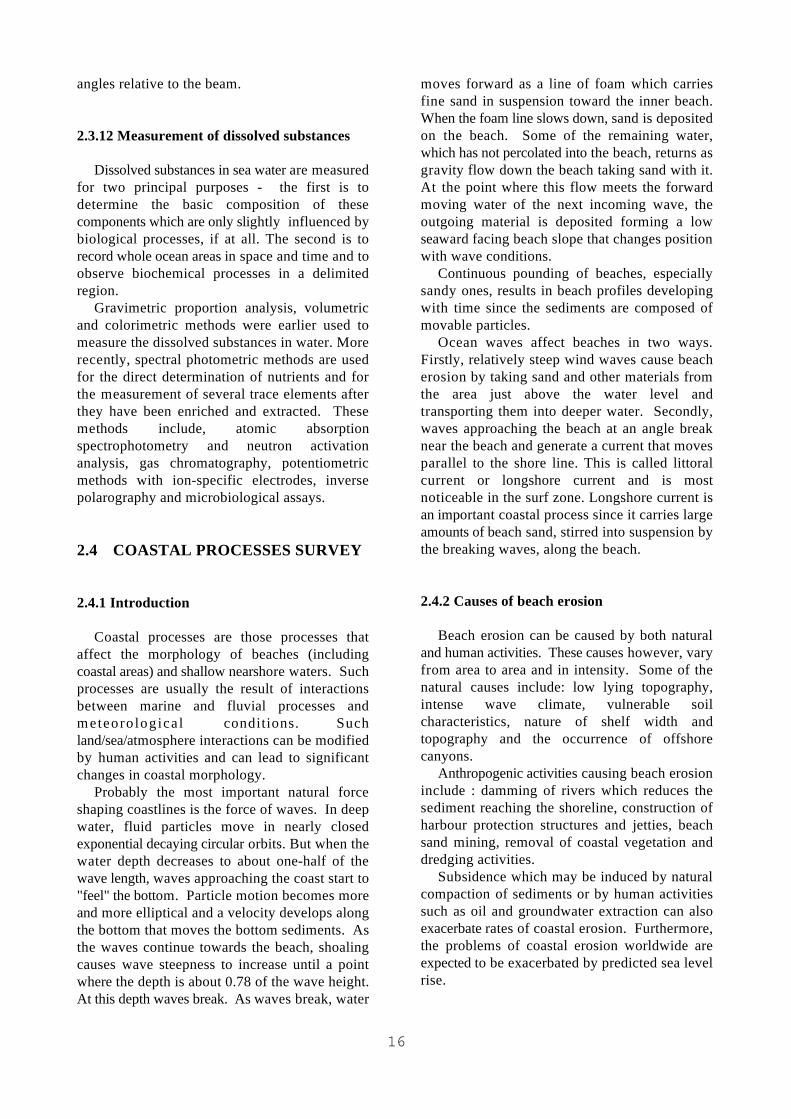
1. Place the level approximately half-waybetween the backsight staff (which is on the benchmark whose height is known) and the foresightstaff (ahead of the level),2. Level the instrument using the appropriate
3. Read off the backsight staff,4. Transit to foresight and read off the staff,5. Measure the distance between A and B usingsteel tape,6. Keeping the foresight staff in the same
position B now becomes the backsight while anew foresight position is established,
Repeat steps 2 and 4. This procedure iscontinued along the same straight line until thelast point is reached - which is usually some safe
The following precautions must be taken inorder to minimise errors:
18
Figure 4. Beach profiling with the aid of a surveyor’s level.
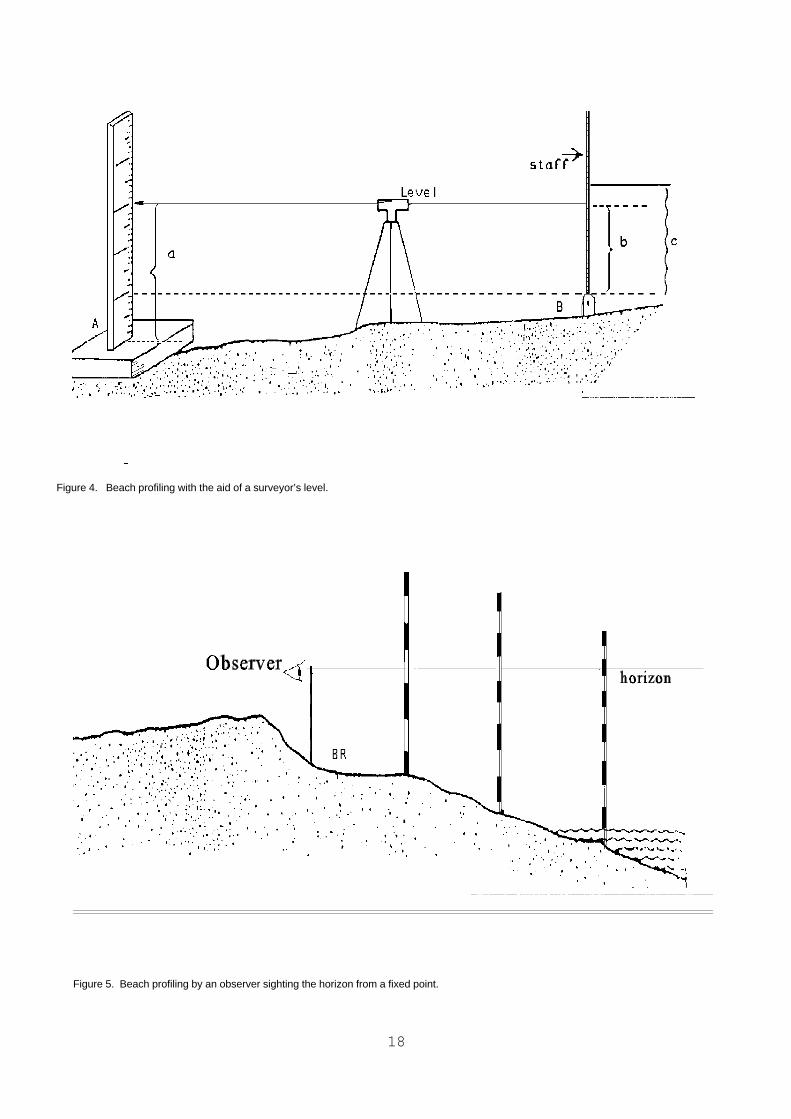
Figure 5. Beach profiling by an observer sighting the horizon from a fixed point.
19
To eliminate cumulative errors, the level a depth of 2-3m at intervals of 10m and protrudingshould preferably be at an equal distance from from the sand to a height of 2m. The tubes can bethe forward staff and the backstaff. driven into the sand with a pneumatic hammer onThe instrument should always be levelled along the exposed beach, or with a pneumatic gun on thethe profile line before any reading is taken. underwater beach. Topographic variations areFeatures along the profile line should be noted then measured by direct reading of the distancee.g. berm, high water line, low water line, any between the sand level and the top of the tube.beach structure as well as the time. Such readings can be taken regularly by a single
Recording and computing of levelling data are they require an equipped diver for the underwatermade by reference to the rise and fall or sighting. readings. The major drawback to this system is
Parameters for the rise and fall method are as the risk of accidents caused by the protrudingfollows : metal tubes to other beach users, fishermen and
STATIO K FORE ALTITUDE REMARKN SIGH SIGHT S S
BAC
T
A a - Ha benchmark
B c b Ha+(a-b) berm
C e d Hb+(c-d) rock
Where “Ha” is the known altitude (i.e. fixedbench mark) which is the control point of theprofile. To determine altitudes of B, C, etc,subtract the foresight reading from the backsightreading and add the results to the altitude of thestation at backsight.
For example, the altitude of B = Ha + (a - b)where Ha = altitude of A
a = backsight reading of staffon station A
b = foresight reading of staffon station B
The above procedure is followed for subsequentpoints whose altitudes are to be determined.
When a level and other topographic equipmentare not available profiles can still be easily doneby a simple method of sighting with the aid of a1.5m surveyor's staff which replaces the levellinginstrument. It is placed vertically on the benchmark BR, with the observer sighting the horizonfrom behind the staff. The line of sight interceptsa height H on a graduated staff which is displacedalong the profile of the beach, as in classicallevelling. The distance from the stake to theobserver is measured by means of a graduatedtape. This simple method is relatively accuratewhen the measured distances and the slope of thebeach do not force the observer to change positionseveral times along a single profile.
Another method of profiling is to drive a rowof galvanised steel tubes vertically into the sand to
unqualified observer, on the exposed beach, but
tourists. The risk of beach users removing thetubes also makes this method impracticable onmost beaches.
2.4.5 Profile of the underwater beach
It is usually desirable to continue the beachprofile beyond extreme low tide out to the limitsof the breaking waves and even into the nearshoresubtidal area (possibly as far as into a depth of10m of water). Profiling into such water depthscan be done with the aid of an echo sounderaffixed to the side of a boat or a canoe. The boatis kept in line with the aid of a positioning systemlike a hand held GPS or by a combination of anelectronic distance metre positioned on a level onthe beach with the reflector prism on the boat witha two way communication system.
Fixes can be taken every 2 minutes by the fixbutton on the echo sounder which puts a straightline on the echogram. This will indicate theposition of the boat at the fixed point while timemarks can provide the surveyor with additionalcontrols for plotting the results. The depths alongthe profile line can be read off from the echogram.
The levels are reduced to a known datum -LLWS and a profile of the area under study isdrawn by means of contour lines to join points ofequal height or depth.
Bathymetric surveys can also be done withseismic surveys which reveal the nature of thesubsurface as well as the surface of the seabed. Auniboom or sparker can be used which producesgood resolutions down from 100 to 200m.
When echo sounders are not available, a leadline can be used to obtain the general trend of theunderwater beach. A lead line consists of agraduated line with a weight (ballast) at the end ofthe line. In this case the surface of the ocean isthe reference level. To increase the level of

20
accuracy when using this method, it is important breaking line and the shoreline.that the intervals at which the depths are taken be Sea level: This is observed by visual estimationvery close. It is also important that the surveyor of the average level on a graduated rod fixed inshould keep along the line of profile. the sea near the shoreline; the same rod can be
The sea state, especially the tide, should be used to estimate the swell characteristics.monitored during bathymetric surveys. This willhelp relate bathymetric data to a known datum. Other meteorological data that should be
2.4.6 Littoral environment observations
It is important that hydrodynamic for this.characteristics be recorded at each station during Wind direction: This can be estimated byeach beach profiling. While sophisticated holding a handkerchief in the air and noting theequipment is available to monitor these, they can direction of wind. The direction can then bebe measured more simply by visual observation. estimated with the aid of a compass. The main hydrodynamic variables that should General weather conditions: Brief andbe measured along the beach are: descriptive notes on any other weather
Wave type: This is done by visually observing conditions as well as anything else of interestthe most prevalent type of breaking waves as on the beach should be recorded. either spilling, plunging, or surging.Amplitude of waves at breaking point (Hb):This is done by averaging 10 to 20 visualestimates of the amplitudes of successivewaves. These estimates are made, if necessary,with a swell measuring rod graduated every0.5m and permanently fixed in the breakingzone. A trained observer can estimate waveamplitude to within plus or minus 10cm.Period of waves: This is deduced from the timeseparating the breaking of 10 successive waves.Direction of the waves at the breaking point(b): This can be estimated by means of asimple protractor fixed horizontally to a postand with its base running parallel to theshoreline. Taking the averages of 10consecutive visual estimates yields thedirection of the propagation of the waveswithin a few degrees. Longshore currents: To measure the directionof the longshore current that is generatedbetween the breaking zone and the shoreline, afloat is thrown into the breaking waves and thedirection of movement of the float is known asthe direction of the longshore current. Theaverage speed of the current is estimated bystaking a distance of 10m and timing thedisplacement of the float over the stakeddistance. The current speed is then determinedby dividing the staked distance of 10m by thetime. This is done three or more times and theaverage is taken as the speed of the current.Width of the breaking zone (W): This isestimated visually as the distance between the
recorded during each beach visit, include:Air and water temperature: this is usually donewith the aid of a simple thermometer.Wind speed: A hand held anemometer is used
REFERENCES
Awosika, L F, Ibe, C E, Nwankwu, E O, Balogun,A and Adekoya, E A (1992) Physical andGeological Factors Affecting the Transport,Dispersion and Deposition of Pollutants in theLagos Lagoon, Nigeria. WACAF II Phase 2Project. A Progress report for IOC.
Cook, P (1994) Offshore Mineral Resources. In :Proceedings International Conference onOceanography. Lisbon, November 1994.
Davis, R A (Jr), (1977) Principles of Oceanography Addison - Wesley.
Defant, A, (1961) Physical Oceanography Vol.IPergamon Press.
Dietrich et al, (1972) General Oceanography.
Earle, M D, and Bishop J M (1984) A Practicalguide to Ocean Measurement and Analysis.Published by ENDECO, Inc. Marion, MAU.S.A.
Ibe, A C, (1982) A review of potential economicmineral resources in offshore Nigeria. NIOMRTech. Paper No. 8.
Ibe, A C, Ajao, E A, Oyewo, E O, Awosika, L F,Ihenyen, A E, Tiamiyu, A I, Ibe, C E,
21
Inegbedion, L and Adekanye, J E (1988)Physico-chemical Parameters and Dynamics ofthe Ocean off Lagos, Cruises 1, 2, and 3. Areport for the Nigerian Army.
Ibe, A C and Quelennec, R E (1989) Methodologyfor the assessment and control of coastalerosion in West and Central Africa. UNEPRegional Seas Reports and Studies No. 107.UNEP, Nairobi.
Knauss, J A, (1978) Introductin to PhysicalOceanography. Prentice - Hall Inc.
Lewis, E L and Perkin, R G, (1981) The PracticalSalinity Scale 1978. Deep Sea Research28A(4): 307 - 328.
US Army Coastal Engineering Research Centre(CERC) (1973) Shore Protection Manual. U.S.Army Corps of Engineers, Fort Belvoir,Virginia.

22
PART 3 : LIVING RESOURCES ASSESSMENT METHODS_____________________________________________________
Living resources include all living things from time series, aerial photographs can providemangroves to manatees to microbes. They also accurate information on trends in mangroveinclude ecosystem functioning, health and distribution, the migration of sand spits, the extentintegrity and, for the purpose of coastal survey, of seagrass meadows, etc.they include also subsistence fishing as well ascommercial, economic use of various resources.Living resources also include the living landscape- whatever gives a particular part of the globe itsunique ecological and aesthetic character. This is an excellent survey technique which can
3.1 ECOLOGICAL SURVEY
One of the most common reasons forecological survey is to document the ecologicalsituation and establish a baseline of what needs tobe managed and their condition.
This is basically a description of the biologicalenvironment including all its biota, their trophicrelationships, various life stages and seasonalvariations, the presence of rare and endangeredspecies, and the presence of special populations orecological communities such as mangroves, coralreefs, wetland systems, and seagrass meadows.
The biological environment often reflects, andhas an influence on, the physical environment.For example, coral reefs and mangrove forestsplay a major role in controlling coastal erosion. Itis therefore artificial to make a clear distinctionbetween the biological and physical environmentand ecological surveys usually address a holisticview.
3.1.1 Macro scale survey
Macro scale surveys utilize visualrepresentations of data, often in a coarse format.Topographic maps, bathymetric charts andthematic maps (e.g. geology, vegetation) are themost common of the coarse data summaries.When coupled with local knowledge which can besuperimposed on the base maps and after somevalidation by rapid checking in the field, they areoften more than adequate as macro surveys.
Better definition and detail can be provided byaerial photographs whether taken vertically or
obliquely. Particularly when they are taken as a
3.1.2 Rapid rural appraisal
provide a quick preliminary assessment of thesituation for comparatively little cost. It providesmainly a good “gut feeling” and may requirefollow-up, however, after an effective rapid ruralappraisal, any follow-up can be targeted muchbetter.
The techniques employed in rapid ruralappraisal can include any combination of : reviewof existing data, direct personal observations,semi-structured interviews with local people,community meetings, relating of personal storiesand experience, drawing of diagrams, etc.
Rapid rural appraisal can be used successfullyto establish a baseline of the existing situation. Itcan then be repeated to record historical changes,particularly those within the collective livingmemory of a community. It can also provide acomprehensive analysis of single events such as acyclone, a flood or an oil spill. It is alsoextremely valuable to provide an insight into theseasonal variability of a particular environment,especially when the investigator is limited to oneparticular time of the year.
A typical rapid rural appraisal would start withthe investigator familiarising himself/herself withthe main body of information already existing.This could mean a desk review of reports, study ofaerial and other photographs, familiarisation withany published material. Armed with thispreliminary information, the investigator couldthen convene a village meeting at which he/shewill prompt information on whatever aspect of theenvironment is important. During this flexibleapproach, a skilled investigator will use “peerreview” of the information which is volunteered,and note consensus and dissent. An effectiveapproach is to use felt pens on a map base andrecord the information as it is provided and agreedto by the

23
Figure 6. Sketch map of a peasantland-holding and activities in Ethiopia.
meeting participants. It is also possible to take Remote sensing using space satellites has beenone or two knowledgeable local people into the used to provide data on : ocean colour (whichfield to validate the critical information through reflects productivity, sediment load, planktonspot checks. The data can then be refined and blooms, etc), sea surface temperatures (canconverted on to annotated maps, cross-sections of indicate upwelling), surface wind and wavethe environment, time sequences, etc. These will conditions (essential when dealing with an oilserve as a strong basis for any more thorough spill), landuse (down to a resolution of 10 metresassessment or survey that is deemed necessary. by the SPOT satellite), bathymetry, oil pollution,
3.1.3 Remote sensing
While rapid rural appraisal is usually the least With a return period of 16-26 days, it is notcostly and most basic ecological survey considered as providing sufficient temporalmethodology, remote sensing is often the most resolution for such a dynamic environment.sophisticated and most expensive. However, it Interpretation of satellite images is often hinderedcan also be the most objective and most accurate by tidal fluctuations and other influences (such asand, depending on the environment that is being storm surges) on surface water levels. Cloudsurveyed, it can also be very cost-effective. cover, which is very common in humid tropical
Remote sensing can be defined as the obtaining coastal environments, is a big problem and canof data about a target without the sensor being in only be overcome by the use of microwavecontact with the target. sensors. Finally, light penetration in water is
There are many sensor and recording systems limited and therefore the deeper one tries to readand they include photographic cameras below the water surface, the less reliable the data(sometimes with specialized type of film), becomes.radiometers and radar systems which can recordin photographic form or in digital form. Digitaldata, which depends on image processing systemsto be transformed into useable imagery, is veryversatile and can make corrections for radiometric On the ground ecological survey is the mostand geometric “noise” and can also be enhanced common and relies on standard methodologiesusing specialized spectral techniques. usually employing a sampling approach. For
submerged (e.g. algae and seagrasses) andemergent (e.g. mangrove) vegetation distribution.
There are some serious limitations of satelliteremote sensing techniques for coastal survey.
3.1.4 “On the ground” survey
example :
24
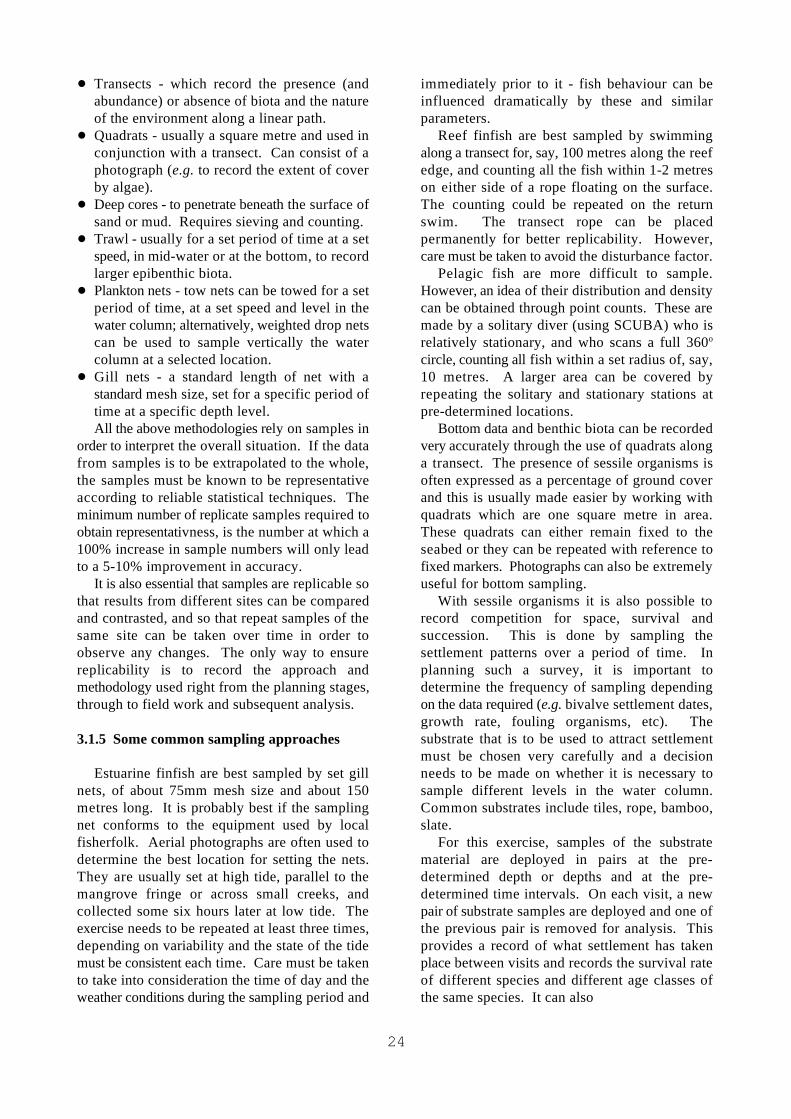
Transects - which record the presence (and immediately prior to it - fish behaviour can beabundance) or absence of biota and the nature influenced dramatically by these and similarof the environment along a linear path. parameters.Quadrats - usually a square metre and used in Reef finfish are best sampled by swimmingconjunction with a transect. Can consist of a along a transect for, say, 100 metres along the reefphotograph (e.g. to record the extent of cover edge, and counting all the fish within 1-2 metresby algae). on either side of a rope floating on the surface.Deep cores - to penetrate beneath the surface of The counting could be repeated on the returnsand or mud. Requires sieving and counting. swim. The transect rope can be placedTrawl - usually for a set period of time at a set permanently for better replicability. However,speed, in mid-water or at the bottom, to record care must be taken to avoid the disturbance factor.larger epibenthic biota. Pelagic fish are more difficult to sample.Plankton nets - tow nets can be towed for a set However, an idea of their distribution and densityperiod of time, at a set speed and level in the can be obtained through point counts. These arewater column; alternatively, weighted drop nets made by a solitary diver (using SCUBA) who iscan be used to sample vertically the water relatively stationary, and who scans a full 360column at a selected location. circle, counting all fish within a set radius of, say,Gill nets - a standard length of net with a 10 metres. A larger area can be covered bystandard mesh size, set for a specific period of repeating the solitary and stationary stations attime at a specific depth level. pre-determined locations.All the above methodologies rely on samples in Bottom data and benthic biota can be recorded
order to interpret the overall situation. If the data very accurately through the use of quadrats alongfrom samples is to be extrapolated to the whole, a transect. The presence of sessile organisms isthe samples must be known to be representative often expressed as a percentage of ground coveraccording to reliable statistical techniques. The and this is usually made easier by working withminimum number of replicate samples required to quadrats which are one square metre in area.obtain representativness, is the number at which a These quadrats can either remain fixed to the100% increase in sample numbers will only lead seabed or they can be repeated with reference toto a 5-10% improvement in accuracy. fixed markers. Photographs can also be extremely
It is also essential that samples are replicable so useful for bottom sampling.that results from different sites can be compared With sessile organisms it is also possible toand contrasted, and so that repeat samples of the record competition for space, survival andsame site can be taken over time in order to succession. This is done by sampling theobserve any changes. The only way to ensure settlement patterns over a period of time. Inreplicability is to record the approach and planning such a survey, it is important tomethodology used right from the planning stages, determine the frequency of sampling dependingthrough to field work and subsequent analysis. on the data required (e.g. bivalve settlement dates,
3.1.5 Some common sampling approaches
Estuarine finfish are best sampled by set gill needs to be made on whether it is necessary tonets, of about 75mm mesh size and about 150 sample different levels in the water column.metres long. It is probably best if the sampling Common substrates include tiles, rope, bamboo,net conforms to the equipment used by local slate.fisherfolk. Aerial photographs are often used to For this exercise, samples of the substratedetermine the best location for setting the nets. material are deployed in pairs at the pre-They are usually set at high tide, parallel to the determined depth or depths and at the pre-mangrove fringe or across small creeks, and determined time intervals. On each visit, a newcollected some six hours later at low tide. The pair of substrate samples are deployed and one ofexercise needs to be repeated at least three times, the previous pair is removed for analysis. Thisdepending on variability and the state of the tide provides a record of what settlement has takenmust be consistent each time. Care must be taken place between visits and records the survival rateto take into consideration the time of day and the of different species and different age classes ofweather conditions during the sampling period and the same species. It can also
o
growth rate, fouling organisms, etc). Thesubstrate that is to be used to attract settlementmust be chosen very carefully and a decision
25
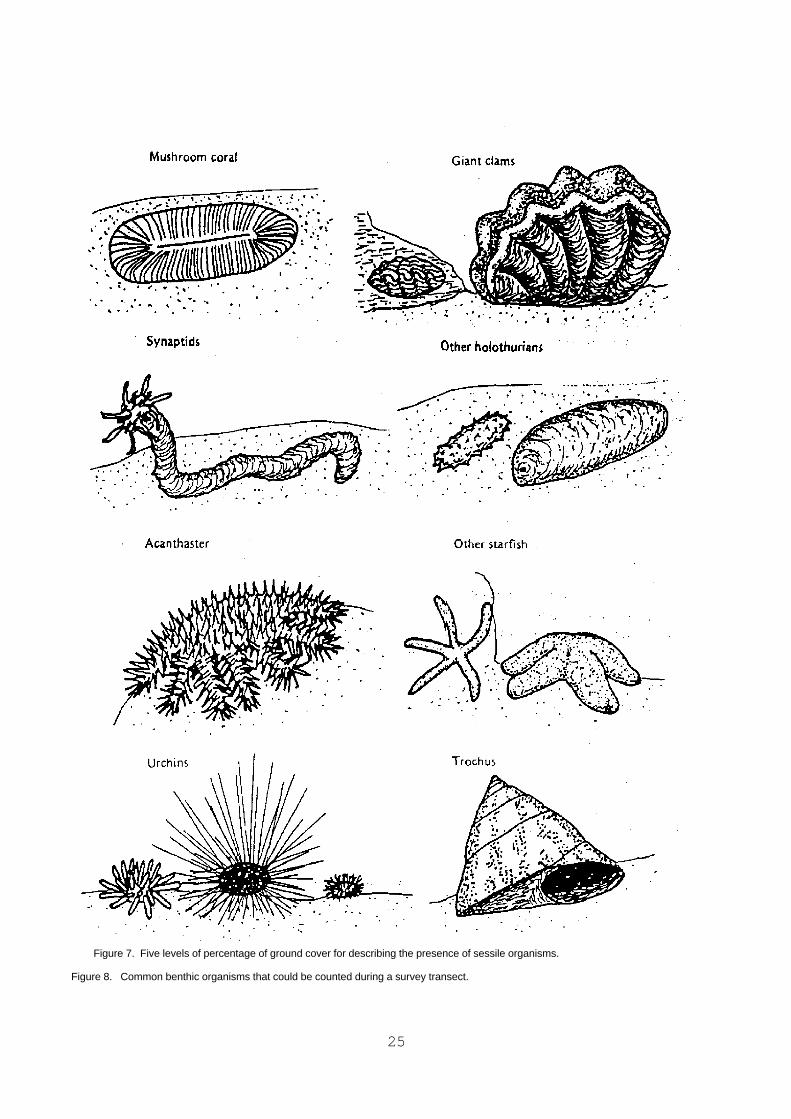
Figure 7. Five levels of percentage of ground cover for describing the presence of sessile organisms.
Figure 8. Common benthic organisms that could be counted during a survey transect.
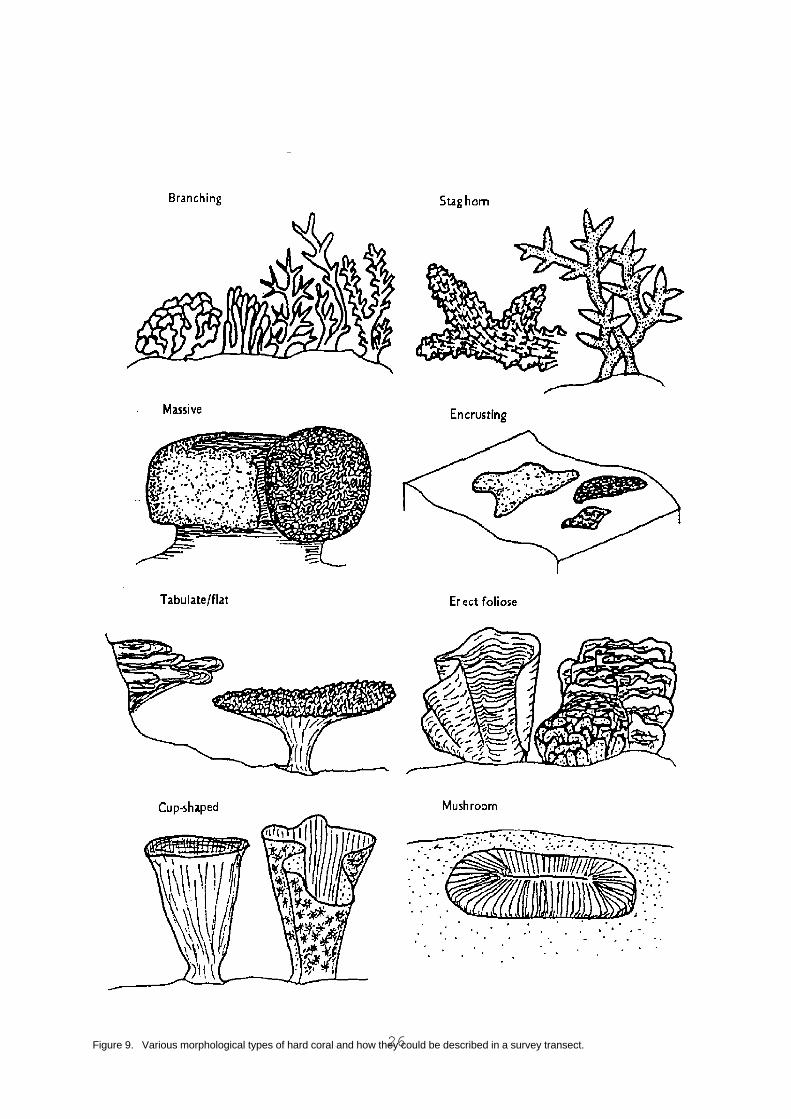
26Figure 9. Various morphological types of hard coral and how they could be described in a survey transect.
27
indicate prefered substrates, provide an insight the products of monitoring (data) must beinto zonation with depth, identify high and low subjected to meaningful processing, analysisseasons for different species and record and interpretation; and,succession patterns. monitoring must set in motion pre-determined
The picture can be made even more complete action by previously identified individualsif the settlement sampling is complemented by according to agreed contingency plans.plankton samples (see above). They shouldindicate the planktonic stages of sessile organisms As an example, the objectives of a monitoringbefore they settle and could permit reasonably strategy following a coastal development, couldaccurate forecasting of settlement. The life stages be:can be taken back to an even earlier stage by to document the success or otherwise of thesampling the adult population which is thought to project;be the source of the planktonic larvae and the to ensure that impacts are no worse thansubsequent settlement. By taking gonad samples predicted;and assessing their stage of maturity, it should be to guard against unpredicted, unplannedpossible to predict when the larvae are going to outcomes;appear in the plankton and when they are likely to to act as an early warning system and providestart settling. Such a sampling strategy is often an information base for necessary action.used to predict the settlement of mussels, oystersand other commercially valuable organisms. Since monitoring can be very expensive and
3.2 MONITORING
3.2.1 Objectives and principles of monitoring
Survey is the methodical gathering of datawhile monitoring is regular, repetitive surveys.
Monitoring may be carried out for a variety ofreasons :
to discover what there is, find out the situationto discover change, determine trendsto assess impactto check predictions and forecaststo check compliance with regulationsto measure performance and effectiveness.
Having determined why monitoring needs to becarried out, it is important to determine what is tobe monitored, and where - this requires planning.
Unfortunately much monitoring is undertakenwithout adequate justification or planning. Thisresults in extravagant and expensive masses ofdata being collected, never to be used.
For monitoring to be meaningful, effective andfully justified, it must satisfy most, if not all, thefollowing criteria -
it must be according to clear objectives of whatis to be monitored, and why;no more than the minimum number of simplemeasurements or observations should be made;monitoring should be carried out with theminimum frequency;
exasperating, care must be taken to ensure thatmeasurements are no more than is necessary.Neither should measurements be any more thancan be usefully anaylzed - excessive data are notonly useless, they are also expensive.
Those undertaking field measurements, as areoften necessary for survey and monitoring, mayencounter a number of difficulties such as accessto the site, weather, state of the tide, season, timeof day, etc. It must be remembered that the easierit is to collect the data, the more likely that thedata will be reliable, consistent and applicable.
It is also extremely important to guard againstpersonal and subjective interpretation of the data.Most monitoring programmes are usually of longduration and they may go beyond the change ofpersonnel. It is therefore imperative thatinterpretation of the data must be objective andaccording to measureable parameters, and doesnot rely on the analyst.
Routine and boring analyses, performedmanually, increase the risk of mistakes.Therefore, if at all possible, repetitive tasks shouldbe automated. This ensures consistency andreduces the chances of error.
A common objective of monitoringprogrammes is to ensure that certain criteria arebeing met, or other conditions upheld. In suchcases, it is necessary to plan for what action willbe taken when monitoring indicates that theselimits are in danger of being exceeded. It is notenough to document and record the deteriorationof the coastal environment - what is more
28
important is the action that will be taken to arrestthe deterioration before it exceeds what has beendetermined as acceptable. There needs to be acommitment to such remedial action with clearlyidentified responsibilities - who does what - whichwill be triggered by the results of monitoring.
3.2.2 Indicator species
Long-term monitoring seeks to identifychanges that were not predicted. One way inwhich this can be done is through the sampling ofa reliable indicator species.
Not every species can be used as an indicatorspecies. Indicator species must show a markedresponse to environmental stress. They need to beeither exrtremely tolerant or extremely susceptibleto change. Their response can be manifested bytheir physical presence or absence, by theirbehaviour, or by their anatomical or physiologicalreactions. Ideally, the individual members of anindicator species should be of consistent anduniform morphology so that when anatomicalchanges occur they are uniform and noticeable.They must be easy to see and identify, and easy tosample if they are present.
The coral reef is a difficult environment tosearch for indicator species because the organismsand ecological assemblages are highly variableand changes are often not related to humanactivities. Factors which cause stress to coralsmay also do so in a manner which is difficult todistinguish.
However, an ecological expert with good localknowledge, may be able to select one or moreindicator species even from among a difficultgroup such as corals. For example, corals withfinely branching structures or those with cup-shaped morphology, are often more vulnerable toincreases in suspended sediment than the massivecoral varieties. While the growth pattern of somecup corals may be influenced by high sedimentloads to make them more tolerant, theirmorphological adaptations can be used asindications of higher than normal sediment loads.The most common adaptation under suchcircumstances is for the cup corals to form onlyincomplete cups so sediment can be excluded atthe base.
3.3 INFORMATION MANAGEMENT
What should be done with the results of surveyand monitoring?
There is a distinction between data andinformation. Survey and monitoring produce datawhich are most often screeds of figures and rawobservations of very little use to anyone in theircrude state. These data must be transformed intoinformation which is an accessible, retrievableand user-friendly product. The transformation ofdata into information comprises processing,analysis, interpretation and eventaully applicationand this process can be referred to as data orinformation management.
The type and format of information depends onthe needs of the user or users, and this relates backto the objectives of survey and monitoring in thefirst place. The various formats for informationmanagement and display can be grouped looselyinto six categories - simple tabulation, matrix,graphics, databases, maps and plans, and GIS.
3.3.1 Simple Tabulation
This is probably the most commonly usedformat for displaying numerical data. By usingrows and columns in a logical manner, a table canprovide visual relationships and connections andtransform raw data into information.
3.3.2 Matrix
Almost by definition, a matrix is expected to bemore complex than a simple tabulation. Itprovides an analytical relationship between data ina visual display - a cumulative visual summary ofall impacts on all resources.
For example, a matrix can be used to assess theimpacts on coastal resources of an activity such asdredging. In such a matrix, all resources(including amenity values, uses, etc) are listed onthe vertical

29
LIST OF RESOURCES AND SIGNIFICANCE WEIGHTING
Example of the coastal resources hat could be contained on the vertical axis (the extreme left hand column) of the matrix. Next to each resource is also a tentative weighting factor (from 1 to 5) reflecting perceived significance.
PEOPLE ECOSYSTEMS PHYSICAL LANDSCAPEresidents' quality of life 5 shellfish productivity 4 current regime 4 landform 3leadership 4 other estuarine fisheries 3 water quality 5 aesthetics 2village / community 4 mangrove system 5 salinity land / water interface 2local administration 3 seagrass meadows 4 3 vegetation 3people's health 5 seaweed resources 3 water clarity 3people's access 3 coral reef system 4 riverbank stability 4church 3 estuarine wetlands 4 sediment quality 2school, education 3 island systems 3 bathymetry 2 OTHERfisherfolk 4 rare, threatened species 5 industrial water intakes 3traditional fishing rights 4 other sensitive systems 4 tourism facilities 4subsistence fishing 4 locally-endemic species 3 recreational boating 2commercial fishing 3 gene pool 5 AGRICULTURE port facilities 4aquaculture 3 drainage patterns 3other employment 4 soil quality 3markets 3 groundwater quality 4causeways, roads 4 irrigation water 4
stock watering 4
LIST OF IMPACTS AND DURATION FACTOR
Examples of the impacts (including the different phases, activities and processes) that could be expected from a dredgingoperation and could be listed on the horizontal axis of the matrix. Next to each impact is also a tentative indication of theexpected duration factor.
DREDGE OPERATION DREDGED ESTUARY SPOIL DUMP EARTHWORKSstockpiling,operations yard 1 erosion dust 2 reclamation 3noise 1 2 smell 1 trampling (machinery) 2hydrocarbon spillages 2 accretion 2 silt suspension 2 materials stockpiling 1obstruction 1 salt-wedge intrusion 3 various leachates 2 armouring 3wetlands destruction 2 groundwater contamination 3 barrier to drainage 3 transport of material 1litter 1 removal of sediment 3 agriculture suppression 3 new access roads, etc 3fire risk 1 increased flushing rate 3 mangrove suppression 3 seawalls 3smell 1 other wetlands suppression 3silt in suspension 1 morphological profile 2various leachates 2 intrusive structures 2
Worked examples of a few interface boxes of a matrix for tabulating data on the impacts expected from a dredging operation.(Note that these are examples only and not intended for implementation).
RESOURCESI M P A C T S
NOISE SEDIMENT/SILT
RESIDENTS'QUALITY OF LIFE consultants $2500, 1 man/month.
Impact index 1X1X5= 5 Impact index 2X2X5= 20
WHO noise standards; determine dredge noise and indirect impact on people through impact ondistance from homes; work out tolerance; shellfish - see under shellfish.
no alternatives, no quieter dredge; limit operation to see under shellfish.10-hour day near homes; extra 3 months work.
SHELLFISH RESOURCES
Impact index 0X1X4= 0 Impact index 2X2X4= 16
not applicable determine sellfish beds downstream; determinetolerance; research IMR,$5000, 3 man/month
not applicable alternative options - spoil dump management,geotextile curtain; implement management withcurtain backup; additional cost minor.
Figure 10. Examples of coastal resources and impacts and the way in which their relationship can be recorded on a matrix.
30
axis, together with a numerical weighting factor accurately as possible. It is important for graphic(say from 1 to 5) to reflect the perceived representations to be kept simple, avoiding cluttersignificance or value. All impacts (from various and avoiding the need for interpretation - if theyphases, activities and processes) are listed on the cannot convey the information without resortinghorizontal axis, together with a weighting factor to explanatory text, it may be better to simply relyreflecting the expected duration of the impact (1 on the text.= short term, 2 = long term, 3 = irreversible). Infact, the preparation of these two lists is already avery useful exercise providing a mental checklistof areas of contention. A database can be defined as a collection of
Having listed all the resources and all the data related to a particular topic or for a particularimpacts, the next stage is to relate, in an analytical purpose. A database management system storesmanner, the items on the vertical axis with those and retrieves data in the form of information.on the horizontal axis. This relationship can in Simple databases can range from a field notebook,most cases be translated into a numerical impact to a filing cabinet, a card index, a photoindex. Wherever the grid intersects, a judgement collection, a bibliography, etc.is made of the severity of the particular impact on A computerized database management systemthe particular resource, and this can range from 0 is a software programme used to store and retrieve(no impact, not applicable) to 3 (high impact). data or information on computer. Much has beenThe numerical value representing impact severity made of electronic databases in recent time and itis multiplied by the figure for impact duration and is worth remembering that the database is madethe result is multiplied further by the figure up of what the user puts in - the computer onlyrepresenting the resource significance or value. provides the system that stores and retrieves data.The resulting figure can be called the impact However, a relational database managementindex and it provides an excellent comparative system has the added ability to manage the systempicture of where the problem areas of a in a related manner. This means that changes ordevelopment are likely to arise. It must be updates in one cluster of data, will be reflected instressed that the impact index is not an absolute a related cluster.figure but only a comparative one within the same Before investing time and money in setting upimpact assessment exercise. Although it is not a database, especially if it is a sophisticatedable to be used for comparison across projects, it electronic one, it is essential to determine at thecan certainly provide useful information on the outset the purpose of the database, who will use it,comparative costs and benefits of various what are his/her needs, which are the mostmitigation measures proposed within a project, as important parameters or fields or data sets, and thewell as a good picture of cumulative impacts. relationship between them.Although it is only relative and indicative, ratherthan absolute, it can be a very useful andinexpensive data analytical tool in the hands of anexperienced assessor.
Examples of the lists of resources and impacts Maps and plans of coastal resources representand a worked example of a few interface boxes of a significant advance from tabulations, matricesthe matrix are given in Figure 10 above. and graphic presentations of the results of survey
3.3.3 Graphics
Graphic presentation of the results of survey user to collate, analyse synthesise and apply largeand monitoring can range from common graphs to amounts of information, in a simple, visualcomplicated illustrations. The latter can be hand- representation. They can juxtapose resource datadrawn or photographic images. Although they are and demands on resources; and they can indicatenot expected to have a degree of accuracy that conflicting demands and potential impacts beforewill enable them to be used as identification they occur. guides, all illustrations of plants and animals Maps and plans are a versatile and sound basisshould depict what they are trying to represent as for decisions on resource use. They are an
3.3.4 Databases
3.3.5 Maps and Plans
and monitoring. Maps and plans truly transformdata into information since they present the resultswithin a spatial, geographic context, giving theman added dimension. Maps and plans allow the

31
excellent tool for professional managers of coastalresources.

32
Figure 11. An example of a coastal resources map from New Zealand Atlas of Coastal Resources.
They can expose weaknesses in the available maritime influence on land as well as theinformation base and help focus research efforts. terrestrial influence on water. They also includeThey can inform members of the public, making a third dimension of depth, taking in water volumethem more sensitive to the multiple issues that with vertical variability. Coastal areas have fuzzyneed to be resolved. They are a good early guide boundaries both physical (land and sea interface)for developers and a good departure point for any and administrative (coastal area limits forassessment of the potential impacts of a proposed management purposes). Finally, the coastal areadevelopment. They are a very good source of has a wide array of scales and processes - fromformal educational material both at the secondary the microscopic biological processes, to chemicaland tertiary levels. Finally, they are an excellent ones, from the spread of the Exclusive Economicrecord and a subsequent measure, for policies, Zone (EEZ) to the millimetres of sea level rise.objectives and goals for coastal area management. An ideal GIS would be able to deal with these
Maps and plans can accommodate an enormous requirements and complexities, but none does asamount of information, but they need to be yet, at least not completely. Most good GISdesigned by a professional cartographer in order programmes can handle the third dimensionto finish up as a good, useful product. Figure 11 (depth), but a fourth dimension (time) is stillis an example of a resource map taken from the beyond existing software.New Zealand Atlas of Coastal Resources (Tortell, GIS therefore has limitations, but in spite of1981). these limitations, it is an excellent tool for coastal
3.3.6 Geographic Information Systems (GIS)
A GIS is a computer-based system that caninput, retrieve, analyze and display geographicallyreferenced information. It is often erroneouslyregarded as synonymous with, or closely tied toremote sensing, database management, computer-aided design (CAD), and computer cartography.In fact, it is allied to all these and has somecommon elements with some of them. However,it is a unique tool, very sophisticated, andcomprising elements of all except perhaps, remotesensing.
There are a number of benefits and advantagesof GIS in resource management :
it integrates data of various types (graphics,text, digital, analogue);it has an enhanced capacity for data exchangeamong disciplines or departments;it can process and analyse data very efficientlyand effectively;it can apply models, testing and comparingalternative scenarios;it has a facility for efficient updating of data(including graphic data);it has the ability of handling large volumes ofdata.
The dimensions of integrated coastal areamanagement are very broad and encompass the
area planning and management and an efficientmechanism for handling data and tranforming itinto information.
3.4 WORKED EXAMPLE
The following worked example is a summaryof the processes described above, i.e. the role ofsurvey and monitoring in integrated coastal areaplanning and management.
A fictitious locality called “Seaside Bay” willbe used for the purpose of this example. SeasideBay can be considered as an average sort of baysurrounded by a mixture of permanent residents,tourists and visitors in season, and a small amountof industrial activity.
3.4.1 The existing situation
A coastal area management plan has beendeveloped and adopted for Seaside Bay with broadpublic participation. Through survey and datagathering, the plan reflects the communityconsensus on the ecological and other resources ofSeaside Bay, their uses, the demands made onthem, the value placed on them by the community,and the relative priorities. This baselineinformation is summarised in a detailed resourcemap of the bay which shows various zones whichguide day-to-day managers and decision-makers.

33
For example, it has been determined that a received and having conducted its own survey andparticular part of the bay is excellent for oyster research. They are likely to ask for the advice offarming. It is also known that this activity various experts and will eventually grant orprovides employment for a significant number of decline the application. If the application isfamilies directly and an even greater number of granted, conditions will need to be attached tofamilies indirectly. Data are available on the ensure that the factory will not jeopardize theincome generated by the oyster farming industry water quality standards and that the oysterthrough the sale of oysters, the servicing of the farming industry is protected.operation, and by attracting tourists. Oyster Once approval is given and the factory is built,farming is therefore a priority resource which the local authority staff will need to monitor themust be managed on a sustainable basis. effluent discharge to ensure that the levels of
In order to ensure protection of the oyster contaminants set in the conditions of the permitfarming industry, surveys have determined the are not being exceeded. They must also monitormost important requirements of oysters. These the receiving waters of the bay to ensure thatinclude, for example, no oil or other hydrocarbons water quality standards are being respected.in the water because of tainting, and a certain Finally, they must also do periodic checks of theminimum concentration of dissolved oxygen. various resources identified in the coastal areaThese two parameters, as well as a number of management plan to ensure that they are not atothers, have been adopted as water quality risk. Occasionally, the local authority will need tostandards for Seaside Bay. The local authority for repeat its survey of ecological baseline conditionsSeaside Bay is seeking a mathematical model it as a pre-emptive, precautionary measure.can apply to determine the assimilative capacity Eventually, new survey will be needed when theof the bay for a number of critical parameters. Integrated Coastal Area Management Plan isUnfortunately, mathematical models are reviewed, which should be about every five years.expensive and therefore, for the moment, the localauthority ensures that water quality standards arenot exceeded by an effective monitoringprogramme.
3.4.2 Proposed development
A developer proposes to build a factory andapplies for the necessary permits and consents.
The Environmental Impact Assessment (EIA)Process is applied and closely tied to theintegrated coastal area management process.Among other things, the factory is expected torequire diesel as the fuel source and will have aneffluent discharge which will include highbiochemical oxygen demand (BOD).
Unless the original ecological data baseline isconsidered to still be reliable and up-to-date, anew survey will need to be undertaken by thedeveloper for the EIA. There will be a number ofsubmissions probably from individuals, from theoyster farmers and their organization, from thetourist hotel operators, and from others such asscientists, etc. Some of these individuals andgroups will conduct their own survey and datagathering, or they may rely on information whichalready exists.
The EIA Review Board and/or the PlanningAuthority, will assess the proposal as described inthe EIA, in the light of all the submissions
REFERENCES
Dahl, A L (1981) Coral Reef Monitoring Handbook. South Pacific Commission, Noumea.
Kam, S P, Paw, J N, and Loo, M (19xx) The useof remote sensing and geographic informationsystems in coastal zone management. In:Integrative Framework and Methods forCoastal Area Management. ICLARM, Manila.
McCracken, J A, Pretty, J N, and Conway, G R(undated) An Introduction to Rapid Rural Appraisal for Agricultural Development.International Institute for Environment andDevelopment.
Tortell, Philip (1981) New Zealand Atlas of Coastal Resources. New Zealand Government
Printer, Wellington.
Tortell, P, Collins, D, DuBois, R, Gwyther, D, and Sedlak, O (1992) Environmental Guidelines for Dredging and River Improvement. United Nations Food & Agriculture Organization (FAO), Rome.
Tortell, P (1992) Coastal Zone Sensitivity

34
Mapping and its Role in Marine EnvironmentalManagement. Marine Pollution Bulletin 25(1-4):88-93.


