15
Oct 2008 The Brazilian Economy
| Date post: | 05-Jan-2016 |
| Category: |
Documents |
| Upload: | adelia-barber |
| View: | 222 times |
| Download: | 0 times |

Oct 2008
The Brazilian Economy

Global Slowdown …
World Growth
1%
2%
3%
4%
5%
6%
19
98
19
99
20
00
20
01
20
02
20
03
20
04
20
05
20
06
20
07
20
08
20
09
20
10
20
11
20
12
1%
2%
3%
4%
5%
6%
Base caseStressOptimistic
Global Slowdown …
World Growth (2009, %)
0.3 0.5
8.5
-0.5
7.5
0.7
0
1.3
9.2
-2
0
2
4
6
8
10
USA Euro Area China
base case
stress
optimistic

Commodity Prices to Fall…
Last Quarter 2008 2009Baseline 384 345
% baseline vs last price -2% -12%Stress 376 305 % stress vs last price -4% -22%
Last price (07/10): 392

…affecting Brazil
Stress: Direct effect (lower export growth)
Stress: Total effect (lower export growth,
consumption and investment)
GDP growth (4Q/4Q, %)
1.5
2.0
2.5
3.0
3.5
4.0
4.5
5.0
5.5
6.0
6.5
4T
-07
1T
-08
2T
-08
3T
-08
4T
-08
1T
-09
2T
-09
3T
-09
4T
-09
1T
-10
2T
-10
3T
-10
4T
-10
1.5
2.0
2.5
3.0
3.5
4.0
4.5
5.0
5.5
6.0
6.5
Base case
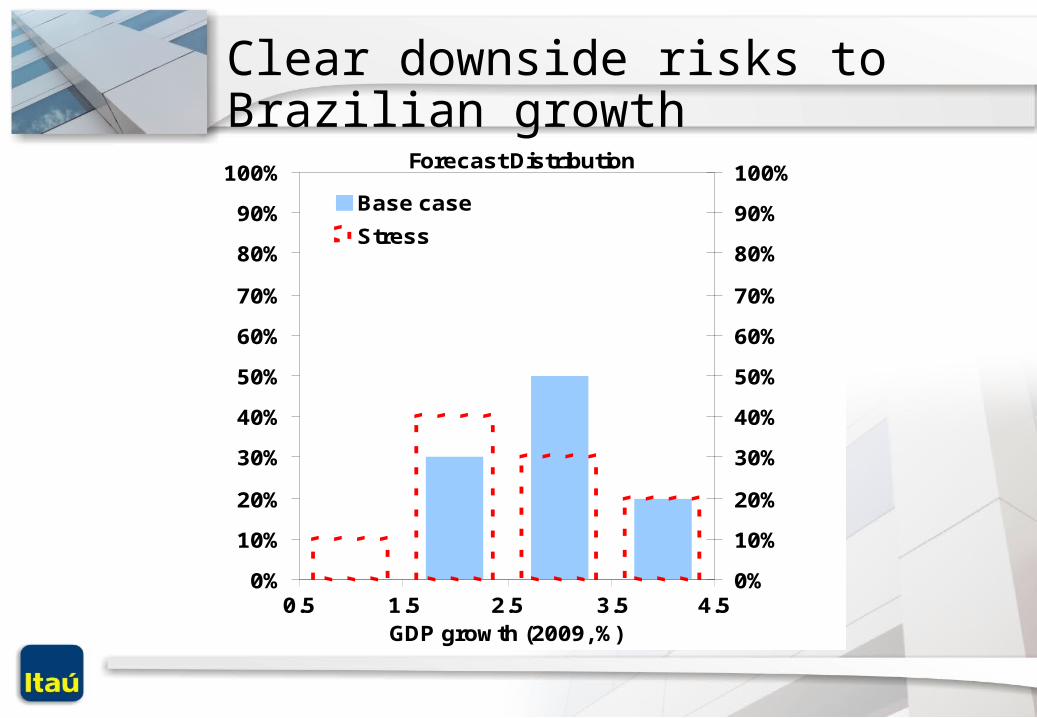
Clear downside risks to Brazilian growth
Forecast Distribution
0%
10%
20%
30%
40%
50%
60%
70%
80%
90%
100%
0%
10%
20%
30%
40%
50%
60%
70%
80%
90%
100%
Base case
Stress
GDP growth (2009, %)1.5 2.5 3.5 4.50.5

Expanding potential output
Potential GDP growth (4Q/4Q)
-4%
-3%
-2%
-1%
0%
1%
2%
3%
4%
5%
6%
4Q-9
6
2Q-9
7
4Q-9
7
2Q-9
8
4Q-9
8
2Q-9
9
4Q-9
9
2Q-0
0
4Q-0
0
2Q-0
1
4Q-0
1
2Q-0
2
4Q-0
2
2Q-0
3
4Q-0
3
2Q-0
4
4Q-0
4
2Q-0
5
4Q-0
5
2Q-0
6
4Q-0
6
2Q-0
7
4Q-0
7
2Q-0
8
productivity
capital
human capital
natural capital utilization
natural unemployment rate
potential output

Public Debt
Premises:
Social security expenses, transferences to state and local governments and wages are considered rigid, they represent 2/3 of total expenditures. Other expenditures growth with GDP.
GDP growth of 2.8% in 2009 and 2010.
Currency devaluation impact is considered with an exchange rate of R$/US$ 2.0
Public Debt
34%
36%
38%
40%
42%
44%
2006
Q4
2007
Q1
2007
Q2
2007
Q3
2007
Q4
2008
Q1
2008
Q2
2008
Q3
2008
Q4
2009
Q1
2009
Q2
2009
Q3
2009
Q4
2010
Q1
2010
Q2
2010
Q3
2010
Q4
% GDP
Surplus=4.30 USD=1.64R$
Surplus=4.30 USD=2.00R$
Surplus=3.82 USD=2.00R$
GDP Growth (%)Primary Surplus
(%GDP)2.5 3.752.8 3.823,0 3.863.5 3.974,0 4.085,0 4.30
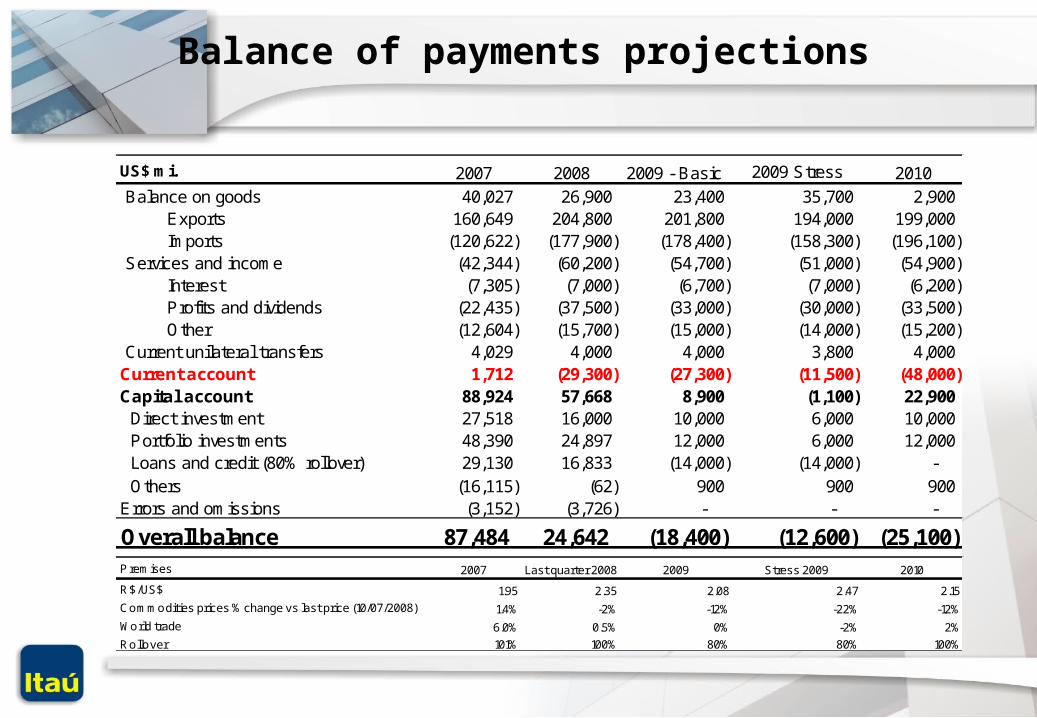
Balance of payments projections
US$ mi. 2007 2008 2009 - Basic 2009 Stress 2010 Balance on goods 40,027 26,900 23,400 35,700 2,900 Exports 160,649 204,800 201,800 194,000 199,000 Imports (120,622) (177,900) (178,400) (158,300) (196,100) Services and income (42,344) (60,200) (54,700) (51,000) (54,900) Interest (7,305) (7,000) (6,700) (7,000) (6,200) Profits and dividends (22,435) (37,500) (33,000) (30,000) (33,500) Other (12,604) (15,700) (15,000) (14,000) (15,200) Current unilateral transfers 4,029 4,000 4,000 3,800 4,000 Current account 1,712 (29,300) (27,300) (11,500) (48,000) Capital account 88,924 57,668 8,900 (1,100) 22,900 Direct investment 27,518 16,000 10,000 6,000 10,000 Portfolio investments 48,390 24,897 12,000 6,000 12,000 Loans and credit (80% rollover) 29,130 16,833 (14,000) (14,000) - Others (16,115) (62) 900 900 900 Errors and omissions (3,152) (3,726) - - -
Overall balance 87,484 24,642 (18,400) (12,600) (25,100) P remises 2007 Last quarter 2008 2009 Stress 2009 2010
R$/US$ 1.95 2.35 2.08 2.47 2.15Commodities prices % change vs last price (10/07/2008) 1.4% -2% -12% -22% -12%World trade 6.0% 0.5% 0% -2% 2%Rollover 101% 100% 80% 80% 100%

Brazilian liabilities(US$ bi.) 142
70 59
-
20
40
60
80
100
120
140
160
Equity in Brazil ¹ Debt maturing in 12months²
Domestic bonds ¹
1- Itaú estimated data of Sep/08 - R$/US$ 2.2 2- Central Bank estimated data of Aug/08
Brazilian Liabilities

Policy Options
• The central bank is addressing the scant international credit lines instead of wide intervention on the exchange rate
• Monetary policy faces the challenge of keeping inflation on target in an uncertain international environment.
• The prudent decision is to adopt a wait and see stance • Tighter fiscal policy may help to avoid crowding out of
private investment
Baseline Scenario
• Main hypotheses: – Monetary policy: is 7% more effective (due to increased funding
cost) and aims at bringing inflation back to the target in 2009– Primary fiscal surplus: raised to 4.3% of GDP in 2008 and 2009– GDP trend growth: 5% p.a. in the forecasting horizon– Exchange rate: remains constant in real terms– Inflation expectations: 6.5% for 2008, 5.0% for 2009, 4.5% for 2010– Administered prices: 4.0% in 2008 and 6.2% in 2009– Average commodity prices fall 6.5% from current levels in 2008 and
an additional 7% in 2009; the quantum of international trade grows 0% p.a. in 2009 and 2% in 2010

Baseline Scenario
Period Nominal Interest CPI (IPCA) IGP-M Real Real CDS
exchange rate inflation inflation GDP growth interest Brazil
rate target y-o-y y-o-y y-o-y rate y-o-y 5 y
Year Q (BRL/USD) (% p.a.) (%) (%) (%) (%) (bp)
2007 4 1.79 11.25 4.46 7.75 5.4 7.3 96
2008 1 1.74 11.25 4.73 9.10 5.8 6.6 149
2008 2 1.66 11.80 6.06 13.44 6.0 5.1 110
2008 3 1.67 12.97 6.25 12.31 5.8 5.4 139
2008 4 2.00 13.97 6.49 12.32 5.3 5.8 210
2009 1 2.01 14.25 6.57 11.64 4.6 6.6 210
2009 2 2.02 14.25 5.58 8.41 3.7 8.2 202
2009 3 2.04 13.99 5.62 8.02 3.1 8.4 195
2009 4 2.05 13.24 4.45 5.09 2.9 9.5 188
2010 1 2.07 12.23 4.10 4.74 3.2 9.3 181
2010 2 2.09 11.51 3.85 4.46 3.9 8.9 174
2010 3 2.10 11.00 4.09 4.72 4.6 7.9 168
2010 4 2.12 10.48 4.60 5.28 4.8 6.7 162
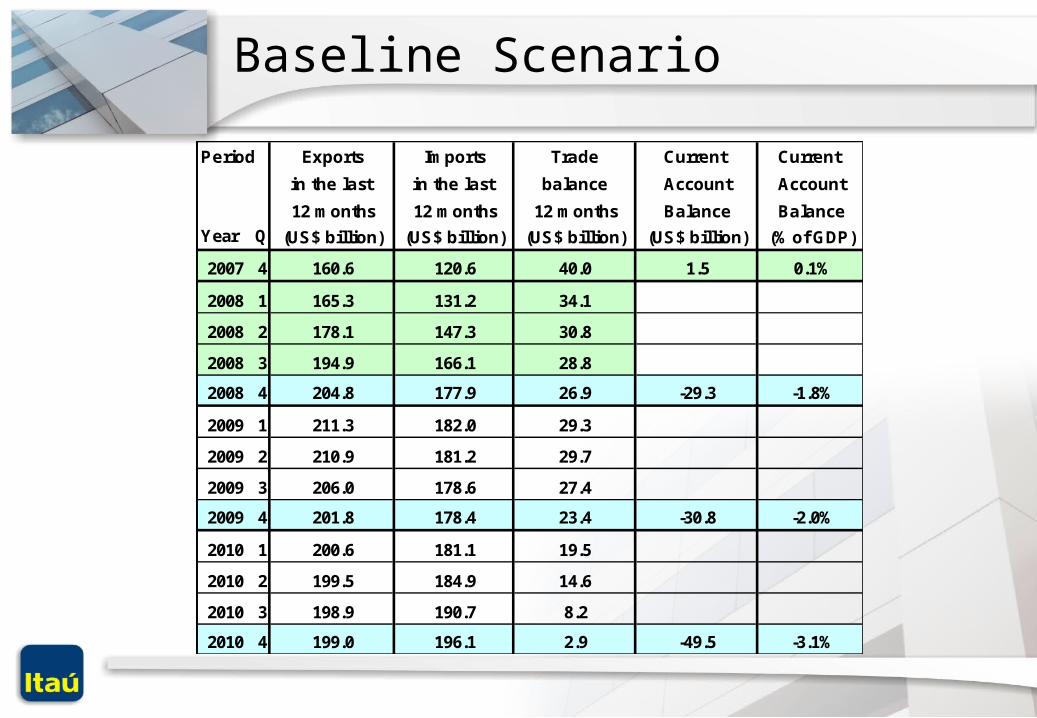
Baseline Scenario
Period Exports Imports Trade Current Current
in the last in the last balance Account Account
12 months 12 months 12 months Balance Balance
Year Q (US$ billion) (US$ billion) (US$ billion) (US$ billion) (% of GDP)
2007 4 160.6 120.6 40.0 1.5 0.1%
2008 1 165.3 131.2 34.1
2008 2 178.1 147.3 30.8
2008 3 194.9 166.1 28.8
2008 4 204.8 177.9 26.9 -29.3 -1.8%
2009 1 211.3 182.0 29.3
2009 2 210.9 181.2 29.7
2009 3 206.0 178.6 27.4
2009 4 201.8 178.4 23.4 -30.8 -2.0%
2010 1 200.6 181.1 19.5
2010 2 199.5 184.9 14.6
2010 3 198.9 190.7 8.2
2010 4 199.0 196.1 2.9 -49.5 -3.1%