23
Page Title 1 October 2015 | www.IRPJournal.com IRP

Page Title
1
October 2015 | www.IRPJournal.comIRP

Page TitleOctober 2015 | www.IRPJournal.com
2
IRP
Fidessa_Waters Technology Advert_A$_01.indd 1 27/04/2015 15:49

3
October 2015 | www.IRPJournal.comIRP Contents
CEF Investors Have Abandoned HY Bonds - Sundial Capital Research
Dividend Yield & Growth to Generate Portfolios - Thomas Quantitative Group
Sell When You Can, Not When You Have To - Rareview Macro LLC
Northrop Grumman Corp - Management CV
It’s Like 2011 All Over Again - Ned Davis Research
A Picture is Worth 1000 Words - Phases & Cycles
Japanese Record Breaking Tourist Demand - Storm Research
Can SME Research Be Saved? - ResearchPool
Directory
CONTENTS04
06
08
10
12
14
16
18
20
Fidessa_Waters Technology Advert_A$_01.indd 1 27/04/2015 15:49
For advertising enquiries contact [email protected]
For research enquiries contact [email protected]

October 2015 | www.IRPJournal.com
4
IRP CEF Investors Have Abandoned HY Bonds`
CEF INVESTORSHAVE ABANDONEDHY BONDS
Jason GoepfertSundial Capital Research Inc.

5
October 2015 | www.IRPJournal.comIRP CEF Investors Have Abandoned HY Bonds
To see the full report from Sundial Capital Research contact:
Jason Goepfert
888-795-9893
http://sentimentrader.com
Potential troubles in various parts of the bond market have been a major drag among investors, and not just those focused on bonds.
The bond market is about twice the size of the stock market, and major troubles in bonds can leak over to stocks. The “taper tantrum” in May 2013 preceded a 5% pullback in stocks over the next month, interrupting what had been six months of an uninterrupted uptrend.
There are multiple concerns, ranging from likely defaults in troubled sectors to in-and-out trading by high-frequency trading firms to massive funds holding illiquid bonds and not much cash to meet redemptions.
Due in part to those issues, investors have been fleeing some of the higher-risk tranches of the market. The most popular high-yield exchange-traded fund, HYG, has dropped more than 2% over the past two weeks and is tickling its lowest close this year.
It isn’t just ETFs and mutual funds that are struggling. Closed-end funds tend to bear the brunt of the whims of individual investors, and many of them have been driven to near-record discounts to their underlying values.
Let’s look at some of the high-yield closed-end funds with the longest history and see how current discounts compare to the past.
The chart above shows the average discount in eight funds from the high-yield closed-end bond fund category in Barron’s that have history dating to at least 1990. For comparison, we also look at the average price of those funds, along with a Credit Suisse index that is closely tracked by ETFs like HYG and JNK.
While some have argued that these funds are in for a new paradigm of constant discounts, in the past such huge dislocations have usually led to rebounds in their prices. The recent discount of more than -15% has been exceeded only twice in the past 25 years, in October 1990 and October 2008, both periods of panic that led to a persistent decline in the funds’ discounts.
Returns in the tables are from one month after the discount bottomed at more than -12%, which triggered on September 22, since the discount on these funds bottomed at -15.8% on August 24. It wasn’t perfect, and there aren’t many precedents, but those looking for investments in CEFs or even funds like HYG should probably be enthused about potential forward returns.
“The recent discount of more than -15% has been exceeded only twice in the past 25 years…”

October 2015 | www.IRPJournal.com
6
IRP
• Use individual factors’ score to sort each portfolio from most favorable to least favorable. For example, using dividend yield values, companies with high values are sorted to the top and those with the low values are toward the bottom.
• Divide the portfolio universe into five equal ranked groups.• Hold the most attractive securities, based on the factor’s
rankings, in Quintile one (Q1) while Quintile five (Q5) contains the worst prospects.
• Equal weight the individual company returns within each quintile group.
• Compute each company’s monthly returns as price change plus dividend, assuming no reinvestment.
• The S&P 500 index performance is total returns with dividends reinvested and the Russell 1000 index is price returns.
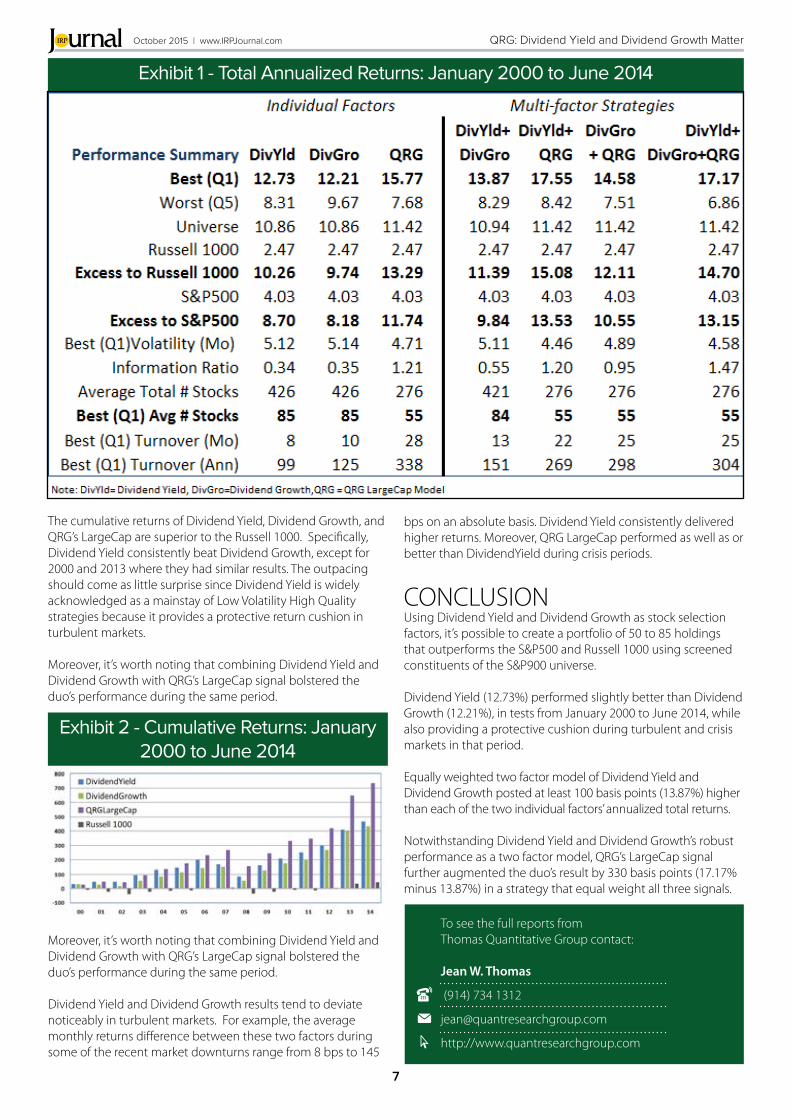
RESULTSExhibit 1 displays total annualized returns for the strategies. The multi-factor formulations equal weight the respective signals. Results are based on buying Quintile one (Q1), which is the best ranked portfolio and rebalancing it monthly.
The individual factor and multi-factor strategies outpaced the S&P500 and the Russell 1000 with portfolios of 55 to 85 stocks. Also, formulations that include QRG’s proprietary signal outperformed these benchmarks by much wider margins.
QRG: Dividend Yield and Dividend Growth Matter
Jean W. Thomas President & CEOThomas Quantitative Group, LLC
DIVIDEND YIELD & DIVIDENDGROWTH STRATEGIES
PROPRIETARY ENHANCEMENT MATTERS
OBJECTIVEThis analysis illustrates the use of Dividend Yield (DivYld) and Dividend Growth (DivGro) measures to generate portfolios of approximately 50 stocks from the S&P900 universe. In keeping with this goal, we also reviewed the combination of the said factors with QRG’s LargeCap model to provide some insights on how the duo’s results could be enhanced by proprietary factors.
SCREEN FOR PORTFOLIO CANDIDATESStarting with the S&P900 universe, we performed the following screens for each monthly period to ensure universe consistency over the entire analysis period – January 2000 to June 2014:• Screen for stocks with DivYld using a trailing 4 quarters
calculation, which produced about 600 securities• Calculate 1 year and 2 year DivGro rates; Divide them into
positive, negative, null growth universes• Filter stocks with a positive 2 Year DivGro. The resulting list
of 426 stocks, on average, that met these criteria is used as the investable universe.
TESTING METHODOLOGYQRG’s alpha tester used the following rules to generate returns and risk statistics for DivYld, DivGro, QRG LargeCap models:
“…it’s possible to create a portfolio of 50 to 85 holdings that outperforms the S&P500 and Russell 1000…”
7
October 2015 | www.IRPJournal.comIRP
The cumulative returns of Dividend Yield, Dividend Growth, and QRG’s LargeCap are superior to the Russell 1000. Specifically, Dividend Yield consistently beat Dividend Growth, except for 2000 and 2013 where they had similar results. The outpacing should come as little surprise since Dividend Yield is widely acknowledged as a mainstay of Low Volatility High Quality strategies because it provides a protective return cushion in turbulent markets. Moreover, it’s worth noting that combining Dividend Yield and Dividend Growth with QRG’s LargeCap signal bolstered the duo’s performance during the same period.
Moreover, it’s worth noting that combining Dividend Yield and Dividend Growth with QRG’s LargeCap signal bolstered the duo’s performance during the same period.
Dividend Yield and Dividend Growth results tend to deviate noticeably in turbulent markets. For example, the average monthly returns difference between these two factors during some of the recent market downturns range from 8 bps to 145
bps on an absolute basis. Dividend Yield consistently delivered higher returns. Moreover, QRG LargeCap performed as well as or better than DividendYield during crisis periods.
CONCLUSIONUsing Dividend Yield and Dividend Growth as stock selection factors, it’s possible to create a portfolio of 50 to 85 holdings that outperforms the S&P500 and Russell 1000 using screened constituents of the S&P900 universe.
Dividend Yield (12.73%) performed slightly better than Dividend Growth (12.21%), in tests from January 2000 to June 2014, while also providing a protective cushion during turbulent and crisis markets in that period.
Equally weighted two factor model of Dividend Yield and Dividend Growth posted at least 100 basis points (13.87%) higher than each of the two individual factors’ annualized total returns.
Notwithstanding Dividend Yield and Dividend Growth’s robust performance as a two factor model, QRG’s LargeCap signal further augmented the duo’s result by 330 basis points (17.17% minus 13.87%) in a strategy that equal weight all three signals.
QRG: Dividend Yield and Dividend Growth Matter
To see the full reports from Thomas Quantitative Group contact:
Jean W. Thomas
(914) 734 1312
http://www.quantresearchgroup.com
Exhibit 1 - Total Annualized Returns: January 2000 to June 2014
Exhibit 2 - Cumulative Returns: January 2000 to June 2014

October 2015 | www.IRPJournal.com
8
IRP Sell When You Can, Not When You Have To
To see the full reports from Rareview Macro contact:
Neil Azous
(203) 539 6067
http:// www.rareviewmacro.com
SELLWHEN YOU CAN, NOT
WHEN YOU HAVE
TO
Neil Azous Rareview Macro LLC
In the third quarter, both market-based and corporate mea-sures of financial conditions converged. While market-based measures are widely observed we wanted to point out one very important “corporate” metric that we have uncovered that is driving financial conditions even tighter in the credit mar-kets, and one that we do not believe has been observed in the marketplace yet.
In data released on September 18th in the Fed’s Flow of Funds (Z1) report, it was revealed that in the second quarter the US corporate financing gap – the difference between corporations’ capital spending and their internal funds (or savings plus cash flow) plus inventory valuation adjustment – turned negative (-$234bn) for the first time since the 2006-2008 period. In lay-man’s terms, companies are now spending more on their capital activities (i.e. actual capex, or financial activity) than what they are taking in cash flow, their cash on hand, or what is necessary to finance their levels of inventories.
The below chart illustrates the US corporate financing gap as a percentage of nominal GDP. The top green line denotes wheth-er the financing gap is in a deficit or surplus. When there is a financing gap deficit in excess of 1.5% of nominal GDP, a tech-nical recession has followed on average within the next four quarters (median of 3.5). We have not yet reached this 1.5% level yet, although it is possible we may do so in the third quarter as inventories have continued to grow and cash flow growth has moderated. We will know that answer in mid-December when third quarter data is released.
“…THE NEGATIVE EFFECT FROM THIS FINANCING DEFICIT TENDS TO BE
WORSE FOR CORPORATE BONDHOLDERS RATHER
THAN HOLDERS OF EQUITIES.”

9
October 2015 | www.IRPJournal.comIRP Sell When You Can, Not When You Have To
Historically, when this sort of negative financing gap has mate-rialized, it is a long-term negative for both credit and equity risk assets. Why? Because unless firms are able to raise additional funds through external sources via issuing equity, organically growing cash flow, taking on bank loans, or raise additional financing through debt issuance, then they are forced to reduce the other side of the ledger – that is, actual capital spending and/or halting production.
Since we know that capital expenditures on fixed investment is already at a historically low level relative to GDP, it is more likely that firms will reduce another use of their cash – M&A and equity buybacks, especially because they have been forced to pay a higher price for new debt financing. We have already seen this start to show up in the third quarter with slower net debt issuance and share buyback activity.
However, the negative effect from this financing deficit tends to be worse for corporate bondholders rather than holders of equities. As cash flow ratios deteriorate, and leverage increases, credit profiles will worsen and investors will demand a higher credit spread for new corporate bond issuance (in the absence of easy money of course). This will flow down to the equity holders eventually, but the first place it shows up is in the credit markets with wider credit spreads.
For example, on September 30th, Hewlett-Packard (HPQ) brought a new $14.6bn corporate issue to refinance existing debt as it transitioned into two separate companies. On that day, syndicates cleared the table of all other issuances to insure that the deal would go well. Additionally, the new deal featured an unheard of concession of at least 70 bps to comparable is-sues. However, despite all of this the deal still performed poorly, and has not fared any better in secondary market performance in the immediate days that followed. In fact, most issuers have decided to stand down on coming to the market since then.
This portends to any new investment grade credit issuance be-ing suspect, and those that will come to market are those who need the cash, and they will not like the price that they have to pay for it. As the famous saying goes, sell when you can, not when you have to.
As a result, there is a new sensitivity that has yet to be discount-ed in the equity market construct. Two of the major pillars of the recent bull market – financial engineering and float shrinkage through stock buybacks and M&A – are no longer standing straight up, and are beginning to look like the Leaning Tower of Pisa. To put it simply, the torrid pace of buybacks and M&A that
were supporting the equity market are now no longer a given, but question marks.
The first way to visualize how this thought pro-cess is being discounted is by looking at the ratio of the S&P 500 relative to the S&P 500 Buyback Index. As you can see, the benchmark is now continuing to outperform the share repurchase theme for the first time in more than three years.
The second way to validate this new sensitivity is to look at the sizable backlog in the investment grade corporate issuance pipeline for M&A funding – a recent count suggests that there are ~24 known deals that are expected to close within the next six months. That figure amounts to more than $500bn of M&A deals from investment grade companies that are waiting to finance through the debt markets.
The key point now is that some of these deals are at greater risk of not closing, or the cost will be much higher than what they had planned on spending, which may make the deals look less economic. Additionally, the fear of higher financing costs is likely to make the math around future M&A deals look less attractive.
Because it has not been observed that the corporate financing gap has swung into deficit, the traditional trader’s almanac seasonal call for a fourth quarter rally remains consensus in the professional community. The thesis is largely predicated on the notion that the stock market will have the same wind at their backs with the same force as the last few years – that is, stock buybacks in November and December are expected to be the largest of the year, and corporations, in a world starving for growth, will look to grow their top-line revenues through acquisitions.
Our view is that once the professional community collectively observes the fact that the corporate financing gap has swung into deficit, and updates their models to compensate for wider credit spreads and lower net debt issuance, the forecasts for a strong November and December buyback period will have to be reduced. And possibly these reductions will be to a large enough degree that it disrupts the traditional fourth quarter seasonal call for equities to outperform.
October 2015 | www.IRPJournal.com
10
IRP NOC: Management Sells into Its Own Repurchases
Northrop Grumman’s Chairman, President & CEO, Wesley Bush (53) has led the firm during a challenging time, particularly from Defense Department budgets under pressure from sequestra-tion. Nonetheless, we think he and his team have done a poor job vs. peers in the “new normal” environment. Operating margins and ROA have been flat to down during his tenure and we are particularly concerned that management ranks in our 2nd lowest quintile vs. similar-sized peers on expense per employee. CEO Bush claims to be focused on the portfolio of assets, operating per-formance, and cash deployment as value creators for shareholders, customers, and employees. We think this team has shown their true colors by relying on repurchases to try to improve the stock’s performance while being serial large sellers of their own personal stakes. We think their selling, coupled with large repurchases, indicates a lack of conviction in future prospects and inability to add value by reinvesting in the core business.
Management Changes
There have been several changes to upper management over the last couple of years, consistent with NOC’s culture of promoting from within. In January, Ken Bedingfield (42) was promoted to CFO, replacing the retired Jim Palmer. We think the retired Palmer lacked cost discipline, particularly given the budgetary environment, but view new CFO Bedingfield as his protégé with a similar approach. Bedingfield has a good finance background, joining NOC in 2011 and rising to VP, Finance before becoming CFO. We don’t expect much to change since he has worked closely with Palmer, who stayed on until July to ease the transition. Gloria Flach (56) became Corporate VP & President, Northrop Grumman Electronics Systems in 2013. She joined NOC in 1981, holding a number of operational roles. She was Corporate VP & President, Enterprise Shared Services from 2010 to 2012, overseeing a variety of support functions. She has also been VP/GM, Targeting Systems and VP/GM, Engineering & Logistics. Corporate VP & President, Aerospace Systems, Thomas Vice (52) has overseen the sector since 2013. Prior to that, he was Corporate VP & President of the Technical Services. Linda Mills (65) retired as Corporate VP, Operations in January. She was not replaced and her duties were dispersed.
Pay & Ownership Update
We think the changes to the pay plan over the last few years have weakened shareholder alignment. We think equity pay is weak, at only 38% of the top executives’ total pay. We also dislike the fact that the Board dropped the use of options from its LTIP in favor of restricted stock (RSUs). In 2012, the Board changed the mix from an even split of options and performance shares (PSUs) to 70% PSUs/30% RSUs, which cliff vest after 3 years. PSU
NOC:
Management
Sells into Its Own
Repurchases

11
October 2015 | www.IRPJournal.comIRP NOC: Management Sells into Its Own Repurchases
To see the full reports from Management CV contact:
Renny Ponvert
(301) 455 5886
www.managementcv.com
grants are based on total shareholder return vs. its peer group and the S&P Indus-trials. We note, negatively, that the awards are still subjective, based on market data and individual subjective fac-tors such as growth in the job. CEO Bush received $21.8 million in total pay, with only 41% in equity. The other 4 members of the team received a total of $38.5 million, with only 35% in equity. We note, negatively, that they re-ceive significant perquisites, including security, travel, use of company aircraft, expenses for family members, and financial planning. We think the management team has reasonable beneficial ownership in dollar terms, but are concerned with their substantial selling. Excluding both recently retired officers, CFO Palmer and VP Mills, Offic-ers and Directors own 1.2 million shares. Bush owns 412k shares, while new CFO Bedingfield owns just 14k shares. In the last 18 months, Bush has sold 304k shares (42% of his stake), Bedingfield sold 11k shares (44% of his stake), while division Presidents Vice and Flach sold 48k shares (41% of his beneficial holdings) and 66k shares (42% of her beneficial stake), respectively. The only officers that have vested options are Vice and Flach.
Allocation Update
Management’s capital allocation priorities have increasingly focused on returning cash to shareholders. CFO Bedingfield has stated his priorities are the same as his predecessor’s, namely: investing in are-as where he can obtain the desired return, managing the balance sheet, maintaining a competitive dividend and re-turning excess FCF to shareholders via repurchases. However, management has outspent its FCF on repurchases and dividends for the past few years. It has funded this shortfall partly with debt. Bedingfield has issued a $600 mil-lion note this year, using $500 million for the pension plan. Debt/capital was 51% at the end of Q2’15 compared to 45% in 2014. The Board authorized a $4 billion repurchase plan in May 2013, which was completed this March. There is a new $3 billion authorization. The goal in 2013 was to retire 25% of outstanding shares by the end of 2015, with 90% of the goal completed. Management is at least disciplined with M&A. Although they examine many deals, they have not pulled the trigger on a major one because of a lack of a strategic fit.
Copyright 2015 Management CV, Inc.
There have been several changes to upper management over the last couple of years...
October 2015 | www.IRPJournal.com
12
IRP It’s Like 2011 All Over Again
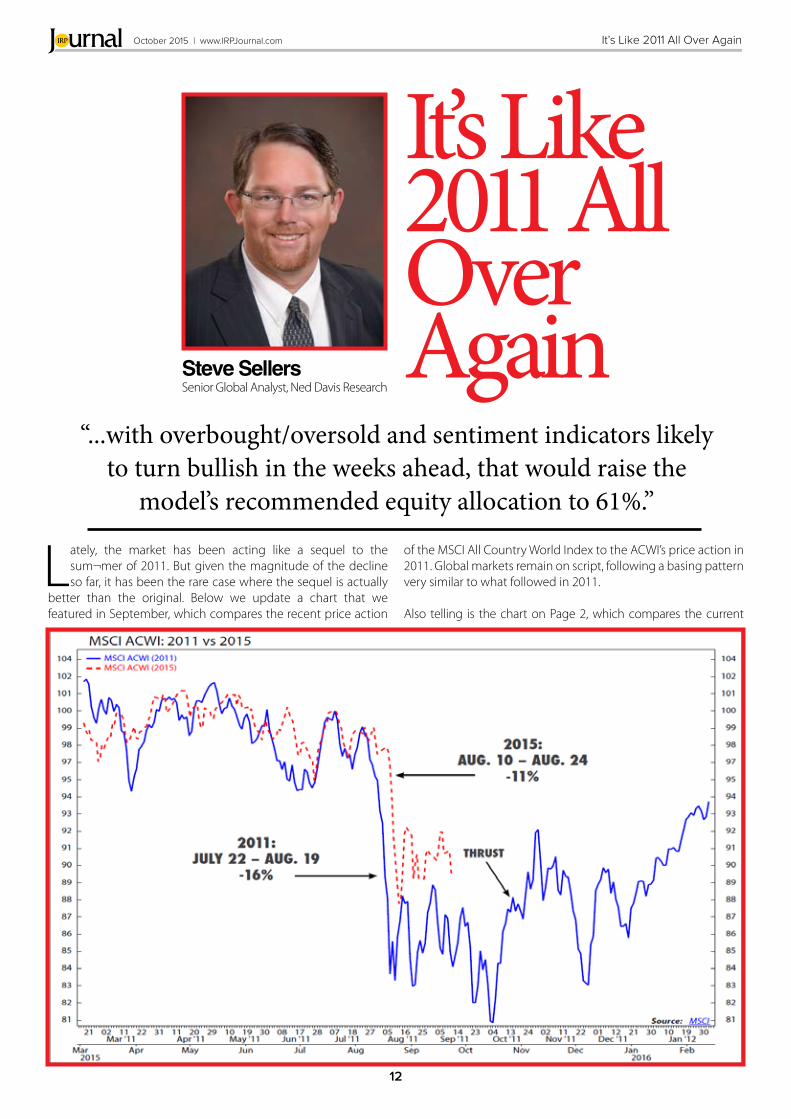
Lately, the market has been acting like a sequel to the sum¬mer of 2011. But given the magnitude of the decline so far, it has been the rare case where the sequel is actually
better than the original. Below we update a chart that we featured in September, which compares the recent price action
of the MSCI All Country World Index to the ACWI’s price action in 2011. Global markets remain on script, following a basing pattern very similar to what followed in 2011.
Also telling is the chart on Page 2, which compares the current
It’s Like 2011 AllOver AgainSteve Sellers
Senior Global Analyst, Ned Davis Research
“...with overbought/oversold and sentiment indicators likely to turn bullish in the weeks ahead, that would raise the
model’s recommended equity allocation to 61%.”

13
October 2015 | www.IRPJournal.comIRP It’s Like 2011 All Over Again
21-day volatility index for the ACWI to its levels in 2011. The simi¬larities are striking. As in 2011, short-term volatility has begun receding, which is encouraging. However, the final low was not
reached until two months after the initial decline, so we cannot assume that the major benchmarks will not reach new lows. The bearish evidence of the past month includes the following:
• The Global Balanced Account Model turned bearish at the end of August, recommending just 42% equities.
• The Bear Watch went bearish with half of its indicators active on August 26, and a sixth indicator signaled on September 8.
• P/E ratios for the MSCI World, U.S., Europe ex. U.K., the U.K., and Japan indices compressed some from their highs during the August decline, but remained above their five-year averages prior to the top, indicating there is still a valuation overhang in most regions of the world.
• The percentage of ACWI market cap with rising 200-day mov¬ing averages just fell to 24% as the 200-day moving average for the MSCI U.S. Index switched to falling after yesterday’s close. This puts the ACWI in a zone that has historically returned -9%.
• But with all of the gloom and doom recently, there remain some encouraging signs that the worst is behind us:
• Our Rally Watch fired its first breadth thrust indicator on Sep¬tember 17 and our NDR Multi Cap Index has had three nine-to-one up days compared to just one nine-to-one down day in volume since August 24. The 10-day advancing volume/total volume indicator has rebounded to 46% after hitting a low of 27% on August 25. It is currently 20 points from signaling a new thrust signal.
• U.S. sentiment appears to finally be reversing from pessimistic extremes, in lieu of persistent extreme global sentiment.
• The August Bear Watch signal looks similar to both the signals generated in early 1998 and the summer of 2011. The 2011 signal was a result of the shallow bear market that year while the 1998 signal was triggered from global market weakness from the 1997 Asian financial crisis. In 1998, the market ral¬lied strongly for several months following the signal and in 2011, the market rallied by year-end after a couple-month basing period.
• The seasonality indicator in the Global Balanced Account Model will turn neutral (from bearish) in October, and with overbought/oversold and sentiment indicators likely to turn bullish in the weeks ahead, that would raise the model’s rec¬ommended equity allocation to 61%.
With such mixed indicator evidence and the risk of a global slowdown increasing, we are remaining marketweight equities. But at the same time, we are encouraged by the market’s basing action since the correction and continue to expect a year-end rally, probably starting soon. We will continue to keep a close eye on our Rally Watch breadth thrust indicators and intra-month updates of our Global Balanced Account Model for the right time to make this move.
To see the full report from Ned Davis Research contact:
Steve Sellers Ned Davis Research
(800) 241-0621
http://www.ndr.com
October 2015 | www.IRPJournal.com
14
IRP Phases & Cycles
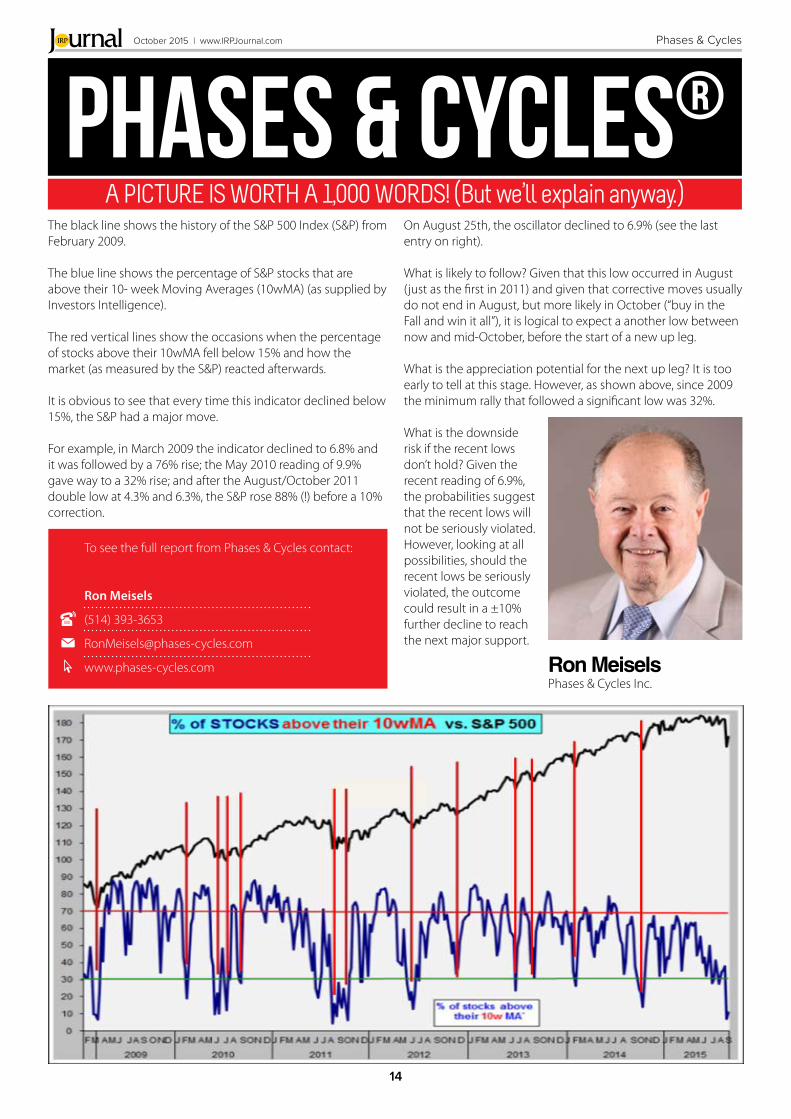
On August 25th, the oscillator declined to 6.9% (see the last entry on right).
What is likely to follow? Given that this low occurred in August (just as the first in 2011) and given that corrective moves usually do not end in August, but more likely in October (“buy in the Fall and win it all”), it is logical to expect a another low between now and mid-October, before the start of a new up leg.
What is the appreciation potential for the next up leg? It is too early to tell at this stage. However, as shown above, since 2009 the minimum rally that followed a significant low was 32%.
What is the downside risk if the recent lows don’t hold? Given the recent reading of 6.9%, the probabilities suggest that the recent lows will not be seriously violated. However, looking at all possibilities, should the recent lows be seriously violated, the outcome could result in a ±10% further decline to reach the next major support.
PHASES & CYCLES®A PICTURE IS WORTH A 1,000 WORDS! (But we’ll explain anyway.)
The black line shows the history of the S&P 500 Index (S&P) from February 2009.
The blue line shows the percentage of S&P stocks that are above their 10- week Moving Averages (10wMA) (as supplied by Investors Intelligence).
The red vertical lines show the occasions when the percentage of stocks above their 10wMA fell below 15% and how the market (as measured by the S&P) reacted afterwards.
It is obvious to see that every time this indicator declined below 15%, the S&P had a major move.
For example, in March 2009 the indicator declined to 6.8% and it was followed by a 76% rise; the May 2010 reading of 9.9% gave way to a 32% rise; and after the August/October 2011 double low at 4.3% and 6.3%, the S&P rose 88% (!) before a 10% correction.
To see the full report from Phases & Cycles contact:
Ron Meisels
(514) 393-3653
www.phases-cycles.com

the source for clear thinkers in the evolving derivatives worldDerivSource is an independent information source and online community for derivatives professionals. We provide trend analysis, peer commentary and various educational resources via our articles, podcasts and interactive webinars.
Podcasts & Events
Free e-newsletters
Educational Briefings & Webinars
Weekly News Roundups
Opinion & Industry Analysis
Peer Commentary
JULIA SCHIEFFERFOUNDER & EDITOR-IN-CHIEF
+44 (0) 20 3239 [email protected]
twitter.com/derivsource
http://www.linkedin.com/company/derivsource
Join DerivSourceRegister for DerivSource FREE today to join the community of derivatives professionals and receive industry news and analysis straight to your inbox.
http://derivsource.com/user/register

October 2015 | www.IRPJournal.com
16
IRP CEF Investors Have Abandoned HY Bonds`
* Based on JNTO data
JAPAN’SBOOMING INBOUND TOURISM: WHO BENEFITS?
Francesca Wilks Storm Research

17
October 2015 | www.IRPJournal.comIRP CEF Investors Have Abandoned HY Bonds
To see the full reports from Storm Research contact:
Francesca Wilks
+44 121-318-5573
www.stormresearch.co.uk
Which Japanese companies are best positioned for record breaking inbound tourist demand?
Inbound tourism to Japan is on the move. Following a record 13.4m visitors in 2014 (+29.4%YoY), of whom 81% were tourists, February 2015 broke all previous monthly records with 1.4m visitors (+57.6%YoY). This was to be broken again as early as March, which saw 1.5m visitors (+45.3%YoY).
We expect 2015 to be another record year and believe inbound tourism remains a powerful investment theme in Japan.
Underlying factors:1. Visa relaxations: From October 2014 the Japanese
government relaxed multi-entry visa requirements and simplified the application process for Indonesian, Filipino and Vietnamese nationals. Chinese nationals also benefited from looser visa requirements from January 2015. Year to date Chinese visitors alone have totalled 923,500 +93.2%YoY and show little sign of slowing.
2. Weak Yen: Under Prime Minister Abe’s reforms, and BoJ governor Kuroda’s QE program, the Yen has depreciated some 45% against the US dollar since December 2012. Destination Japan has become significantly more affordable and tourists are taking advantage.
3. Duty free: Duty free status was previously assigned only to electronic goods and jewellery priced over Y10,000. In October 2014 this was reduced to Y5,000 and relaxed to include consumable items such as food, tobacco and cosmetics. Companies selling duty free products have subsequently found themselves at the centre of a booming industry.
Outlook:The Japanese government is keen to build on inbound tourism progress and has set an ambitious target of 20m annual visitors by the 2020 Olympics and 30m by 2030. With the potential for further visa relaxations, and the Yen likely to remain weak, we believe businesses selling the right products in the right way (for example with multi-lingual staff ) are set to prosper.
Who stands to benefit?• Laox (8202, Positive): A sequence of 12 consecutive years
of operating losses ended in FY14 as Laox started to reap the reward of its alliance with Suning Commerce Group. Following its initial investment in August 2009 Suning has successfully repositioned Laox to tap into Japan’s strongest area of consumption, namely inbound tourist demand. The radical change has resulted in 80% of Laox’s domestic store sales going to inbound tourists, 80% of whom are Chinese. It has also resulted in customers literally queueing in the street to enter its Akihabara store, generating year-to-date comp store sales growth of a minimum +50%YoY. Unquestionably the 12/17 earnings multiple of 37x comes with a growth premium, but it is one we continue to believe is worth paying.
• Don Quijote (7532, Positive): The king of Japan’s discount retailers is already riding a wave of value-oriented consumerism following the 2014 consumption tax hike. In addition the
company’s quirky product line-up, which runs from snacks to celebrity masks, has also made it a tourist destination. DQ is actively targeting overseas visitors with multilingual staff, duty free items and foreign currency cash registers. Although inbound tourism represents just 6% of total sales - a figure that rises to over 10% at 6 of its metropolitan stores and almost 30% at its Okinawa store - in tandem with its discount product line-up we believe long-term growth prospects are bright, not least when considering the plight of many of its poorly managed retail competitors. In similar fashion to Laox we conclude the 6/16 earnings multiple of 29x is a growth premium worth paying.
“THE JAPANESE GOVERNMENT IS KEEN TO BUILD ON INBOUND TOURISM AND HAS SET A TARGET OF 20M ANNUAL VISITORS BY THE 2020 OLYMPICS...”

Page TitleOctober 2015 | www.IRPJournal.com
18
IRP
CAN SME RESEARCH BE SAVEDBy Pedro Fernandes and James Woodley
Many small and medium-sized enterprises (SMEs) traded on public markets have little or no research coverage. Since the financial crisis, this situation has only worsened as banks have cut the size of their research teams in an effort to reduce costs. Many in the industry anticipate that the proposals in Europe to unbundle research from trading commissions as part of MiFID II will only exacerbate this problem.
THE IMPORTANCE OF SMES TO THE REAL ECONOMYIn June, the UK’s Financial Reporting Council’s discussion paper “Improving the Quality of Reporting by Smaller Listed and AIM Quoted Companies” highlighted the impact that the lack of SME research has on the real economy:
“A further challenge cited by many is falling levels of analyst coverage of smaller quoted companies, which has become increasingly difficult to attract. Some companies believe this has had an impact on their access to investors/equity capital.”
This lack of access to capital for SMEs is a significant concern for European policy makers in Brussels. The importance of SME’s to the European economy should not be underestimated. The International Monetary Fund’s Discussion Note “Revitalizing Securitization for Small and Medium-Sized Enterprises in Europe” (May 2015) highlights this:
“Often referred to as the “backbone” of Europe’s economy, SMEs constitute the greater share of European output and employment. They account on average for 99 out of every 100 businesses, 2 in every 3 employees and 58 cents of every euro of value added of the business sector (industry, construction, trade and services) in the EU.”
that over 40% of the Technology, Media & Telecommunications (TMT) companies listed on its markets had no research coverage. In essence, the smaller the market capitalisation the less research coverage.
Conversely there is an oversupply of research on large cap companies, for example, HSBC Group, which is dual primary listed in London and Hong Kong and one of the largest FTSE 100 companies, has some 35 equity analysts currently covering it.There are a number of reasons for this concentration of research on large caps at the expense of SMEs, including:
• Investment banking fees: research coverage of large caps by banks can lead to lucrative investment banking fees;
• Trading commissions: generally large caps trade more actively than SMEs therefore generating higher revenue for banks from trading commissions;
OVERSUPPLY OF LARGE CAP RESEARCHIn 2009, Forefactor, a strategic consulting firm, conservatively estimated “that 35 – 40% of all publicly traded companies worldwide have no sell-side analyst coverage.” Analysis in 2014 from Euronext, the European exchange group, similarly reported
• Asset allocation to SMEs: Some asset managers have restriction on the minimum market capitalisation, liquidity and maximum ownership;
• Reduction in number of analysts: Capital adequacy requirements introduced as a response to the financial crisis, such as Basel III, have led investment banks to reduce costs and concentrate on their most profitable clients.
Pedro Fernandes James Woodley

Page Title
19
October 2015 | www.IRPJournal.comIRP
IMPACT OF MIFID II AND UNBUNDLING OF RESEARCH FROM TRADING COMMISSIONSAs part of MiFID II, due for implementation in January 2017, European policy makers and regulators are keen to introduce transparency to the research provision market, essentially to clearly separate the payment for research from trading commission thereby removing the risk of inducement and conflicts of interest for portfolio managers. Many in the industry believe these reforms will lead to a further reduction in the provision of SME research as banks restructure their research teams to concentrate on profitable research, predominantly the large caps.
WHAT CAN BE DONE TO IMPROVE SME RESEARCH COVERAGEIt is worth noting that a significant proportion of investment in European SMEs has been provided by domestic investors, many of whom are retail investors. The European Commission has recognised this, therefore one of the ambitions of the Capital Markets Union (CMU) is to increase cross-border investment across Europe.
Over the coming 18-months the financial industry will need to develop a new commercial model for research production, likely to be led by the bulge banks and large asset managers, although this is anticipated to be at the expense of SME research.
So what can be done to staunch the flow of research away from SMEs? A number of suggestions have been put forward:
• The launch of aggregation platforms that will match research producers with research consumers, predominantly from the long tail across Europe.
THE END OF THE BEGINNING?The European Commission will shortly adopt the draft MiFID II delegated acts which will bring an element of clarity as to how research will be paid for in Europe. This will start the countdown for research providers and research consumers to amend their processes to ensure they are compliant with the new rules ready for the implementation of MiFID II in January 2017.
This will also accelerate the launch and development of distribution solutions from a number of existing and new research aggregators and FinTech companies. Although many will focus on the aggregation of large cap research and distribution to the largest assets managers, others, including ResearchPool, will also look at how to efficiently aggregate SME research, make it commercially viable, and distribute it to the long tail of predominantly smaller asset managers and private investors which traditionally have provided much of the trading liquidity in SMEs.
The next 16-months will be critical for SME research. Research producers will imminently have to decide whether they will continue to produce SME research and, if they do, match it to investors that are will to pay for it. We believe competing FinTech aggregation platforms will play an important role to support this process. As the industry now steps into the starting blocks, we just await the European Commission’s starting pistol for the start of the race to MiFID II implementation.
Over the coming 18-months the financial industry will need to
develop a new commercial model for research production…
• A significant increase in the production of “issuer sponsored” research paid for by SMEs;
• An increase in the number of ex-banking analysts forming independent research houses or going freelance, who may choose to specialise in SME research if there is adequate demand and low enough overheads to make it profitable;
• Smaller brokers may choose to specialise in SMEs to differentiate themselves from the bulge banks, which will likely concentrate on large cap research and servicing only the clients producing the largest trading commissions and investment banking fees;
To Contact ResearchPool:
James Woodley
+44 (0)7710 179 803
www.researchpool.com

Page TitleOctober 2015 | www.IRPJournal.com
20
IRP
DIRECTORYCompanyWebsite:Contact:Email: Phone:-----------------CompanyWebsite:Contact:Email: Phone:-----------------CompanyWebsite:Contact:Email: Phone:-----------------CompanyWebsite:Contact:Email: Phone:-----------------CompanyWebsite:Contact:Email: Phone:-----------------CompanyWebsite:Contact:Email: Phone:-----------------CompanyWebsite:Contact:Email: Phone:-----------------CompanyWebsite:Contact:Email: Phone:-----------------CompanyWebsite:Contact:Email: Phone:-----------------CompanyWebsite:Contact:Email: Phone:-----------------CompanyWebsite:Contact:Email: Phone:-----------------CompanyWebsite:Contact:Email: Phone:-----------------
CompanyWebsite:Contact:Email: Phone:-----------------CompanyWebsite:Contact:Email: Phone:-----------------CompanyWebsite:Contact:Email: Phone:-----------------CompanyWebsite:Contact:Email: Phone:-----------------CompanyWebsite:Contact:Email: Phone:-----------------CompanyWebsite:Contact:Email: Phone:-----------------CompanyWebsite:Contact:Email: Phone:-----------------CompanyWebsite:Contact:Email: Phone:-----------------CompanyWebsite:Contact:Email: Phone:-----------------CompanyWebsite:Contact:Email: Phone:-----------------CompanyWebsite:Contact:Email: Phone:-----------------CompanyWebsite:Contact:Email: Phone:-----------------
Absolute Strategy Researchhttp://www.absolute-strategy.comIan Harnett & David [email protected]+44 207 073 0730------------------------------------------------------------------Agency Partnershttp://www.agencypartners.co.ukPaul [email protected]+44 207 186 7186------------------------------------------------------------------Alphavaluehttp://www.alphavalue.comMaxime [email protected]+33 1 70 61 10 52------------------------------------------------------------------APTI Researchhttp://www.aptiresearch.comNicolas [email protected]+46 8 66 07 450------------------------------------------------------------------Arete Research Services LLPhttp://www.arete.netRichard [email protected]+44 207 959 1303------------------------------------------------------------------Atona RA Partners SAhttp://www.atonra.chStefano [email protected]+41 22 319 74 74------------------------------------------------------------------Autonomous Researchhttp://www.autonomous-research.comJonathan [email protected]+44 207 776 3400------------------------------------------------------------------BCA Research Inc.http://www.bcaresearch.comBashar [email protected]+1 514 499 9550------------------------------------------------------------------Capital Economicshttp://www.capitaleconomics.comJulian [email protected]+44 207 823 5000------------------------------------------------------------------Capital Structurehttp://www.capital-structure.comSarah [email protected]+44 207 283 3820------------------------------------------------------------------Carn Macro Advisorshttp://www.carnmacro.comNick [email protected]+44 203 551 6344------------------------------------------------------------------CM Researchhttp://www.researchcm.comElgen [email protected]+44 20 3744 0105------------------------------------------------------------------
Creative Global Investmentshttp://www.cg-inv.comCarlo R. [email protected]+352 2625 8640------------------------------------------------------------------Credit Sightshttp://www.creditsights.comSimon [email protected]+44 207 429 2080------------------------------------------------------------------Cross Border Capitalhttp://www.crossbordercapital.comMichael [email protected]+44 (0)207 868 4104------------------------------------------------------------------Day by Dayhttp://www.daybyday-pro.comValérie [email protected]+33 1 58 18 37 50------------------------------------------------------------------Decision Economics Inc.http://decisioneconomicsinc.comBen [email protected] 884 9448------------------------------------------------------------------Eagle Alphahttp://www.eaglealpha.comEmmett [email protected]+44 20 7151 4880------------------------------------------------------------------Emeriskhttp://www.emerisk.comD’Arcy [email protected]+44 7833 173 233------------------------------------------------------------------Financiele Diensten Amsterdamhttp://www.fiaweb.nlJan van der [email protected]+31 20 69 72 926------------------------------------------------------------------FuturesTechshttp://www.futurestechs.co.ukClive [email protected]+44 777 172 8601------------------------------------------------------------------Geospatial Insighthttp://www.geospatial-insight.comDan [email protected]+44 20 3318 3041------------------------------------------------------------------GrahamBishop.comhttp://www.grahambishop.comHannah [email protected]+44 142 477 7123------------------------------------------------------------------Harlyn Researchhttp://www.harlynresearch.comSimon [email protected]+44 1763 208 601------------------------------------------------------------------

Page Title
21
October 2015 | www.IRPJournal.comIRP
CompanyWebsite:Contact:Email: Phone:-----------------CompanyWebsite:Contact:Email: Phone:-----------------CompanyWebsite:Contact:Email: Phone:-----------------CompanyWebsite:Contact:Email: Phone:-----------------CompanyWebsite:Contact:Email: Phone:-----------------CompanyWebsite:Contact:Email: Phone:-----------------CompanyWebsite:Contact:Email: Phone:-----------------CompanyWebsite:Contact:Email: Phone:-----------------CompanyWebsite:Contact:Email: Phone:-----------------CompanyWebsite:Contact:Email: Phone:-----------------CompanyWebsite:Contact:Email: Phone:-----------------CompanyWebsite:Contact:Email: Phone:-----------------
CompanyWebsite:Contact:Email: Phone:-----------------CompanyWebsite:Contact:Email: Phone:-----------------CompanyWebsite:Contact:Email: Phone:-----------------CompanyWebsite:Contact:Email: Phone:-----------------CompanyWebsite:Contact:Email: Phone:-----------------CompanyWebsite:Contact:Email: Phone:-----------------CompanyWebsite:Contact:Email: Phone:-----------------CompanyWebsite:Contact:Email: Phone:-----------------CompanyWebsite:Contact:Email: Phone:-----------------
DIRECTORYID MidCapshttp://www.idmidcaps.comGaël [email protected]+33 1 48 01 87 29------------------------------------------------------------------Independent Mindshttp://www.independent-minds.co.ukLucy [email protected]+44 207 930 8811------------------------------------------------------------------Independent Strategyhttp://www.instrategy.comJohn [email protected]+44 20 7730 4965------------------------------------------------------------------Indigo Equity Researchhttp://www.indigo-equity-research.com/Nick [email protected]+41 79 519 6591------------------------------------------------------------------Insight Investment Researchhttp://www.insightir.comRobert [email protected]+44 203 397 9182------------------------------------------------------------------INTEGRAShttp://www.integras.com.trHasan [email protected]+90 212 269 13 81------------------------------------------------------------------Investcafe Independent Researchhttp://www.investcafe.ruGrigory [email protected]+7 903 720 03 65------------------------------------------------------------------i-Res Independent Financial Research and Advisoryhttp://www.ires.com.trZekeriya [email protected]+90 532 261 2137------------------------------------------------------------------Libra Investmentshttp://www.libra-is.comChristopher [email protected]+44 207 960 6520------------------------------------------------------------------Lombard Street Researchhttp://www.lombardstreetresearch.comSeamus [email protected]+44 207 246 7800------------------------------------------------------------------Longview Economicshttp://www.libra-is.comPaul [email protected]+44 870 225 1388------------------------------------------------------------------Lucror Analyticshttp://lucroranalytics.comDafydd [email protected]+65 6631 9721------------------------------------------------------------------
Management Joint Trust SAhttp://www.mjt.chJean-François [email protected]+41 22 328 93 33------------------------------------------------------------------Markit Securities Financehttp://www.markit.com/securitiesfinanceSimon [email protected]+44 207 260 2000------------------------------------------------------------------MDB Insightshttp://www.moneydashboard.comIan [email protected]+44 131 225 4157------------------------------------------------------------------Messelshttp://www.messels.comTim [email protected]+44 148 342 0999------------------------------------------------------------------Morningstarhttp://morningstar.comChristopher [email protected]+44 (0)20 3107 0046------------------------------------------------------------------MRB (The Macro Research Board) Partnershttp://www.mrbpartners.comChris [email protected]+44 207 073 2792------------------------------------------------------------------Nau Securitieshttp://www.nau-securities.comJohn Nelson [email protected]+44 20 7947 5510------------------------------------------------------------------Ned Davis Research Grouphttp://www.ndr.comNancy [email protected]+1 941 412 2300------------------------------------------------------------------New Street Researchhttp://www.newstreetresearch.comMaria von [email protected]+44 20 7375 9111------------------------------------------------------------------
Website:Contact:Email: Phone:
http://www.managementcv.comRenny [email protected](301) 455 5886
Company: Management CV Inc.

Page TitleOctober 2015 | www.IRPJournal.com
22
IRP
Now-Casting Economicswww.now-casting.comJasper [email protected]+44 20 3286 0797------------------------------------------------------------------Omega Analysis Limitedhttp://www.OmegaAnalysis.comDr. William F. [email protected]+44 7970 938 875------------------------------------------------------------------Primewrite Researchhttp://www.primewrite.comDr. Victor [email protected]+44 1753 673987------------------------------------------------------------------Providentia Capital LLPhttp://www.providentia-capital.comGulamabbas [email protected]+44 207 499 9040------------------------------------------------------------------Rareview Macro LLChttp://www.rareviewmacro.comNeil [email protected](203) 539 6067------------------------------------------------------------------Thomas Quantitative Group, LLChttp://www.quantresearchgroup.comJean W. [email protected](914) 734 1312------------------------------------------------------------------Radios GmbH & Co. Finanzanalyse KGhttp://www.radios.agFranz [email protected]+44 207 477 2337------------------------------------------------------------------Roubini Global Economicshttp://www.roubini.comPaul [email protected]+44 207 092 8883------------------------------------------------------------------Seven Days Aheadhttp://www.sevendaysahead.comMark [email protected]+44 784 992 2573------------------------------------------------------------------Spartan Institutional Research, Inc.http://www.spartanresearch.comRichard [email protected](212) 385 5500 x209------------------------------------------------------------------Spread Researchhttp://www.spreadresearch.comStephane [email protected]+33 478 95 36 14------------------------------------------------------------------
Standpoint Researchhttp://www.standpointresearch.comRonnie [email protected](786) 768 2317------------------------------------------------------------------Stockcube Researchhttp://www.stockcube.comRob [email protected]+44 20 7352 2121------------------------------------------------------------------Storm Researchhttp://www.stormresearch.co.ukRowan [email protected]+44 121 288 3402------------------------------------------------------------------
`The Analysthttp://www.theanalyst.co.ukMark [email protected]+44 207 498 6593------------------------------------------------------------------The Ideahttp://www.theidea.nlHenk [email protected]+31 343 840 151------------------------------------------------------------------Trading Centralhttp://www.tradingcentral.comAlain [email protected]+33 1 5528 8040------------------------------------------------------------------Trusted Sourceshttp://www.trustedsources.co.ukNicholas [email protected]+44 203 137 7255------------------------------------------------------------------WaveTrack Internationalhttp://www.wavetrack.comPeter [email protected]+49 89 210 207 10------------------------------------------------------------------Waverly Advisorshttp://www.waverlyadvisors.comChris [email protected]+1 585 662 5189------------------------------------------------------------------
DIRECTORY
Website:Contact:Email: Phone:
http://sentimentrader.comJason [email protected] 888-795-9893
Company: Sundial Capital Research Inc.
CompanyWebsite:Contact:Email: Phone:-----------------CompanyWebsite:Contact:Email: Phone:-----------------CompanyWebsite:Contact:Email: Phone:-----------------CompanyWebsite:Contact:Email: Phone:-----------------CompanyWebsite:Contact:Email: Phone:-----------------CompanyWebsite:Contact:Email: Phone:-----------------CompanyWebsite:Contact:Email: Phone:-----------------CompanyWebsite:Contact:Email: Phone:-----------------CompanyWebsite:Contact:Email: Phone:-----------------CompanyWebsite:Contact:Email: Phone:-----------------CompanyWebsite:Contact:Email: Phone:-----------------
CompanyWebsite:Contact:Email: Phone:-----------------CompanyWebsite:Contact:Email: Phone:-----------------CompanyWebsite:Contact:Email: Phone:-----------------
CompanyWebsite:Contact:Email: Phone:-----------------CompanyWebsite:Contact:Email: Phone:-----------------CompanyWebsite:Contact:Email: Phone:-----------------CompanyWebsite:Contact:Email: Phone:-----------------CompanyWebsite:Contact:Email: Phone:-----------------CompanyWebsite:Contact:Email: Phone:-----------------

Page Title
23
October 2015 | www.IRPJournal.comIRP


