DAIRY FARM BUSINESS SUMMARY OCTOBER 2000 E.B. 2000-13 EASTERN NEW YORK RENTER SUMMARY 1999 Wayne A. Knoblauch Linda D. Putnam Department of Agricultural, Resource, and Managerial Economics College of Agriculture and Life Sciences Cornell University, Ithaca, New York 14853-7801
Transcript
DA
IRY
FA
RM
BU
SIN
ES
S S
UM
MA
RY
OCTOBER 2000 E.B. 2000-13
EASTERNNEW YORK
RENTER SUMMARY1999
Wayne A. KnoblauchLinda D. Putnam
Department of Agricultural, Resource, and Managerial EconomicsCollege of Agriculture and Life Sciences
Cornell University, Ithaca, New York 14853-7801
It is the Policy of Cornell University actively to
support equality of educational and employment
opportunity. No person shall be denied admission to
any educational program or activity or be denied
employment on the basis of any legally prohibited
discrimination involving, but not limited to, such
factors as race, color, creed, religion, national or
ethnic origin, sex, age or handicap. The University is
committed to the maintenance of affirmative action
programs which will assure the continuation of such
equality of opportunity.
Publication Price Per Copy: $12.00
For additional copies, contact:
Faye ButtsDepartment of Agricultural, Resource, andManagerial EconomicsAgricultural Finance and Management Group358 Warren HallCornell UniversityIthaca, New York 14853-7801
Use Comparative Profitability Data With Caution ..................................................................................................................................................... 1
SUMMARY AND ANALYSIS OF THE FARM BUSINESS.......................................................................................... 3
Business Characteristics and Resources Used ................................................................................................................................................. 3
Income Statement................................................................................................................................................. 4
Farm and Family Financial Status........................................................................................................................ 9
Statement of Owner Equity................................................................................................................................ 12
Cropping Program Analysis............................................................................................................................... 17
Dairy Program Analysis..................................................................................................................................... 18
Capital and Labor Efficiency Analysis .............................................................................................................. 21
COMPARATIVE ANALYSIS OF THE FARM BUSINESS ......................................................................................... 22
Progress of the Farm Business ........................................................................................................................... 22
Regional Farm Business Chart........................................................................................................................... 24
IDENTIFY AND SET GOALS ....................................................................................................................................... 26
GLOSSARY AND LOCATION OF COMMON TERMS .............................................................................................. 28
INDEX ............................................................................................................................................................................ 31
1999 EASTERN NEW YORK DAIRY FARM RENTER BUSINESS SUMMARY
INTRODUCTION
Dairy farmers throughout New York State submit business records for summarization and analysis throughCornell Cooperative Extension's Farm Business Management Program. Averages from a compilation of the individualfarm reports are published in six regional summaries and in one statewide summary.1
Accrual procedures have been used to provide the most accurate accounting of farm receipts and farm expensesfor measuring farm profits. An explanation of these procedures is found on pages 4-6. Three measures of farm profits arecalculated on pages 7 and 8. The balance sheet, statement of owner equity, and cash flow statement are featured on pages9-16. The dairy program analysis includes data on the costs of producing milk (pages 19 and 20).
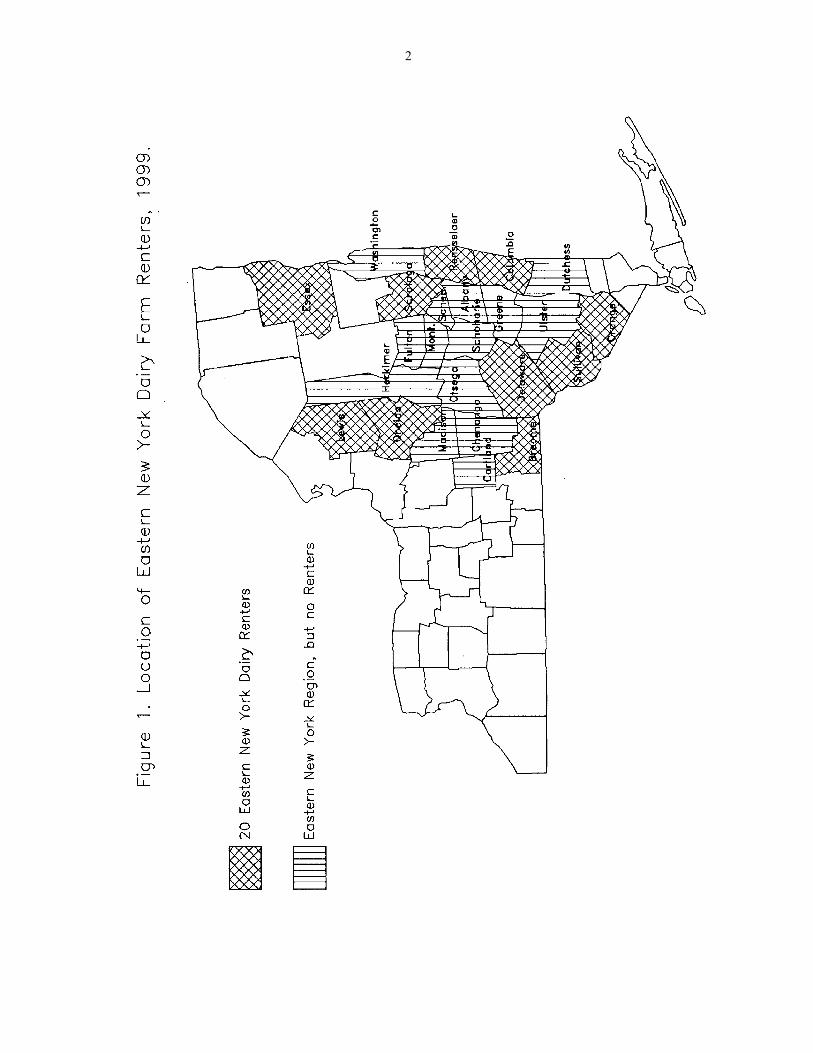
This Eastern New York Dairy Farm Renter Business Summary is an average of 20 businesses that are rentingsubstantially all of the farm real estate. The farm income, financial summary, and business analysis sections of this reportinclude comparisons with average data on 138 owned dairy farms in the region. This report is prepared in workbook formfor farm renters to use in the systematic study of their farm business operations.
Business records for 20 farms in Broome, Columbia, Delaware, Essex, Lewis, Oneida, Orange, Rensselaer,Saratoga, and Sullivan Counties are summarized in this publication. The Eastern New York region consists of thesecounties plus Albany, Chenango, Cortland, Dutchess, Fulton, Greene, Herkimer, Madison, Montgomery, Otsego,Schenectady, Schoharie, Ulster, and Washington Counties which do not have dairy farm business summary participantsthat classify as renters (see Figure 1 on page 2). The 138 owned dairy farms summarized in this publication include farmsfrom the entire region.
Use Comparative Profitability Data With Caution
The profitability analysis on page 8 implies that renting a dairy farm provides a greater return to the operator’slabor and management than owning the farm. Concessionary rental rates set by some land owners is a major factor. Thefarm owners are often father and mother and other landlords who are willing to accept a very low return for theirinvestment. Total real estate costs including depreciation and interest on real estate investment averaged $146 per tillableacre on the owned dairy farms compared to $95 on the rented farms. This accounts for a $32,348 difference in costsbetween owned and rented farms. Even with this difference in cost structure, the owners had a greater net farm income percow and higher rates of return on equity and all capital.
1Wayne A. Knoblauch, Linda D. Putnam and Jason Karszes, Dairy Farm Management Business Summary, New York,1999, R.B. 2000-03, October 2000.
2
3
SUMMARY AND ANALYSIS OF THE FARM BUSINESS
Business Characteristics and Resources Used
Recognition of important business characteristics and identification of the farm resources used are necessary forevaluating management performance. The combination of resources and management practices is known as farmorganization. Important farm business characteristics, the number of farms reporting these characteristics, and a listing ofthe average labor, land, and dairy cattle resources used are presented in the following table.
BUSINESS CHARACTERISTICS AND RESOURCES USED20 Eastern New York Dairy Farm Renters, 1999
Type of Business Number bST Usage NumberSingle proprietorship 13 Used on <25% of herd 2Partnership 5 Used on 25-75% of herd 4Subchapter S corporation 1 Used on >75% of herd 0Subchapter C corporation 1 Stopped using in 1999 0
Not used in 1999 14Milking System NumberDumping station 0 Labor Force* My Farm AveragePipeline 12 Operator 1 ____mo. 12.4Herringbone parlor 6 Operator 2 ____mo. 3.3Other parlor 2 Family paid ____mo. 1.6
Family unpaid ____mo. 4.3Type of Barn Number Hired ____mo. 10.1Stanchion 12 Total ____mo. 31.7Freestall 8 Worker equivalentCombination 0 (total ÷ 12) ______ 2.64
Dairy Records Service Number Operator/Manager Equiv. ______ 1.28Testing service 16On-farm system 1 Land Use My Farm AverageOther 0 Total acres rented ______ 361None 3 Tillable acres rented ______ 231
Business Record System Number Number of Cows My Farm AverageAccount book 9 Beg. year (owned) ______ 84Accounting service 1 End year (owned & leased) ______ 94On-farm computer 10 Average for year (owned & leased) ______ 92Other 0
*Based on hours actually worked by owner/operator, instead of standard 12 months per full-time owner/operator. Thestandard 12 months is used for operator/manager equivalent when calculating labor and management income per operator.
Predominate business characteristics of the 20 rented farms include the single proprietorship, pipeline milkingsystem, stanchion or conventional stall barn, herd records with a testing service and an account book or on-farm computerrecord system. Fifty percent of the renters were using on-farm computers compared to 46 percent of the owners.
The average size of the labor force on the rented farms was 56 percent less than the 4.11 worker equivalent onowned farms. The rented farms averaged 234 tillable acres and 92 cows compared to 375 tillable acres and 136 cows onthe 138 owned dairy farms in the same region. The owned farms averaged 33 cows per worker, compared to 35 cows perworker on the rented farms. In 1999, the rented farms used land and labor resources as efficiently as the owned farms.
4
Income Statement
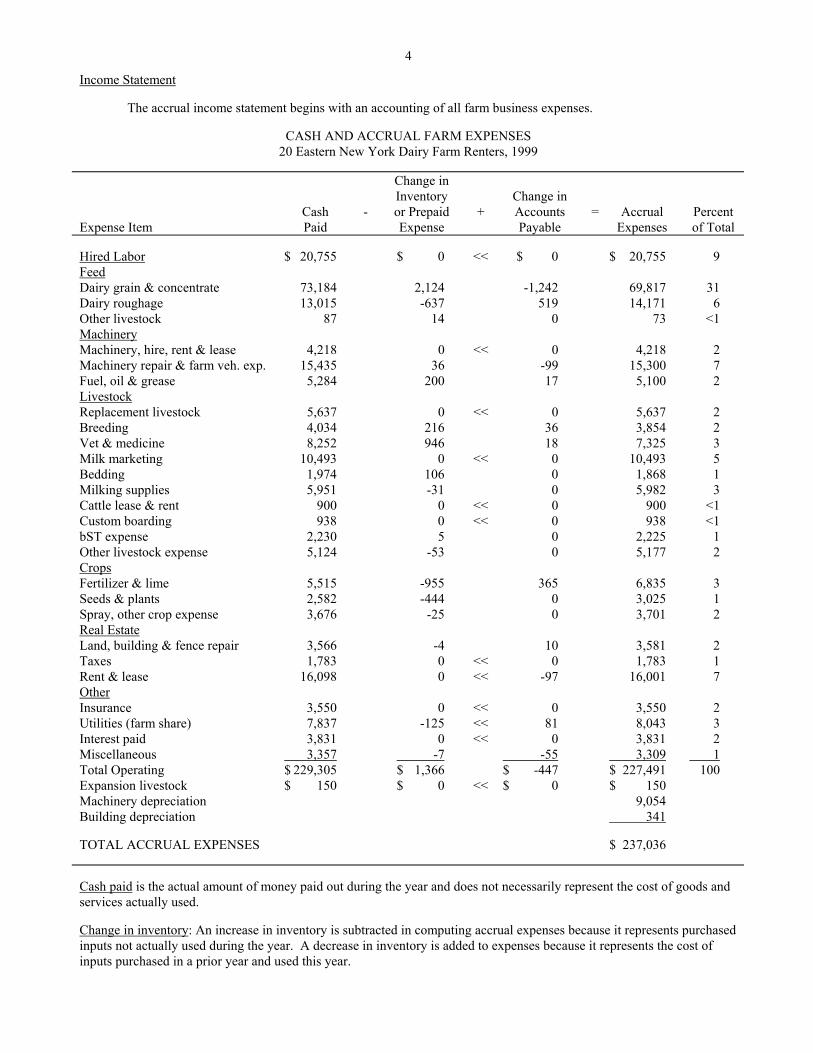
The accrual income statement begins with an accounting of all farm business expenses.
CASH AND ACCRUAL FARM EXPENSES20 Eastern New York Dairy Farm Renters, 1999
Cash paid is the actual amount of money paid out during the year and does not necessarily represent the cost of goods andservices actually used.
Change in inventory: An increase in inventory is subtracted in computing accrual expenses because it represents purchasedinputs not actually used during the year. A decrease in inventory is added to expenses because it represents the cost ofinputs purchased in a prior year and used this year.
5
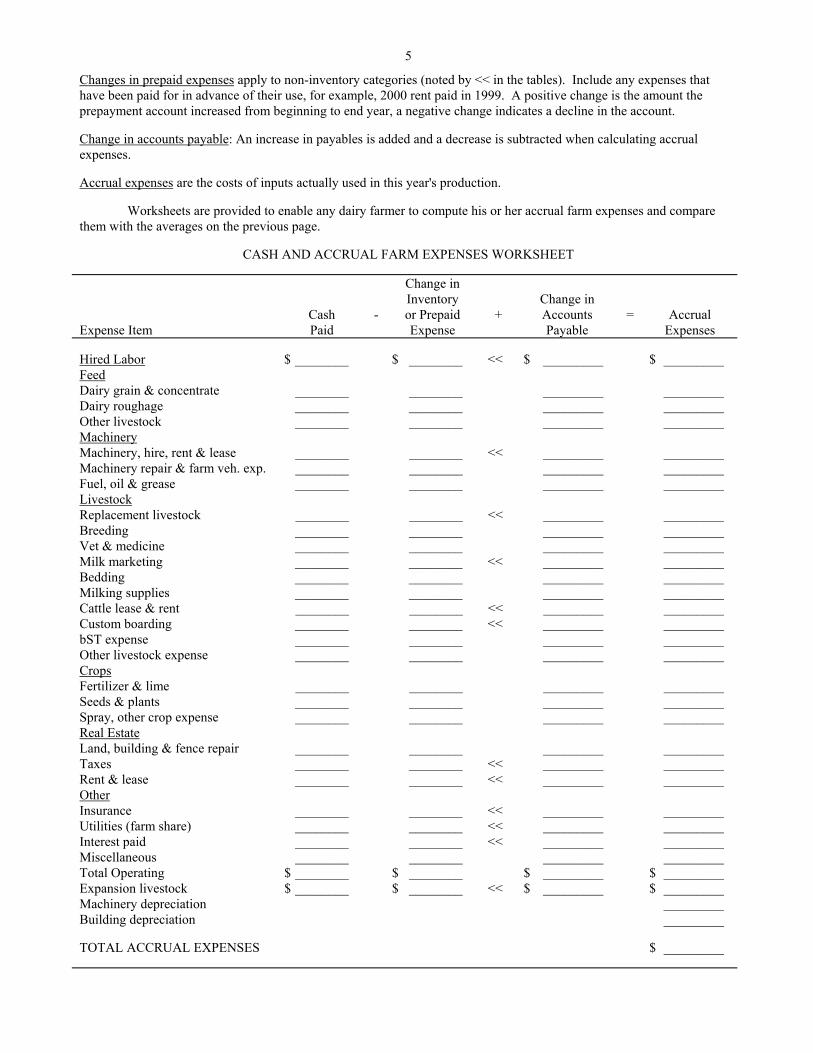
Changes in prepaid expenses apply to non-inventory categories (noted by << in the tables). Include any expenses thathave been paid for in advance of their use, for example, 2000 rent paid in 1999. A positive change is the amount theprepayment account increased from beginning to end year, a negative change indicates a decline in the account.
Change in accounts payable: An increase in payables is added and a decrease is subtracted when calculating accrualexpenses.
Accrual expenses are the costs of inputs actually used in this year's production.
Worksheets are provided to enable any dairy farmer to compute his or her accrual farm expenses and comparethem with the averages on the previous page.
*Change in advanced government receipts.**Gifts or inheritances of cattle or crops included in inventory.
Cash receipts include the gross value of milk checks received during the year plus all other payments received from thesale of farm products, services, and government programs. Nonfarm income is not included in calculating farmprofitability.
Changes in inventory are calculated by subtracting beginning of year values from end of year values excludingappreciation. Increases in livestock inventory caused by herd growth and/or quality are added and decreases caused byherd reduction and for quality are subtracted. Changes in inventories of crops grown are also calculated. Changes inadvanced government receipts are calculated by subtracting the end year balance from the beginning year balance(balances are listed with the current liabilities on the Balance Sheet).
Changes in accounts receivable are calculated by subtracting beginning year balances from end year balances. TheJanuary milk check for this December's marketings compared with the previous January's check is included as a change inaccounts receivable.
Accrual receipts represent the value of all farm commodities produced and services actually generated by the farmerduring the year.
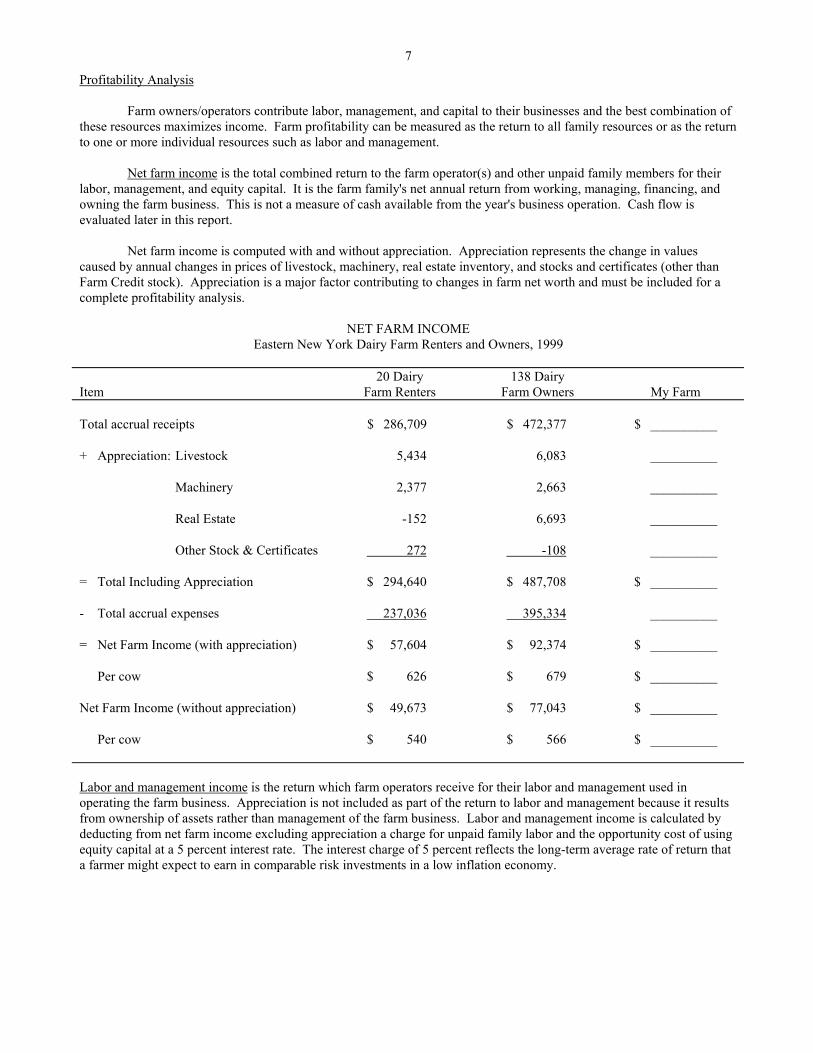
Farm owners/operators contribute labor, management, and capital to their businesses and the best combination ofthese resources maximizes income. Farm profitability can be measured as the return to all family resources or as the returnto one or more individual resources such as labor and management.
Net farm income is the total combined return to the farm operator(s) and other unpaid family members for theirlabor, management, and equity capital. It is the farm family's net annual return from working, managing, financing, andowning the farm business. This is not a measure of cash available from the year's business operation. Cash flow isevaluated later in this report.
Net farm income is computed with and without appreciation. Appreciation represents the change in valuescaused by annual changes in prices of livestock, machinery, real estate inventory, and stocks and certificates (other thanFarm Credit stock). Appreciation is a major factor contributing to changes in farm net worth and must be included for acomplete profitability analysis.
NET FARM INCOMEEastern New York Dairy Farm Renters and Owners, 1999
Item20 Dairy
Farm Renters138 Dairy
Farm Owners My Farm
Total accrual receipts $ 286,709 $ 472,377 $ __________
+ Appreciation: Livestock 5,434 6,083 __________
Machinery 2,377 2,663 __________
Real Estate -152 6,693 __________
Other Stock & Certificates 272 -108 __________
= Total Including Appreciation $ 294,640 $ 487,708 $ __________
- Total accrual expenses 237,036 395,334 __________
= Net Farm Income (with appreciation) $ 57,604 $ 92,374 $ __________
Per cow $ 626 $ 679 $ __________
Net Farm Income (without appreciation) $ 49,673 $ 77,043 $ __________
Per cow $ 540 $ 566 $ __________
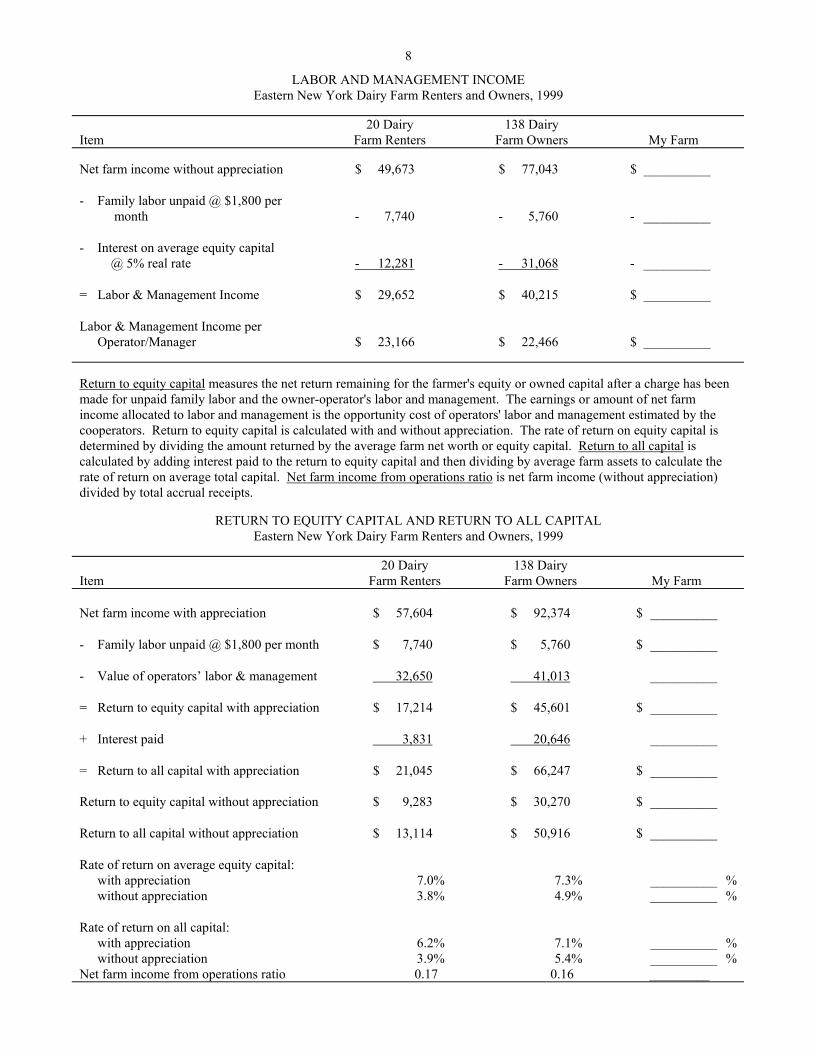
Labor and management income is the return which farm operators receive for their labor and management used inoperating the farm business. Appreciation is not included as part of the return to labor and management because it resultsfrom ownership of assets rather than management of the farm business. Labor and management income is calculated bydeducting from net farm income excluding appreciation a charge for unpaid family labor and the opportunity cost of usingequity capital at a 5 percent interest rate. The interest charge of 5 percent reflects the long-term average rate of return thata farmer might expect to earn in comparable risk investments in a low inflation economy.
8
LABOR AND MANAGEMENT INCOMEEastern New York Dairy Farm Renters and Owners, 1999
Item20 Dairy
Farm Renters138 Dairy
Farm Owners My Farm
Net farm income without appreciation $ 49,673 $ 77,043 $ __________
- Family labor unpaid @ $1,800 per month - 7,740 - 5,760 - __________
- Interest on average equity capital @ 5% real rate - 12,281 - 31,068 - __________
Return to equity capital measures the net return remaining for the farmer's equity or owned capital after a charge has beenmade for unpaid family labor and the owner-operator's labor and management. The earnings or amount of net farmincome allocated to labor and management is the opportunity cost of operators' labor and management estimated by thecooperators. Return to equity capital is calculated with and without appreciation. The rate of return on equity capital isdetermined by dividing the amount returned by the average farm net worth or equity capital. Return to all capital iscalculated by adding interest paid to the return to equity capital and then dividing by average farm assets to calculate therate of return on average total capital. Net farm income from operations ratio is net farm income (without appreciation)divided by total accrual receipts.
RETURN TO EQUITY CAPITAL AND RETURN TO ALL CAPITALEastern New York Dairy Farm Renters and Owners, 1999
Item20 Dairy
Farm Renters138 Dairy
Farm Owners My Farm
Net farm income with appreciation $ 57,604 $ 92,374 $ __________
- Family labor unpaid @ $1,800 per month $ 7,740 $ 5,760 $ __________
- Value of operators’ labor & management 32,650 41,013 __________
= Return to equity capital with appreciation $ 17,214 $ 45,601 $ __________
+ Interest paid 3,831 20,646 __________
= Return to all capital with appreciation $ 21,045 $ 66,247 $ __________
Return to equity capital without appreciation $ 9,283 $ 30,270 $ __________
Return to all capital without appreciation $ 13,114 $ 50,916 $ __________
Rate of return on average equity capital:with appreciation 7.0% 7.3% __________ %without appreciation 3.8% 4.9% __________ %
Rate of return on all capital:with appreciation 6.2% 7.1% __________ %without appreciation 3.9% 5.4% __________ %
Net farm income from operations ratio 0.17 0.16 _________
9
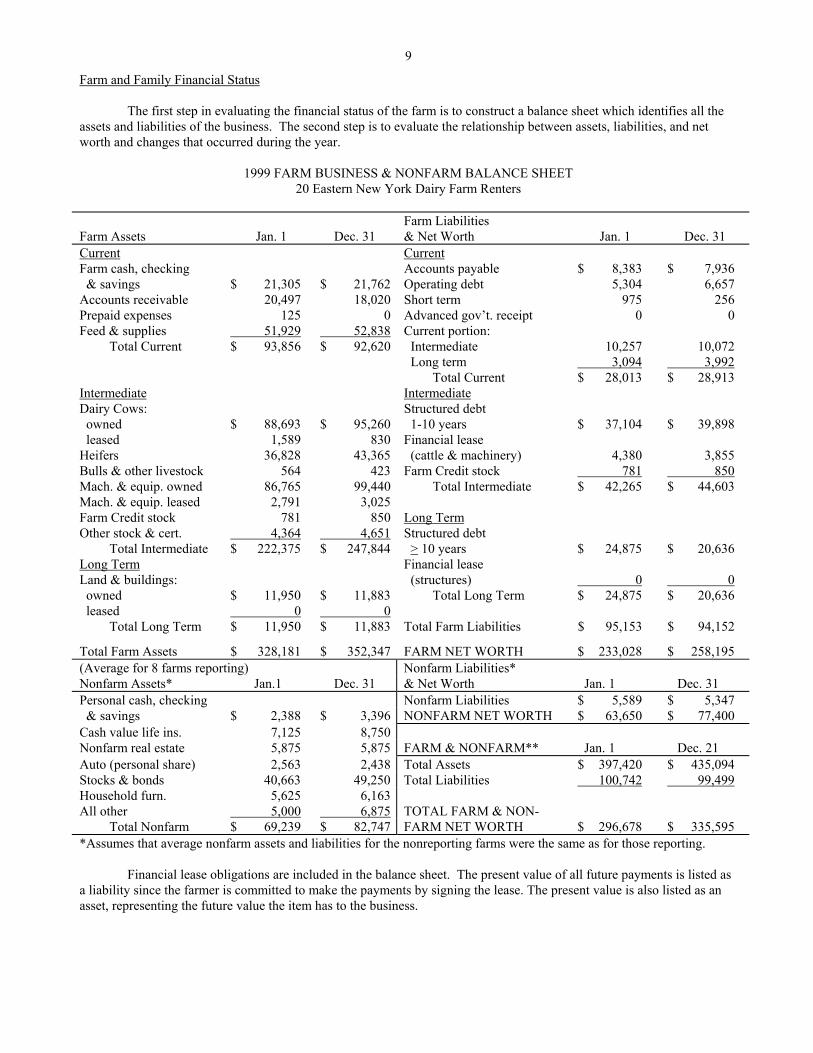
Farm and Family Financial Status
The first step in evaluating the financial status of the farm is to construct a balance sheet which identifies all theassets and liabilities of the business. The second step is to evaluate the relationship between assets, liabilities, and networth and changes that occurred during the year.
1999 FARM BUSINESS & NONFARM BALANCE SHEET20 Eastern New York Dairy Farm Renters
Total Intermediate $ 222,375 $ 247,844 > 10 years $ 24,875 $ 20,636Long Term Financial leaseLand & buildings: (structures) 0 0 owned $ 11,950 $ 11,883 Total Long Term $ 24,875 $ 20,636 leased 0 0
Total Long Term $ 11,950 $ 11,883 Total Farm Liabilities $ 95,153 $ 94,152
Total Farm Assets $ 328,181 $ 352,347 FARM NET WORTH $ 233,028 $ 258,195(Average for 8 farms reporting) Nonfarm Liabilities*Nonfarm Assets* Jan.1 Dec. 31 & Net Worth Jan. 1 Dec. 31Personal cash, checking Nonfarm Liabilities $ 5,589 $ 5,347 & savings $ 2,388 $ 3,396 NONFARM NET WORTH $ 63,650 $ 77,400Cash value life ins. 7,125 8,750Nonfarm real estate 5,875 5,875 FARM & NONFARM** Jan. 1 Dec. 21Auto (personal share) 2,563 2,438 Total Assets $ 397,420 $ 435,094Stocks & bonds 40,663 49,250 Total Liabilities 100,742 99,499Household furn. 5,625 6,163All other 5,000 6,875 TOTAL FARM & NON-
Total Nonfarm $ 69,239 $ 82,747 FARM NET WORTH $ 296,678 $ 335,595*Assumes that average nonfarm assets and liabilities for the nonreporting farms were the same as for those reporting.
Financial lease obligations are included in the balance sheet. The present value of all future payments is listed asa liability since the farmer is committed to make the payments by signing the lease. The present value is also listed as anasset, representing the future value the item has to the business.
10
Advance government receipts are included as current liabilities. Government payments received in 1999 that arefor participation in the 2000 program are the end year balance and payments received in 1998 for participation in the 1999program are the beginning year balance.
Total Intermediate _________ __________ ________ _________Long Term Financial leaseLand & buildings: (structures) ________ _________ owned _________ __________ Total Long Term ________ _________ leased _________ __________
Total Long Term _________ __________ Total Farm Liabilities ________ _________
Total Farm Assets _________ __________ FARM NET WORTH ________ _________
Nonfarm LiabilitiesNonfarm Assets Jan.1 Dec. 31 & Net Worth Jan. 1 Dec. 31Personal cash, checking Nonfarm Liabilities ________ _________ & savings _________ __________ ________ _________Cash value life ins. _________ __________ ________ _________Nonfarm real estate _________ __________ ________ _________Auto (personal share) _________ __________Stocks & bonds _________ __________ Total Nonfarm Liabilities ________ _________Household furn. _________ __________All other _________ __________ Nonfarm Net Worth _________ __________
Total Nonfarm _________ __________
TOTAL FARM & NONFARM Jan. 1 Dec. 31Total Farm and Nonfarm Assets ________ _________Less Total Farm & Nonfarm Liabilities ________ _________Farm & Nonfarm Net Worth ________ _________
11
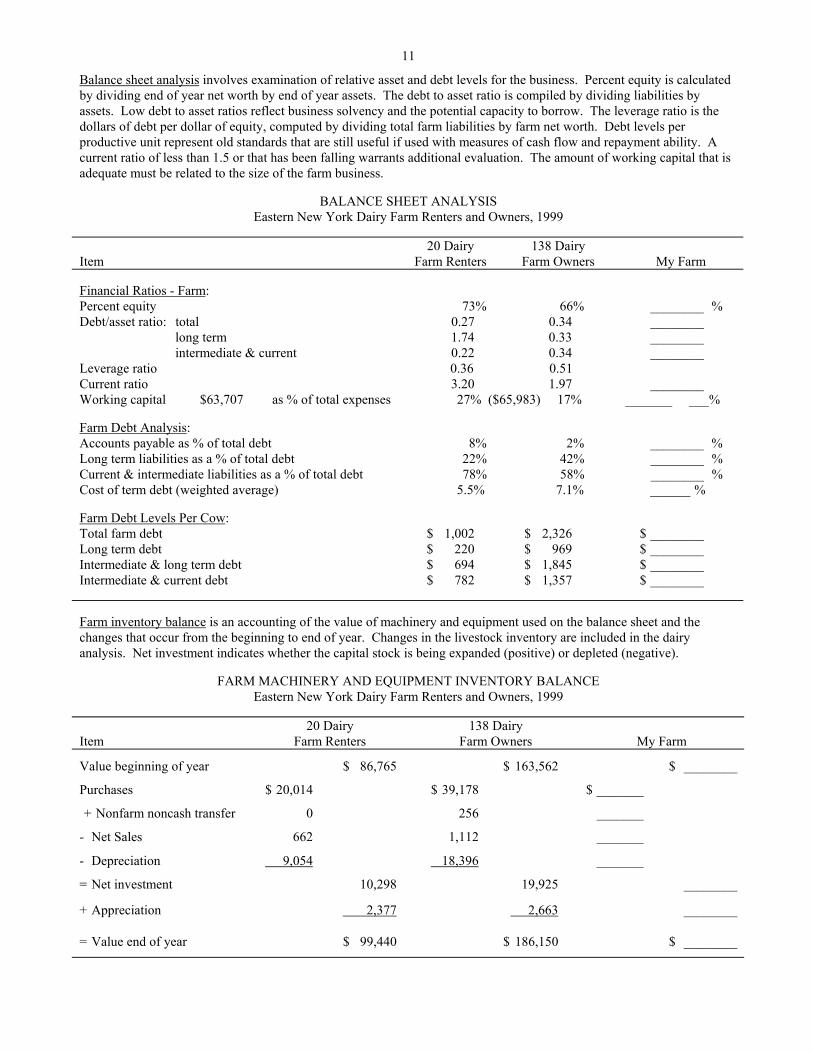
Balance sheet analysis involves examination of relative asset and debt levels for the business. Percent equity is calculatedby dividing end of year net worth by end of year assets. The debt to asset ratio is compiled by dividing liabilities byassets. Low debt to asset ratios reflect business solvency and the potential capacity to borrow. The leverage ratio is thedollars of debt per dollar of equity, computed by dividing total farm liabilities by farm net worth. Debt levels perproductive unit represent old standards that are still useful if used with measures of cash flow and repayment ability. Acurrent ratio of less than 1.5 or that has been falling warrants additional evaluation. The amount of working capital that isadequate must be related to the size of the farm business.
BALANCE SHEET ANALYSISEastern New York Dairy Farm Renters and Owners, 1999
long term 1.74 0.33 ________intermediate & current 0.22 0.34 ________
Leverage ratio 0.36 0.51 Current ratio 3.20 1.97 ________Working capital $63,707 as % of total expenses 27% ($65,983) 17% _______ ___%
Farm Debt Analysis:Accounts payable as % of total debt 8% 2% ________ %Long term liabilities as a % of total debt 22% 42% ________ %Current & intermediate liabilities as a % of total debt 78% 58% ________ %Cost of term debt (weighted average) 5.5% 7.1% ______ %
Farm Debt Levels Per Cow:Total farm debt $ 1,002 $ 2,326 $ ________Long term debt $ 220 $ 969 $ ________Intermediate & long term debt $ 694 $ 1,845 $ ________Intermediate & current debt $ 782 $ 1,357 $ ________
Farm inventory balance is an accounting of the value of machinery and equipment used on the balance sheet and thechanges that occur from the beginning to end of year. Changes in the livestock inventory are included in the dairyanalysis. Net investment indicates whether the capital stock is being expanded (positive) or depleted (negative).
FARM MACHINERY AND EQUIPMENT INVENTORY BALANCEEastern New York Dairy Farm Renters and Owners, 1999
Item20 Dairy
Farm Renters138 Dairy
Farm Owners My Farm
Value beginning of year $ 86,765 $ 163,562 $ ________
Purchases $ 20,014 $ 39,178 $ _______
+ Nonfarm noncash transfer 0 256 _______
- Net Sales 662 1,112 _______
- Depreciation 9,054 18,396 _______
= Net investment 10,298 19,925 ________
+ Appreciation 2,377 2,663 ________
= Value end of year $ 99,440 $ 186,150 $ ________
12
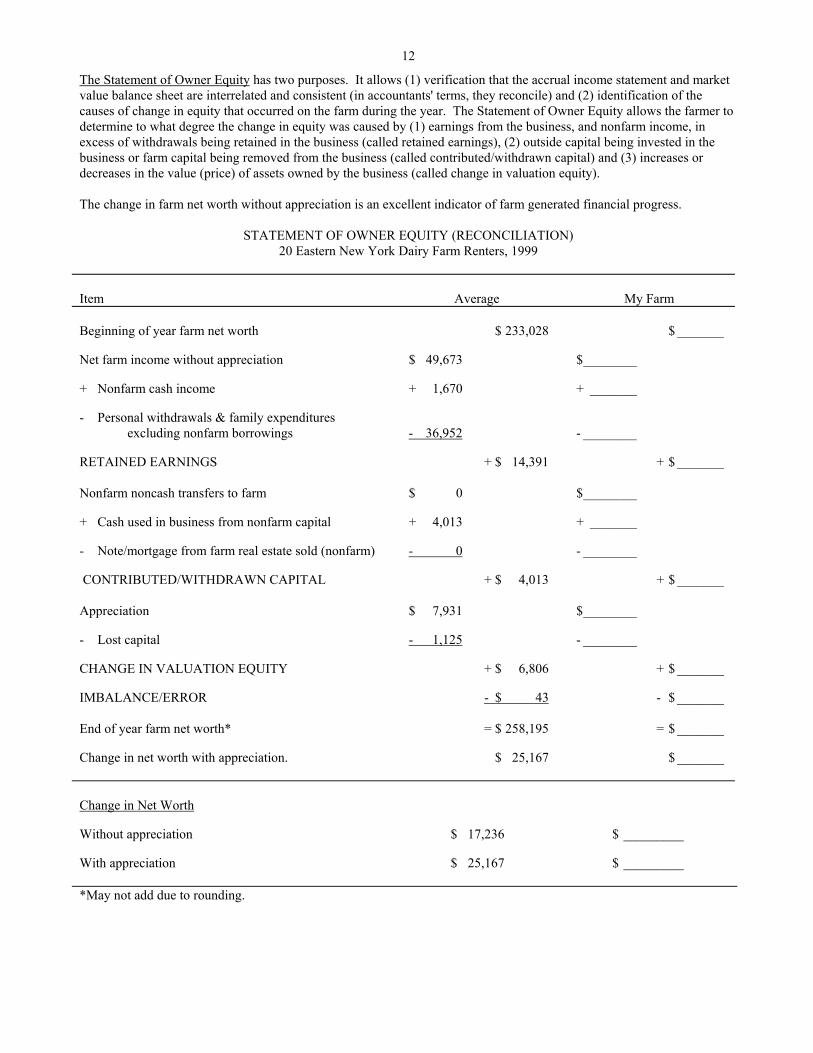
The Statement of Owner Equity has two purposes. It allows (1) verification that the accrual income statement and marketvalue balance sheet are interrelated and consistent (in accountants' terms, they reconcile) and (2) identification of thecauses of change in equity that occurred on the farm during the year. The Statement of Owner Equity allows the farmer todetermine to what degree the change in equity was caused by (1) earnings from the business, and nonfarm income, inexcess of withdrawals being retained in the business (called retained earnings), (2) outside capital being invested in thebusiness or farm capital being removed from the business (called contributed/withdrawn capital) and (3) increases ordecreases in the value (price) of assets owned by the business (called change in valuation equity).
The change in farm net worth without appreciation is an excellent indicator of farm generated financial progress.
STATEMENT OF OWNER EQUITY (RECONCILIATION)20 Eastern New York Dairy Farm Renters, 1999
Item Average My Farm
Beginning of year farm net worth $ 233,028 $ _______
Net farm income without appreciation $ 49,673 $________
+ Nonfarm cash income + 1,670 + _______
- Personal withdrawals & family expendituresexcluding nonfarm borrowings - 36,952 - ________
RETAINED EARNINGS + $ 14,391 + $ _______
Nonfarm noncash transfers to farm $ 0 $________
+ Cash used in business from nonfarm capital + 4,013 + _______
- Note/mortgage from farm real estate sold (nonfarm) - 0 - ________
CONTRIBUTED/WITHDRAWN CAPITAL + $ 4,013 + $ _______
Appreciation $ 7,931 $________
- Lost capital - 1,125 - ________
CHANGE IN VALUATION EQUITY + $ 6,806 + $ _______
IMBALANCE/ERROR - $ 43 - $ _______
End of year farm net worth* = $ 258,195 = $ _______
Change in net worth with appreciation. $ 25,167 $ _______
Change in Net Worth
Without appreciation $ 17,236 $ _________
With appreciation $ 25,167 $ _________
*May not add due to rounding.
13
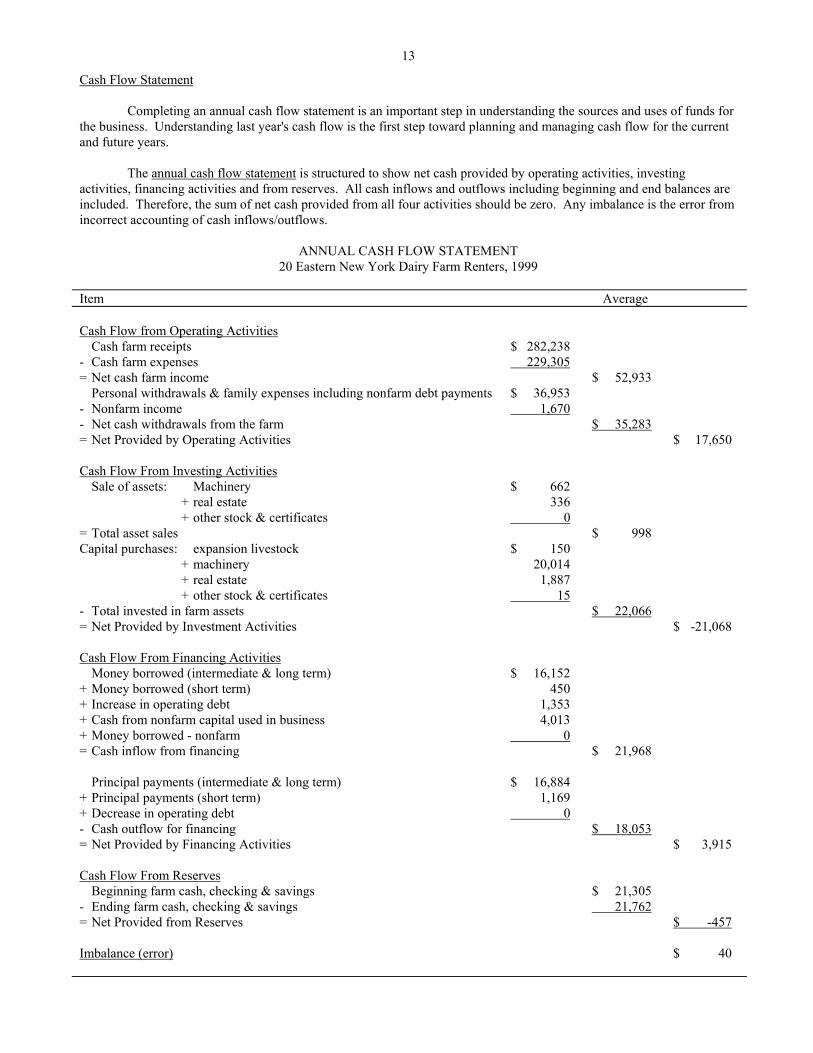
Cash Flow Statement
Completing an annual cash flow statement is an important step in understanding the sources and uses of funds forthe business. Understanding last year's cash flow is the first step toward planning and managing cash flow for the currentand future years.
The annual cash flow statement is structured to show net cash provided by operating activities, investingactivities, financing activities and from reserves. All cash inflows and outflows including beginning and end balances areincluded. Therefore, the sum of net cash provided from all four activities should be zero. Any imbalance is the error fromincorrect accounting of cash inflows/outflows.
ANNUAL CASH FLOW STATEMENT20 Eastern New York Dairy Farm Renters, 1999
Item Average
Cash Flow from Operating ActivitiesCash farm receipts $ 282,238
- Cash farm expenses 229,305= Net cash farm income $ 52,933
Personal withdrawals & family expenses including nonfarm debt payments $ 36,953- Nonfarm income 1,670- Net cash withdrawals from the farm $ 35,283= Net Provided by Operating Activities $ 17,650
Cash Flow From Investing ActivitiesSale of assets: Machinery $ 662
+ machinery 20,014+ real estate 1,887+ other stock & certificates 15
- Total invested in farm assets $ 22,066= Net Provided by Investment Activities $ -21,068
Cash Flow From Financing ActivitiesMoney borrowed (intermediate & long term) $ 16,152
+ Money borrowed (short term) 450+ Increase in operating debt 1,353+ Cash from nonfarm capital used in business 4,013+ Money borrowed - nonfarm 0= Cash inflow from financing $ 21,968
Principal payments (intermediate & long term) $ 16,884+ Principal payments (short term) 1,169+ Decrease in operating debt 0- Cash outflow for financing $ 18,053= Net Provided by Financing Activities $ 3,915
- Ending farm cash, checking & savings 21,762= Net Provided from Reserves $ -457
Imbalance (error) $ 40
14
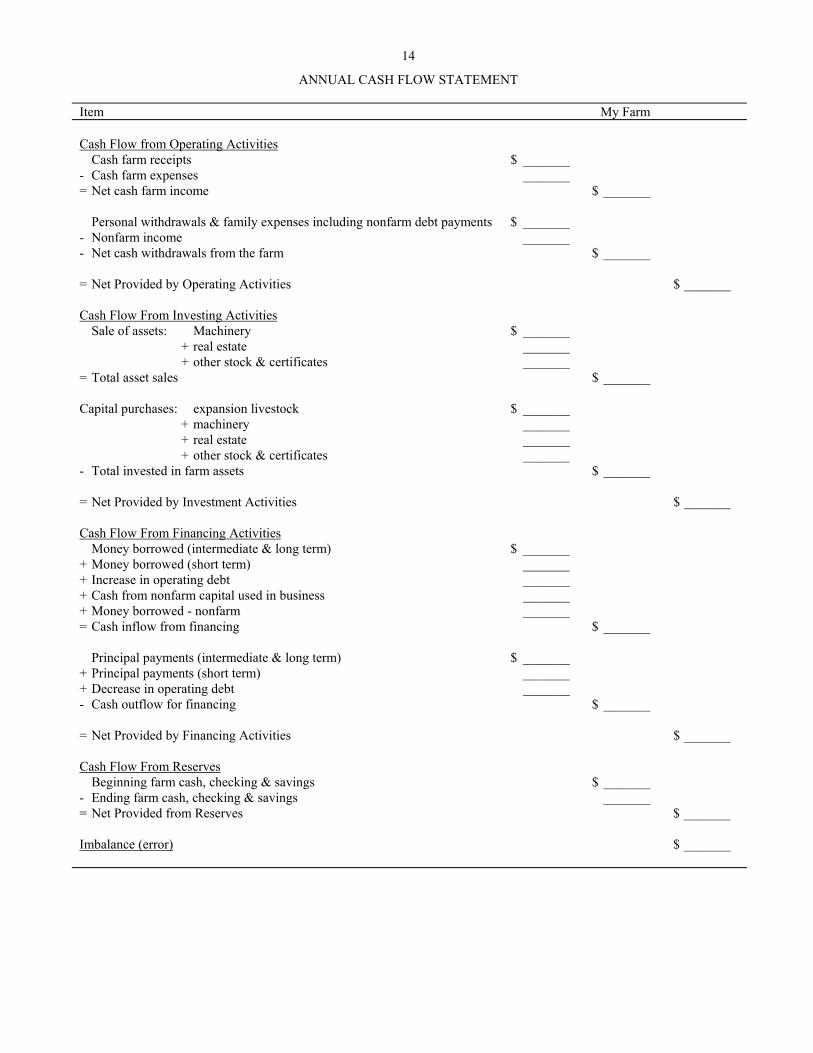
ANNUAL CASH FLOW STATEMENT
Item My Farm
Cash Flow from Operating ActivitiesCash farm receipts $ _______
- Cash farm expenses _______= Net cash farm income $ _______
Personal withdrawals & family expenses including nonfarm debt payments $ _______- Nonfarm income _______- Net cash withdrawals from the farm $ _______
= Net Provided by Operating Activities $ _______
Cash Flow From Investing ActivitiesSale of assets: Machinery $ _______
+ real estate _______+ other stock & certificates _______
= Total asset sales $ _______
Capital purchases: expansion livestock $ _______+ machinery _______+ real estate _______+ other stock & certificates _______
- Total invested in farm assets $ _______
= Net Provided by Investment Activities $ _______
Cash Flow From Financing ActivitiesMoney borrowed (intermediate & long term) $ _______
+ Money borrowed (short term) _______+ Increase in operating debt _______+ Cash from nonfarm capital used in business _______+ Money borrowed - nonfarm _______= Cash inflow from financing $ _______
Principal payments (intermediate & long term) $ _______+ Principal payments (short term) _______+ Decrease in operating debt _______- Cash outflow for financing $ _______
- Ending farm cash, checking & savings _______= Net Provided from Reserves $ _______
Imbalance (error) $ _______
15
Repayment Analysis
The second step in cash flow analysis is to compare the debt payments planned for the last year with the amountactually paid. The measures listed below provide a number of different perspectives on the repayment performance of thebusiness. However, the critical question to many farmers and lenders is whether planned payments can be made in 2000.The cash flow projection worksheet on the next page can be used to estimate repayment ability, which can then becompared to planned 2000 debt payments shown below.
FARM DEBT PAYMENTS PLANNEDSame 12 Eastern New York Dairy Farm Renters, 1999*
Average My Farm1999 Payments Planned 1999 Payments Planned
Per cow $ 335 $ 273 $ ________ $ ________Per cwt. 1999 milk $ 1.77 $ 1.45 $ ________ $ ________Percent of total 1999 receipts 11% 9% ________ ________Percent of 1999 milk receipts 12% 10% ________ ________
*Farms that completed Dairy Farm Business Summaries for both 1998 and 1999.
The cash flow coverage ratio and debt coverage ratio measure the ability of the farm business to meet its planned debtpayment schedule. The ratios show the percentage of planned payments (as of December 31, 1998) that could have beenmade with the amount available for debt service in 1999. Farmers that did not participate in DFBS last year will find intheir report coverage ratios based on planned debt payments for 2000.
COVERAGE RATIOSSame 12 New York Dairy Farm Renters 1998 & 1999
Item Average Item My FarmCash Flow Coverage Ratio Debt Coverage Ratio
Cash farm receipts $ 298,852 Net farm income (w/o appreciation) $ 52,470- Cash farm expenses 244,888 + Depreciation 7,758+ Interest paid (cash) 4,582 + Interest paid (accrual) 4,582- Net personal withdrawals from farm* 34,630 - Net personal withdrawals from farm* 34,630(A) = Amount Available for Debt Service $ 23,916 (A’) = Repayment Capacity $ 30,180(B) = Debt Payments Planned for 1999(as of December 31, 1998)
$ 32,142 (B) = Debt Payments Planned for 1999(as of December 31, 1998)
$ 32,142
(A/B)=Cash Flow Coverage Ratio for 1999 0.74 (A’/B)=Debt Coverage Ratio for 1999 0.94--------------------------------------------------------------------------------------------------------------------------------------------------------------------------------------------------------------
Same 108 Eastern New York Dairy Farm Owners, 1998 & 1999(A) = Amount Available for Debt Service $ 77,454 (A’) = Repayment Capacity $ 91,888(B) = Debt Payments Planned for 1999 62,444 (B) = Debt Payments Planned for 1999 62,444(A/B)=Cash Flow Coverage Ratio for 1999 1.24 (A’/B)=Debt Coverage Ratio for 1999 1.47
*Personal withdrawals and family expenditures less nonfarm income and nonfarm money borrowed. If familywithdrawals are excluded, or inaccurately included, the coverage ratios will be incorrect.
16
ANNUAL CASH FLOW WORKSHEET20 Dairy My Farm Expected 2000
Item Farm Renters Total Per Cow Change Projection(per cow)
*Includes change in prepaid expenses. **Excludes change in interest account payable.
17
Cropping Program Analysis
The cropping program is an important part of the dairy farm business and sometimes it is overlooked andneglected. A complete evaluation of available land resources, how they are being used, how well crops are producing andwhat it costs to produce them, is required to evaluate alternative cropping and feed purchasing choices.
LAND RESOURCES AND CROP PRODUCTIONEastern New York Dairy Farm Renters Reporting, 1999
*1999 average yields for 138 dairy farm owners in Eastern New York included: all hay crops, 2.4 tons dry matter per acre;corn silage, 14.8 tons per acre.
Average crop acres and yields compiled for the region are for the number of farms reporting each crop. Yields offorage crops have been converted to tons of dry matter using dry matter coefficients reported by the farmers. Grainproduction has been converted to bushels of dry grain equivalent based on dry matter information provided.
The following measures of crop management indicate how efficiently the land resource is being used and howwell total forage requirements are being met.
CROP MANAGEMENT FACTORSEastern New York Dairy Farm Renters and Owners, 1999
Item20 Dairy
Farm Renters138 Dairy
Farm Owners My Farm
Total tillable acres per cow 2.54 2.76 ______________
Total forage acres per cow 2.16 2.40 ______________
Harvested forage dry matter, tons per cow 4.90 7.89 ______________
18
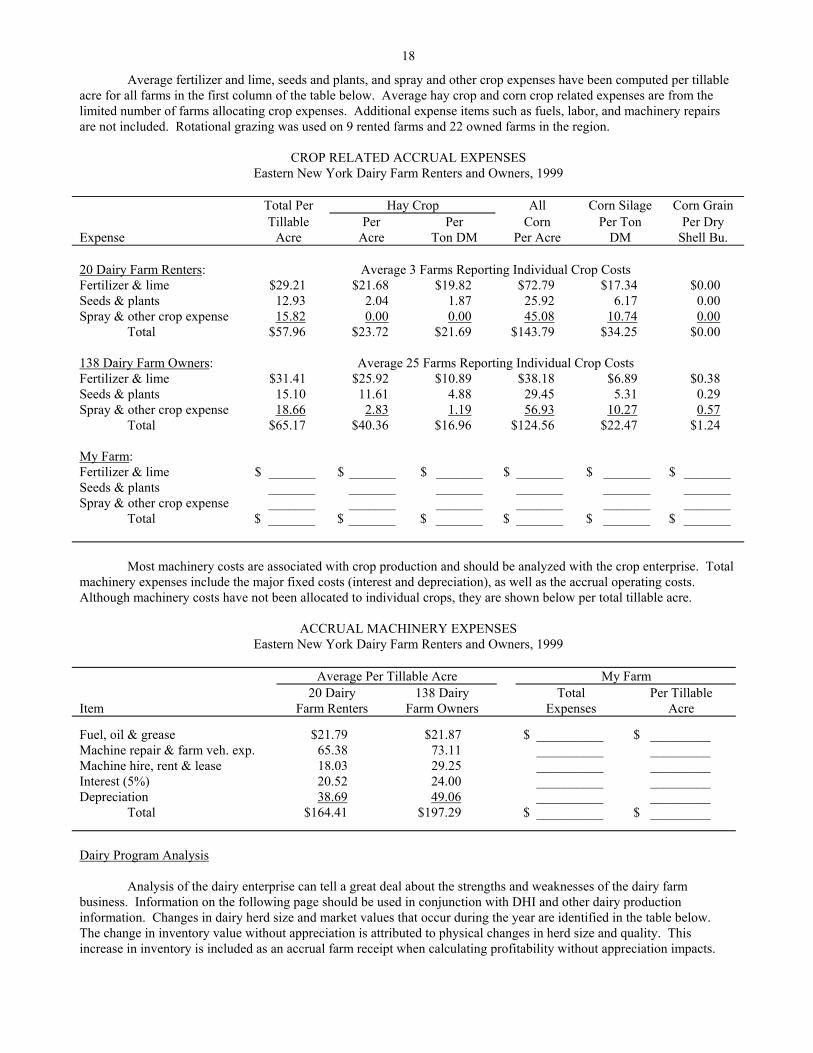
Average fertilizer and lime, seeds and plants, and spray and other crop expenses have been computed per tillableacre for all farms in the first column of the table below. Average hay crop and corn crop related expenses are from thelimited number of farms allocating crop expenses. Additional expense items such as fuels, labor, and machinery repairsare not included. Rotational grazing was used on 9 rented farms and 22 owned farms in the region.
CROP RELATED ACCRUAL EXPENSESEastern New York Dairy Farm Renters and Owners, 1999
Most machinery costs are associated with crop production and should be analyzed with the crop enterprise. Totalmachinery expenses include the major fixed costs (interest and depreciation), as well as the accrual operating costs.Although machinery costs have not been allocated to individual crops, they are shown below per total tillable acre.
ACCRUAL MACHINERY EXPENSESEastern New York Dairy Farm Renters and Owners, 1999
Analysis of the dairy enterprise can tell a great deal about the strengths and weaknesses of the dairy farmbusiness. Information on the following page should be used in conjunction with DHI and other dairy productioninformation. Changes in dairy herd size and market values that occur during the year are identified in the table below.The change in inventory value without appreciation is attributed to physical changes in herd size and quality. Thisincrease in inventory is included as an accrual farm receipt when calculating profitability without appreciation impacts.
19
DAIRY HERD INVENTORYEastern New York Dairy Farm Renters and Owners, 1999
+ Change w/o apprec. 5,786 1,487 335 13+ Appreciation 3,796 1,016 827 424End year (owned) 139 $ 153,173 36 $ 34,636 36 $ 21,117 28 $ 8,670End including leased 141Average number 136 98 (all age groups)
My Farm:Beginning year (owned) __ $ ______ ___ $ ______ __ $ ______ __ $ ______
+ Change w/o apprec. ______ ______ ______ ______+ Appreciation ______ ______ ______ ______End year (owned) __ $ ______ ___ $ ______ __ $ ______ __ $ ______End including leased __Average number __ ___ (all age groups)
Total milk sold and milk sold per cow are extremely valuable measures of productivity on the dairy farm. Thesemeasures of milk output are based on pounds of milk marketed during the year.
MILK PRODUCTIONEastern New York Dairy Farm Renters and Owners, 1999
Item20 Dairy
Farm Renters138 Dairy
Farm Owners My Farm
Total milk sold, lbs. 1,704,107 2,722,533 ______________Milk sold per cow, lbs. 18,453 20,008 ______________Average milk plant test, % butterfat 3.67% 3.70% ______________
Monitoring and evaluating culling practices and experiences on an annual basis are important herd managementtools. Culling rate can have an affect on both milk per cow and profitability.
ANIMALS LEAVING THE HERDEastern New York Dairy Farm Renters and Owners, 1999
20 Renters 138 Owners My FarmItem Number Percent* Number Percent* Number Percent*Cows sold for beef 16 17.4 34 25.0 _______ _______Cows sold for dairy 4 4.3 1 0.7 _______ _______Cows died 3 3.3 5 3.7 _______ _______Culling rate** 20.7 28.7 _______
*Percent of average number of cows in the herd. ** Cows sold for beef plus cows died.
20
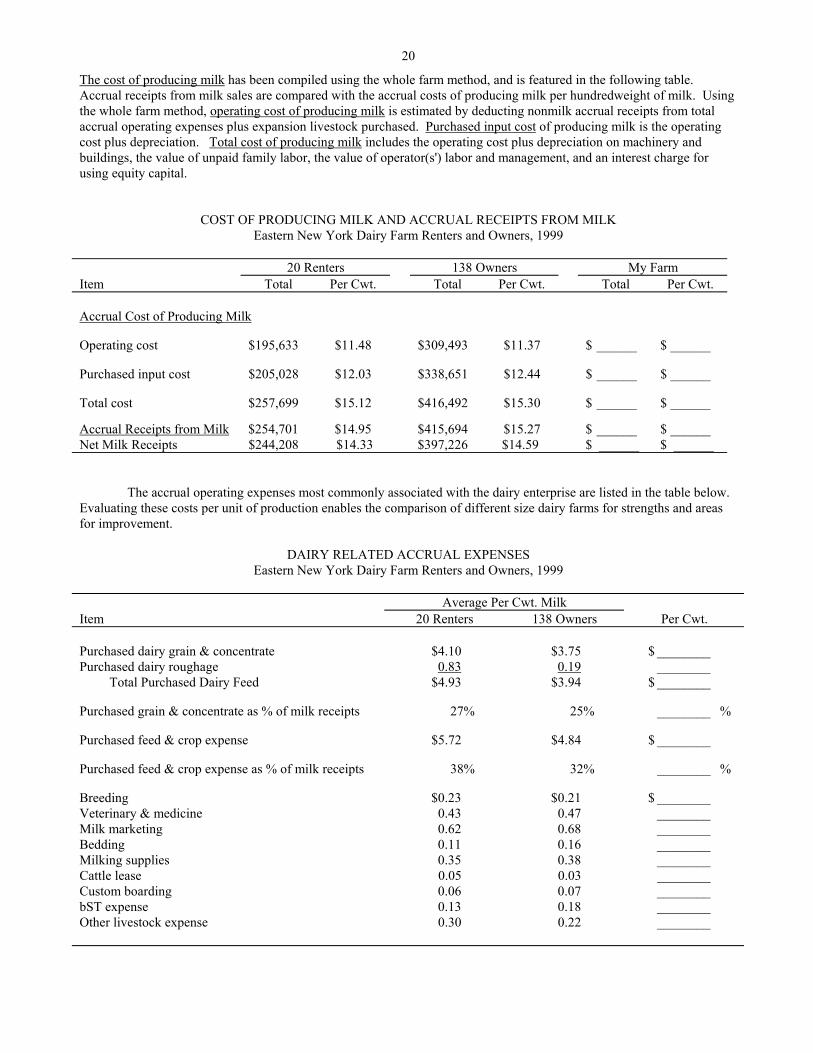
The cost of producing milk has been compiled using the whole farm method, and is featured in the following table.Accrual receipts from milk sales are compared with the accrual costs of producing milk per hundredweight of milk. Usingthe whole farm method, operating cost of producing milk is estimated by deducting nonmilk accrual receipts from totalaccrual operating expenses plus expansion livestock purchased. Purchased input cost of producing milk is the operatingcost plus depreciation. Total cost of producing milk includes the operating cost plus depreciation on machinery andbuildings, the value of unpaid family labor, the value of operator(s') labor and management, and an interest charge forusing equity capital.
COST OF PRODUCING MILK AND ACCRUAL RECEIPTS FROM MILKEastern New York Dairy Farm Renters and Owners, 1999
20 Renters 138 Owners My FarmItem Total Per Cwt. Total Per Cwt. Total Per Cwt.
The accrual operating expenses most commonly associated with the dairy enterprise are listed in the table below.Evaluating these costs per unit of production enables the comparison of different size dairy farms for strengths and areasfor improvement.
DAIRY RELATED ACCRUAL EXPENSESEastern New York Dairy Farm Renters and Owners, 1999
Average Per Cwt. MilkItem 20 Renters 138 Owners Per Cwt.
Capital efficiency factors measure how intensively the capital is being used in the farm business. The assetturnover ratio is the ratio of total farm income to total farm assets. It is calculated by dividing total accrual operatingreceipts plus appreciation by average total farm assets. Measures of labor efficiency are key indicators of management'ssuccess in generating products per unit of labor input.
CAPITAL EFFICIENCYEastern New York Dairy Farm Renters and Owners, 1999
Hired labor expense as % ofmilk sales 8.1% 11.2% _____%*$1,800 per month.
22
COMPARATIVE ANALYSIS OF THE FARM BUSINESS
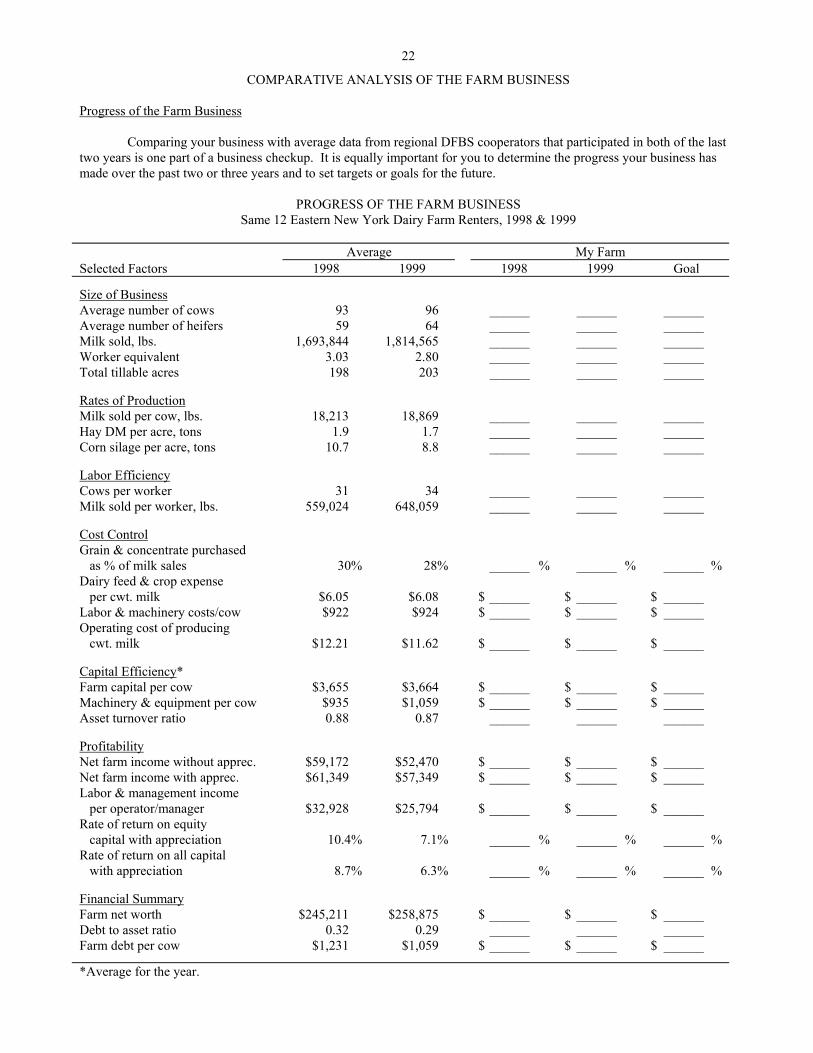
Progress of the Farm Business
Comparing your business with average data from regional DFBS cooperators that participated in both of the lasttwo years is one part of a business checkup. It is equally important for you to determine the progress your business hasmade over the past two or three years and to set targets or goals for the future.
PROGRESS OF THE FARM BUSINESSSame 12 Eastern New York Dairy Farm Renters, 1998 & 1999
Average My FarmSelected Factors 1998 1999 1998 1999 Goal
Size of BusinessAverage number of cows 93 96 ______ ______ ______Average number of heifers 59 64 ______ ______ ______Milk sold, lbs. 1,693,844 1,814,565 ______ ______ ______Worker equivalent 3.03 2.80 ______ ______ ______Total tillable acres 198 203 ______ ______ ______
Rates of ProductionMilk sold per cow, lbs. 18,213 18,869 ______ ______ ______Hay DM per acre, tons 1.9 1.7 ______ ______ ______Corn silage per acre, tons 10.7 8.8 ______ ______ ______
Labor EfficiencyCows per worker 31 34 ______ ______ ______Milk sold per worker, lbs. 559,024 648,059 ______ ______ ______
Capital Efficiency*Farm capital per cow $3,655 $3,664 $ ______ $ ______ $ ______Machinery & equipment per cow $935 $1,059 $ ______ $ ______ $ ______Asset turnover ratio 0.88 0.87 ______ ______ ______
ProfitabilityNet farm income without apprec. $59,172 $52,470 $ ______ $ ______ $ ______Net farm income with apprec. $61,349 $57,349 $ ______ $ ______ $ ______Labor & management income per operator/manager $32,928 $25,794 $ ______ $ ______ $ ______Rate of return on equity capital with appreciation 10.4% 7.1% ______ % ______ % ______ %Rate of return on all capital with appreciation 8.7% 6.3% ______ % ______ % ______ %
Financial SummaryFarm net worth $245,211 $258,875 $ ______ $ ______ $ ______Debt to asset ratio 0.32 0.29 ______ ______ ______Farm debt per cow $1,231 $1,059 $ ______ $ ______ $ ______
*Average for the year.
23
RECEIPTS AND EXPENSES PER COW AND PER CWT.Same 12 Eastern New York Dairy Farm Renters, 1998 & 1999
1998 1999Item Per Cow Per Cwt. Per Cow Per Cwt.Average Number of Cows 93 96Cwt. Of Milk Sold 16,938 18,146
Total Expenses $ 2,545 $ 13.97 $ 2,607 $ 13.79Net Farm Income Without Appreciation $ 636 $ 3.49 $ 547 $ 2.89
24
Regional Farm Business Chart
The Farm Business Chart is a tool which can be used in analyzing your business. Compare your business bydrawing a line through or near the figure in each column which represents your current level of performance. The 5figures in each column represent the average of each 20 percent or quintile of farms included in the regional summary.
FARM BUSINESS CHART FOR FARM MANAGEMENT COOPERATORS20 Eastern New York Dairy Farm Renters, 1999
Size of Business Rates of Production Labor EfficiencyWorkerEquiv-alent
*Page number of the participant's DFBS where the factor is located.
25
Regional Financial Analysis Chart
The farm financial analysis chart is designed just like the Farm Business Chart and may be used to assess thefinancial health of the farm business. Most of the financial measures used in the chart are defined on pages 7, 8, 11, and15 of this publication. References to DFBS output page numbers for participating dairy farmers are provided in the tableheadings.
FINANCIAL ANALYSIS CHART20 Eastern New York Dairy Farm Renters, 1999
*Page number of the participant's DFBS where the factor is located. **Dollars of debt per dollar of equity, computed by dividing total liabilities by total equity.***Return on all farm capital (no deduction for interest paid) divided by total farm assets.
26
IDENTIFY AND SET GOALS
If businesses are to be successful, they must have direction. Written goals help provide businesses with anidentifiable direction over both the long and the short term. Goal setting is as important on a dairy farm as it is in otherbusinesses. Written goals are a tool which farm operators can use to ensure that the business continues to move in theproper direction. Goals should be SMART:
1. Goals should be Specific.
2. Goals should be Measurable.
3. Goals should be Achievable but challenging.
4. Goals should be Rewarding.
5. You should designate a Time when each goal will be achieved.
Goal setting on a dairy farm does not have to be a complex process. In many cases it provides a process forwriting down and agreeing on goals that you have already given some thought to. It is also important to remember thatonce you write out your goals they are not cast in concrete. If a change takes place which has a major impact on the farmbusiness, the goals should be reworked to accommodate that change. Refer to your goals as often as necessary to keep thefarm business progressing.
It is important to identify both objectives (long-range) and goals (short-range) when looking at the future of yourfarm business.
A suggested format for writing out your goals is as follows:
a. Begin with a mission statement which describes why the business exists based on the preferences andvalues of the owners.
The Farm Business and Financial Analysis Charts on pages 24 and 25 can be used to help identify strengths andweaknesses of your farm business. Identify three major strengths and three areas of your farm business that needimprovement.
Strengths:____________________________________ Need Improvements: _____________________________
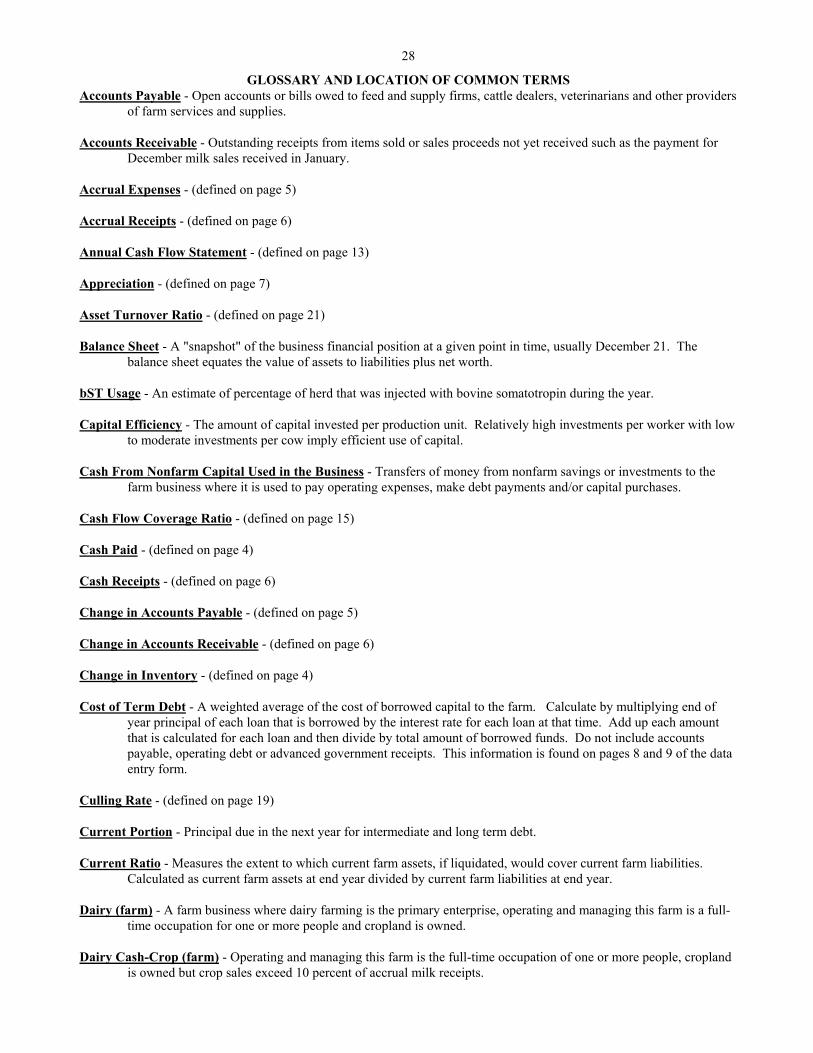
GLOSSARY AND LOCATION OF COMMON TERMSAccounts Payable - Open accounts or bills owed to feed and supply firms, cattle dealers, veterinarians and other providers
of farm services and supplies.
Accounts Receivable - Outstanding receipts from items sold or sales proceeds not yet received such as the payment forDecember milk sales received in January.
Accrual Expenses - (defined on page 5)
Accrual Receipts - (defined on page 6)
Annual Cash Flow Statement - (defined on page 13)
Appreciation - (defined on page 7)
Asset Turnover Ratio - (defined on page 21)
Balance Sheet - A "snapshot" of the business financial position at a given point in time, usually December 21. Thebalance sheet equates the value of assets to liabilities plus net worth.
bST Usage - An estimate of percentage of herd that was injected with bovine somatotropin during the year.
Capital Efficiency - The amount of capital invested per production unit. Relatively high investments per worker with lowto moderate investments per cow imply efficient use of capital.
Cash From Nonfarm Capital Used in the Business - Transfers of money from nonfarm savings or investments to thefarm business where it is used to pay operating expenses, make debt payments and/or capital purchases.
Cash Flow Coverage Ratio - (defined on page 15)
Cash Paid - (defined on page 4)
Cash Receipts - (defined on page 6)
Change in Accounts Payable - (defined on page 5)
Change in Accounts Receivable - (defined on page 6)
Change in Inventory - (defined on page 4)
Cost of Term Debt - A weighted average of the cost of borrowed capital to the farm. Calculate by multiplying end ofyear principal of each loan that is borrowed by the interest rate for each loan at that time. Add up each amountthat is calculated for each loan and then divide by total amount of borrowed funds. Do not include accountspayable, operating debt or advanced government receipts. This information is found on pages 8 and 9 of the dataentry form.
Culling Rate - (defined on page 19)
Current Portion - Principal due in the next year for intermediate and long term debt.
Current Ratio - Measures the extent to which current farm assets, if liquidated, would cover current farm liabilities.Calculated as current farm assets at end year divided by current farm liabilities at end year.
Dairy (farm) - A farm business where dairy farming is the primary enterprise, operating and managing this farm is a full-time occupation for one or more people and cropland is owned.
Dairy Cash-Crop (farm) - Operating and managing this farm is the full-time occupation of one or more people, croplandis owned but crop sales exceed 10 percent of accrual milk receipts.
29
Debt Per Cow - Total end-of-year debt divided by end-of-year number of cows.
Debt to Asset Ratios - (defined on page 11)
Depreciation Expense Ratio - Machinery and building depreciation divided by total accrual receipts.
Dry Matter - The amount or proportion of dry material that remains after all water is removed. Commonly used tomeasure dry matter percent and tons of dry matter in feed.
Equity Capital - The farm operator/manager's owned capital or farm net worth.
Expansion Livestock - Purchased dairy cattle and other livestock that cause an increase in herd size from the beginning tothe end of the year.
Farm Debt Payments as Percent of Milk Sales - Amount of milk income committed to debt repayment, calculated bydividing planned debt payments by total milk receipts. A reliable measure of repayment ability, see page 15.
Farm Debt Payments Per Cow - Planned or scheduled debt payments per cow represent the repayment plan scheduled atthe beginning of the year divided by the average number of cows for the year. This measure of repayment abilityis used in the Financial Analysis Chart.
Financial Lease - A long-term non-cancelable contract giving the lessee use of an asset in exchange for a series of leasepayments. The term of a financial lease usually covers a major portion of the economic life of the asset. Thelease is a substitute for purchase. The lessor retains ownership of the asset.
Hired Labor Expense per Hired Worker Equivalent - The total cost to the farm per hired worker equivalent. Divideaccrual hired labor expense by number of hired plus family paid worker equivalent.
Hired Labor Expense as % of Milk Sales - The percentage of the gross milk receipts that is used for labor expense.Divide accrual hired labor expense by accrual milk sales.
Income Statement - A complete and accurate account of farm business receipts and expenses used to measureprofitability over a period of time such as one year or one month.
Interest Expense Ratio - Accrual interest expense divided by total accrual receipts.
Labor and Management Income - (defined on page 8)
Labor and Management Income Per Operator - The return to the owner/manager's labor and management per full-timeoperator.
Labor Efficiency - Production capacity and output per worker.
Leverage Ratio - (defined on page 11)
Liquidity - Ability of business to generate cash to make debt payments or to convert assets to cash.
Net Farm Income - (defined on page 7)
Net Farm Income from Operations Ratio - (defined on page 8)
Net Worth - The value of assets less liabilities equal net worth. It is the equity the owner has in owned assets.
Operating Costs of Producing Milk - (defined on page 20)
Operating Expense Ratio - Total accrual expenses less interest and machinery and building depreciation divided by totalaccrual receipts.
30
Opportunity Cost - The cost or charge made for using a resource based on its value in its most likely alternative use. Theopportunity cost of a farmer's labor and management is the value he/she would receive if employed in his/hermost qualified alternative position.
Other Livestock Expenses - All other dairy herd and livestock expenses not included in more specific categories. Otherlivestock expenses include; bedding, DHIC, milk house and parlor supplies, livestock board, registration fees andtransfers.
Part-Time Cash-Crop Dairy (farm) - Operating and managing this farm is not a full-time occupation, crop sales exceed10 percent of accrual milk receipts and cropland is owned.
Part-Time Dairy (farm) - Dairy farming is the primary enterprise, cropland is owned but operating and managing thisfarm is not a full-time occupation for one or more people.
Personal Withdrawals and Family Expenditures Including Nonfarm Debt Payments - All the money removed fromthe farm business for personal or nonfarm use including family living expenses, health and life insurance, incometaxes, nonfarm debt payments, and investments.
Profitability - The return or net income the owner/manager receives for using one or more of his or her resources in thefarm business. True "economic profit" is what remains after deducting all costs including the opportunity costs ofthe owner/manager's labor, management, and equity capital.
Purchased Inputs Cost of Producing Milk - (defined on page 20)
Repayment Analysis - An evaluation of the business' ability to make planned debt payments.
Replacement Livestock - Dairy cattle and other livestock purchased to replace those that were culled or sold from theherd during the year.
Return on Equity Capital - (defined on page 8)
Return on Total Capital - (defined on page 8)
Return to Operators' Labor, Management, and Equity Capital - (defined on page 7)
Rotational Grazing - The dairy herd is on pasture at least three months of the year, changing paddock at least every threedays.
Solvency - The extent or ability of assets to cover or pay liabilities. Debt/asset and leverage ratios are common measuresof solvency.
Total Costs of Producing Milk - (defined on page 20)
Whole Farm Method - A procedure used to calculate costs of producing milk on dairy farms without using enterprisecost accounts. All non-milk receipts are assigned a cost equal to their sale value and deducted from total farmexpenses to determine the costs of producing milk.
Working Capital - A theoretical measure of the amount of funds available to purchase inputs and inventory items afterthe sale of current farm assets and payment of all current farm liabilities. Calculate as current farm assets at endyear less current farm liabilities at end year.
31
INDEXPage(s)
Accounts Payable ..................................................4,9Accounts Receivable .............................................6,9Accrual Expenses ..................................................4,7Accrual Receipts ....................................................6,7Acreage ................................................................3,17Advanced Government Receipts .........................9,10Amount Available for Debt Service ........................15Annual Cash Flow Statement .................................13Appreciation ...........................................7,8,11,12,19Asset Turnover Ratio...............................................21Balance Sheet ...........................................................9Barn Type .................................................................3bST Usage ................................................................ 3Business Type ..........................................................3Capital Efficiency ...................................................21Cash From Nonfarm Capital Used in the Business ...........................................................13Cash Flow Coverage Ratio .....................................15Cash Paid ..................................................................4Cash Receipts ......................................................6,13Change in Accounts Payable ....................................4Change in Accounts Receivable ...............................6Change in Inventory ..............................................4,6Change in Net Worth ..............................................12Cost of Term Debt ..................................................11Crop Expenses .....................................................4,18Crop/Dairy Ratios ...................................................17Culling Rate.............................................................19Current Portion..........................................................9Current Ratio ...........................................................11Dairy (farm) ..............................................................1Debt Coverage Ratio ...............................................15Debt Per Cow .........................................................11Debt to Asset Ratios ...............................................11Depreciation ....................................................... 4,11Depreciation Expense Ratio ....................................21Dry Matter ..............................................................17Equity Capital ...........................................................9Expansion Livestock ...........................................4,13Expenses ...................................................................4Farm Business Chart ...............................................24Farm Debt Payments as Percent of Milk Sales ............................................................15Farm Debt Payments Per Cow ...............................15Financial Analysis Chart ........................................24Financial Lease .........................................................9Hired Labor Expense per Hired Worker Equivalent ................................................21Hired Labor Expense as % of Milk Sales................21Income Statement .....................................................4Inflows ....................................................................13
Page(s)
Interest Expense Ratio ............................................ 21Labor and Management Income .............................. 8Labor and Management Income per Operator ............................................... 8Labor Efficiency .................................................... 21Land Resources ...................................................... 17Leverage Ratio ........................................................ 11Liquidity ................................................................. 11Machinery Expenses ........................................... 4,18Milk Production ..................................................... 19Milking System ........................................................ 3Money Borrowed ................................................... 13Net Farm Income ..................................................... 7Net Farm Income from Operations Ratio.................. 8Net Investment ....................................................... 11Net Worth ................................................................ 9Number of Cows..................................................... 19Operating Cost of Producing Milk ......................... 20Operating Expense Ratio ........................................ 21Opportunity Cost ...................................................... 8Other Livestock Expenses ........................................ 4Outflows ................................................................. 13Personal Withdrawals and Family Expenditures Including Nonfarm Debt Payments ..................... 13Principal Payments ................................................. 13Profitability .............................................................. 7Purchased Inputs Cost of Producing Milk ............. 20Receipts .................................................................... 6Record System ......................................................... 3Repayment Analysis .............................................. 15Replacement Livestock ............................................ 4Retained Earnings ................................................... 12Return on Equity Capital ......................................... 8Return on Total Capital ............................................ 8Rotational Grazing .................................................. 18Solvency ................................................................. 11Total Costs of Producing Milk ............................... 20Whole Farm Method .............................................. 20Worker Equivalent ................................................... 3Working Capital...................................................... 11Yields Per Acre ...................................................... 17
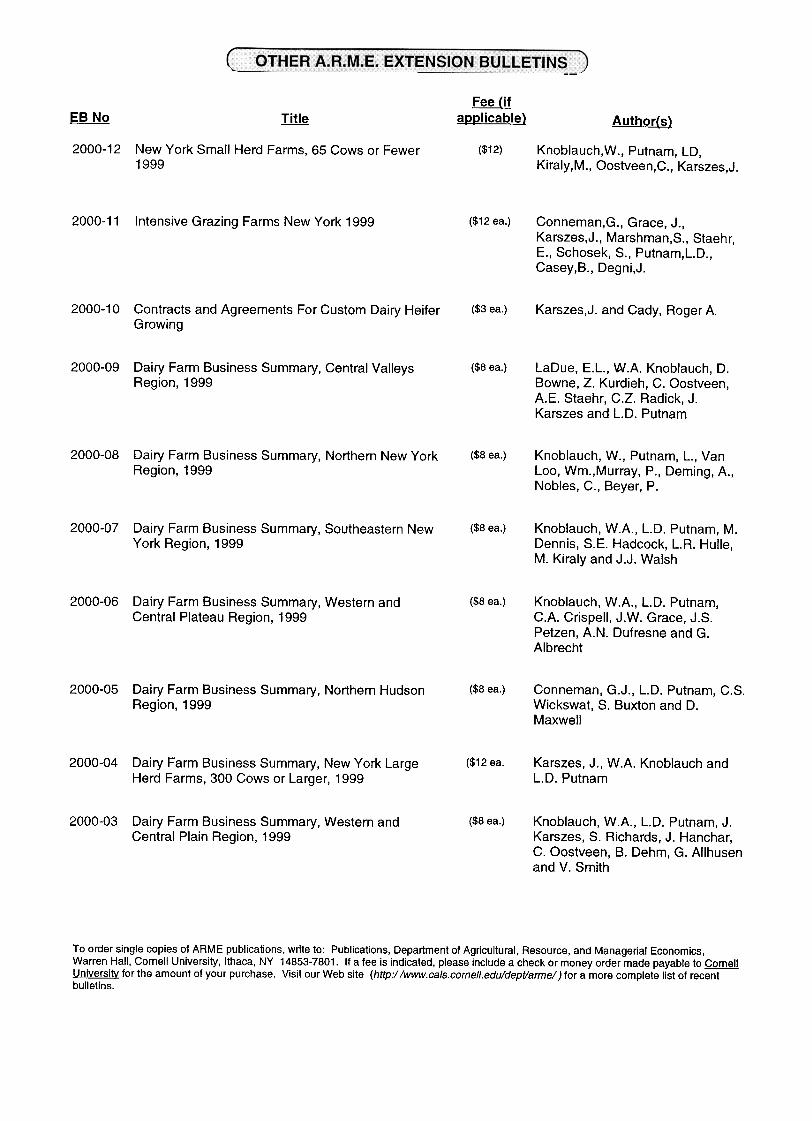
- ---OTHER A.R.M.E. EXTENSION BULLETINS
Fee (ifapplicable)EB No ~ Author{s)
2000-12 New York Small Herd Farms, 65 Cows or Fewer1999
2000-03 ($8 ea.) Knoblauch, W.A., L.D. Putnam, J.Karszes, S. Richards, J. Hanchar,C. Oostveen, B. Dehm, G. Allhusenand V. Smith
Dairy Farm Business Summary, Western andCentral Plain Region, 1999
To order single copies of ARME publications, write to: Publications, Department of Agricultural, Resource, and Managerial Economics,Warren Hall, Cornell University, Ithaca, NY 14853-7801. If a fee is indicated, please include a check or money order made payable to ~Universi~ for the amount of your purchase. Visit our Web site (http://www.cals.cornel/.edu/deptiarme/) for a more complete list of recentbulletins


![Eastern Europe 1997-2000: a Review of Church Life] · Eastern Europe 1997-2000: a Review of Church Life] ... on the other, not forgetting that ... and called for swift . Eastern Europe](https://static.documents.pub/doc/80x56/5b3bcfa07f8b9a5e1f8ceeb7/eastern-europe-1997-2000-a-review-of-church-life-eastern-europe-1997-2000.jpg)


