Maternal & Child Nutrition Edited by Victoria Hall Moran and Kathryn Dewey OCTOBER 2011 VOLUME 7 SUPPLEMENT 3 Consequences of Malnutrition in Early Life and Strategies to Improve Maternal and Child Diets through Targeted Fortified Products This supplement has been supported by a grant from the Global Alliance for Improved Nutrition (GAIN)
Transcript
Maternal & Child NutritionEdited by Victoria Hall Moran and Kathryn Dewey
OCTOBER 2011 VOLUME 7
SUPPLEMENT 3
Consequences of Malnutrition in Early Life and Strategies to Improve Maternal and Child Diets through Targeted Fortifi ed Products
This supplement has been supported by a grant from the Global Alliance for Improved Nutrition (GAIN)
101-102_mcn_v7_is3_pr.indd fm_i 9/14/2011 11:46:12 AM
Maternal & Child Nutrition
Introduction 1 Consequences of malnutrition in early life and strategies to improve maternal and child
diets through targeted fortified productsSandra L. Huffman and Dominic Schofield
Original Articles 5 Long-term consequences of stunting in early life
Kathryn G. Dewey and Khadija Begum 19 Review of fortified food and beverage products for pregnant and lactating women and
their impact on nutritional statusZhenyu Yang and Sandra L. Huffman
44 Essential fats: how do they affect growth and development of infants and young children in developing countries? A literature reviewSandra L. Huffman, Rajwinder K. Harika, Ans Eilander and Saskia J.M. Osendarp
66 Balancing nurturance, cost and time: complementary feeding in Accra, GhanaGretel H. Pelto and Margaret Armar-Klemesu
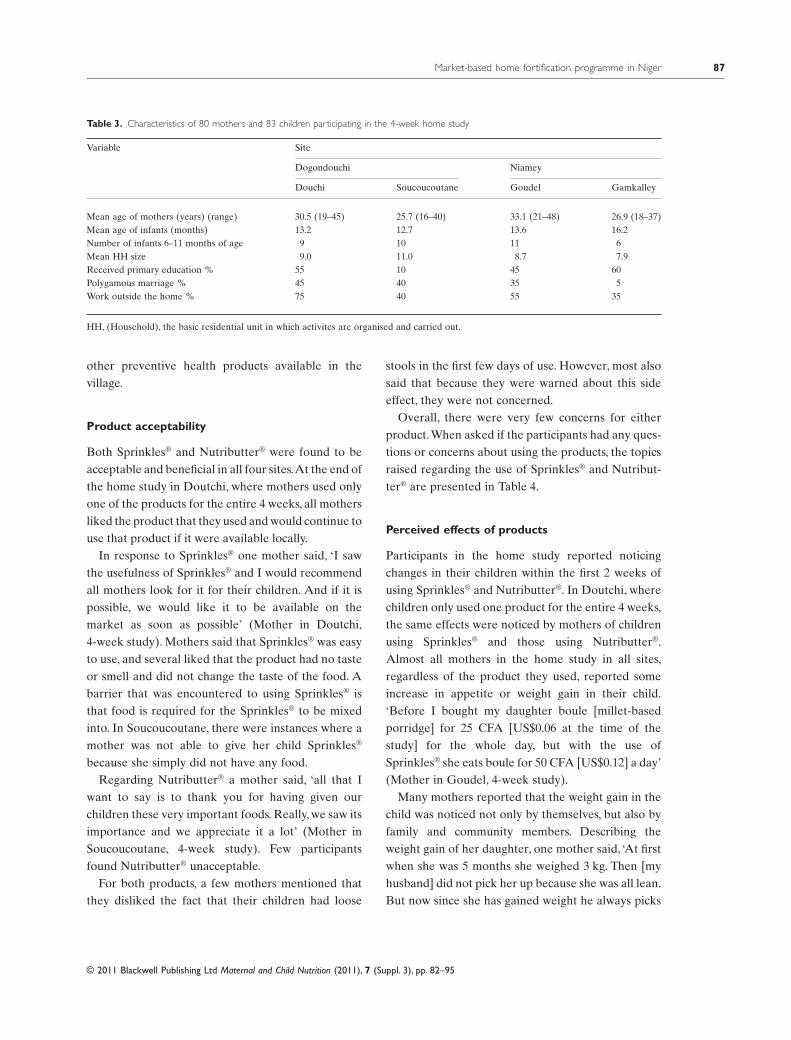
82 Formative research for the development of a market-based home fortification programme for young children in NigerKatie Tripp, Cria G. Perrine, Pascal de Campos, Marily Knieriemen, Rebecca Hartz, Farah Ali, Maria Elena D. Jefferds and Roland Kupka
96 Implementation of a programme to market a complementary food supplement (Ying Yang Bao) and impacts on anaemia and feeding practices in Shanxi, ChinaJing Sun, Yaohua Dai, Shuaiming Zhang, Jian Huang, Zhenyu Yang, Junsheng Huo and Chunming Chen
112 Legislation should support optimal breastfeeding practices and access to low-cost, high-quality complementary foods: Indonesia provides a case studyDamayanti Soekarjo and Elizabeth Zehner
123 Fortifying complementary foods with NaFeEDTA – considerations for developing countriesZhenyu Yang, Jonathan Siekmann and Dominic Schofield
129 Early child growth: how do nutrition and infection interact?Kathryn G. Dewey and Daniel R. Mayers
OCTOBER
2011
VOLUME 7
SUPPLEMENT 3Consequences of Malnutrition in Early Life and Strategies to Improve Maternal and Child Diets through Targeted Fortified Products
101-102_mcn_v7_is3_pr.indd fm_ii 9/14/2011 11:46:13 AM
Consequences of malnutrition in early life andstrategies to improve maternal and child diets throughtargeted fortified productsmcn_348 1..4
Sandra L. Huffman* and Dominic Schofield†
*Department of Nutrition and Program in International and Community Nutrition, University of California, Davis, California, USA, and †Global Alliance forImproved Nutrition (GAIN), Geneva, Switzerland
This supplement brings together papers focusing onthe critical 1000 days of human development frompregnancy until 2 years of age. It is the third in anannual series first published as a Special Supplementof the Food and Nutrition Bulletin in June 2009. Dietsof poor nutritional quality during pregnancy, infancyand early childhood lead to nutrient intakes, which donot meet requirements. This, combined with frequentinfections during early childhood, results in deficits ingrowth (stunting), limited psychosocial development,increased risk of mortality, and reduced learningcapacity and productivity later in life among thosethat survive. Programmes need to prevent these defi-cits by improving maternal and child nutrient intakein addition to preventing and treating infections.
Over the past 3 years, the community of nutritionscientists and researchers, activists and developmentpractitioners committed to an integrated approach tonutrition programming has grown. This communityadvocates for a greater focus on maternal, infant andyoung child nutrition (MIYCN), the application of alifecycle approach to programming and the breakingdown of the barriers between expertise and sectorsthat limit the scale-up of cost-effective programmesthat meet the needs of vulnerable populations on asustained basis.This MIYCN supplement continues toreflect and contribute to this movement by providingthe results of leading-edge research to inform techni-cal consensus, programme design, policy and furtherresearch. It discusses the consequences of malnutri-tion in early life and focuses on programme-relatedresearch to improve nutrient intake through breast-feeding, promoting consumption of special formu-lated fortified foods that fill nutrient gaps or enhancethe diets of women and children. It also presentsresearch assessing feeding practices and preferences
of caregivers in relation to child feeding and formu-lated products. An operations research project inChina is described that illustrates how these activitieswere brought together in an integrated programme toimprove nutrient intake in young children.
Dewey and Begum (2011) set the stage by summa-rizing the prevalence, causes and consequences ofstunting. One-third of children under 5 years of age indeveloping countries are stunted, with many childrenin several regions already stunted at birth. Stuntingrates increase during the first 24 months of life withlittle change thereafter until adolescence, whendelayed maturation and an extended growth periodresult in some compensatory growth (Bosch et al.2008). Thus, rates of stunting are lower in adultwomen than in young girls, but in some areas (South/Southeast Asia and Latin America) maternal stuntingrates can exceed 15%. The process of becomingstunted results in higher mortality, increased risk ofchronic diseases in adulthood, lower adult height andpermanent cognitive impairments. However, there isencouraging evidence that nutritional interventionsin pregnancy and early life can reduce stunting and itsnegative consequences.
Micronutrient deficiencies are common duringpregnancy and studies have attempted to determinethe optimal formulation of products fortified withnutrients to address maternal deficiencies and subse-quently improve pregnancy outcome. The reviewconducted by Yang and Huffman (2011) identifiedvitamin- and mineral-fortified products developedspecifically for pregnant and lactating women andexamined their impacts on maternal nutritional statusand growth, birth outcomes and development of theiroffspring. They report that the use of micronutrient-fortified beverages and supplementary foods during
pregnancy had positive effects on preventing mater-nal anaemia and iron deficiency. When consumedduring pregnancy, those products containing milkand/or essential fatty acids increased mean birth-weight, and a few studies have shown that they alsoimproved birth length and reduced rates of pretermdelivery.
Huffman et al. (2011) report on the importance ofessential fats during pregnancy and early childhood.However, intakes among pregnant and lactatingwomen and young children are often less thanrequired. Increasing intake of foods rich in omega-3fatty acids is needed, though their availability isoften lacking in developing countries and costs offoods that are good sources of omega-3s are fre-quently high. Products for pregnant and lactatingwomen such as milk fortified with omega-3 fattyacids or lipid-based nutrient products have beenshown to have positive impacts, but more research isneeded. Improving omega-3 intake in young chil-dren through enhanced breastfeeding practices andintake of foods with optimal omega-3 content(including animal products, especially fish, and prod-ucts made with full fat soy or soy oil) will improvechildren’s omega-3 fatty acid status and mayimprove growth and development.
Soekarjo and Zehner (2011) illustrate that manycountries do not have the legal and policy environ-ment necessary to support exclusive and continuedbreastfeeding. Using examples from Indonesia, theyidentify legislative requirements for supportingbreastfeeding, including improved information, train-ing, monitoring and enforcement systems for theCode of Marketing of Breastmilk Substitutes as wellas policy changes to ensure implementation andmonitoring of the Baby Friendly Hospital Initiative.These are needed because in spite of existing laws,there are reports of health centre and retail promo-tion of infant formula, follow-up formula and comple-mentary foods for infants under 6 months, with littleor no public sector action to address these Code vio-lations. They suggest that baby-friendly hospital prac-tices be included within accreditation criteria forhospitals.
They also report on the need to establish a regis-tration category for complementary food supple-
ments (CFS) to enhance availability of high-quality,low-cost fortified products to help improve youngchild feeding. In addition, guidelines for marketingthese products for 6–24 month-olds are needed, so asto promote proper use and not interfere with breast-feeding. Complementary foods and supplements needto be distinguished from breast milk substitutes inlegislation and policy guidance.
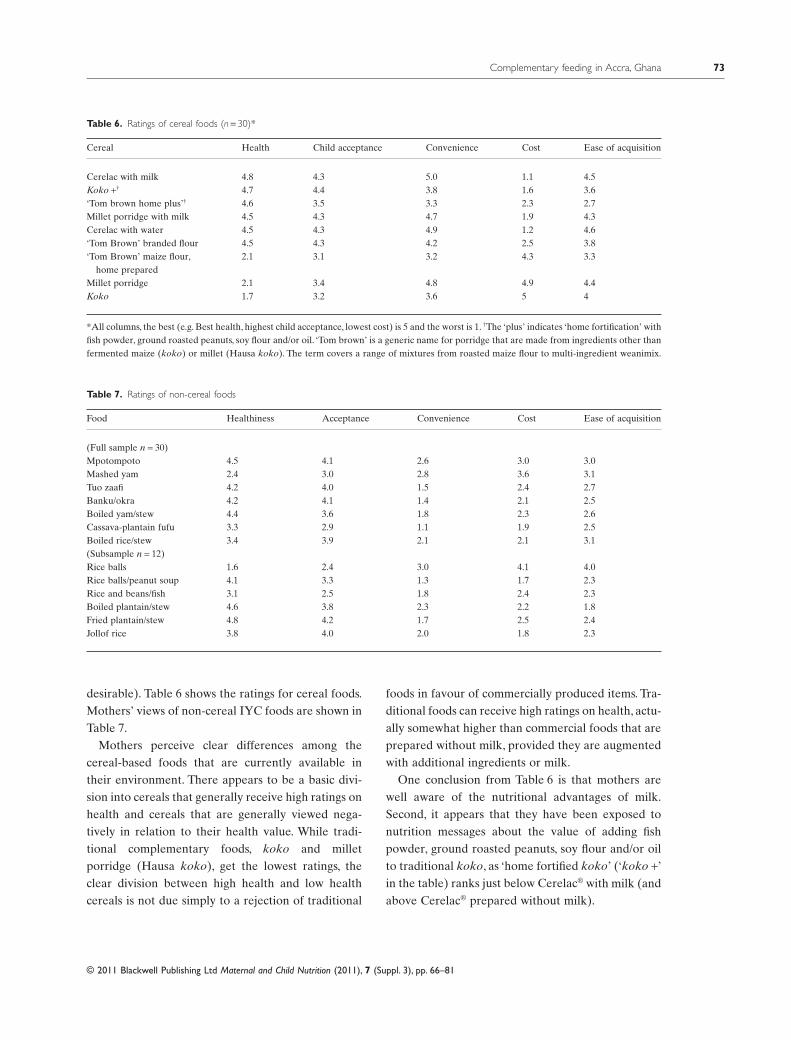
Pelto and Armar-Klemesu (2011) assess the poten-tial of a commercial complementary food, using tra-ditional market research techniques combined withanthropological methodologies. This focused ethno-graphic study (FES) was conducted among familieswith children 6–24 months of age living in a range ofconditions, from dense urban neighbourhoods to peri-urban areas in Accra, Ghana. More than half of thechildren were fed Cerelac®, a commercial, fortified,instant porridge that is sold ready to mix with wateror milk. Traditional millet porridges (koko) were alsovery common, but generic or branded commercial,non-instant cereals (Weanimix and Tom Brown) wereseldom fed to children. Mothers were aware of thenutritional advantages of milk and the value of addingfish powder, ground roasted peanuts, soy flour, and/oroil to traditional koko. However, these ingredientswere not usually readily available in the urban andperi-urban neighbourhoods. Mothers’ beliefs andpractices were aimed at furthering the health, well-being and development of children (i.e. nurturance),and the healthiness of the foods they gave their chil-dren was of primary importance.
Convenience was also a major concern for care-givers. Cerelac® was considered the most convenientbecause packets could be obtained from neighbour-hood kiosks quickly and easily with a small cashoutlay. Because it is instant, it requires no cooking,which was another major component of convenience.Millet porridge was also considered very convenientbecause it could be purchased ready-made from akoko seller. Caregivers had to balance these twoimportant concerns (nurturance, as reflected in thehealthiness of the food and convenience) with cost.Mothers often fed low-cost, traditional porridgesbecause of cost concerns, but when they did so, theyfelt they were not giving their children the best foodsfor their health. Thus, finding a lower cost alternative
to Cerelac®, that is instant and fortified at higherlevels (so as to meet more of the child’s needs throughfewer servings per day) would be important for care-givers. Alternatively, a CFS that could be used tofortify the traditional porridge would also provide animportant choice for caregivers.
The FES tool used by Pelto and Armar-Klemesu(2011) and has now also been adapted and used toassess the potential for marketing complementaryfoods and supplements in South Africa, Philippinesand Afghanistan.
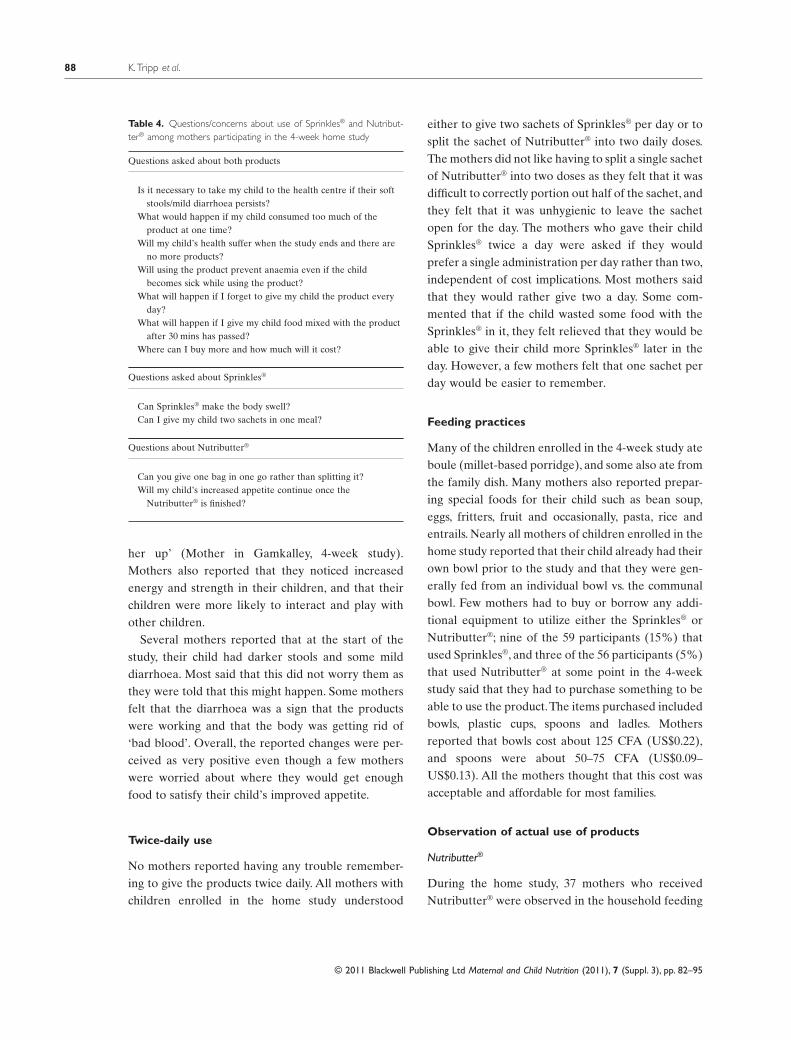
A different type of formative data collection wasconducted by Tripp et al. (2011) in Niger, where theyassessed the acceptability of a multiple micronutrientpowder (Sprinkles®) and lipid-based nutrient supple-ment (Nutributter®) among rural and urban families.Focus group discussions were held among mothers,fathers and grandmothers of children 6–23 months ofage, and 80 mothers who participated in a home studywere interviewed about their views on these twoproducts. Nutributter® was the preferred product,although both Sprinkles® and Nutributter®
were well accepted by children 6–23 months ofage. Caregivers reported a willingness to pay forboth products, agreeing to pay higher amounts forNutributter®.Although most mothers had intended tomix the Nutributter® into the child’s food (boule),more mothers ended up giving the Nutributter®
directly because their children preferred to eat it thatway, there was less waste when the child did not finishthe boule, and it was easier for mothers since the childcould feed him/her self.
As new CFS are developed locally, there is a needto interpret international guidelines on nutrientrequirements to determine actual amounts of nutri-ents to include in products. The iron absorption ratefrom sodium iron ethylenediaminetetraacetate(NaFeEDTA) is about two to three times greater thanthat from either ferrous fumarate or ferrous sulfate indiets high in phytate, which are common in develop-ing countries. NaFeEDTA is also highly effective andhas few organoleptic problems. However, EDTAshould not be consumed in excessive levels and Foodand Agriculture Organization/World Health Organi-zation have established an acceptable daily intake(ADI) for EDTA. The paper by Yang, Siekmann and
Schofield (2011) explores one way of determininghow much NaFeEDTA should be included in aproduct so as not to exceed the ADI for EDTA.
Because the ADI for EDTA is given per kilogrambody weight, the actual amount of NaFeEDTA toinclude in a CFS serving children of different agesneeds to be decided upon. Yang, Siekmann andSchofield explore this issue by using the distributionof weights of children based on different prevalencesof malnutrition. The clarification of how such levelscan be determined is important so that others canunderstand the reasoning behind levels of nutrients inproducts.
Calculations were conducted using the reference of6–8-month-old infants, because they would be athighest risk of consuming levels of EDTA above theADI because of their lower weights than older chil-dren. If 2 mg NaFeEDTA were to be given to 6–8-month-old infants, the percentage exceeding the ADIfor EDTA would be <10% for populations with <30%of children who are underweight. However, if 2.5 mgiron were given in NaFeEDTA form to all 6–8-month-old infants, 30–64% of infants would be above theADI for EDTA. Such quantification of the risks ofdifferent doses of nutrients is useful for setting poli-cies and developing standards for products.
A public–private partnership that brings togethermany of the issues discussed in the preceding paperswas implemented in Shan’xi province, in the north ofChina (Sun et al. 2011).A CFS (Ying Yang Bao-YYB)made from full-fat soy powder and fortified with mul-tiple micronutrients (including NAFeEDTA) wasproduced and marketed by a private sector company.Social marketing materials were developed by theChina Center for Disease Control (CDC) and theCapital Pediatrics Institute who worked with healthcentres to train staff on the importance of continuedbreastfeeding and use of YYB to improve child nutri-tion. Because there had been no category for a CFSneeded to market the product, China CDC workedwith the National Standardization Administration todevelop and get approval for a CFS standard, the firstever. This standard is shown in their paper, and canserve as an example as other countries develop regu-lations for local products. In the end-line survey, morethan half (60%) of caregivers knew about YYB and of
those, 23% had ever purchased it (13.5% of all care-givers). More than 95% of the target children con-sumed the product at least three times per week. Therisk of anaemia was greatly reduced among thosechildren compared with those in families that did notpurchase the product. The prevalence of early initia-tion of breastfeeding, minimal dietary diversity,minimal acceptable diet and consumption of iron-richfood improved significantly following the interven-tion. However, the authors emphasize that invest-ments in demand creation need significant time andeffort, and marketing needs to be harmonized withBehaviour Change Communication.
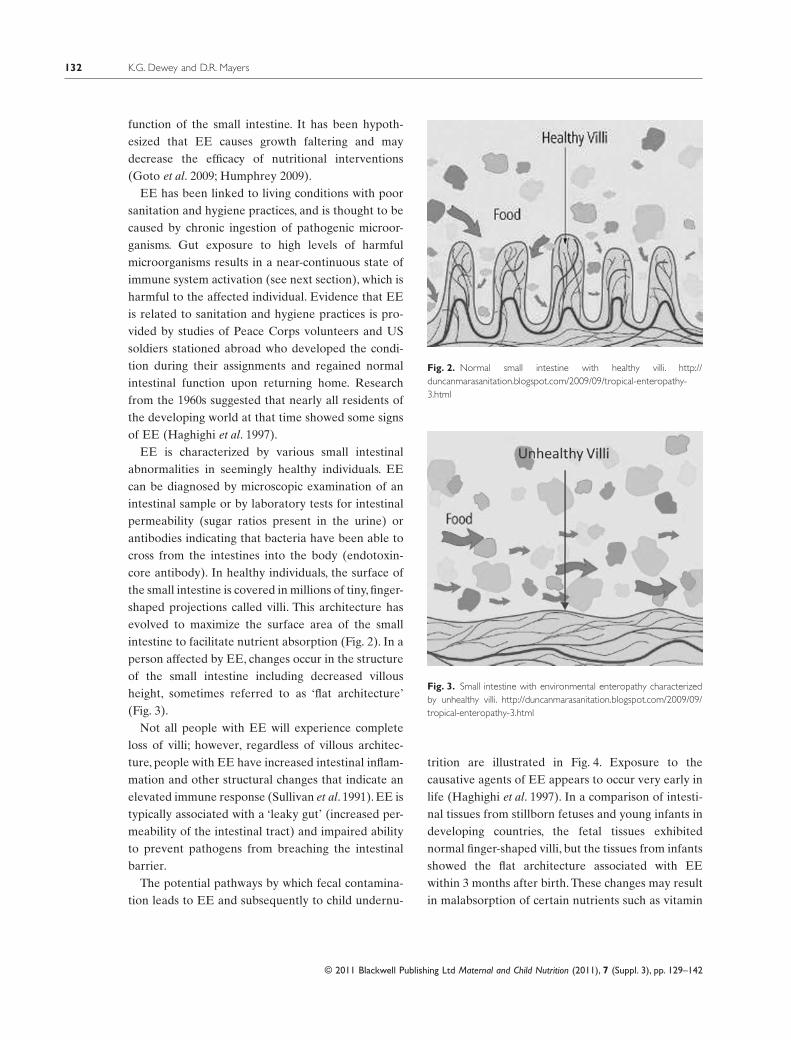
Dewey and Mayers (2011) illustrate the negativeimpact of infections on child growth. Of majorconcern are diarrhoeal and respiratory infections, aswell as subclinical infections, especially environmen-tal enteropathy. They conclude that interventionsthat combine improved nutrition with preventionand control of infections are likely to be most effec-tive for enhancing child growth and development.Promotion of breastfeeding has the dual benefit ofreducing infection and improving nutrition. Use ofinstant or ready-to-use fortified complementaryfoods or supplements (such as lipid-based nutrientsupplements) can reduce the risk of infectionbecause they can be easily prepared prior to serving,reducing the likelihood of contamination whenrefrigeration is not available. Feeding during andafter illness can help to sustain adequate nutrientintake and promote catch-up growth. Programmesthat combine nutrition objectives with the othercomponents required for prevention and control ofinfections (e.g. water quality, sanitation, malariacontrol) are also needed.
Acknowledgements
We would like to thank The Global Alliance forImprove Nutrition (GAIN) for supporting the pro-duction and distribution of this supplement and theBill & Melinda Gates Foundation for their support of
the Infant and Young Child Nutrition programme atGAIN.
Conflict of interest
No conflicts of interest exist.
References
Bosch A.M., Baqui A.H. & van Ginneken J.K. (2008)Early-life Determinants of stunted adolescent girls andboys in Matlab, Bangladesh. Journal of Health, Popula-tion, and Nutrition 26, 189–199.
Dewey K.G. & Begum K. (2011) Long-term consequencesof stunting in early life. Maternal & Child Nutrition 7(Suppl. 3), 5–18.
Dewey K.G. & Mayers D.R. (2011) Early child growth:how do nutrition and infection interact? Maternal &Child Nutrition 7 (Suppl. 3), 129–142.
Huffman S.L., Harika R.K., Eilander A. & OsendarpS.J.M. (2011) Essential fats: how do they affect growthand development in developing and transition coun-tries? a review. Maternal & Child Nutrition 7 (Suppl. 3),44–65.
Pelto G.H. & Armar-Klemesu M. (2011) Balancing Nur-turance, cost and time: complementary feeding in Accra,Ghana. Maternal & Child Nutrition 7 (Suppl. 3), 66–81.
Soekarjo D. & Zehner E. (2011) Legislation shouldsupport optimal breastfeeding practices and access tolow-cost, high quality complementary foods: Indonesiaprovides a case study. Maternal & Child Nutrition 7(Suppl. 3), 112–122.
Sun J., Dai Y., Zhang S. et al. (2011) Implementation of aprogram to market a complementary food supplement(Ying Yang Bao) and impacts on anemia and feedingpractices in Shanxi, China. Maternal & Child Nutrition 7(Suppl. 3), 96–111.
Tripp K., Perrine C.G., de Campos P., Knieriemen M. et al.(2011) Formative data collection for the development ofa market-based home fortification program for youngchildren in Niger. Maternal & Child Nutrition 7 (Suppl.3), 82–95.
Yang Z. & Huffman S. (2011) Review of fortified food andbeverage products for pregnant and lactating womenand their impact on nutritional status. Maternal & ChildNutrition 7 (Suppl. 3), 19–43.
Yang Z., Siekmann J. & Schofield D. (2011) Fortifyingcomplementary foods with NaFeEDTA. Maternal &Child Nutrition 7 (Suppl. 3), 123–128.
Long-term consequences of stunting in early lifemcn_349 5..18
Kathryn G. Dewey and Khadija BegumDepartment of Nutrition and Program in International and Community Nutrition, University of California, Davis, California, USA
Abstract
This review summarizes the impact of stunting, highlights recent research findings, discusses policy and pro-gramme implications and identifies research priorities. There is growing evidence of the connections betweenslow growth in height early in life and impaired health and educational and economic performance later in life.Recent research findings, including follow-up of an intervention trial in Guatemala, indicate that stunting canhave long-term effects on cognitive development, school achievement, economic productivity in adulthood andmaternal reproductive outcomes. This evidence has contributed to the growing scientific consensus that tacklingchildhood stunting is a high priority for reducing the global burden of disease and for fostering economicdevelopment. Follow-up of randomized intervention trials is needed in other regions to add to the findings of theGuatemala trial. Further research is also needed to: understand the pathways by which prevention of stuntingcan have long-term effects; identify the pathways through which the non-genetic transmission of nutritionaleffects is mediated in future generations; and determine the impact of interventions focused on linear growth inearly life on chronic disease risk in adulthood.
Correspondence: Kathryn G. Dewey, Department of Nutrition, University of California, One Shields Avenue, Davis, CA 95616, USA.E-mail: [email protected]
Introduction
Children throughout the world can reach their growthpotential if they are nurtured in healthy environmentsand their caregivers follow recommended health,nutrition and care practices. Stunting indicates afailure to achieve one’s genetic potential for height(Golden 2009).A child is considered ‘stunted’ if his orher height is more than two standard deviationsbelow the World Health Organization standard(WHO Multicentre Growth Reference Study Group,2006). The main causes of stunting include intrauter-
ine growth retardation, inadequate nutrition tosupport the rapid growth and development of infantsand young children and frequent infections duringearly life (Frongillo 1999). Although a child may notbe classified as ‘stunted’ until 2–3 years of age, theprocess of becoming stunted typically begins in utero.The result – a very short height – usually reflects thepersistent, cumulative effects of poor nutrition andother deficits that often span across several genera-tions. This review summarizes the impact of stunting,highlighting research findings published in the past 5years.
Stunting affects one-third of children under 5 inlow-income and middle-income countries, for a totalof 178 million children (Black et al. 2008). Stuntingoften goes unrecognized by families who live in com-munities where short stature is so common that itseems normal. Even among health workers, stuntinggenerally does not receive the same attention asunderweight or wasting (low weight for height), espe-cially if height is not routinely measured as part ofcommunity health programmes. Many families, healthworkers and policy makers are unaware of the conse-quences of stunting so it may not be viewed as apublic health issue.
The prevalence of stunting is highest in Africa(40%), and the largest number of stunted children isin Asia (112 million), mostly in South-central Asia, asshown in Table 1. Ninety per cent of the overall globalburden of child stunting is attributable to 36 coun-tries. Stunting is found at many levels in society. InBangladesh, for example, stunting in children lessthan 5 years of age was found in one-fourth of therichest households [National Institute of PopulationResearch and Training (NIPORT) et al. 2009]. Indeveloping countries, stunting is more prevalent thanunderweight (low weight for age, 20%) or wasting(low weight for height, 10%) possibly because heightgain is even more sensitive to dietary quality than isweight gain.
Stunting often begins in utero
During fetal life and the first 2 years after birth, nutri-tional requirements to support rapid growth anddevelopment are very high. Average height-for-age
z-scores are already low at birth (below 0, thestandard score or population average) in severalregions and decline sharply during the first 24 monthsof life but show no further decline or any improve-ment thereafter (Victora et al. 2010), as illustrated inFig. 1.
Maternal undernutrition, anaemia, tobacco use andindoor air pollution can restrict fetal growth andresult in low birthweight. Table 2 shows that theprevalence of low body mass index (BMI) amongwomen 15–49 years of age may be as high as 35% insome countries. In many countries, more than half of
Key messages
• Stunting is both a direct cause of short adult height and suboptimal function later in life and a key marker of theunderlying processes in early life that lead to poor growth and other adverse outcomes.
• Stunting is a risk factor for diminished survival, childhood and adult health, learning capacity and productivity.• Prevention of stunting should be made a priority. Intervention strategies should target the ‘window of
opportunity’ from the pre-conception period through the first 2 years of life and include interventionsdemonstrated to have a positive impact on linear growth.
• Additional research is needed to confirm findings for other regions, to understand the pathways through whichstunting can have long-term effects and to identify pathways through which the non-genetic transmission ofnutritional effects is mediated in future generations.
Table 1. Stunting in children under 5 years of age, based on WHOChild Growth Standards
all women of reproductive age are anaemic (Fig. 2).Diets of poor nutritional quality during pregnancy,infancy and early childhood lead to inadequate nutri-ent intake. Frequent infections during the first 2 yearsof life also contribute to the high risk of becomingstunted during this period.
Children who are stunted usually grow up to bestunted adults (Martorell et al. 1994). An opportunityexists to make up some of the height deficit duringadolescence because stunted children often experi-ence a delay in skeletal maturation, lengthening thetotal period of time for growth in height. However,the potential for substantially reducing the heightdeficit during adolescence is limited because thematurational delays are usually shorter than 2 years(Martorell et al. 1994). Moreover, adolescents whoenter this period stunted are often living underthe same adverse nutritional, socio-economic and
environmental conditions that triggered stuntingwhen they were young children.
Consequences of stunting
Childhood stunting is related to long-term conse-quences in two ways:
• as a direct cause of short adult height and subopti-mal function later in life and• as a key marker of the underlying processes in earlylife that lead to poor growth and other adverseoutcomes.
Scientific understanding of stunting as a directcause of adverse consequences is incomplete, in partbecause most of the evidence comes from observa-tional studies. Nonetheless, there is growing evidence
Fig. 1. Timing of growth faltering: mean height-for-age z-scores by age for 54 studies, relative to the WHO standard. WHO Regional Office forEurope (EURO); WHO Regional Office for the Eastern Mediterranean (EMRO); WHO Regional Office for Africa (AFRO); Pan American HealthOrganization (PAHO);WHO Regional Office for South-East Asia (SEARO). Source:Victora et al., reproduced with permission from Pediatrics 125,e473–e480. Copyright 2010 by the AAP. AAP, American Academy of Pediatrics; WHO, World Health Organization.
of the connections between slow growth in height inearly life and impaired health and educational andeconomic performance later in life.
The Maternal and Child Undernutrition StudyGroup (Victora et al. 2008) reviewed cohort studiesfrom five low-income and middle-income countries:Brazil, Guatemala, India, Philippines and SouthAfrica. The studies involved long-term follow-up ofchildren into late adolescence and adulthood. The
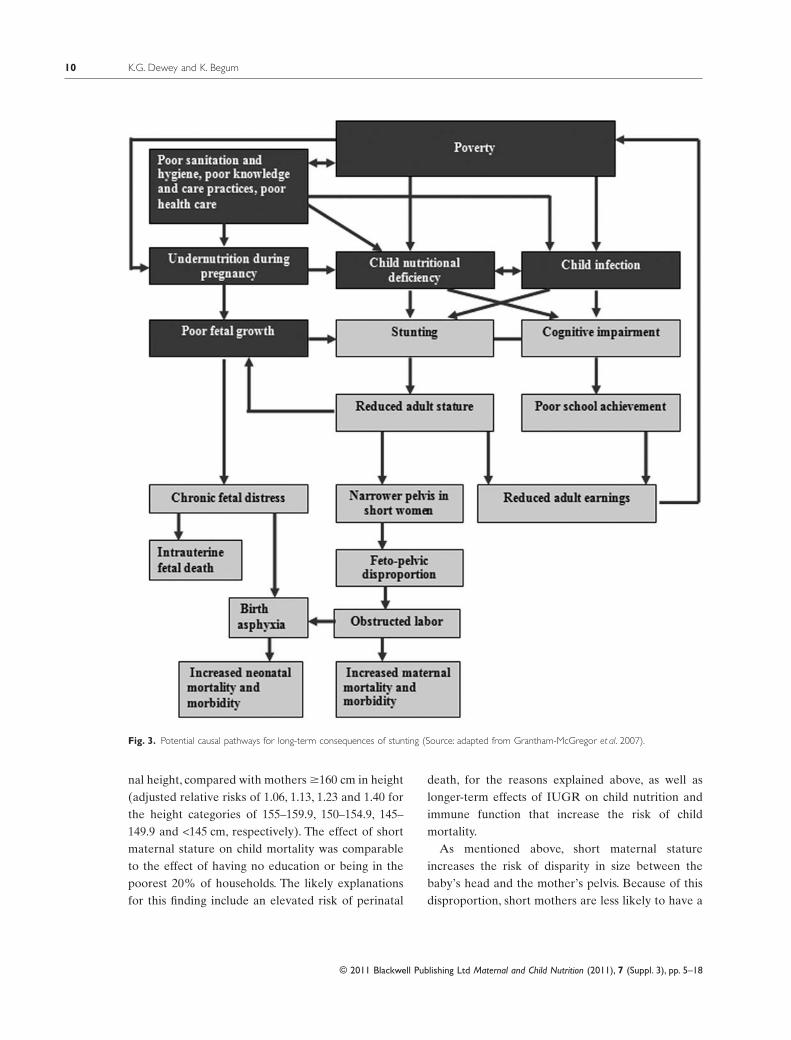
study group concluded that small size at birth andchildhood stunting were linked with short adultstature, reduced lean body mass, less schooling, dimin-ished intellectual functioning, reduced earnings andlower birthweight of infants born to women whothemselves had been stunted as children. Recent evi-dence also indicates that children born to women whoare stunted are at greater risk of dying than childrenof mothers with normal height (Ozaltin et al. 2010).The links between stunting and health, educationaland economic outcomes are discussed below andillustrated in Fig. 3.
Long-term health consequences ofmaternal stunting
A woman who is less than 145 cm or 4′7″ is consideredto be stunted, which presents risks to the survival,health and development of her offspring. Table 2shows the percentage of women of reproductive agewho are stunted. The prevalence of stunting amongwomen is highest in South/Southeast Asia (e.g. 15%in Bangladesh) and in parts of Latin America (e.g.29% in Guatemala).
Maternal stunting can restrict uterine blood flowand growth of the uterus, placenta and fetus. Intrau-terine growth restriction (IUGR) is associated withmany adverse fetal and neonatal outcomes (Kramer1987; Kramer et al. 1990; Black et al. 2008). Duringpregnancy, IUGR may lead to chronic fetal distress orfetal death. If born alive, the growth-restricted infantis at higher risk for serious medical complications(Black et al. 2008). Infants with IUGR often sufferfrom delayed neurological and intellectual develop-ment, and their deficit in height generally persists toadulthood.
Maternal stunting is consistently associated with anelevated risk of perinatal mortality (stillbirths anddeaths during the first 7 days after birth) (Lawn et al.2009), mostly related to obstructed labour resultingfrom a narrower pelvis in short women. In a hospital-based study in Nigeria, obstructed labour accountedfor 53% of perinatal mortality (Omole-Ohonsi &Ashimi 2007). Perinatal mortality from obstructedlabour is largely the result of birth asphyxia. Mothers
Table 2. Nutritional status of women: among women aged 15–49years, the percentage with height under 145 cm and the percentagewith body mass index <18.5 kg m-2 (thin), DHS Surveys 2003–2009
Country and year of DHS Height:percentageunder 145 cm
with height shorter than 145 cm are more likely tohave an infant with birth asphyxia (Lee et al. 2009).Globally, birth asphyxia accounts for 23% of the fourmillion neonatal deaths each year (Lawn et al. 2005).An estimated one million children who survive birthasphyxia live with chronic neuro-developmental dis-orders, including cerebral palsy, mental retardationand learning disabilities (World Health Organization2005).
In a recent analysis of 109 Demographic andHealth Surveys (DHS) conducted between 1991 and2008 in 54 countries, children (under 5 years of age)who were born to the shortest mothers (<145 cm) hada 40% increased risk of mortality after adjusting formultiple factors (Ozaltin et al. 2010). Although thepercentage of mothers shorter than 145 cm is low inmost countries, the analysis showed an elevated riskof child mortality with each lower category of mater-
Fig. 2. Percentage of women aged 15–49 with anaemia, DHS 2003–2009. Anaemia cut-offs, non-pregnant women: any, <12.0 g dL-1; mild,10.0–11.9 g dL-1; moderate, 7.0–9.9 g dL-1; and severe, <7.0 g dL-1 and pregnant women: any, <11.0 g dL-1; mild, 10.0–10.9 g dL-1; moderate, 7.0–9.99 g dL-1; and severe, <7.0 g dL-1. DHS, Demographic and Health Surveys.
nal height, compared with mothers �160 cm in height(adjusted relative risks of 1.06, 1.13, 1.23 and 1.40 forthe height categories of 155–159.9, 150–154.9, 145–149.9 and <145 cm, respectively). The effect of shortmaternal stature on child mortality was comparableto the effect of having no education or being in thepoorest 20% of households. The likely explanationsfor this finding include an elevated risk of perinatal
death, for the reasons explained above, as well aslonger-term effects of IUGR on child nutrition andimmune function that increase the risk of childmortality.
As mentioned above, short maternal statureincreases the risk of disparity in size between thebaby’s head and the mother’s pelvis. Because of thisdisproportion, short mothers are less likely to have a
Fig. 3. Potential causal pathways for long-term consequences of stunting (Source: adapted from Grantham-McGregor et al. 2007).
successful spontaneous vaginal delivery (Kwawu-kume et al. 1993; Merchant et al. 2001), whichincreases the risk of maternal mortality and short-and long-term disability. If timely referral to a well-equipped hospital occurs, a Caesarean section can beperformed; however, even a Caesarean section carriespotential risks of complications that can jeopardizematernal and newborn health. Failure to deliver byCaesarean section in time may lead to more seriousconsequences of obstructed labour. These conse-quences can include injury to the birth passage, post-partum haemorrhage, rupture of the uterus, genitalsepsis or fistula, leading to urinary dribbling or incon-tinence. In the worst case scenario, obstructed labourcan lead to maternal death, mostly because of rup-tured uterus or puerperal sepsis. The percentages ofmaternal mortality attributable to obstructed labourare 4% in Africa, 9% in Asia and 13% in LatinAmerica and the Caribbean (Khan et al. 2006).Mothers who survive but have long-term disabilitydue to complications such as fistula experience social,economic, emotional and psychological consequencesthat have an enormous impact on maternal health andwell-being (Ahmed & Holtz 2007).
Decreased maternal stature is also associated withan increased risk of underweight and stunting amongoffspring. In their analysis of DHS in 54 countries,Ozaltin et al. (2010) found that a 1-cm decrease inheight was associated with an increased risk of under-weight and stunting. Compared with the tallestmothers (�160 cm), each lower-height category had asubstantially higher risk of underweight and stuntingamong children, with the highest risk for mothersshorter than 145 cm. The association between mater-nal height and stunting was statistically significant in52 of 54 countries (96%) analysed.
Growth restriction in early life is linked not only toshort adult height but also to certain metabolic disor-ders and chronic diseases in adulthood. Data from theMaternal and Child Undernutrition Study Group(Victora et al. 2008) indicate that lower birthweight(which is strongly correlated with birth length) andundernutrition in childhood are risk factors for highglucose concentrations, blood pressure and harmfullipid profiles in adulthood after adjusting for adultheight and BMI.The ‘developmental origins of health
and disease’ hypothesis posits that the intrauterineand early post-natal environment can modify expres-sion of the fetal genome and lead to lifelong alter-ations in metabolic, endocrine and cardiovascularfunction (Gluckman et al. 2010). In this case, it is likelythat the process of stunting is harmful and not neces-sarily short stature itself.
Long-term educational and economicconsequences of child stunting
The process of becoming stunted, due to restrictednutrient supply and/or frequent infection, is likely acommon cause of both short stature and structuraland functional damage to the brain, resulting in delayin the development of cognitive functions as well aspermanent cognitive impairments (Kar et al. 2008).The Maternal and Child Undernutrition StudyGroup, using the same pooled cohort mentionedabove, found that being stunted at 24 months wasassociated with a reduction in schooling of 0.9 year, anolder age at school enrolment and a 16% increasedrisk of failing at least one grade in school after con-trolling for confounding variables such as sex, socio-economic status and maternal schooling (Martorellet al. 2010a). Evidence from other developing coun-tries also indicates that being stunted between 12 and36 months of age is associated with poorer cognitiveperformance and lower school achievement in middlechildhood (Grantham-McGregor et al. 2007). Shortstature has also been linked to lower economic pro-ductivity. For example, in a large cross-sectional studyin Brazil, a 1% increase in height was associated witha 2.4% increase in wages (Thomas & Strauss 1997).Taller men and women earned more even after con-trolling for education and other indicators of healthsuch as BMI, per capita energy intake and per capita
protein intake.The most convincing evidence on these conse-
quences comes from long-term follow-up studies ofrandomized trials, such as the large-scale nutritionalsupplementation trial carried out in Guatemalabetween 1969 and 1977 (Box 1, Fig. 4 and Table 3),the only one of the five cohort studies examined bythe Maternal and Child Undernutrition Study Groupthat used an experimental design. Several recent
Box 1. The INCAP Longitudinal StudyIn the Institute of Nutrition of Central America and Panama (INCAP) Longitudinal Study, supplements were made available to the villagersfrom four centrally located feeding stations, one in each village, where supplements were distributed daily at mid-morning and mid-afternoon. Attendance and supplement consumption were open to all villagers but were recorded only for the target population. Routinemedical services in each village were established and maintained by INCAP.All women who were pregnant or lactating and all children frombirth to 7 years of age living in the study villages between 1 January 1969 and 28 February 1977 were included in the original design of thestudy (Habicht & Martorell 1993). Supplementation was provided from 1 March 1969 to 28 February 1977. Children were followed throughage 7 years or until the end of the study, whichever came first. Thus, all children were exposed either to Atole or to Fresco at different agesand for different periods of time: prenatally through supplement intake by the mother and post-natally through the effects of maternalsupplement intake on breast milk content of certain nutrients, as well as through the child’s own consumption (Stein et al. 2008). The trialincluded 643 pregnant and lactating women and 2392 children 0–7 years of age who received supplementation. Several prospective follow-upstudies were conducted between 1988 and 2007, and some are still ongoing or being planned (Fig. 4). Table 3 provides descriptiveinformation about the follow-up studies conducted with this cohort.
Fig. 4. Prospective cohort studies nested in the follow-up of the Institute of Nutrition of Central America and Panama trial (Source: adapted fromRamirez-Zea et al. 2010).
papers have evaluated the impact of nutrition supple-mentation in early life on stunting and on variousaspects of the development of human capital in adult-hood. The Institute of Nutrition of Central Americaand Panama (INCAP) Oriente Longitudinal Studywas a large supplementary feeding trial targeted topregnant and lactating women and their childrenfrom birth to 7 years of age, which was conducted infour rural Guatemalan villages (Martorell, 1992). Sub-sequent follow-up studies occurred in 1988–2007through backward tracing of the original populationup to 40 years later (Ramirez-Zea et al. 2010). Thetrial included two sets of two matched villages. Onevillage in each set was randomly selected to receiveeither a high-protein (6.4 g 100 mL-1), high-energy(91 kcal 100 mL-1) supplement called ‘Atole’ or anon-protein, low-energy (33 kcal 100 mL-1) supple-ment called ‘Fresco’, the nutrient composition ofwhich has been described elsewhere (Martorell et al.1995; Ramirez-Zea et al. 2010). Dry skim milk was thepredominant source of energy and protein in Atole.From October 1971 until the end of the interventionin 1977, both supplements were fortified with severalmicronutrients (iron, fluoride, thiamine, riboflavin,niacin, ascorbic acid and vitamin A) in equal concen-trations by volume (Martorell et al. 1995). Fresco wasgiven as a control for social interaction associatedwith attending the feeding centre, which might haveinfluenced certain outcomes such as cognitivedevelopment.
Child length gain was greater in ‘Atole’ villagesthan in ‘Fresco’ villages during the first 3 years of life(+0.9 cm in the first year, +1.0 cm in the second yearand +0.4 cm in the third year) (Schroeder et al. 1995).This effect persisted even after controlling for initialbody size, diarrhoeal disease, socio-economic status,gender and energy from home diets during the secondyear. No effect of Atole on length gain was observedwhen supplementation occurred between 3 and 7years of age. The greater impact during the first 3years of life is probably due to the greater growthpotential, greater relative nutritional requirementsand relatively frequent infections in younger children.
The first follow-up study was conducted during1988–1989 when the cohort was 11–26 years old. Itdocumented that improved nutrition in early child-
hood had significant effects on body size and intellec-tual functioning (Martorell et al. 2010b). Specifically,during adolescence, subjects from Atole villages weretaller, weighed more and had greater lean body massthan subjects from Fresco villages (Rivera et al. 1995).Subjects receiving Atole also scored significantlyhigher on tests of knowledge, numeracy, reading andvocabulary than those given Fresco (Pollitt et al.1995).
Key findings from the 2002–2004 follow-up study,when the cohort was 26–42 years of age, included theimpact on school achievement (Maluccio et al. 2009)and economic productivity (Hoddinott et al. 2008).These studies showed that exposure to Atole supple-mentation before 3 years of age, but not after 3 years,increased years of schooling completed by 1.2 gradesfor women (but not for men). Reading comprehen-sion and intelligence scores increased in both menand women. The impact of Atole supplementation onintelligence was independent of schooling (Stein et al.2008). Wage rate (income earned per hour worked)increased by US$ 0.62–0.67 per hour in men (but notin women). In the subgroup exposed to Atole supple-mentation during the first 2 years of life, this repre-sented a 46% increase in average wages. The lack ofeffect on income measures in women could be due todifferences in economic activity between men andwomen. Virtually all men (99%) participated in atleast one income-generating activity, whereas the pro-portion was much less for women (70%) who weremostly engaged in activities that did not generatemuch income.
The 2006–2007 follow-up study (Behrman et al.2009a) of intergenerational effects found that com-pared with the offspring of women exposed to Fresco,the offspring of women exposed to Atole as children(starting before 7 years of age) had greater birth-weight (+116 g), height (+1.3 cm), head circumference(+0.6 cm), height-for-age z-score (+0.26) and weight-for-height z-score (+0.20). The effects on height dif-fered by sex of the offspring. Sons of women exposedto Atole were 2.0 cm taller than sons of womenexposed to Fresco, whereas the difference for femaleoffspring was only 0.6 cm. There were no significantdifferences in the measures of offspring adiposity(BMI, arm circumference, triceps skinfold thickness
and sub-scapular skinfold thickness). Paternal expo-sure to Atole was not associated with any of the 11anthropometric indicators.
This unique, long-term study demonstrated thatnutritional intervention before 3 years of age has sig-nificant long-term effects on height, as well as humancapital and economic productivity in adulthood, andthat nutritional supplementation of girls starting inearly childhood has significant effects on body size oftheir offspring.
In a subsequent analysis of the pathways by whichAtole supplementation benefited wage rates in men(Behrman et al. 2009b), it was found that adult leanbody mass (which is usually correlated with height)and adult reading comprehension scores were bothexplanatory variables. However, when both variableswere treated as ‘endogenous’ (i.e. potentially reflect-ing earlier choices), only the reading comprehensionscores remained significant in explaining the impacton wage rates.This does not mean that early life nutri-tion was not important but that it worked throughreading comprehension scores and not through adultlean body mass.The lack of impact via lean body massis probably explained by the relatively low proportionof men in the follow-up study who worked in physi-cally demanding occupations. When analysis wasrestricted to men with such occupations, lean bodymass remained important in explaining the impact ofsupplementation on wage rates. Thus, the relativeimportance of improvements in ‘brains’ vs. ‘brawn’may depend on the types of employment available toadults.
Discussion
The studies discussed above provide strong evidencethat stunting matters for two reasons. First, it stronglyaffects adult height, which among women has animpact on health and survival of their children, as wellas their own reproductive health, and among men hasbeen linked to economic productivity. Second, theprocess of stunting reflects damage that affects (insome cases, irreparably) health and development overthe long term. The follow-up studies of the INCAPtrial in Guatemala demonstrate that a nutritionalintervention in early life that improves linear growth
also has sizeable effects on human capital formationand economic productivity in adulthood, as well as ongrowth of future generations. They also show thatintervention needs to occur during the period whenstunting usually occurs – the prenatal period and thefirst 3 years of life – in order to have a significantimpact.
Thus, efforts to prevent stunting are likely to be ofbenefit for multiple outcomes, including cognitivedevelopment, school achievement and wages earnedin adulthood. In developing countries, an estimated 99million children of primary school age are notenrolled in school, and of those enrolled, only 78%complete primary school [United Nations Educa-tional, Scientific and Cultural Organization(UNESCO) 2010]. About 200 million children under5 years of age fail to reach their potential in cognitivedevelopment because of a combination of risk factorssuch as poverty, poor health and nutrition and inad-equate caring practices (Grantham-McGregor et al.2007). These conditions play an important partin the intergenerational transmission of poverty(Grantham-McGregor et al. 2007). Therefore, inter-ventions to prevent stunting early in life should accel-erate achievement of the Millennium DevelopmentGoals of achieving universal primary education,eradicating poverty, reducing mortality and improv-ing maternal health.
Making prevention of stunting a priority, however,will require that certain actions be taken by policymakers and those responsible for the design andimplementation of programmes. Specifically, interven-tions need to be targeted at the ‘window of opportu-nity’, which includes the pre-conception period,pregnancy, lactation and the first 2 years of life(Bhutta et al. 2008; Dewey & Huffman 2009; Victoraet al. 2010; Dewey & Adu-Afarwuah 2008).The choiceof intervention strategies should be guided by thosethat have been demonstrated to have a positiveimpact on linear growth, not just child weight. Simi-larly, evaluation of programme impact must includemeasures of child height, not just weight. Lastly, policymakers should shift towards an emphasis on stuntingas an indicator of overall child health and nutritionrather than underweight. This is particularly impor-tant as the ‘nutrition transition’ towards greater over-
weight accelerates in many developing countries,which can lead to populations with low rates of under-weight but persistently high rates of stunting.
Research priorities
Additional research, especially research from inter-vention trials, is needed to better understand the long-term consequences of stunting in early life. Researchfrom intervention trials in other regions is needed toadd to the findings of the long-term follow-up of theintervention trial in Guatemala. We need to knowwhether interventions that improve linear growth ofinfants and young children in Africa and Asia are alsobeneficial for key outcomes later in life. The analysisby the Maternal and Child Undernutrition StudyGroup (Victora et al. 2008) using data from four pro-spective cohort studies from Brazil, India, Philippinesand South Africa (in addition to the Guatemala trial)suggests that this will be the case; however, follow-upof randomized intervention trials is the gold standardfor drawing such conclusions.
Further research is also needed to understand thepathways by which prevention of stunting can havelong-term effects on cognitive development, schoolachievement and economic productivity in adult-hood, particularly in populations where labour forceparticipation among women is high. What are thedirect effects of increased height, and for which out-comes is greater height simply a marker of improve-ment in other domains such as cognitive function?More information on the consequences for maternalreproductive outcomes and parental caregiving prac-tices is needed.
Finally, research is needed to identify the pathwaysthrough which the non-genetic transmission of nutri-tional effects is mediated in future generations and todetermine the impact of interventions focused onlinear growth in early life, rather than acceleratedweight gain, on chronic disease risk in adulthood.
Acknowledgements
A shorter version of this paper has previously beenposted on the website for Alive & Thrive (http://www.aliveandthrive.org/). We thank Luann Martin,
Alive & Thrive, Elizabeth Zehner and Global Alli-ance for Improved Nutrition for their assistance withthe preparation of this paper.
Source of funding
Bill & Melinda Gates Foundation to Academy forEducational Development – Applied Research andTechnical Services for Alive & Thrive.
Conflicts of interest
No conflicts of interest have been declared.
References
Ahmed S. & Holtz S.A. (2007) Social and economic conse-quences of obstetric fistula: life changed forever? Inter-national Journal of Gynecology & Obstetrics 99 (Suppl.1), S10–S15.
Behrman J.R., Calderon M.C., Preston S.H., Hoddinott J.,Martorell R. & Stein A.D. (2009a) Nutritional supple-mentation in girls influences the growth of their chil-dren: prospective study in Guatemala. The AmericanJournal of Clinical Nutrition 90, 1372–1379.
Behrman J.R., Hoddinott J., Maluccio J.A. & Martorell R.(2009b) Brains versus brawn: labor market returns tointellectual and health human capital in a poor develop-ing country. Middlebury College Economics DiscussionPaper No. 0907. Available at: http://sandcat.middlebury.edu/econ/repec/mdl/ancoec/0907.pdf(Accessed 17 May 2011).
Bhutta Z.A., Ahmed T., Black R.E., Cousens S., DeweyK.G., Giugliani E. et al. (2008) What works? Interven-tions for maternal and child undernutrition and survival.Lancet 371, 417–440.
Black R.E., Allen L.H., Bhutta Z.A., Caulfield L.E., deOnis M., Ezzati M. et al. (2008) Maternal and childundernutrition: global and regional exposures and healthconsequences. Lancet 371, 243–260.
Dewey K.G. & Adu-Afarwuah S. (2008) Systematic reviewof the efficacy and effectiveness of complementaryfeeding interventions in developing countries. Maternaland Child Nutrition 4 (Suppl. 1), 24–85.
Dewey K.G. & Huffman S.L. (2009) Maternal, infant,and young child nutrition: combining efforts to maxi-mize impacts on child growth and micronutrient status.Food and Nutrition Bulletin 30 (2 Suppl.), S187–S189.
Frongillo E.A. Jr (1999) Symposium: causes and etiologyof stunting. Introduction. The Journal of Nutrition 129(2S Suppl.), 529S–530S.
Gluckman P.D., Hanson M.A. & Buklijas T. (2010) A con-ceptual framework for the developmental origins ofhealth and disease. Journal of Developmental Origins ofHealth and Disease 1, 6–18.
Golden M.H. (2009) Proposed recommended nutrient den-sities for moderately malnourished children. Food andNutrition Bulletin 30 (3 Suppl.), S267–S342.
Grantham-McGregor S., Cheung Y.B., Cueto S., GlewweP., Richter L. & Strupp B. (2007) Developmental poten-tial in the first 5 years for children in developing coun-tries. Lancet 369, 60–70.
Habicht J.P. & Martorell R. (1993) Objectives, researchdesign, and implementation of the INCAP longitudianlstudy. Food and Nutrition Bulletin 14, 176–190.
Hoddinott J., Maluccio J.A., Behrman J.R., Flores R. &Martorell R. (2008) Effect of a nutrition interventionduring early childhood on economic productivity inGuatemalan adults. Lancet 371, 411–416.
Kar B., Rao S. & Chandramouli B. (2008) Cognitive devel-opment in children with chronic protein energy malnu-trition. Behavioral and Brain Functions 4, 31.
Khan K.S., Wojdyla D., Say L., Gulmezoglu A.M. & VanLook P.F.A. (2006) WHO analysis of causes of maternaldeaths: a systematic review. Lancet 367, 1066–1074.
Kothari M. & Abderrahim N. (2010) Nutrition Update2010. ICF Macro: Calverton, MD.
Kramer M.S. (1987) Determinants of low birth weight:methodological assessment and meta-analysis. Bulletinof the World Health Organization 65, 663–737.
Kramer M.S., Olivier M., McLean F.H., Willis D.M. &Usher R.H. (1990) Impact of intrauterine growth retar-dation and body proportionality on fetal and neonataloutcome. Pediatrics 86, 707–713.
Kwawukume E.Y., Ghosh T.S. & Wilson J.B. (1993) Mater-nal height as a predictor of vaginal delivery. Interna-tional Journal of Gynaecology and Obstetrics 41, 27–30.
Lawn J.E., Cousens S., Zupan J. & Lancet Neonatal Sur-vival Steering T (2005) 4 million neonatal deaths: when?Where? Why? Lancet 365, 891–900.
Lawn J.E., Lee A.C., Kinney M., Sibley L., Carlo W.A.,Paul V.K. et al. (2009) Two million intrapartum-relatedstillbirths and neonatal deaths: where, why, and what canbe done? International Journal of Gynaecology andObstetrics 107 (Suppl. 1), S5–S18, S19.
Lee A.C., Darmstadt G.L., Khatry S.K., LeClerq S.C.,Shrestha S.R. & Christian P. (2009) Maternal-fetal dis-proportion and birth asphyxia in rural Sarlahi, Nepal.Archives of Pediatrics & Adolescent Medicine 163, 616–623.
Maluccio J.A., Hoddinott J., Behrman J.R., Martorell R.,Quisumbing A.R. & Stein A.D. (2009) The impact ofimproving nutrition during early childhood on educationamong Guatemalan adults. The Economic Journal 119,734–763.
Martorell R. (1992) Overview of long-term nutrition inter-vention studies in Guatemala, 1968–1989. Food andNutrition Bulletin 14, 270–277.
Martorell R., Khan L.K. & Schroeder D.G. (1994) Revers-ibility of stunting: epidemiological findings in childrenfrom developing countries. European Journal of ClinicalNutrition 48 (Suppl. 1), S45–S57.
Martorell R., Habicht J.P. & Rivera J.A. (1995) Historyand design of the INCAP longitudinal study (1969–1977)and its follow-up (1988–1989). The Journal of Nutrition125 (4 Suppl.), 1027S–1041S.
Martorell R., Horta B.L., Adair L.S., Stein A.D., RichterL., Fall C.H. et al. (2010a) Weight gain in the first twoyears of life is an important predictor of schooling out-comes in pooled analyses from five birth cohorts fromlow- and middle-income countries. The Journal of Nutri-tion 140, 348–354.
Martorell R., Melgar P., Maluccio J.A., Stein A.D. &Rivera J.A. (2010b) The nutrition intervention improvedadult human capital and economic productivity. TheJournal of Nutrition 140, 411–414.
Merchant K.M., Villar J. & Kestler E. (2001) Maternalheight and newborn size relative to risk of intrapartumCaesarean delivery and perinatal distress. BJOG: AnInternational Journal of Obstetrics and Gynaecology 108,689–696.
National Institute of Population Research and Training(NIPORT), Mitra and Associates, & Macro Interna-tional (2009) Bangladesh Demographic and HealthSurvey 2007. NIPORT, Mitra and Associates, and MacroInternational: Dhaka, Bangladesh and Calverton, MD.
Omole-Ohonsi A. & Ashimi A.O. (2007) Obstructedlabour – a six year review in Aminu Kano teaching Hos-pital, Kano, Nigeria. The Nigerian Medical Practitioner51, 59–63.
Ozaltin E., Hill K. & Subramanian S.V. (2010) Associationof maternal stature with offspring mortality, under-weight, and stunting in low- to middle-income countries.JAMA: The Journal of the American Medical Association303, 1507–1516.
Pollitt E., Gorman K.S., Engle P.L., Rivera J.A. & Mar-torell R. (1995) Nutrition in early life and the fulfillmentof intellectual potential. The Journal of Nutrition 125 (4Suppl.), 1111S–1118S.
Ramirez-Zea M., Melgar P. & Rivera J.A. (2010) INCAPOriente longitudinal study: 40 years of history andlegacy. The Journal of Nutrition 140, 397–401.
Rivera J.A., Martorell R., Ruel M.T., Habicht J.P. & HaasJ.D. (1995) Nutritional supplementation during the pre-school years influences body size and composition ofGuatemalan adolescents. The Journal of Nutrition 125 (4Suppl.), 1068S–1077S.
Schroeder D.G., Martorell R., Rivera J.A., Ruel M.T.& Habicht J.P. (1995) Age differences in the
impact of nutritional supplementation on growth. TheJournal of Nutrition 125 (4 Suppl.), 1051S–1059S.
Stein A.D., Wang M., DiGirolamo A., Grajeda R.,Ramakrishnan U., Ramirez-Zea M. et al. (2008) Nutri-tional supplementation in early childhood, schooling,and intellectual functioning in adulthood: a prospectivestudy in Guatemala. Archives of Pediatrics & AdolescentMedicine 162, 612–618.
Thomas D. & Strauss J. (1997) Health and wages: evidenceon men and women in urban Brazil. Journal of Econo-metrics 77, 159–185.
United Nations Educational, Scientific and Cultural Orga-nization (UNESCO) (2010) Education for All GlobalMonitoring Report 2010. United Nations Educational,Scientific and Cultural Organization: Paris, France.
Victora C.G., Adair L., Fall C., Hallal P.C., Martorell R.,Richter L. et al. (2008) Maternal and child undernutri-tion: consequences for adult health and human capital.Lancet 371, 340–357.
Victora C.G., de Onis M., Hallal P.C., Blossner M. &Shrimpton R. (2010) Worldwide timing of growth falter-ing: revisiting implications for interventions. Pediatrics125, e473–e480.
WHO Multicentre Growth Reference Study Group (2006)Assessment of differences in linear growth among popu-lations in the WHO Multicentre Growth ReferenceStudy. Acta Paediatrica Supplement 450, 56–65.
World Health Organization (2005) The World HealthReport: 2005: Make Every Mother and Child Count.World Health Organization, Geneva, Switzerland.
Review of fortified food and beverage products forpregnant and lactating women and their impact onnutritional statusmcn_350 19..43
Zhenyu Yang*† and Sandra L. Huffman‡
*Global Alliance for Improved Nutrition (GAIN), Geneva, Switzerland, †Institute for Nutrition and Food Safety, China Center for Disease Control, Xuanwu,Beijing, China, and ‡Department of Nutrition and Program in International and Community Nutrition, University of California, Davis, California
Abstract
Fortified beverages and supplementary foods, when given during pregnancy, have been shown to have positiveeffects on preventing maternal anaemia and iron deficiency. Studies show that use of micronutrient fortifiedsupplementary foods, especially those containing milk and/or essential fatty acids during pregnancy, increasemean birthweight by around 60–73 g. A few studies have also shown that fortified supplementary foods haveimpacts on increasing birth length and reducing preterm delivery. Fortification levels have ranged generally from50% to 100% of the recommended nutrient intake (RNI). Iron, zinc, copper, iodine, selenium, vitamins A, D, E,C, B1, B2, B6, and B12, folic acid, niacin and pantothenic acid are important nutrients that have been includedin fortified beverages and supplemental foods for pregnant and lactating women. While calcium has been shownto reduce the risk of pre-eclampsia and maternal mortality, calcium, phosphorus, potassium, magnesium andmanganese can have negative impacts on organoleptic properties, so many products tested have not includedthese nutrients or have done so in a limited way. Fortified food supplements containing milk and essential fattyacids offer benefits to improving maternal status and pregnancy outcome. Fortified beverages containing onlymultiple micronutrients have been shown to reduce micronutrient deficiencies such as anaemia and irondeficiency.
Keywords: fortified food and beverage, pregnant and lactating women, nutritional status.
Correspondence: Zhenyu Yang, China Center for Disease Control, Xuanwu, Beijing, China. E-mail: [email protected]
Introduction
The period of greatest risk and greatest opportunityfor making a difference in children’s survival, growthand development is from conception through the first2 years of life. These first 1000 days are when inter-ventions can have long-term positive impacts on chil-dren’s survival, growth and intelligence quotient,resulting in improved school performance and higherincomes and enhanced productivity in adulthood.
Inadequate nutrition in pregnancy includes poordietary quality and associated inadequate intakes ofmicronutrients, essential fatty acids, energy and
protein resulting in low body mass and inadequateweight gain in pregnancy. This can lead to increasedmaternal mortality from severe anaemia andincreased risk of pre-eclampsia, premature deliveryand having a low-birthweight (LBW) baby.
Inadequate micronutrient intake is common inboth non-pregnant non-lactating women (NPNL) andlactating women in developing countries. Figure 1presents this data for Burkina Faso, Mali, Mozam-bique, Bangladesh and the Philippines.There is a highprevalence of inadequate intakes of riboflavin, niacin,folate, vitamin B12, calcium and iron among NPNLand low intake of almost all micronutrients for
lactating women across these five countries (Arimondet al. 2010). In Latin American countries and in otherparts of the world, more than 40% of the populationis at risk for inadequate zinc intake (Brown et al.
2004). Deficiencies in micronutrients such as vitaminB12 in India and vitamin A in many parts of the worldare common, and low intakes of other micronutrients(e.g. vitamins E and D and calcium) are also
Key messages
• Both micronutrient-fortified beverages and fortified supplementary foods, when given during pregnancy, haveshown positive effects on maternal anaemia and iron deficiency prevention.
• Some studies have found that supplementary foods during pregnancy increased mean birthweight by around60–73 g, which is about three times that seen with multiple micronutrient supplements.
• When both maternal nutritional status improvements and birth outcome improvements are the primaryoutcomes of a programme, fortified food supplements are preferable to fortified beverages containing onlymultiple micronutrients.
• Increasing intake of energy was related to improvements in birthweight but primarily in women who weremore malnourished. High amounts of protein had no impact on birthweight. It is possible that ingredients suchas milk, micronutrients or essential fatty acids had greater benefits on increasing mean birthweights. Theinteraction between milk ingredients, essential fatty acids and micronutrients warrants further investigation.
Fig. 1. Prevalence of inadequate micronutrient intake of women in developing countries.The data were extracted from Table 6 (Arimond et al.2010). NPNL, non-pregnant non-lactating women.
prevalent, compromising women’s health and that oftheir newborns. In developing countries wheredietary iron and zinc come primarily from plant-based sources, the bioavailability is low because anti-nutrients that are naturally present in plant-basedfoods can decrease the bioavailability of iron and zincin these foods (Bhargava et al. 2001).
In developing countries, micronutrient deficienciesare common during pregnancy, and around 50% ofpregnant women are anaemic. Severely anaemicwomen are at increased risk of death in pregnancy:13% of maternal deaths in Asia and 4% in Africa aredirectly caused by anaemia (UNICEF, 2009).Anaemia contributes to the over 30% of deaths thatare due to haemorrhage.
An assessment of micronutrient status among preg-nant women in Nepal found that only 4% had nomicronutrient deficiency and almost 18% had five ormore deficiencies (Jiang et al. 2005). Nearly one-third(32%) of the women were deficient in riboflavin, 40%had vitamin B6 deficiency and 28% had vitamin B12
deficiency (Fig. 2).Additionally, low intakes of essential fatty acids,
especially omega-3 fatty acids, are problematic. Whiledaily mean intakes of omega-3 fatty acids in pregnant
women in the United States are 1470 mg (Nesheim &Yaktine 2007); in Chile (Mardones et al. 2008) andIndia (Muthayya et al. 2009), daily intakes in pregnantwomen are only one-third of that (500–600 mg). Suchlow intakes are related to low intake of fat and typesof fats consumed (in developing countries, onlysoybean oil and rapeseed oil are commonly consumedoils that contains omega-3 fatty acids) and the factthat other foods containing omega-3 fatty acids(including fatty fish, meat and eggs) are not com-monly eaten in sufficient amounts. In Burkina Faso,mean percent of energy as fat in the diet was only13% in pregnant women (Huybregts et al. 2009b), andin Sudan and Bangladesh, fat intakes during lactationwere only 19% (Nyuar et al. 2010) and 8% (Yakes2010) compared with the minimum World HealhOrganization and US recommendation for pregnantand lactating women (20%).
Poor essential fatty acid status in pregnancy resultsin higher rates of LBW, pre-eclampsia and poor childdevelopment outcomes such as reduced visual acuity.Poor maternal fatty acid status in lactation results inlow amounts of fatty acids in breast milk, which isassociated with detriments to the infant’s mentaldevelopment and longer-term cognition (Eilander
714
2532
40
28
11
61
4033
0102030405060708090
100
Vitam
in A
Vitam
in D
Vitam
in E
Ribof
lavin
Vitam
in B
6
Vitam
in B
12
Folat
e
Zinc
Iron
Anaem
ia
% w
om
en in
fir
st t
rim
este
r w
ho
are
d
efic
ien
t
Fig. 2. Multiple micronutrient deficiencies occur in women in first trimester, Sarlahi Nepal.The data were extracted fromTable 3 (Jiang et al. 2005).
et al. 2007). Poor maternal fatty acid status is alsoassociated with post-partum depression (Eilanderet al. 2007).
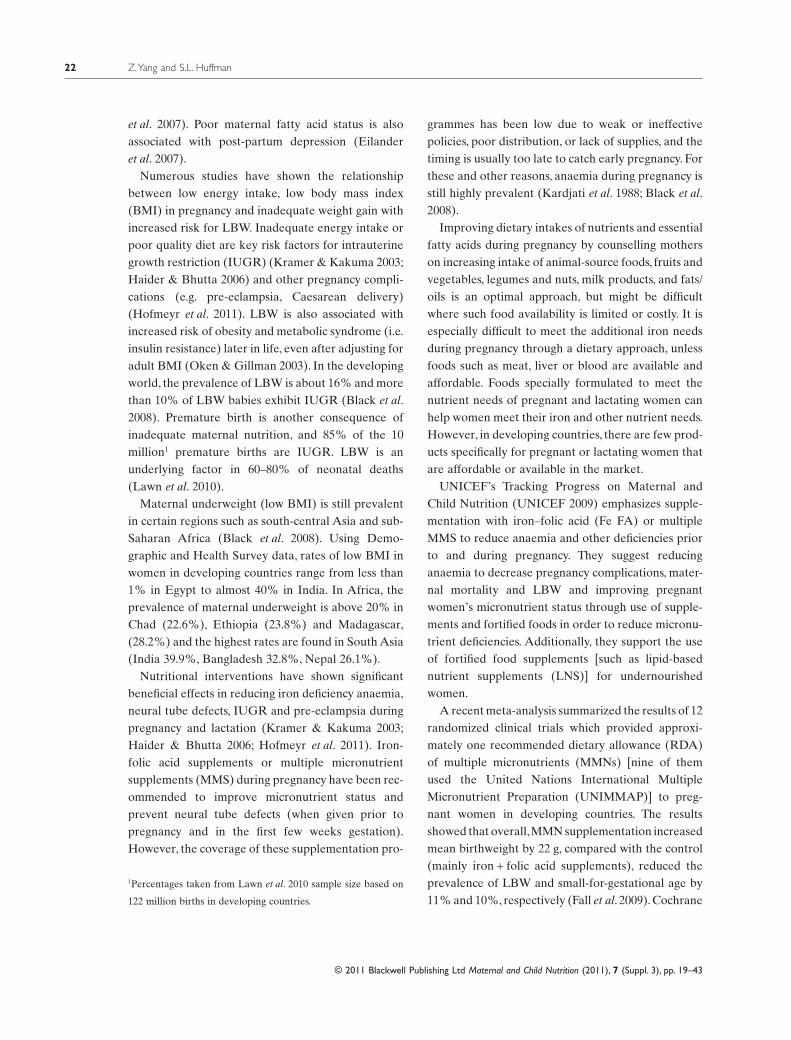
Numerous studies have shown the relationshipbetween low energy intake, low body mass index(BMI) in pregnancy and inadequate weight gain withincreased risk for LBW. Inadequate energy intake orpoor quality diet are key risk factors for intrauterinegrowth restriction (IUGR) (Kramer & Kakuma 2003;Haider & Bhutta 2006) and other pregnancy compli-cations (e.g. pre-eclampsia, Caesarean delivery)(Hofmeyr et al. 2011). LBW is also associated withincreased risk of obesity and metabolic syndrome (i.e.insulin resistance) later in life, even after adjusting foradult BMI (Oken & Gillman 2003). In the developingworld, the prevalence of LBW is about 16% and morethan 10% of LBW babies exhibit IUGR (Black et al.2008). Premature birth is another consequence ofinadequate maternal nutrition, and 85% of the 10million1 premature births are IUGR. LBW is anunderlying factor in 60–80% of neonatal deaths(Lawn et al. 2010).
Maternal underweight (low BMI) is still prevalentin certain regions such as south-central Asia and sub-Saharan Africa (Black et al. 2008). Using Demo-graphic and Health Survey data, rates of low BMI inwomen in developing countries range from less than1% in Egypt to almost 40% in India. In Africa, theprevalence of maternal underweight is above 20% inChad (22.6%), Ethiopia (23.8%) and Madagascar,(28.2%) and the highest rates are found in South Asia(India 39.9%, Bangladesh 32.8%, Nepal 26.1%).
Nutritional interventions have shown significantbeneficial effects in reducing iron deficiency anaemia,neural tube defects, IUGR and pre-eclampsia duringpregnancy and lactation (Kramer & Kakuma 2003;Haider & Bhutta 2006; Hofmeyr et al. 2011). Iron-folic acid supplements or multiple micronutrientsupplements (MMS) during pregnancy have been rec-ommended to improve micronutrient status andprevent neural tube defects (when given prior topregnancy and in the first few weeks gestation).However, the coverage of these supplementation pro-
grammes has been low due to weak or ineffectivepolicies, poor distribution, or lack of supplies, and thetiming is usually too late to catch early pregnancy. Forthese and other reasons, anaemia during pregnancy isstill highly prevalent (Kardjati et al. 1988; Black et al.2008).
Improving dietary intakes of nutrients and essentialfatty acids during pregnancy by counselling motherson increasing intake of animal-source foods, fruits andvegetables, legumes and nuts, milk products, and fats/oils is an optimal approach, but might be difficultwhere such food availability is limited or costly. It isespecially difficult to meet the additional iron needsduring pregnancy through a dietary approach, unlessfoods such as meat, liver or blood are available andaffordable. Foods specially formulated to meet thenutrient needs of pregnant and lactating women canhelp women meet their iron and other nutrient needs.However, in developing countries, there are few prod-ucts specifically for pregnant or lactating women thatare affordable or available in the market.
UNICEF’s Tracking Progress on Maternal andChild Nutrition (UNICEF 2009) emphasizes supple-mentation with iron–folic acid (Fe FA) or multipleMMS to reduce anaemia and other deficiencies priorto and during pregnancy. They suggest reducinganaemia to decrease pregnancy complications, mater-nal mortality and LBW and improving pregnantwomen’s micronutrient status through use of supple-ments and fortified foods in order to reduce micronu-trient deficiencies. Additionally, they support the useof fortified food supplements [such as lipid-basednutrient supplements (LNS)] for undernourishedwomen.
A recent meta-analysis summarized the results of 12randomized clinical trials which provided approxi-mately one recommended dietary allowance (RDA)of multiple micronutrients (MMNs) [nine of themused the United Nations International MultipleMicronutrient Preparation (UNIMMAP)] to preg-nant women in developing countries. The resultsshowed that overall,MMN supplementation increasedmean birthweight by 22 g, compared with the control(mainly iron + folic acid supplements), reduced theprevalence of LBW and small-for-gestational age by11% and 10%, respectively (Fall et al. 2009). Cochrane
1Percentages taken from Lawn et al. 2010 sample size based on
reviews also support these findings for MMNs (Haider& Bhutta 2006).
A Cochrane review also illustrated the benefits ofcalcium supplementation in pregnancy on reducingpre-eclampsia, death and serious morbidity (Hofmeyret al. 2011). The Lancet series on maternal and childnutrition calculated that universal calcium supple-mentation (at least 1000 mg calcium per day) couldprevent some 21 500 maternal deaths and reduce dis-ability adjusted life-years by 620 000.
Randomized controlled trials assessed intakes ofsupplements of fish oil, eicosapentaenoic acid anddocosahexaenoic acid (DHA), or DHA alone (insupplements or eggs) in pregnancy in relation to preg-nancy outcomes. Supplementation increased mater-nal DHA levels, placental transfer to the fetus(Helland et al. 2001; Dunstan et al. 2004; Krauss-Etschmann et al. 2007) and DHA concentration inbreast milk (Imhoff-Kunsch et al. 2009).The dosage ofDHA in these studies ranged from 0.4 g to 2.2 g.Duration of gestation in the DHA supplementationgroup increased by1.6–6.0 days in industrializedcountries (Smuts et al. 2003; Makrides et al. 2009;Szajewska et al. 2006). DHA was associated withreduced risk of very early preterm birth (<34 weeks)in a meta-analysis of women at high risk for this(Horvath et al. 2007). The concentration of DHA hasbeen shown to vary widely in breast milk, and thusconsuming supplements that contain DHA couldimprove DHA breast milk concentration and theinfant’s DHA status. Observational studies in bothdeveloped and developing countries indicate a likelyrelationship between DHA levels (as measured inbreast milk) and post-partum depression, with lowerlevels of DHA associated with higher rates of post-partum depression (Hibbeln 2002).
In Mexico, Ramakrishnan et al. (2010) assessedthe impact of DHA supplementation (400 mg/day)during pregnancy on infant growth and developmentthrough a randomized controlled intervention trial.Overall, no effect was found on growth outcomes(although cord and plasma DHA improved);however, among a subgroup of primigravidae, birth-weight significantly increased by 99.4 g and head cir-cumference by 0.5 cm among the supplementedwomen.
The aim of this review is to identify vitamin- andmineral-fortified products developed specifically forpregnant and lactating women and examine theirimpacts on maternal nutritional status and growth,birth outcomes, and development of the offspring. Weidentified and assessed micronutrient fortified bever-ages (Latham et al. 2003; Hyder et al. 2007), productscontaining cow’s milk (Lechtig et al. 1975; Mora et al.1979; Viegas et al. 1982a; Compbell-Brown 1983; Rosset al. 1985; Mardones-Santander et al. 1988; Atton &Watney 1990; Mardones et al. 2008; Fernald et al.2009), high-fat products (Girija et al. 1984; Prenticeet al. 1987; Ceesay et al. 1997) including LNS (Huy-bregts et al. 2009a) and protein-energy drinks (Rushet al. 1980; Adair & Pollitt 1985; Kardjati et al. 1988).This document can serve as a resource for developingnutrition products for pregnant or lactating womenand provides concrete examples of fortified productsthat have shown impact on mothers or their offspring.
Micronutrient fortified beverages(not containing milk or otherprotein/fat sources)
In this review, a micronutrient fortified beverage isdefined as a MMN-fortified drink with some addedsugar, but without added protein or fat. Proctor andGamble produced a fortified juice powder (25 gadded to water and drunk twice daily), which wasused in a trial in Tanzania.The nutrient composition islisted in Table 1 (Latham et al. 2003). The Tanzaniantrial was a placebo-controlled, randomized clinicaltrial that started in 1999. Four hundred thirty-nine(439) pregnant women between 12 and 34 weeks ofpregnancy were randomly assigned to either theexperimental group (n = 227) or control group(n = 212) for 8 weeks. At follow-up, 127 pregnantwomen remained in the experimental group (44%dropout) and 132 pregnant women in the controlgroup (38% dropout). Of those who completed thestudy, 93.4% consumed at least 70% of the supple-ments. At the end of the supplementation period, theprevalence of anaemia was significantly lower in thefortified beverage group (37%) than in the non-fortified group (48.5%) (P = 0.018), and serum fer-ritin concentrations were also significantly higher in
the experimental group (21.5 mg L-1) than in thecontrol group (16.9 mg L-1) (P = 0.009).There were nosignificant differences in retinol or C-reactive proteinconcentrations between the two groups (Makola et al.2003).
A similar product was evaluated in a randomizedcontrolled trial in Bangladeshi adolescent girls(Hyder et al. 2007).The product was also produced byProctor and Gamble with modifications to fit thisyounger age group. The nutrient composition isshown in Table 1. In the study, the fortified beveragehad significant impacts on haemoglobin concentra-tion, serum ferritin and retinol concentrations.However, the impact on serum zinc was not signifi-cant (13.3 vs. 12.9 mmol L-1, P = 0.3). Interestingly, thegirls in the experimental group gained more weightand increased their mid-upper arm circumferencecompared with the girls in the control group.
In summary, these randomized controlled trialsshowed that MMN-fortified beverages significantlyincreased haemoglobin concentration (~4 g L-1,P < 0.05) and ferritin concentrations (5–10 mg L-1,P < 0.01), and reduced anaemia by approximatelyone-third (P < 0.05) in pregnant women and adoles-cent girls. The MMN-fortified beverage significantlyreduced vitamin A deficiency in adolescent girls(P < 0.01, Table 2).
The daily dose of the MMN-fortified beverage forpregnant women contained 176 kcal with about 50%of the recommended nutrient intake (RNI) for iron,niacin, folic acid, iodine, and 100% of the RNI forvitamins A, E, B1, B6 and zinc, and 200% of the RNIfor vitamins C and B12.
Products containing cow’s milk
A long-term prospective study, which lasted from1969 to 1977 investigated the effect of energy-proteinsupplementation during pregnancy on birthweight inGuatemala (Lechtig et al. 1975). The study was acluster randomized trial. Four villages were selectedfrom qualified villages based on socio-economicstatus. Two villages (one small and one large) weregiven Atole (an energy-protein supplement). Thematched two villages were given Fresco (a controlproduct). Atole contained a vegetable protein mix Ta
(Incaparina-maize flour 65%, cottonseed flour 25%and soya bean flour 10%) (31% by weight) (Tartanac2000), dry skimmed milk (49%) and sugar (20%);Fresco was similar to Atole but contained no proteinor fat and only 59 compared with 163 calories per100 mL. Prior to October 1971, there were no micro-nutrients added to Fresco. The fortification level forAtole was low, meeting only 4% of the RDA for ironfor pregnant women (Table 3).
From 1971, both Fresco and Atole were fortifiedwith same level of micronutrients (i.e. 7% of RDA forvitamin C and 18% of RDA for iron, 62.5% of vitaminA and close to one RDA for vitamins B1, B2 andniacin), except for 400 mg calcium and 300 mg phos-phorus in Atole (because of inclusion of milk), but notin Fresco. The supplements were provided twice daily(mid-morning and mid-afternoon) (Martorell et al.1995). Subjects voluntarily went to a health centre toreceive the products. Thus, self-selection bias couldhave existed. The mean birthweight was significantlyhigher in the Atole group (3107 g, n = 219) than in theFresco group (2992 g, n = 186) (P < 0.025) and wassignificantly higher in the high intake group (definedas total supplemental energy >20 000 kcal, 3105 g,n = 170) than in the low intake group (2994 g, n = 235)in Atole and Fresco combined groups (P < 0.025)(Lechtig et al. 1975). The results showed an estimated30 g increase in birthweight/10 000 kcal ingested fromsupplement (Rasmussen & Habicht 2010). A majorfinding was that women with lower fat stores hadlarger infants instead of increasing their own weightduring the pregnancy. In contrast, those with bettercurrent nutritional status had only modestly largerbabies and gained weight themselves during this sameperiod.Women who gained more weight in pregnancybreastfed for a longer duration than those with lowerweight gains (Table 4).
Data were analysed from women who participatedin the supplementation trial during two consecutivepregnancies and interim lactation period. Resultsshowed that birthweight for the second child whosemothers consumed a high intake of the supple-ments (either Atole or Fresco), during lactation(>40 000 kcal), during the previous pregnancy andthis pregnancy (>20 000 kcal) was 246 g significantlymore than birthweights for those whose mothers con-
sumed lesser amounts of the supplements during thecourse of the previous pregnancy (<20 000 kcal), lac-tation (<40 000 kcal) and the most-recent pregnancy(<20 000 kcal) (P < 0.025) (Villar & Rivera 1988).
A product studied in Chile among pregnant womenwas a milk powder fortified with amino-chelated iron,omega-3 fatty acids (0.9 g alpha-linolenic acid and4.4 g linoleic acid/100 g product) and additionalmicronutrients (Mardones et al. 2008). The nutrientcomposition of the product is listed in Table 3. Thiswas a randomized controlled trial without blinding ofsubjects but the investigators were blinded.
The study started in 2002 and an iron-folic acidsupplementation programme during pregnancy wasalready in place with high coverage. Women received2 kg of powdered milk each month (about 67 g perday). Powdered milk fortified with smaller amounts ofiron (ferrous sulfate), zinc, vitamin C and other nutri-ents was used as a control. The main differencebetween these two products was that the more highlyfortified milk powder contained higher amounts ofenergy (521 kcal vs. 498 kcal per 100 g), vitamins,trace minerals and essential fatty acids.Vitamins A, C,E, B6, niacin, biotin, folic acid, magnesium and sele-nium were much lower in the control group.
In this study in Chile, underweight pregnantwomen (BMI < 21.2 kg m-2, at the 10th week of preg-nancy) were randomly allocated to the treatmentgroup (n = 589) or control group (n = 552) before 20weeks of gestation.The mean gestational age at enrol-ment was 11.36 weeks for the intervention group and10.66 weeks for the control group (P < 0.05), and thetreatment lasted until delivery (about 30 weeks forthe intervention). The reason participants in theexperimental group had, on average, a higher meangestational age at enrolment was due to unintendedlate distribution of the fortified milk used for theintervention.
The mean daily consumption of the two supple-ments was slightly higher in the control group (36.9 �
26.2 g day-1–185 kcal day-1) than in the experi-mental group (31.2 � 31.0 g day-1–163 kcal day-1).The primary outcomes were birthweight and gesta-tional age. Based on intention-to-treat analysis, meanbirthweight was significantly higher (65 g) in the treat-ment group (3265 g) than in the control group (3200 g)
(P = 0.034). Mean birth length was also significantlygreater (0.38 cm) in the treatment group (49.36 cm)than in the control group (48.98 cm) (P = 0.019).Maternal weight gain during pregnancy was 500 ghigher in the treatment group than in the control group(14.5 kg vs. 14.0 kg), but the difference was not signifi-cant. Gestational duration was slightly longer in thetreatment group (~1.4 days). They also founddecreases in very early preterm births (0.4% vs. 2.1%,P = 0.02) and marginal decreases in pre-eclampsia(1.6% vs. 3.4%, P = 0.083).
Additionally, on-treatment analysis was conductedbecause the experimental food arrived after the studybegan and women who did not receive the treatmentas allocated during the 3 months were excluded. Theon-treatment analyses showed statistically signifi-cantly larger increases in birthweight (118 g), birthlength (0.57 cm) and head circumference (0.20 cm).They also found decreases in pre-eclampsia (15% vs.6%). The national food distribution programme forlow-income pregnant women in Chile now includesmilk fortified with essential fatty acids.
An earlier trial in Chile conducted in 1983 usedfortified milk powder as well (Mardones-Santanderet al. 1988). This product contained higher amounts ofiron (43 mg vs. 27 mg) and vitamin C (340 mg vs.110 mg), and less protein (14.5 g vs. 25 g) than the onedescribed earlier, and no alpha-linolenic acid wasincluded in the product (Table 3). This study was alsoa randomized controlled trial. Underweight pregnantwomen before 20 weeks of gestation (mean gesta-tional age ~14.5 weeks) were randomly assigned tothe treatment group (n = 570) or the control group(n = 565). The intervention lasted ~25 weeks untildelivery and the mean intake of the fortified productwas 37 g day-1. The subjects in the control groupreceived unfortified milk powder. At the end of thestudy, mean birthweight was significantly higher(72 g) in the treatment group (3178 g, n = 391) than inthe control group (3105 g, n = 391), and the percent-age of IUGR infants was significantly lower in thetreatment group (32.5%) than in the control group(43.7%) (P < 0.05). In a sub-study, mean haemoglobinconcentration was significantly higher in the fortifiedgroup (126 g L-1, n = 68) than in the control group(119 g L-1, n = 71), and the prevalence of low ferritin
concentrations was significantly lower in the fortifiedgroup (45%) than in the control group (73%). Preg-nancy weight gain was significantly higher (1 kg) inthe experimental group (12.3 kg) than in the controlgroup (11.3 kg) (P < 0.05), as was early post-partumweight loss (P < 0.05).
The Mexican government started a poverty allevia-tion programme in 1997, which is now called Opor-
tunidades (formerly Progresa) (Rivera et al. 2000).This programme is a conditional cash transfer (CCT)programme with strong nutritional components. Inaddition to a CCT, children 6–48 months with weight-for-age Z-scores <-1 and pregnant and lactatingwomen all received milk-based fortified foods(Rivera et al. 2000). The formulation of the supple-ments for pregnant women is listed in Table 3(Rosado et al. 2000). The pudding-like product con-tained 250 kcal per serving and was fortified withseveral nutrients, including iron and zinc. A quasi-experimental study design was used to evaluate theprogramme. Communities were randomly assignedinto either early start of the programme (320 commu-nities) or delayed (18 months later) initiation of theprogramme (186 communities). Several studies foundthat growth outcomes, development and behaviouroutcomes were positively associated with the CCTprogramme (Barber & Gertler 2008; Fernald et al.2008; Leroy et al. 2008; Fernald et al. 2009). One studyshowed that birthweight was 127 g higher among thewomen who received the benefits of the CCT pro-gramme than those who did not. Additionally, theprevalence of LBW was reduced by 4% for thewomen who received benefits, compared with thosewho did not (Barber & Gertler 2008).
Another study on the Oportunidades programmereported that on average after 2 years, childrenyounger than 6 months at baseline grew 1.5 cm and0.76 kg more in the beneficiary families than those inthe control families, which may be due to thosemothers accepting benefits through the whole preg-nancy and early lactation period (Leroy et al. 2008).Another possibility could be that younger childrenwere more sensitive to infant and young child nutritionintervention. Doubling cash transfers was also associ-ated with greater height-for-age Z-score (HAZ), lowprevalence of stunting, and better motor development
and cognitive development (Fernald et al. 2008). Eventhough it is not possible to attribute the higher birth-weight among women who received the fortified nutri-ent supplements during pregnancy solely to thesesupplements, fortified supplements during pregnancyappear to have played an important role.
A study in the United Kingdom in 1979 assessedthe impacts of flavoured milks on birthweight (Viegaset al. 1982b). Pregnant women at 18 weeks of gesta-tion were randomly assigned into one of three groups:(1) vitamin and mineral; (2) energy, vitamin and min-ernal; and (3) protein, energy, vitamin and mineral forabout 38 weeks. The nutrient composition is listed inTable 3.There were no significant mean differences inbirthweight (all roughly 3.0 kg) among the groups.
In a subsequent study (Viegas et al. 1982a), thesame products with multiple vitamin supplementswere selectively given to pregnant women with a lowmean increase in triceps skinfold thickness <0.2 mmmonth-1 (average of the increase between 18 and 28weeks).The results showed that protein energyand multi-vitamin supplementation significantlyincreased birthweight by 330 g (3350 g vs. 3020 g)and increased skinfold thickness in those whosemeasurements were <0.2 mm month-1. However, forthose women whose mean triceps skinfold thicknessincreased >0.2 mm month-1 between 18–28 weeks,there was no effect.
In the 1980s, a different flavoured milk drink wasselectively provided to UK pregnant women withsmall changes (�0.2 mm) in triceps skinfold thicknessbetween 18–28 weeks of pregnancy (Atton & Watney1990). The nutrient composition is listed in Table 3.Briefly, the product contained 158 kcal and 5.7 gprotein per 100 mL with a low level of micronutrients(about 10% of the RDA, except for phosphorus,which was 16%). This was a randomized controlledtrial with a non-intervention normal control group,which was defined as changes in mean triceps skinfoldthickness between 18–28 weeks >0.2 mm. Those preg-nant women with small increments in triceps skinfoldthickness (<0.2 mm) were randomly assigned intoeither a supplement group or control group. Thenormal control group continued not receiving supple-ments. There were no significant benefits detectedamong any of the groups.
A milk-based porridge (100 g dry milk, ~72 g maizeflour, containing 699 kcal per day) or a bean-cornblended food [bean and maize (1.2:1) mush contain-ing 775 kcal] was offered to pregnant women in SouthAfrica in 1977 in a randomized controlled trial (Rosset al. 1985). Pregnant women before 20 weeks of ges-tation were recruited and randomly assigned into oneof the four groups (placebo supplement, 30–90 mgzinc gluconate supplements, bean-corn blended foodand milk-based food). The supplements were pro-vided until delivery. These products containedcalcium, iron, vitamin A, niacin, riboflavin and thia-mine. The nutrient composition is listed in Table 3.Mean birthweight was significantly higher in the milk-based product group (3376 g) than in the other threegroups (placebo: 3171 g, zinc: 3088 g, bean-cornblended food: 3082 g) (P < 0.05).
In a Vietnamese study among 84 pregnant women,consumption of fortified milk (400 ml, 120 calories,6.8 g protein, 15 mg elemental iron, 200 mg folic acidand 17.5 mg vitamin C) was compared with unforti-fied milk, and a supplement containing 60 mgFe/250 mg of folic acid and a placebo supplement. Therisk of developing anaemia after 16 weeks interven-tion was lowest in the groups who received iron (for-tified milk and iron supplement groups), and theprevalence of achieving adequate weight gain wasgreatest in the milk groups. The highest weightincreases were found in the fortified and non- fortifiedmilk groups (5.8 � 2.1 and 5.0 � 2.0 kg, respectively),followed by the supplemented group (4.6 � 3.1 kg)and the placebo group (3.8 � 2.5 kg). The authorsstate:
The distribution of fortified milk to pregnant women is far
more expensive than the distribution of iron (sic) supple-
ments alone. However, in the Vietnamese situation, in which
mothers have a high prevalence of acute undernutrition,
supplementation alone was insufficient to address weight
gains during pregnancy. Rather, the increased availability of
fortified food commodities such as milk at the household
level should be considered. (Hoa et al. 2005)
In a randomized controlled trial in the 1970s inColombia, pregnant women in the first or second tri-mester were randomly assigned to supplementation
or control groups (Mora et al. 1979). The supplementsincluded dry skim milk, enriched bread, vegetable oiland vitamin/mineral supplements, which contained856 kcal, 38.4 g protein, 6024 IU vitamin A and 18 mgiron. The results showed that subjects in the supple-mentation group increased their mean daily energyintake by 155 kcal and mean protein intake by 20 g.Mean birthweight was significantly higher for full-term male newborns in the supplementation group(3061 g) than in the control group (2966 g), but thiswas not observed for their female counterparts(2935 g vs. 2942 g). Male offspring may be more sen-sitive to nutrition supplements as shown in otherstudies (Adair & Pollitt 1985).
In addition to studies or programmes that havetested products that contain cow’s milk, severalstudies have assessed programmes which providedmilk as part of the food package for pregnant women.In another UK study in the 1970s, pregnant women atrisk for undernutrition (defined as weight-for-heightat 20 weeks of gestation or weight gain below the 25thpercentile of the Aberdeen reference for women)were randomly assigned into a food supplementationgroup or a control group (Compbell-Brown 1983).The food supplements included a flavoured milkdrink, fresh milk or cheddar cheese, which provided299 kcal and 15.9 g protein on average.There were nosignificant differences in birthweight (3032 g vs.2995 g), gestational age (39.7 weeks vs. 39.6 weeks), ormaternal weight gain during the 30 weeks of interven-tion (0.4 kg week-1 vs. 0.36 kg week-1) between treat-ment group and control group.
In the United States, the Special SupplementalFood Program for Women, Infants and Children(WIC) provides food supplements for pregnant andlactating women. The foods provided include milk,cheese, eggs, iron-fortified cereal and fruit juice, whichare intended to improve iron, vitamin A and vitaminC intake. An early evaluation by Kennedy et al. foundthat the birthweight of WIC participants’ offspringwas about 60 g higher than those who did not partici-pate in WIC, after controlling for total weight gainduring pregnancy, gestational age, pregravid weightand prior history of LBW (Kennedy et al. 1982). Hae-moglobin concentration and haematocrit were alsosignificantly improved by 4 g L-1 and 1.3%, respec-
tively, in the WIC participants compared with non-participants (Kennedy & Gershoff 1982).
An evaluation that used a sibling model to estimatethe effectiveness of the WIC programme on birth-weight showed that mean birthweight was about 185 ghigher for children whose mothers participated in theWIC programme than their siblings whose mothersdid not participate (Kowaleski-Jones & Duncan2002). Another study evaluated the effects of post-partum supplementation (5–7 months vs. 0–2 months)on the subsequent pregnancy outcome in a WICpopulation in California.The study showed that meanbirthweight (131 g) and mean birth length (0.3 cm)were significantly greater and LBW rate was signifi-cantly lower in the treatment group (5–7 months)than in the control group (0–2 months) (Caan et al.1987). The current contents of the WIC food packageare shown in Fig. 3 [United States Department ofAgriculture (USDA 2007)]. State agencies determinewhich specific foods are allowed in the package.However, the federal government has specificationsthat must be met for fortification levels. These foodsand their fortification levels may help in determiningappropriate foods for pregnant women in developingcountries, where normal food intake is often less andthe quality worse than among poor women in theUnited States. According to US federal requirements,milk must be fortified and contain at least 400 IU ofvitamin D per quart (100 IU per cup) and 2000 IU ofvitamin A per quart (500 IU per cup). Soy-based bev-erages must be fortified to meet the following nutrientlevels per cup: 276 mg calcium, 8 g protein, 500 IUvitamin A, 100 IU vitamin D, 24 mg magnesium,222 mg phosphorus, 349 mg potassium, 0.44 mg ribo-flavin, and 1.1 mcg vitamin B12, in accordance withfortification guidelines issued by the Food and DrugAdministration; juice must be pasteurized, 100%unsweetened fruit juice and must contain at least30 mg of vitamin C per 100 mL of juice; breakfastcereals must contain a minimum of 28 mg iron per100 g dry cereal and contain �21.2 g sucrose andother sugars per 100 g dry cereal (�6 g per dry oz).Canned fish can include light tuna, salmon, sardinesand mackerel (USDA 2007).
In summary, eight out of a total of 11 studies thatmeasured birthweight showed that fortified products
containing cow’s milk significantly improved birth-weight (Table 4). The magnitude of the improvementin birthweight ranged from 60 to 330 g. The beneficialeffects were seen in three out of five studies wheremalnourished subjects (defined as underweight ormaternal skinfold thickness increment during 18–28weeks <0.2 mm week-1) were investigated.
Two studies reported significant increases in hae-moglobin ranging from 4 to 7 g L-1. In addition, therewere significant improvements in birth length, veryearly pre-term delivery or iron deficiency reported inthe Chile studies (Mardones-Santander et al. 1988;Mardones et al. 2008).
Because various control groups were used in dif-ferent studies, the causal effects could be attributedto MMN, dairy components, essential fatty acids orall of these components. The interaction betweenMMN and dairy components was not evaluated inthese studies, thus an interaction effect cannot beruled out.
Fortified high-fat products
High-fat products are defined in this review as prod-ucts in which more than 35% of energy is provided byfat. A study by Prentice et al. provided groundnut-based biscuits and vitamin-fortified tea to pregnantwomen in the Gambia (Prentice et al. 1987). Thenutrient compositions of the fortified supplements arelisted in Table 5. The fortification level for calcium,riboflavin, and vitamins A and C was between 18%and 42% of the RNI for 100 g of biscuits (each biscuitcontained 546 kcal) and 100 g of tea. 47 mg iron asferrous sulfate and 500 mg folic acid were provided toevery pregnant woman. A maximum of three biscuitsand 380 g tea in the dry season and a maximum offour biscuits and 380 g tea in the hungry season wereprovided daily, containing 1209 kcal and 1513 kcal,respectively. This study used a historical control.
The mean birthweight of babies bornduring the 4-year supplementation (1980–1984
Fig. 3. Contents of the 2007 revised Women, Infants and Children Food package.
post-supplementation) was compared with that ofbabies born 4 years immediately before the study(1976–1980 pre-supplementation). The mean dura-tion of supplementation was 24 weeks and the meanintake of supplements was about 671 kcal day-1, whichwas about 44–55% of those provided. After adjustingfor sex, parity, month and gestational age, meanbirthweight was significantly higher (200 g) inpost-supplementation (3010 g) than in pre-supplementation (2810 g) during the wet (hungry)season. However, the difference was not significantduring the dry season (2959 g vs. 2972 g; pre-supplementation vs. post-supplementation, respec-tively). LBW was also less common in post-supplementation than in pre-supplementation duringthe wet season. Supplementation had no significanteffect on maternal weight gain during pregnancy. Nosignificant difference was detected for gestational agebetween pre- and post-supplementation groups.
A similar biscuit with some modifications (e.g.calcium density was decreased to 46 mg 1000 kcal-1
from 384 mg 1000 kcal-1 in the previous product) wastested again in the Gambia in 1989 by using a clusterrandomization trial (Ceesay et al. 1997). Two biscuitscontained 4250 kJ (1015 kcal, 507.5 kcal per biscuit)energy, 22 g protein, 56 g fat, 47 mg calcium and1.8 mg iron. They contained roasted groundnuts, riceflour, sugar and groundnut oil and therefore, thoughhigh in fat, contained no good source of omega-3 fattyacids. The study found that the food supplementsincreased birthweight by 201 g in the hungry seasonand by 94 g in the dry season (harvest season). Thesupplementation also increased head circumferenceby 3.1 mm.The odds of LBW, stillbirths and all deathsduring the first week of life were reduced by 39%,53% and 46%, respectively (Table 6).
A similar groundnut-based biscuit (containingwheat-soy flour, dried skimmed milk, groundnut oiland sugar) and tea as mentioned previously in theGambian studies was also offered to lactating womenin the Gambia (Prentice et al. 1980). The historicalcontrols were used in the study. The supplementswere given for 12 months and the mean energy intakefrom the supplements was 830 kcal day-1. The breastmilk volume was similar between pre- and post-supplementation groups. The fat content of breast
milk also did not differ between women who weresupplemented and those who were not supplementedduring the pre-supplementation period (3.94 g dl-1 vs.3.86 g dl-1; pre- vs. post-supplementation, respec-tively).Women in the supplement group were heavierthan those in the pre-supplementation group at thesame calendar month at the same duration post-partum.
A small-scale randomized controlled trial (n = 10for each group) was conducted in the early 1980s inIndia (Girija et al. 1984). Normal dietary intake met60% of pregnant women’s RNI for energy. The trialprovided 50 g of sesame cake, 40 g of jaggery (molas-ses) and 10 g of oil (30 g protein and 417 kcal) to thetreatment group in the third trimester of pregnancy.The results showed that haemoglobin levels increasedsignificantly in the treatment group compared withthe control group (19.7 g L-1 vs. 1.7 g L-1). Mean dailybreast milk production was significantly higher in thetreatment group (465 g) than in the control group(158 g) but mean birthweight and birth length in thetwo groups were not statistically significant (butsample sizes were quite small).
In refugee camps housing Bhutanese in Nepal, an11% decrease in the prevalence of LBW and anincrease in mean birthweight from 2.84 kg to 3.0 kgwere associated with micronutrient-dense foods(Shrimpton et al. 2009). A fortified corn-soy blendedfood and added oil, containing 455 kcal per day, calledUNILITO, was provided to pregnant womenthroughout. The nutrient composition is listed inTable 5.
LNS have been suggested for use during pregnancy(Briend 2001). They contain high amounts of fat,including a good source of omega-3 fatty acids, in asmall amount of food (such as a fortified peanut pastecontaining canola or soy oil, sugar, micronutrients andsometimes milk). A recently completed trial inBurkina Faso assessed the impact of LNS on birthoutcomes (Huybregts et al. 2009a). Pregnant women(n = 1300) were randomly assigned into either an LNSgroup (370 kcal,72 g) daily with UNIMMAP micronu-trient formulation (Table 6) or a control group(UNIMMAP tablet). The results showed that birthlength was 0.5 cm significantly greater (P = 0.001) andplacental weight (15 g) was significantly heavier in the
LNS group (579 g) than in the control group (564 g)(P = 0.04), but there was no effect on birthweight.Maternal nutritional status, haemoglobin concentra-tion, and gravidity modified the effects of the LNS.Effects on birth length were significant for motherswho were multigravida,had low BMI or anaemia com-pared with their counterparts not receiving LNS.Among women who had BMI <18.5, the mean increasein height of newborns was 1.2 cm (P = 0.005), and theplacental weight increased by 56 g (P = 0.017). Theincrease in birthweight was 111 g (P = 0.13), thoughnon-significant perhaps because of low numbers ofvery malnourished women. The treatment did notaffect preterm delivery.
In summary, high-fat products had significantimpacts on birth outcomes (i.e. birthweight in theGambia and Nepal studies, and birth length in theBurkina Faso study) (Table 6). The increase in birth-weight was greater in the hungry season (~200 g) thanin the harvest season (13–94 g) in the Gambia studies.Micronutrient status is expected to be comparable inboth the Gambia and Burkina Faso study due tosimilar micronutrient consumption between treat-ment and control.
The energy intake from these products was morethan 350 kcal per day. Fat provided >40% of theenergy in these products. Although the omega-3 fattyacid content of the foods used in the Gambia was lowdue to the use of groundnuts and groundnut oil, theLNS in Burkina Faso was developed to have signifi-cant amounts of omega-3 fatty acids, through theinclusion of full fat soy flour.
Formulated protein-energy drinks
In this review, a formulated protein-energy drink isdefined as a protein-containing beverage with orwithout micronutrient fortification that does not usemilk as a key ingredient. These were tested out over20 years ago, before an understanding of the need foressential fatty acids was wide-spread. At that time,protein was considered to be a limiting element indeveloping country diets. However as will be shown,protein was found not to be a major concern and infact high intakes appear to be detrimental to preg-nancy outcomes.
A chocolate-flavored energy and nutrient-richliquid supplement containing 400 kcal per serving wasused during pregnancy and lactation in a study inTaiwan, China (Adair & Pollitt 1985). The nutrientcomposition is listed in Table 7. The fortification levelfor most micronutrients was close to one RNI. A fewmicronutrients were fortified at <50% of the RNI,including vitamin E and iron.The study was a double-blinded randomized controlled trial. Pregnant womenwere randomly assigned to a treatment group(n = 114) or placebo group (n = 111).The interventionstarted 3 weeks after the birth of the first born childand continued until 15 months of lactation for thesecond born child. The liquid supplements providedtwo servings per day (12.5 oz per serving). In additionto receiving either the intervention product orplacebo, multi-vitamin and mineral supplements wereprovided to both groups. The main outcomes werebirthweight and birth length.There were no significanttreatment effects on birthweight or birth length. Birth-weight was slightly higher (56 g, 31.7 g) for both sexesin the treatment group (M: 3216.0 g, F: 3012.5 g) thanin the control group (M: 3160.6 g, F: 2980.8 g), respec-tively. Due to the low power of the study, these differ-ences were not statistically significant. Within thetreatment group, birthweight was significantly higherin the male babies born after the second pregnancywith treatment (3216.0 g) than in the male babies bornafter the first pregnancy without treatment (3053.6 g)(P = 0.013). The mean Bayley motor developmentscore was not significantly different between the treat-ment group (3.8, n = 99) and the control group (3.31,n = 99) (P = 0.058) but sample sizes were small. Mater-nal haematocrits were significantly higher in the treat-ment group (35.3%) than in the control group (33.0%)and than in the pre-treatment (33.7%) at 2 monthsbefore delivery (P < 0.05).
A randomized controlled trial in Indonesia in 1982measured the impacts of a protein-energy beveragecontaining palm oil and sunflower oil (both low inomega-3 fatty acids), high or low amounts of caseinand glucose without micronutrient fortification duringpregnancy on birthweight and breast milk output(Kardjati et al. 1988; van Steenbergen et al. 1989). Thenutrient composition is listed in Table 7. Pregnantwomen in the third trimester were randomly assigned
to either a high energy or low energy group. Thehigh-energy beverage contained 465 kcal and 7.1 gprotein per 200 ml; the low energy beverage contained52 kcal and 6.2 g protein per 200 ml. There was nosignificant difference in birthweight (2908 g vs. 2948 g,high energy vs. low energy groups, respectively), orbreast milk production between these two supplementgroups. However the children born to the high energygroup were taller and stunting rates were lowerthroughout the first 5 years (Kusin et al. 1992). Mater-nal weight gain was not statistically different betweenthe two groups (7.1 kg vs. 6.4 kg; treatment (n = 272)vs. control (n = 265), respectively).
A fortified protein-energy drink was tested in the1970s 1970in New York (Rush et al. 1980). Pregnantwomen (n = 1051) were randomly assigned to one ofthree groups (supplement, complement and controlgroups). The supplement group received 40 g caseinand 470 kcal and the complement group received 6 gcasein and 322 kcal. The control group receivedmultivitamin-mineral supplements, which were atthe same dosage as in the complement group. Thedetailed nutrient content is listed in Table 7. Thesupplements continued until delivery. At delivery, 770pregnant women remained in the study and deliveredsingleton births. There were no significant effects oftreatment on birthweight.The complement group hada slightly higher birthweight (41 g) than the controlgroup (which may reflect the impact of the casein, amilk product); however, this was not statistically sig-nificant. Early premature delivery and neonatal deathwere associated with high protein supplementation.The supplement group with high protein content hada significantly lower birthweight than complementgroup or control group for premature deliveredinfants (<37 weeks). Children in the supplementgroup showed better visual habituation (a type ofnon-associative learning), visual dishabituation(recovery of attention), and mean length of free playepisode at 1 year of age.
In summary, these randomized controlled trialsshowed that protein and energy administered withoutother nutrients had no significant beneficial effects onbirthweight (Table 8), no matter when [pre-pregnancy(Adair & Pollitt 1985) or mid-pregnancy (Rush et al.1980)] the protein-energy drinks were given. Learning
capabilities were improved in one study when receiv-ing the high protein-energy supplement (Rush et al.1980; Haider & Bhutta 2006).The high protein supple-ments were associated with some adverse effects (pre-mature delivery, premature-related neonatal deathand LBW) (Rush et al. 1980). Maternal haematocritwas improved in one study (Adair & Pollitt 1985).
These protein-energy products contained 233–552 kcal energy with 7–30 g protein daily. The controlgroups received multi-vitamin and mineral supple-ments with a similar formulation as the treatmentgroup received through the supplement (Adair &Pollitt 1985; Kardjati et al. 1988) or the fortifiedproduct (Rush et al. 1980; Ross et al. 1985).The poten-tial benefits of micronutrients could not be detectedbecause of lack of a placebo control.
Discussion
Both micronutrient-fortified beverages and fortifiedsupplementary foods, when given during pregnancy,have shown positive effects on maternal anaemia andiron deficiency prevention. For example, anaemiaprevalence was reduced by approximately one-thirdin fortified beverage studies in Tanzania, and haemo-globin concentration increased by 4–7 g L-1 in theTanzania study and in the earlier fortified milkpowder study in Chile.
Some studies have found that supplementary foodsduring pregnancy increased mean birthweight byaround 60–73 g, which is about three times that seenwith MMS. Under certain circumstances (e.g. duringthe hungry season in the Gambia, in women from18–28 weeks of gestation with smaller increases inskinfold thickness), the supplement led to an increasein mean birthweight of 115–330 g. Both macronutri-ents and micronutrients contributed to the positivechanges, but the level of maternal nutritional status,birthweight and sex of offspring modified the effectsof treatments.
High fat supplements consumed during pregnancywere associated with desirable outcomes assessingbirth length, placental weight, very-early pretermdelivery, pre-eclampsia and IUGR, stillbirth and neo-natal mortality. For example, in two studies whereessential fatty acids were provided, birth length was
0.4–0.5 cm greater in the treatment group than in thecontrol group (Mardones et al. 2008; Huybregts et al.2009a).
Maternal food supplementation during pregnancywas not related to maternal weight gain during preg-nancy in the majority of studies, but was when mater-nal weights were low at start.
Increasing intake of energy was related to improve-ments in birthweight but primarily in women whowere more malnourished. High amounts of proteinhad no impact on birthweight. It is possible that ingre-dients such as milk, micronutrients or essential fattyacids had greater benefits on increasing mean birth-weights. The interaction between milk ingredients,essential fatty acids and micronutrients warrantsfurther investigation.
A fortified beverage can improve the status ofother important micronutrients such as vitamin A inaddition to improving iron status. Fortified foodsupplementation during pregnancy positively affectedthe offspring’s learning capability during childhood.
Given the experiences mentioned and summarizedup to this point, products to be consumed during preg-nancy and lactation could be formulated to improveeither maternal micronutrient status or birth out-comes. A question, however, is whether women aremore likely to consume a beverage instead of a tabletor capsule, especially if the cost is higher. Becausemany women’s diets in developing countries are low inomega-3 fatty acids, and also because milk consump-tion is often minimal, it may be more appropriate todevelop products containing these ingredients tobenefit the mother and subsequently her offspring.
Iron, zinc, copper, iodine, selenium, vitamins A, D,E, C, B1, B2, B6, B12, folic acid, niacin and pantothenicacid are important nutrients for both fortified bever-ages and supplemental foods. Calcium, phosphorus,potassium, magnesium and manganese may havenegative impacts on organoleptic properties, butthese nutrients are important and may be needed ifmissing in local diets. Calcium has been shown toreduce the risk of pre-eclampsia and maternal mor-tality (Hofmeyr et al. 2011). The fortification levelsused previously were generally between 50–100% ofthe RNI. Decisions on nutrients to include and theirlevels should be based on the dietary intake of the
target population and the characteristics of theproduct.
When both maternal nutritional status improve-ments and birth outcome improvements are theprimary outcomes of a programme, fortified foodsupplements are preferable to beverages containingonly MMN.
Products containing milk and oils higher in omega-3fatty acids such as soy or canola oil showed morebeneficial impacts, but further studies are needed totest these specific ingredients. When food insecurity isnot an issue to be addressed, the daily energy intakefrom the product could be at the level of 100–300 kcalto avoid energy over-consumption.If food insecurity isa problem, additional energy could be added, a highpercentage (>35%) of which can come from fat. Thistype of product should include micronutrients such ascalcium, potassium, phosphorus, magnesium and man-ganese (either from the food itself or from fortificants)because they are more easily added to a food supple-ment. The level of essential fatty acids (e.g. ALAAlpha – linolenic acid) needs to be tested in food-based products (for example, the level consumed inChile was about 0.4 g daily) to achieve better effects.No DHA was used in the fortified food supplementsreported here. Based on the impacts of DHA supple-mentation studies, if DHA is used, 0.4 g DHA dailycould be a starting point for fortification; however,costs of DHA might be prohibitive.
Acknowledgements
The author would like to thank Marie ChantalMessier (Senior Nutrition Specialist, World Bank),and Jonathan Siekmann, Senior Associate, Infant andYoung Child Nutrition (GAIN), and ElizabethZehner, for their valuable review, technical input andcontributions. Support from GAIN enabled theauthor to produce the paper and make it available forthe benefit of all those working to improve maternaland infant and young child nutrition. ChineseNational High-tech R&D Program (863 programmeno. 2010AA023004) partially supported the work.
Adair L.S. & Pollitt E. (1985) Outcome of maternal nutri-tional supplementation: a comprehensive review of theBacon Chow study. The American Journal of ClinicalNutrition 41, 948–978.
Arimond M., Wiesmann D., Becquey E., Carriquiry A.,Daniels M.C., Deitchler M. et al. (2010) Simple foodgroup diversity indicators predict micronutrientadequacy of women’s diets in 5 diverse, resource-poorsettings. The Journal of Nutrition 140, 2059S–2069S.
Atton C. & Watney P.J.M. (1990) Selective supplementa-tion in pregnancy: effect on birth weight. Journal ofHuman Nutrition and Dietetics 3, 381–392.
Barber S.L. & Gertler P.J. (2008) The impact of Mexico’sconditional cash transfer programme, Oportunidades, onbirthweight. Tropical Medicine & International Health13, 1405–1414.
Bhargava A., Bouis H.E. & Scrimshaw N.S. (2001) Dietaryintakes and socioeconomic factors are associated withthe hemoglobin concentration of Bangladeshi women.The Journal of Nutrition 131, 758–764.
Black R.E., Allen L.H., Bhutta Z.A., Caulfield L.E., deOnis M., Ezzati M. et al. (2008) Maternal and childundernutrition: global and regional exposures and healthconsequences. Lancet 371, 243–260.
Briend A. (2001) Highly nutrient-dense spreads: a newapproach to delivering multiple micronutrients to high-risk groups. The British Journal of Nutrition 85 (Suppl.2), S175–S179.
Brown K.H., Rivera J.A., Bhutta Z., Gibson R.S., KingJ.C., Lonnerdal B. et al. (2004) International Zinc Nutri-tion Consultative Group (IZiNCG) technical document#1. Assessment of the risk of zinc deficiency in popula-tions and options for its control. Food and Nutrition Bul-letin 25, S99–203.
Caan B., Horgen D.M., Margen S., King J.C. & Jewell N.P.(1987) Benefits associated with WIC supplementalfeeding during the interpregnancy interval. The Ameri-can Journal of Clinical Nutrition 45, 29–41.
Ceesay S.M., Prentice A.M., Cole T.J., Foord F., WeaverL.T., Poskitt E.M. et al. (1997) Effects on birth weightand perinatal mortality of maternal dietary supplementsin rural Gambia: 5 year randomised controlled trial.BMJ 315, 786–790.
Compbell-Brown M. (1983) Protein energy supplements inprimigravid women at risk of low birth weight. Nutritionin pregnancy: Proceedings of the Tenth Study Group inthe Royal College of Obstetricians and Gynaecologists.eds Campbell, DM & Grillmer, MDG). The RoyalCollege of Obstetricians and Gynaecologists, London.
Dunstan J.A., Mori T.A., Barden A. et al. (2004) Effects ofn-3 polyunsaturated fatty acid supplementation in preg-nancy on maternal and fetal erythrocyte fatty acid
composition. European Journal of Clinical Nutrition 58(3), 429–437.
Eilander A., Hundscheid D.C., Osendarp S.J., Transler C.& Zock P.L. (2007) Effects of n-3 long chain polyunsatu-rated fatty acid supplementation on visual and cognitivedevelopment throughout childhood: a review of humanstudies. Prostaglandins, Leukotrienes, and Essential FattyAcids 76, 189–203.
Fall C., Fisher D., Osmond C. & Margetts B. (2009) Mul-tiple Micronutrient Supplementation during pregnancyin low-income countries: a meta-analysis of effects onbirth size and gestation length. Food and Nutrition Bul-letin 30 (4s), S533–S546.
Fernald L.C., Gertler P.J. & Neufeld L.M. (2008) Role ofcash in conditional cash transfer programmes for childhealth, growth, and development: an analysis of Mexi-co’s Oportunidades. Lancet 371, 828–837.
Fernald L.C., Gertler P.J. & Neufeld L.M. (2009) 10-yeareffect of Oportunidades, Mexico’s conditional cashtransfer programme, on child growth, cognition, lan-guage, and behaviour: a longitudinal follow-up study.Lancet 374, 1997–2005.
Food and Nutrition Board Institute of Medicine. (2002)Dietary Reference Intakes for Energy, Carbohydrate,Fiber, Fat, Fatty Acids, Cholesterol, Protein and AminoAcids (Macronutrients). National Academy Press:Washington, DC.
Food and Nutrition Board Institute of Medicine. (2002,2005) Dietary Reference intakes of vitamin A, vitamin K,arsenic, borun, chromium, copper, iodine, manganese,molybdenum, nickel, silicon, vanadium and zinc.National Academy Press: Washington, DC.
Girija A., Geervani P. & Rao G.N. (1984) Influence ofdietary supplementation during pregnancy on lactationperformance. Journal of Tropical Pediatrics 30, 79–83.
Haider B.A. & Bhutta Z.A. (2006) Multiple-micronutrientsupplementation for women during pregnancy. CochraneDatabase of Systematic Reviews (4), CD004905.
Helland I.B., Saugstad O.D., Smith L., et al. (2001) Similareffects on infants of n-3 and n-6 fatty acids supplementa-tion to pregnant and lactating women. Pediatrics 108 (5),e82, 1–10.
Hibbeln J.R. (2002) Seafood consumption, the DHAcontent of mothers’ milk and prevalence rates of post-partum depression: a cross-national, ecological analysisJournal of Affective Disorders 69 (1–3), 15–29.
Hoa P.T., Khan N.C., van Beusekom C., Gross R., CondeW.L. & Khoi H.D. (2005) Milk fortified with iron or ironsupplementation to improve nutritional status of preg-nant women: an intervention trial from rural Vietnam.Food and Nutrition Bulletin 26, 32–38.
Hofmeyr G.J., Lawrie T.A., Atallah A.N. & Duley L.(2011) Calcium supplementation during pregnancy forpreventing hypertensive disorders and related problems.
Cochrane Database of Systematic Reviews (2), 1–62,CD001059.
Horvath A., Koletzko B. & Szajewska H. (2007) Effect ofsupplementation of women in high-risk pregnancies withlong-chain polyunsaturated fatty acids on pregnancyoutcomes and growth measures at birth: a meta-analysisof randomized controlled trials. The British Journal ofNutrition 98 (2), 253–259.
Huybregts L., Roberfroid D., Lanou H., Menten J., MedaN., Van Camp J. et al. (2009a) Prenatal food supplemen-tation fortified with multiple micronutrients increasesbirth length: a randomized controlled trial in ruralBurkina Faso. The American Journal of Clinical Nutri-tion 90, 1593–1600.
Huybregts L.F., Roberfroid D.A., Kolsteren P.W. & VanCamp J.H. (2009b) Dietary behaviour, food and nutrientintake of pregnant women in a rural community inBurkina Faso. Maternal & Child Nutrition 5, 211–222.
Hyder S.M., Haseen F., Khan M., Schaetzel T., Jalal C.S.,Rahman M. et al. (2007) A multiple-micronutrient-fortified beverage affects hemoglobin, iron, and vitaminA status and growth in adolescent girls in rural Bang-ladesh. The Journal of Nutrition 137, 2147–2153.
Imhoff-Kunsch B., Stein A., Villalpando S., Martorell R. &Ramakrishnan U. (2009) Docosahexaenoic acid supple-mentation from mid-pregnancy through parturitioninfluenced breast milk fatty acid composition at 1 monthpost-partum in a double-blind randomized controlledtrial in Mexico. FASEB J 23, 344–345.
Jiang T., Christian P., Khatry S.K., Wu L. & West K.P., Jr(2005) Micronutrient deficiencies in early pregnancy arecommon, concurrent, and vary by season among ruralNepali pregnant women. The Journal of Nutrition 135,1106–1112.
Kaestel P., Michaelsen K.F., Aaby P. & Friis H. (2005)Effects of prenatal multimicronutrient supplements onbirth weight and perinatal mortality: a randomised, con-trolled trial in Guinea-Bissau. European Journal ofClinical Nutrition 59, 1081–1089.
Kardjati S., Kusin J.A. & De With C. (1988) Energysupplementation in the last trimester of pregnancy inEast Java: I. Effect on birthweight. British Journal ofObstetrics and Gynaecology 95, 783–794.
Kennedy E.T. & Gershoff S. (1982) Effect of WIC supple-mental feeding on hemoglobin and hematocrit of prena-tal patients. Journal of the American Dietetic Association80, 227–230.
Kennedy E.T., Gershoff S., Reed R. & Austin J.E. (1982)Evaluation of the effect of WIC supplemental feedingon birth weight. Journal of the American Dietetic Asso-ciation 80, 220–227.
Kowaleski-Jones L. & Duncan G.J. (2002) Effects of partici-pation in the WIC program on birthweight: evidencefrom the National Longitudinal Survey of Youth. Special
Supplemental Nutrition Program for Women, Infants, andChildren. American Journal of Public Health 92, 799–804.
Kramer M.S. & Kakuma R. (2003) Energy and proteinintake in pregnancy. Cochrane Database of SystematicReviews (4), CD000032.
Krauss-Etschmann S., Shadid R., Campoy C. et al. (2007)Effects of fish-oil and folate supplementation of preg-nant women on maternal and fetal plasma concentra-tions of docosahexaenoic acid and eicosapentaenoicacid: a European randomized multicenter trial. Ameri-can Journal of Clinical Nutrition 85 (5), 1392–1400.
Kusin J.A., Kardjati S., Houtkooper J.M. & Renqvist U.H.(1992) Energy supplementation during pregnancy andpostnatal growth. Lancet 340, 623–626.
Latham M.C., Ash D.M., Makola D., Tatala S.R., NdossiG.D. & Mehansho H. (2003) Efficacy trials of a micronu-trient dietary supplement in schoolchildren and preg-nant women in Tanzania. Food and Nutrition Bulletin 24,S120–S128.
Lawn J.E., Kerber K., Enweronu-Laryea C. & Cousens S.(2010) 3.6 million neonatal deaths-what is progressingand what is not? Seminars in Perinatology 34, 371–386.
Lechtig A., Habicht J.P., Delgado H., Klein R.E.,Yarbrough C. & Martorell R. (1975) Effect of foodsupplementation during pregnancy on birthweight. Pedi-atrics 56, 508–520.
Leroy J.L., Garcia-Guerra A., Garcia R., Dominguez C.,Rivera J. & Neufeld L.M. (2008) The Oportunidadesprogram increases the linear growth of children enrolledat young ages in urban Mexico. The Journal of Nutrition138, 793–798.
Makola D., Ash D.M., Tatala S.R., Latham M.C., Ndossi G.& Mehansho H. (2003) A micronutrient-fortified bever-age prevents iron deficiency, reduces anemia andimproves the hemoglobin concentration of pregnant Tan-zanian women. The Journal of Nutrition 133, 1339–1346.
Makrides M., Duley L. & Olsen S.F. (2009) Marine oil, andother prostaglandin precursor, supplementation forpregnancy uncomplicated by pre-eclampsia or intrauter-ine growth restriction. Cochrane Database of SystematicReviews (Online) (4), 1–35.
Mardones F., Urrutia M.T., Villarroel L., Rioseco A.,Castillo O., Rozowski J. et al. (2008) Effects of a dairyproduct fortified with multiple micronutrients andomega-3 fatty acids on birth weight and gestation dura-tion in pregnant Chilean women. Public Health Nutrition11, 30–40.
Mardones-Santander F., Rosso P., Stekel A., Ahumada E.,Llaguno S., Pizarro F. et al. (1988) Effect of a milk-basedfood supplement on maternal nutritional status and fetalgrowth in underweight Chilean women. The AmericanJournal of Clinical Nutrition 47, 413–419.
Martorell R., Habicht J.P. & Rivera J.A. (1995) Historyand design of the INCAP longitudinal study (1969–1977)
and its follow-up (1988–1989). The Journal of Nutrition125, 1027S–1041S.
Mora J.O., de Paredes B., Wagner M., de Navarro L.,Suescun J., Christiansen N. et al. (1979) Nutritionalsupplementation and the outcome of pregnancy. I. Birthweight. The American Journal of Clinical Nutrition 32,455–462.
Muthayya S., Dwarkanath P., Thomas T., Ramprakash S.,Mehra R., Mhaskar A. et al. (2009) The effect of fish andomega-3 LCPUFA intake on low birth weight in Indianpregnant women. European Journal of Clinical Nutrition63, 340–346.
Nesheim M.C. & Yaktine A. (2007) Seafood Choices: Balan-cing Benefits and Risk. Food and Nutrition Board, Instituteof Medicine. National Academy Press: Washington DC.
Nyuar K.B., Min Y., Ghebremeskel K., Khalil A.K.,Elbashir M.I. & Cawford M.A. (2010) Milk of northernSudanese mothers whose traditional diet is high in car-bohydrate contains low docosahexaenoic acid. Acta Pae-diatrica 99, 1824–1827.
Oken E. & Gillman M.W. (2003) Fetal origins of obesity.Obesity Research 11, 496–506.
Prentice A.M., Whitehead R.G., Roberts S.B., Paul A.A.,Watkinson M., Prentice A. et al. (1980) Dietary supple-mentation of Gambian nursing mothers and lactationalperformance. Lancet 2, 886–888.
Prentice A.M., Cole T.J., Foord F.A., Lamb W.H. & White-head R.G. (1987) Increased birthweight after prenataldietary supplementation of rural African women. TheAmerican Journal of Clinical Nutrition 46, 912–925.
Ramakrishnan U., Stein A.D., Parra-Cabrera S., Wang M.,Imhoff-Kunsch B., Juarez-Marquez S. et al. (2010).Effects of docosahexaenoic acid supplementation duringpregnancy on gestational age and size at birth: rando-mized, double-blind, placebo-controlled trial in Mexico.Food Nutrition Bulletin 31, S108-S116.
Rasmussen K.M. & Habicht J.P. (2010) Maternal supple-mentation differentially affects the mother and newborn.The Journal of Nutrition 140, 402–406.
Rivera J., Rodriguez G., shamah T., Rosado J., CasanuevaE., Maulen I. et al. (2000) Implementation, monitoring,and evaluation of the nutrition component of theMexican Social Programme (PROGRESA). Food andNutrition Bulletin 21, 35–42.
Rosado J., Rivera J., Lopez G. & Solano L. (2000) Devel-opment, production, and quality control of nutritionalsupplements for a national supplementation programmein Mexico. Food and Nutrition Bulletin 20, 30–34.
Ross S.M., Nel E. & Naeye R.L. (1985) Differing effects oflow and high bulk maternal dietary supplements duringpregnancy. Early Human Development 10, 295–302.
Rush D., Stein Z. & Susser M. (1980) A randomized con-trolled trial of prenatal nutritional supplementation inNew York City. Pediatrics 65, 683–697.
Shrimpton R., Thorne-Lyman A., Tripp A. & Tomkins A.(2009) Trends in low birthweight among the Bhutaneserefugee population in Nepal. Food and Nutrition Bulletin30, S197–S206.
Smuts C.M., Huang M., Mundy D., Plasse T., Major S. &Carlson S.E. (2003) A randomized trial of docosa-hexaenoic acid supplementation during the thirdtrimester of pregnancy. Obstetrics and Gynecology 101(3), 469–479.
Szajewska H., Horvath A. & Koletzko B. (2006) Effect ofn-3 long-chain polyunsaturated fatty acid supplementa-tion of women with low-risk pregnancies on pregnancyoutcomes and growth measures at birth: a meta-analysisof randomized controlled trials. American Journal ofClinical Nutrition 83 (6), 1337–1344.
Tartanac F. (2000) Incaparina and other Incaparina-basedfoods: experience of INCAP in Central America. Foodand Nutrition Bulletin 21, 49–54.
United Nations Children’s Fund (UNICEF) (2009) TheState of the World’s Children.
United States Department of Agriculture (USDA) (2007)Special Supplemental Nutrition Program for Women,Infants and Children (WIC): revisions in the WIC FoodPackages; Interim Rule. Washington, DC. Http://www.fns.usda.gov/wic/regspublished/foodpackages-interimrule.htm.
van Steenbergen W.M., Kusin J.A., Kardjati S. & de WithC. (1989) Energy supplementation in the last trimesterof pregnancy in East Java, Indonesia: effect on breast-milk output. The American Journal of Clinical Nutrition50, 274–279.
Viegas O.A., Scott P.H., Cole T.J., Eaton P., Needham P.G.& Wharton B.A. (1982a) Dietary protein energysupplementation of pregnant Asian mothers at Sorrento,Birmingham. II: selective during third trimester only.British Medical Journal (Clinical Research Ed.) 285,592–595.
Viegas O.A., Scott P.H., Cole T.J., Mansfield H.N., WhartonP. & Wharton B.A. (1982b) Dietary protein energysupplementation of pregnant Asian mothers at Sorrento,Birmingham. I: unselective during second and third tri-mesters. British Medical Journal (Clinical Research Ed.)285, 589–592.
Villar J. & Rivera J. (1988) Nutritional supplementationduring two consecutive pregnancies and the interimlactation period: effect on birth weight. Pediatrics 81,51–57.
World Health Organisation and Food and AgricultureOrganisation. (2004) Vitamin and mineral requirementsin human nutrition, Second edition. Geneva.
Yakes E.A. (2010) Polyunsaturated fatty acid intake andstatus of breast fed and non-breast fed Bangladeshi chil-dren 24–47 months of age. In: Epidemiology. Universityof California, Davis: Davis, CA.
Essential fats: how do they affect growth anddevelopment of infants and young children indeveloping countries? A literature reviewmcn_356 44..65
Sandra L. Huffman*, Rajwinder K. Harika†, Ans Eilander† and Saskia J.M. Osendarp†‡
*Department of Nutrition and Program in International and Community Nutrition, University of California Davis, Davis, California, USA, †Unilever Researchand Development, Vlaardingen, the Netherlands, and ‡Division of Human Nutrition, Wageningen University, Wageningen, the Netherlands
Abstract
Omega-3 and omega-6 fatty acids, particularly docosahexaenoic acid (DHA), are known to play an essential rolein the development of the brain and retina. Intakes in pregnancy and early life affect growth and cognitiveperformance later in childhood. However, total fat intake, alpha-linolenic acid (ALA) and DHA intakes areoften low among pregnant and lactating women, infants and young children in developing countries. As breastmilk is one of the best sources of ALA and DHA, breastfed infants are less likely to be at risk of insufficientintakes than those not breastfed. Enhancing intake of ALA through plant food products (soy beans and oil,canola oil, and foods containing these products such as lipid-based nutrient supplements) has been shown to befeasible. However, because of the low conversion rates of ALA to DHA, it may be more efficient to increaseDHA status through increasing fish consumption or DHA fortification, but these approaches may be morecostly. In addition, breastfeeding up to 2 years and beyond is recommended to ensure an adequate essential fatintake in early life. Data from developing countries have shown that a higher omega-3 fatty acid intake orsupplementation during pregnancy may result in small improvements in birthweight, length and gestational agebased on two randomized controlled trials and one cross-sectional study. More rigorous randomized controlledtrials are needed to confirm this effect. Limited data from developing countries suggest that ALA or DHAsupplementation during lactation and in infants may be beneficial for growth and development of young children6–24 months of age in these settings.These benefits are more pronounced in undernourished children. However,there is no evidence for improvements in growth following omega-3 fatty acid supplementation in children >2years of age.
Keywords: essential fatty acids, omega-3 and omega-6 fatty acids, growth, development, ALA, DHA, developingcountries.
Correspondence: Sandra Huffman, Department of Nutrition, University of California, Davis, One Shields Ave., Davis, CA 95616, USA.E-mail: [email protected]
Introduction
The omega-3 fatty acid alpha-linolenic acid (ALA)and the omega-6 fatty acid linoleic acid (LA) areessential fatty acids (EFAs) as they can not be pro-duced by the human body. Oil/seeds that contain thelargest amounts of ALA include flaxseed, walnut,
beechnut, butternuts, chia seeds, canola and soy. Oilssuch as corn, sunflower, palm and peanut oil are highin LA but low in ALA. Meat is also a good source ofALA and LA (Institute of Medicine 2005).
The omega-6 fatty acid LA can be converted intolonger chain metabolites, including arachidonic acid(AA) and the omega-3 fatty acid ALA can be
converted into eicosapentaenoic acid (EPA) anddocosahexaenoic acid (DHA) (see Fig. 1 for an over-view of this process). However, the conversion ratesare low with a range from 1% to 10% (Emken et al.1994; Salem, Jr. et al. 1999; Vermunt et al. 1999;Pawlosky et al. 2001; Brenna 2002) and may differdepending on common polymorphisms in the fattyacid desaturase (FADS) gene cluster which enables
some individuals to form more EPA, DHA and AAfrom ALA and LA than others (Lattka et al. 2010a,b).Conversion rates are lower in infants (especially pre-mature infants) than adults and there is accumulatingevidence that in early life, precursors are not suffi-ciently converted to DHA to allow for biochemicaland functional normality (Uauy & Castillo 2003; Innis2007b; Uauy & Dangour 2009).
Key messages
• Omega-3 and omega-6 fatty acids play an important role in growth and development of infants and youngchildren in developing and emerging countries.
• Overall, intakes of fat and omega-3 fatty acids appear to be low among many pregnant and lactating women,and non-breastfed infants. Most complementary foods are low in omega-3 fatty acids, and thus young childrenin developing countries are at risk of low intakes.
• Ensuring adequate intakes of fat, essential fatty acids and especially DHA through these life stages is crucial.• Cost effective dietary sources of these fatty acids and exclusive breastfeeding until 6 months of age, and
continued breastfeeding thereafter, in addition to appropriate complementary feeding are needed to ensureadequate essential fatty acid and DHA intakes in these populations.
• Information is severely lacking on essential fatty acid intake and status in developing countries, and data shouldbe collected from large-scale studies such as the Demographic and Health surveys or other nationallyrepresentative samples.
• In addition, more research is required to confirm the beneficial role of these essential fatty acids from dietsor from supplements in growth and development of infants and young children in developing countries.
Omega-6Omega-3
α-Linolenic acid (ALA)18:3 n-3
Linoleic acid (LA)18:2 n-6
Eicosapentaenoic acid (EPA)20:5 n-3
Docosahexaenoic acid (DHA)22:6 n-3
Arachidonic acid (AA)20:4 n-6
Sunflower, safflower, corn, soybean, peanut and palm oil
Meat, poultry,eggs
Flaxseed, canola, soybean oil
Fatty fish, animal sources,algae
Polyunsaturated fatty acids
(PUFA)
Essentialfatty acids(EFA)
Fig. 1. Classification of fatty acids.
Essential fatty acids for growth and development 45
There is currently no general agreement as towhether EPA + DHA and AA are essential in thediet. Only animal products and algae contain DHAand EPA, and fatty fish (tuna, salmon, fish oils), eggsand algae are good sources. Breast milk contains LA,ALA, DHA and EPA although the amounts dependon the mother’s diet and fat stores (Brenna et al. 2007;Peng et al. 2009). Cow’s milk contains no DHA orEPA, and is low in ALA and LA. AA can be found inmeat, poultry and eggs (Institute of Medicine 2005).
Populations consuming low amounts or no animalfoods will depend to a large extent or completely onthe synthesis of EPA + DHA and AA by the humanbody. This situation applies to many people living indeveloping countries, who cannot afford significantquantities of animal foods. Sufficient intakes of LAand ALA are needed, but when energy (especiallyfat) intakes are low, LA and ALA would be preferen-tially used for energy expenditure rather than conver-sion to AA and EPA + DHA (Food and NutritionBoard 2007). Thus, a combination of low intakes ofanimal foods, total fat and insufficient energy resultsin developing country populations being more at riskof inadequate EFA intake.
Furthermore, iron, zinc, vitamin B6 and vitamin Eare required for the conversion of ALA and LA toEPA + DHA and AA through their role in elongationenzymes (Smuts et al. 1994). Therefore, it is possiblethat micronutrient deficient populations may have alower conversion rate than well-nourished popula-tions and may therefore have a lower status ofEPA + DHA and AA (Smuts et al. 1994).
EFAs (LA and ALA) and their long-chain deriva-tives (EPA, DHA and AA) are important for numer-ous physiological and developmental needs ofhumans. For example, the brain is composed of largeamounts of both DHA and AA. During the thirdtrimester of pregnancy and first year of life, the braingrows rapidly and an adequate supply of both of thesefatty acids is thought to be essential for optimal devel-opment (Innis 2007a; Hoffman et al. 2009). DHA isalso a major component of the retina and thus affectsvisual acuity (Hoffman et al. 2009). AA and DHA arevital structural elements of cell membranes and,therefore, instrumental in the formation of newtissues. In addition, PUFAs affect growth through
their role in synthesis of prostaglandins, growth hor-mones and biosynthesis of membrane components(Gurr 1992; Root 1992). A clinical deficiency of ALAor LA results in neurological abnormalities and poorgrowth (Institute of Medicine 2005).
Emerging evidence is suggestive of other possiblebenefits of omega-3 fatty acids during pregnancy,including a possible role in prevention of pregnancycomplications such as pre-eclampsia and maternaldepression. A prospective study in Pune, India com-pared pre-eclamptic women with normotensivewomen recruited after 35 weeks gestation and foundplasma DHA and plasma and RBC total omega-3 FAlevels to be significantly lower in the pre-eclampticgroup, while omega-6 FA were higher (Mehendaleet al. 2008). Observational studies in both developedand developing countries indicate a likely relation-ship between DHA levels (as measured in breastmilk) and postpartum depression, with lower levels ofDHA associated with higher rates of postpartumdepression (Hibbeln 2002). Maternal depression canimpact maternal care-giving abilities and affectgrowth through inadequate feeding practices anddevelopment through poor interpersonal interactions(Patel et al. 2004).
In addition, there is emerging evidence thatomega-3 fatty acid intakes in pregnancy and early lifemay play a role in prevention of diseases mediated byeicosanoids (van Eijsden et al. 2008; Hauner et al.2009). In particular EFA intakes are thought tomodify low-density lipoproteins (LDL) cholesterolconcentrations in childhood (Ohlund et al. 2008).Most of the data, however, came from observations indeveloped countries and in formula fed infants andlittle is known about the public health relevance ofthese fatty acids for infants in developing countries,especially those who still receive breast milk.
This paper reviews the literature on omega-3 andomega-6 fatty acid intake and status in pregnant andlactating women and infants and young children indeveloping countries and evaluates the effects ofthese fatty acids on growth and development ofinfants and children in these countries. The findingsare compared with those of studies in developedcountries. A recent supplement to this journalreported on papers presented at a meeting on fatty
acids in developing countries (Dewey & Reinhart2011).
Methods
For identification of studies, we searched the litera-ture databases of Web of Science (Institute for Scien-tific Information) and PubMed (omega 3 fatty acidsOR essential fatty acids OR DHA OR docosa-hexaenoic acid OR long-chain polyunsaturated fattyacid OR n-3 fatty acid OR arachidonic acid OR lino-lenic acid OR linoleic acid AND child developmentOR infant development OR child growth OR infantgrowth). The search was limited to human studiespublished in English from January 2000 until August2010. The search first identified meta-analyses andclinical trials, but was expanded to include other rel-evant articles (such as observational studies andreview articles). Reference lists of the publicationsfound were also searched. From these lists, articlesthat were conducted in developing countries wereselected for inclusion in this review.
We adopted the income definition of developingcountries used by The World Bank to include coun-tries in the review. The definition includes all coun-tries having an annual gross national income (GNI)per capita equivalent to US$ 12 195 or less; thesecountries include low-income countries (GNI percapita up to US$ 995), lower middle-income countries(GNI per capita from US$996–$3 945) and uppermiddle-income countries (GNI per capita fromUS$3946 to $12 195) (World Bank 2010).
Recommended fatty acids intake forpregnant, lactating women, infantsand children
The minimum intake levels for EFAs to preventdeficiency symptoms are estimated with convincingevidence from human and animal studies at level tobe 2.5%E LA plus 0.5%E ALA (FAO 2010). Theadequate intake (AI) is a recommended averagedaily nutrient intake level based on observed orexperimentally determined approximations or esti-mates of nutrient intake by group (or groups) ofapparently healthy people who are assumed to be
maintaining an adequate nutritional state. Examplesof adequate nutritional states include normalgrowth, maintenance of normal levels of nutrients inplasma and other aspects of nutritional well-being orgeneral health. When an RDA is not available for anutrient, the AI can be used as the guide for an indi-vidual’s intake (Institute of Medicine 2005). An AIfor LA of 2–3%E and ALA of >0.5%E is proposedfor the general population of adults by Food andAgriculture Organization (FAO), with an acceptablemacronutrient distribution range (AMDR) for LAintake of 2.5–9%E and omega-3 PUFA of 0.5–2%E.For infants 6 to 12 months of and young children12–24 months of age, an AI for LA range of 3.0–4.5%E is recommended with a (upper) U-AMDR of<10%E. Similarly for ALA an AI range of 0.4–0.6%E is recommended with (upper) U-AMDR of<3%E (FAO 2010).
Table 1 gives AI for ALA and LA from FAO (2010)and from the Institute of Medicine (2005). Recom-mended levels of DHA in pregnancy are shown fromFAO (2010) (Brenna & Lapillonne 2009) and theEuropean Consensus Group (Koletzko et al. 2007).For pregnant and lactating women, the minimumintake for fetal and infant development is 300 mg/dayEPA + DHA, of which at least 200 mg day-1 should beDHA (FAO 2010). For infants, recommendations foromega-3 and omega-6 intakes are based on the com-position of human milk, under the provision that after6 months, human milk meets half of the daily energyneeds (FAO 2010).
For assessment of the effects of EFAs and omega-3fatty acids and child growth and development indeveloping countries, we divided the literature intofour topics:
1. Dietary intake and status of total fat, LA, ALAand DHA in pregnancy, lactation, infants and youngchildren in developing countries.2. Fatty acids intake during pregnancy and effects oninfant growth and development.3. Fatty acids intake during lactation and effects oninfant growth and development.4. Supplementation of infants (0–24 months ofage) with fatty acids and effects on growth anddevelopment.
Essential fatty acids for growth and development 47
5. Supplementation of children >2 years of age withfatty acids and effects on growth and development.
Results
Dietary intake and status of total fat, LA,ALAand DHA in pregnancy, lactation, infants andyoung children in developing countries
Dietary intake of total fat and fatty acids in pregnancyand lactation
A range of 20–35% energy as total fat during preg-nancy and lactation has been suggested by FAO(Brenna et al. 2007; FAO). Intake data on total fat inpregnant women were found from six developingcountries namely Bangladesh, Burkina Faso, Chile,China, India and Mexico (Table 2). In all these coun-tries, total fat intakes were within the AMDRs inpregnant and lactating women in studies in Chile,China, India and Mexico but not in Bangladesh,Burkina Faso and Sudan. In these countries, pregnantand lactating women consumed diets with only7.6%E (Yakes 2010), 12.7%E (Huybregts et al.2009) and 18.5 E% (Nyuar et al. 2010) of total fat,respectively.
In studies in India (Muthayya et al. 2009a), Chile(Mardones et al. 2008), Mexico (Parra-Cabrera et al.2010), Sudan (Nyuar et al. 2010), Bangladesh (Yakes2010), among pregnant or lactating women, meanintakes of ALA just met or were lower than the AI(Table 2). In contrast, LA intakes exceeded the AI inmost countries except Bangladesh (Table 2). In Bang-ladesh, 57% of the women had intakes of LA belowthe AI and 90% had ALA below the AI (Yakes 2010).The low intake of ALA in certain populations andhigh intakes of LA compared with the AI may be inpart due to consumption of oils in local diets that arehigh in LA but low in ALA such as corn, safflower,sunflower oil and to some extent peanut, palm kerneland coconut oil (Wolmarans 2009).
The lowest DHA intakes were reported in India inthe third trimester of pregnancy at only 11 mg (Muth-ayya et al. 2009a) and in Bangladesh, DHA intake wasonly 30 mg per day (Table 2). All reported levels aresubstantially less than the FAO (Brenna et al. 2007;FAO 2010) recommends and European Consensus Ta
ble
2.M
ean
(sta
ndar
dde
viat
ion)
Inta
keof
tota
lfat
,LA
,ALA
and
DH
Ain
take
inpr
egna
ntan
dla
ctat
ing
wom
en
Cou
ntri
esG
roup
Tota
lfat
inta
ke(%
E)
LA
inta
ke(%
E)
AL
Ain
take
(%E
)D
HA
inta
ke(m
g)
Rec
omm
ende
dFA
O(2
010)
20–3
5%E
2–3%
E>0
.5%
E20
0m
g
Chi
na(P
eng
etal
.200
9)L
acta
ting
wom
en(i
nlan
dci
ty)
38.7
�12
.2%
E13
�5.
1%E
1.5
�0.
6%E
40�
60m
gL
acta
ting
wom
en(c
oast
alci
ty)
31.8
�12
.3%
E9.
4�
3.5%
E1.
1�
0.5%
E18
0�
230
mg
Chi
le(M
ardo
nes
etal
.200
8)P
regn
ant
wom
en(c
ontr
olgr
oup)
25.6
�8.
9%E
6.5
�2.
7%E
0.22
�0.
1%E
Ban
glad
esh*
(Yak
es20
10)
Lac
tati
ngw
omen
7.6
(4.4
–11.
8)%
E1.
9(0
.9–3
.5)%
E0.
3(0
.1–0
.5)%
E30
(10–
50)
mg
Bur
kina
Faso
(Huy
breg
tset
al.2
009)
Rur
alpr
egna
nt12
.7%
EN
AN
AN
AIn
dia†
(Mut
hayy
aet
al.2
009a
)P
regn
ant
wom
en(3
rdtr
imes
ter)
24.3
%E
6.1
(4.7
–8.1
1)%
E0.
24(0
.2–0
.3)%
E11
(4–1
9)m
gM
exic
o*(P
arra
-Cab
rera
etal
.201
0)P
regn
ant
wom
en25
.9%
E4.
9�
2.3%
E0.
44�
0.2%
E80
�80
mg
Suda
n(N
yuar
etal
.201
0)L
acta
ting
wom
en18
.5�
4.4%
E4.
0�
1.2%
E0.
5�
0.2%
E33
�78
mg
AL
A,a
lpha
-lin
olen
icac
id;D
HA
,doc
osah
exae
noic
acid
;FA
O,F
ood
and
Agr
icul
ture
Org
aniz
atio
n;L
A,l
inol
eic
acid
;NA
,not
avai
labl
e.*M
ean
(5th
-95t
hpe
rcen
tile
);†M
edia
n(i
nter
quar
tile
rang
e).
Essential fatty acids for growth and development 49
(Koletzko et al. 2007) recommended amounts of200 mg of DHA in pregnancy.
DHA status data in lactation
Breast milk DHA levels are one means of assessingessential fat status in lactating women. Breast milkDHA content has been associated with favourableinfant outcomes: Innis (2007c) reports that maternalintakes of DHA � 80 mg day-1 and milk levels <0.2 gDHA/100 g total fatty acids (0.2%) increases the riskof not supporting optimal infant development (Innis2007c).
The mean concentration of DHA in breast milk isquite variable in developing countries with data.Some developing countries such as Sudan 0.23%E(Nyuar et al. 2010), Nepal 0.23%E (Glew et al. 2001),Bangladesh 0.30%E (Yakes 2010) and Mexico(0.26 � 0.03) (Yuhas et al. 2006) have reported someof the lower levels of DHA in breast milk whereasPhilippines (0.74 � 0.05), a coastal area of southeast-ern China (0.61 � 0.46%E) (Peng et al. 2009), Cuba(0.43 � 0.26) (Krasevec et al. 2002) and Chile(0.43 � 0.03) (Yuhas et al. 2006) have reported higherDHA status of breast milk than several developedWestern countries (Brenna et al. 2007) other thanJapan (Yuhas et al. 2006).
The large range of DHA content in breast milk isthought to reflect mainly the variations in maternalDHA intake, as populations with high fish intakes alsohave the highest milk DHA content as is seen from acomparison of intakes in a study of women living inan inland (0.38 � 0.23%E) or coastal area (0.61 �
0.46%E) of southeastern China (Peng et al. 2009). InCongo where fish intake is high and the usual oilconsumed is soy oil, which is rich in ALA (Rocquelinet al. 1998), breast milk contained a higher DHAcontent (0.15 � 0.07 vs. 0.08 � 0.05 g/100 g) than inBurkina Faso,where fish intake is low and the major oilsources are peanut and cotton seed oil, which are bothlow in ALA (Thiombiano-Coulibaly et al. 2003).
Overall, more information is needed on fatty acidsintake and status in pregnant and lactating womenfrom developing countries. LA intakes were generallyhigher than the AI in countries where reported exceptBangladesh, whereas ALA intake is below the AI in
all countries. Mean DHA intakes are less than recom-mended for optimal fetal development in pregnantwomen in all studies found. Milk DHA contents inmost countries were at the low end, but were greaterthan 0.2%-the cutoff associated with suboptimalinfant development.
Dietary intake of total fat and fatty acids in infants andchildren (0–10 years)
Dietary intake data of total fat and individual fattyacids in infants and young children were found in fivecountries. Total fat intakes in infants and young chil-dren in many developing countries, especially ininfants who are not breastfed, are lower than theminimum recommended of 35%E at 6–24 months ofage (Table 3). In Bangladesh, intakes were extremelylow at 19.5%E in breastfed and only 12.7% in non-breastfed children at 24–35 months of age (Yakes2010) whereas in children of 1–3 years of age in ruralareas from Yunnan Province China, mean fat intakewas 24 � 7%E (Barbarich et al. 2006). In the Gambia,fat intake decreased from 46.2%E at 0–6 months(when most energy came from breast milk) to34.4%E at 7–11 months, 27.5%E at 12–17 months andonly 15%E when breastfeeding had stopped in mostchildren at 24 months (Prentice & Paul 2000). In olderchildren (2–10 years) total fat intake ranged from24.5% to 29.6%E in Guatemala and South Africa.
Mean LA intakes were lower than the AI in Bang-ladeshi (non-breast fed) children and Chinese chil-dren (1–3 years). In other developing countries withdata, children had mean LA intakes in the range of3.1–6.2%E. Mean ALA intakes were lower than AI inBangladeshi, Gambian and South African children. InYunnan, China, ALA intake among children 1–3years of age for about 50% of children did not meetthe AI (Barbarich et al. 2006). In rural Bangladesh,intakes of fatty acids among children 24–35 months ofage were only reported in comparison with the Insti-tute of Medicine (IOM) levels, and were approxi-mately half of the IOM AI; 89.8% of these childrenhad intakes of ALA less than the IOM AI of 700 mgday-1 for 1- to 3-year-old children, and 99.0% hadintakes of LA less than the AI of 7 g day-1 for 1–3-year-olds. In the Gambia, levels of ALA and DHA
intake decreased as the child aged. In Mangaung(South Africa) the mean omega-6 intake ranged from5.4% to 6.5%E and omega-3 ranged from 0.2% to0.4%E in 2–6-year-old children (Dannhauser et al.2000). Large proportions of 8–10 years old Guatema-lan children had normal intakes of LA (5.3 � 0.12-5.9 � 0.14%E) in both high and low socioeconomicstatus whereas ALA intakes (0.5 � 0.01%E) werelow with >97% of all groups consuming less than1%E from these fats and about 50% consuming lessthan FAO AI �0.5%E. Furthermore, intakes for EPA(8 � 2-10 � 2 mg) and DHA (32 � 2 mg) were verylow with no differences between high and low socio-economic status groups (Bermudez et al. 2010).
In summary, in most developing countries with dataavailable, mean intakes of ALA and DHA are verylow and in two out of five countries with data avail-able, mean LA intakes were below the AI.
Fatty acid status data in infants and children
Only two studies reported status data in infants andchildren from developing countries. Low DHA levelsin RBC were reported in Pakistani infants in relationto the low DHA content in maternal milk (Smit et al.2000). In an intervention study, baseline fatty acidsstatus in 6 month-old Cambodian and Italian infantswere compared. Cambodian infants had lower base-line levels of LA, comparable ALA levels and higherlevels of AA + EPA + DHA in blood compared withtheir Italian counterparts (Agostoni et al. 2007). Sub-sequent multiple micronutrient supplementation inthose Cambodian infants resulted in significantlyhigher levels of ALA in whole blood samples(0.29 � 0.31%, 0.22 � 0.10%, 0.20 � 0.12% of totalfatty acids) and LA (15.36 � 4.02%, 14.45 � 2.90%,13.87 � 2.45% of total fatty acids) at 18 months ofage, compared with infants in the other interventiongroups who received only iron–folic acid or placebo,respectively.
Fatty acids intake during pregnancy and effectson infant growth and development
There is a strong positive correlation of EFAs andAA + DHA serum concentrations of newborn babies
and their mothers. The relative (per kilogram of bodyweight) status is higher in newborns than in mothers,suggesting a strong fetal and neonatal preference andneed for these fatty acids. In preterm neonates, DHAstatus is positively related to parameters of fetalgrowth, such as birthweight, head circumference andbirth length.
We found five studies from developing countries onthe relationship between intake of fatty acids duringpregnancy and growth and development outcomes ofthe offspring. Two of these studies were cross-sectional studies (Parra-Cabrera et al. 2008; Muthayyaet al. 2009a) and three were randomized controlledtrials (RCTs; Tofail et al. 2006; Mardones et al. 2008;Ramakrishnan et al., 2010) (Table 4). A significantpositive correlation between EPA/DHA intake andbirthweight was shown in a study in India. The studyfrom India (Muthayya et al. 2009a) (Table 4),reported a significantly increased adjusted odds ratioof risk of low birthweight for women whose fishintake was in the lowest tertile in third trimester com-pared with those in the highest tertile but no differ-ence in gestational duration. In the intervention studyin low-income women in Chile (Mardones et al. 2008),increases in birthweight (65 g) and birth length(0.37 cm) were observed after ~30 weeks supplemen-tation. However, compared with the control group,these women also received a higher dose of micronu-trients together with omega-3 fatty acids, which mayhave contributed to the effect. On-treatment analysisin the study in Chile, found even higher birthweight(118 g), birth length (0.57 cm) and head circumfer-ence (0.20 cm) in women in the intervention groupcompared with women in the control group. In addi-tion, women in the intervention group also haddecreases in very preterm deliveries (2.1% vs. 0.4%,P = 0.02) and marginal decreases in pre-eclampsia(3.4% vs. 1.6%, P = 0.083) compared with controlwomen. The national food distribution program forlow-income pregnant women in Chile now includesmilk fortified with ALA. In Mexico Ramakrishnanet al. (Ramakrishnan et al., 2010) assessed the impactof DHA supplementation (400 mg day-1) during preg-nancy on infant growth and development through arandomized controlled intervention trial. Overall, noeffect was found on growth outcomes; however,
among a subgroup of primiparas, birthweight signifi-cantly increased by 99.4 g and length by 0.5 cm amongsupplemented women.
However, an intervention trial in Bangladesh didnot show an impact of fish-oil supplementation onbirthweight (Tofail et al. 2006) and similarly, inMexico no impact of DHA supplementation on birth-weight was observed in the general population(Ramakrishnan et al. 2010).
Impact of DHA or DHA + EPA intakes or supple-mentation of pregnant women on developmental out-comes of the offspring were reported by only oneobservational study from Mexico (Parra-Cabreraet al. 2008) and one randomized controlled interven-tion trial in Bangladesh (Tofail et al. 2006). Higherintakes of AA but not DHA were associated withimprovements on brainstem auditory-evoked poten-tials in infants in Mexico (Parra-Cabrera et al. 2008),whereas no effects were found on infant developmentin Bangladesh following supplementation of theirmothers during pregnancy (Tofail et al. 2006).
In summary, data from three out of five studiesfrom developing countries suggest that a higher EPA/DHA intake or ALA supplementation during preg-nancy may result in small improvements inbirthweight and length, and gestational duration.Only two studies evaluated the impact on develop-mental outcomes with mixed results.
In contrast, a number of observational studies indeveloped countries show a significant positive asso-ciation of fish consumption during pregnancy andbirthweight (Olsen et al. 1993; van Eijsden et al.2008) and visual and cognitive development of terminfants and children (Daniels et al. 2004; Oken et al.2005; Hibbeln et al. 2007). Also, RCTs from devel-oped countries have shown that supplementationwith DHA/EPA during pregnancy results in amodest increase in head circumference at birth (Sza-jewska et al. 2006) but not in birthweight and length.Moreover, a recent review of RCTs on omega-3fatty acids supplementation in pregnant and lactat-ing women, infants and children concluded thatthere is limited but suggestive evidence for a benefi-cial effect on visual development, and mental devel-opment and longer-term cognition in infants(Eilander et al. 2007).
To conclude, data from developing countriessuggest that ALA or EPA + DHA intake/supplementation during pregnancy may improvebirth length and weight and gestational age, but morerigorous RCTs would be needed to confirm thiseffect. The data from developing countries for devel-opmental outcomes is currently too limited to draw afirm conclusion.
Fatty acid intake during lactation and effects oninfant growth and development
Only three cross-sectional studies were found onbreast milk levels of omega-3 fatty acids and func-tional outcomes in infants (Table 5).An observationalstudy from Brazil in preterm infants found that breastmilk total omega-3 fatty acids were positively associ-ated with growth in children (Tinoco et al. 2009).Krasevec et al. found no relationship between breastmilk DHA with visual acuity or growth in Cubaninfants perhaps because DHA in breast milk washigher than found in many developed countries andthe teller acuity cards may not have been sensitiveenough to detect differences in visual acuity(Krasevec et al. 2002). Rocquelin et al. (2003) foundthat breast milk fatty acids were significantly associ-ated with weight of infants in Congo but not inBurkina Faso (Rocquelin et al. 2003). The amounts ofboth ALA and DHA in breast milk in the Congowere twice that seen in Burkina Faso.
Studies in developed countries showed impacts ofDHA supplementation in breastfeeding mothers oncognitive outcome (Jensen et al. 2005) and visualacuity of their infants (Innis 2007a).Three RCTs haveassessed the effect of supplementing lactatingmothers with DHA, on cognitive development oftheir children (Gibson et al. 1997; Jensen et al. 2005;Helland et al. 2008). These three studies found posi-tive outcomes on cognition among children in thesupplemented group compared with control.However, in one study, which included supplementa-tion during pregnancy and lactation, these beneficialoutcomes did not sustain in a longer-term follow-up at7 years of age (Helland et al. 2008).
In conclusion, limited data from developing anddeveloped countries suggest that DHA concentration
in breast milk or DHA supplementation during lac-tation might be linked to improved infant growth andpsychomotor and cognitive development.
Supplementation of infants (0–24 months of age)with fatty acids and effects on growthand development
Five intervention studies were found in infants mea-suring growth and development outcomes (Table 6).Four studies (Unay et al. 2004; Adu-Afarwuah et al.2007; El-khayat et al. 2007; Chen et al. 2010) showedpositive effects of fatty acid interventions on growthand/or development, although in one of these studies(in China) (Chen et al. 2010), this effect could alsohave been attributed to the additional micronutrientsprovided. In contrast, another study in China (Benet al. 2004) did not find a significant difference ingrowth or development. Adu-Afarwuah reportedimprovements in growth and motor development inGhanaian infants (6–12 months) in the interventiongroup with a fat-based spread (Adu-Afarwuah et al.2007). This fat-based spread provided LA (1.29 g/20 g) and ALA (0.29 g/20 g) whereas no effects ongrowth were observed in the other two interventiongroups that only provided micronutrients. Theauthors speculated that other than energy, the differ-ent effects on growth could be explained by a signifi-cantly greater plasma ALA concentration in the fat-based spread group (Adu-Afarwuah et al. 2007) andperhaps the addition of milk in the spread. For devel-opment (motor milestone), all interventions showedimprovement with greater improvements in the fat-based spread compared with control.
A study from Pakistan in protein energy malnour-ished infants (11.28+/-4.59 months) showed essentialfat supplementation to positively impact both plasmaAA and DHA levels as well as mental developmentindex and psychomotor development index scores (El-khayat et al. 2007).An RCT in Turkey found improve-ments in brainstem auditory evoked potentials inbreastfed new born healthy infants and those receivinginfant formula with DHA compared with those receiv-ing infant formula without DHA (Unay et al. 2004).
A study in China found improvements in motordevelopment and growth among children 4–12
months of age in the study group receiving fortifiedwhole fat soybean flour (high in ALA and fortifiedwith five additional micronutrients) compared withunfortified rice flour (Chen et al. 2010).
Another study from China compared infants fromfour feeding groups: (1) AA + DHA supplementedformula; (2) standard formula; (3) breast milk; and (4)breast milk + supplemented formula. No significantdifferences were found for growth and developmentbetween the four feeding groups (Ben et al. 2004).
Overall, four out of five studies among infants andyoung children from developing countries showedimproved growth and/or visual or motor developmentafter supplementation with EFAs and DHA + AA.However, in two of these studies (Chen et al. 2010;Adu-Afarwuah et al. 2008), the beneficial effects mayhave been in part due to the additional micronutrientsor protein that were provided together with the ALA.
Studies from developed countries have alsoreported positive effects of essential fat supplementa-tion on visual acuity (Birch et al. 2002; Hoffman et al.2003) and cognitive development in infants (Agostoniet al. 1995; Drover et al. 2009). A review from 2005showed no effect of dietary ALA enrichment on terminfant growth except at 12 months of age whereinfants consuming ALA-enriched formula wereheavier and longer compared with control infants(Udell et al. 2005). On the other hand, no beneficialeffects of DHA + AA supplementation of formula-milk on the physical (weight, length, head circumfer-ence), visual and neurodevelopmental outcomes ofinfants born at term were found in a number of meta-analyses of well-conducted RCTS from developedcountries (Lapillonne & Carlson 2001; Makrides et al.2005; Rosenfeld et al. 2009). Moreover, a recentCochrane review on DHA + AA supplementation interm infants failed to demonstrate effects on vision,various aspects of cognitive development or physicalgrowth (Simmer et al. 2008). It is suggested that highdose (100 mg DHA plus 200 mg AA) and prolongedduration (preferably 12 months) of supplementationto assess the effect of DHA + AA on cognitive devel-opment are more likely to yield positive results.
Overall, limited data from developing countriessuggest that ALA or DHA supplementation is ben-eficial for infant’s growth and development in these
settings. These benefits are more pronounced inundernourished children and apparently healthy chil-dren from low socioeconomic status where indica-tions are that intake of fatty acids at this age may below (Smit et al. 2004).
Supplementation of children >2 years of agewith fatty acids and effects on growthand development
Only three studies in older children (6–10 years) havebeen conducted in developing countries and are listedin Table 7. The 3 studies showed no effects on growthfollowing fish flour spread rich in EPA + DHA inSouth African children (Dalton et al. 2009) and EPA/DHA supplementation in school-age children fromIndonesia and India (Osendarp et al. 2007; Muthayyaet al. 2009b). These three studies also measured cog-nitive development outcomes. Only one study(Dalton et al. 2005) showed improvement of verballearning ability and memory of children when supple-mented with a fish-flour spread rich in EPA + DHAwhereas the other two studies (Osendarp et al. 2007;Muthayya et al. 2009b) showed no effect on cognitionafter EPA/DHA supplementation.
Five RCTs in healthy children from developedcountries have assessed the effect of EPA and DHAon cognitive function and one of them has also mea-sured effects on growth. One study was conducted inpreschool children aged 4 years (Ryan & Nelson2008) and the others in children aged 6–10 years(Osendarp et al. 2007; Kennedy et al. 2009; Kirby et al.2010; McNamara et al. 2010). Based on results of thesefive trials, there is little evidence for a beneficial effectof EPA + DHA on growth and cognitive function inolder children.
In conclusion, three studies in developing coun-tries suggest that there is no evidence for improve-ments in growth following omega-3 fatty acidsupplementation in children >2 years of age. This isconsistent with the findings of studies conducted indeveloped countries. For cognitive development,supplementation with lower dosages of ~100 mgEPA/DHA seemed not effective in older childrenfrom developing countries.
Discussion
Data summarized in this review suggest that omega-3fatty acids, and DHA in particular, during pregnancy,lactation and early life, may have significant benefitsfor infant growth and development in developingcountries. However, limited available dietary intakedata suggest low intakes of omega-3 fatty acids com-pared with the AI are common among young chil-dren, especially those who are no longer breastfed,and among pregnant and breastfeeding women. Inpart this is due to lower total intakes of fat and addi-tionally, due to low intakes of foods high in omega-3fatty acids, including animal products and certain oils(soy, canola).
Limited data from pregnancy trials in developingcountries suggest that supplementation or increasedintakes of DHA + EPA or DHA only during preg-nancy may result in small benefits in birth outcomessuch as weight and length, and gestational age. Thesefindings are not in agreement with overall evidencefrom RCT in developed countries, although, someobservational studies from developed countries alsoobserved positive associations between omega-3intakes and birth outcomes similar to developingcountries.
Positive birth outcomes after omega-3 fatty acidinterventions, although observed in only a limitednumber of studies, may be related to the role ofomega-3 fatty acids in cell growth and multiplication(Innis 2005), thus exerting a positive effect on weightand length of the fetus and infant. Evidence is furtheremerging that prenatal EFAs may be involved in pro-gramming of later health and development (vanEijsden et al. 2008). Currently, evidence from a limitednumber of studies suggest an association betweenmaternal omega-6 and omega-3 fatty acid status andbirthweight, length and body composition (Micallefet al. 2009) of the child during early infancy. It hasbeen hypothesized that high omega-6 to omega-3status raises tissue AA, which increases prostacyclinproduction and, in turn, stimulates signaling pathwaysimplicated in adipogenesis. However, more researchis needed to determine how these fatty acids influencebody size and body composition of fetuses andinfants.
Omega-3 fatty acids, in particular, DHA, are alsoknown to play an essential role in the development ofthe brain and retina. Observational studies fromdeveloped countries suggested positive associationsor effects of DHA status or omega-3 fatty acidsupplementation during pregnancy on improvedinfant development outcomes. However, only twostudies from developing countries assessed effects ofomega-3 fatty acids on infant development andresults were mixed. RCTs are needed to confirm thesebenefits in developing countries using validatedmethods to assess development in these settings.
Based on the limited number of studies from devel-oping countries, our review suggests the results aboutthe relationship between enhanced DHA concentra-tion of breast milk during lactation and infant growth,psychomotor and cognitive development were mixed.Unfortunately, information from intervention trialswith DHA supplementation during lactation islacking from developing countries, and therefore thecausality of this association cannot yet be confirmed.Given the importance of breast milk in the EFA andDHA intakes of the infant during the period of exclu-sive breastfeeding and beyond, such studies areurgently needed.
The large variability in breast milk fatty acidcontent may complicate the interpretation of findingsfrom these studies. Reviews have shown that theomega-3 content and especially DHA content ofbreast milk varied significantly among lactatingwomen from developing countries. In some countriessuch as Pakistan, India and rural South Africa, lactat-ing women had very low DHA intake or breast milkcontent whereas women in the Philippines, Congoand Cuba had high DHA content of breast milk.There are several factors responsible for this largerange of breast milk DHA: firstly, higher intakes fromamount consumed from fatty fish are associated withhigher maternal DHA status (Otto et al. 2000; Foodand Nutrition Board 2007). Secondly, the variability inbreast milk DHA may be related to variations in theamount of DHA synthesized in the body, and variabil-ity in status of nutrients required for DHA synthesis.Thirdly, the conversion also depends on the polymor-phism in the fatty acid desatur (FADS) gene cluster,and therefore some individuals have a higher biosyn-
thesis rate than others (Lattka et al. 2010a,b). Lastly,for indicators of EFA status, there are many signifi-cant measurement issues as there are no established‘gold standard’ methods for assessment, and eachstudy uses different assessment methods potentiallyleading to large variation.
A review of studies in infants and children up to 24months of age, omega-6 and/or omega-3 fatty acidsupplementation was found to improve growth and/orvisual or motor development in developing countries,which is in contrast to findings from meta-analysis(including well-conducted RCTS) not showing ben-eficial effects of supplementation in infants fromdeveloped countries (Simmer et al. 2008). These dif-ferential effects of supplementation, despite a seem-ingly similar EFA status, could be due to: (1) overalllower total fat and micronutrient intakes in the dietand complementary foods in the populations studied;(2) an overall disadvantaged nutritional status in thepopulations studied (Smit et al. 2004; El-khayat et al.2007; Tinoco et al. 2009); and (3) higher infection loadleading to higher EFA needs and requirements ininfants from developing countries. Furthermore,micronutrient deficiencies may contribute toimpaired EFA bioavailability and metabolism (Smitet al. 2004), and supplementation with multiple micro-nutrients (iron, folic acid, zinc and vitamins) was asso-ciated with an increase of LA and a-linolenic acidlevels in infants (Agostoni et al. 2007).
Fatty acid supplementation showed improvementin cognition or development in infants from develop-ing countries. These benefits were more pronouncedin undernourished children and apparently healthychildren from low socioeconomic status. Malnour-ished infants and children are known to have lowerdevelopment scores compared with healthy subjects(Grantham-McGregor 1995) and nutritional inter-ventions, such as supplementation with omega-3 fattyacids, may therefore more likely result in improveddevelopment scores in poorly nourished populationsas has been shown in studies from Pakistan (El-khayat et al. 2007). The importance of providing anappropriate supply of omega-3 and omega-6 fattyacids, especially DHA and AA, is likely to be relevantin early childhood in these settings because both fattyacids continue to accumulate most rapidly in brain
gray matter during the first 2 years of life (Martinez1992).
In older children above 2 years of age, no benefitsof omega-3 fatty acids were observed on growth orcognition in studies from developing countries, whichis line with findings from developed countries (Osen-darp et al. 2007; Kennedy et al. 2009; Kirby et al. 2010;McNamara et al. 2010).
Fatty acid intake and status, and in particularomega-3 and DHA status, in infants and children fromdeveloping countries varied from lower or similar oreven higher when children relied on breast milk com-pared with the fatty acid status of infants from devel-oped countries (Agostoni et al. 2007). However, whenchildren increasingly eat other foods, and correspond-ingly breast milk intake is reduced, diets of youngchildren in developing countries consequently becometoo low in fat and omega-3 fatty acids.
Recommendations
Overall, the findings from this review suggest a criticalwindow of opportunity for adequate EFA intake, andin particular ALA and DHA, intakes during preg-nancy, lactation and the period of complementaryfeeding, stressing the importance of these fatty acidsfor vulnerable populations in developing countries.
Ensuring AIs of fat and especially omega-3 fattyacids, through foods high in these nutrients is neededamong mothers and children in developing countriesto meet current recommendations. Foods made fromsoy oil, full-fat soy flour and animal products are goodsources of ALA. Promotion of exclusive breastfeed-ing and continued breastfeeding after 6 months of ageand increased intake of fatty fish or algae orsupplementation/fortification will increase DHA andEPA intake.This may be more desirable than increas-ing ALA intake, especially when energy intakes arelow, because additional ALA intake would be prefer-entially used for energy expenditure rather than con-version to EPA and DHA. However, currently costsof DHA-enriched foods or supplements are muchhigher than foods naturally high in ALA, which couldlimit the impact of such interventions.
Exclusive breastfeeding until 6 months of age, andcontinued breastfeeding should continue thereafter
until 2 years and beyond. Improving access to foodshigh in omega-3 fatty acids to improve complemen-tary feeding is needed to ensure adequate EFA andomega-3 intakes in these populations.
Acknowledgements
We would like to thank Zhenyu Yang and ElizabethZehner for their help with the collection and reviewof papers used in this paper, and Mary Arimond forextensive comments on earlier drafts.
Funding
Funding for this paper came from the Global Alliancefor Improved Nutrition (GAIN).
Conflicts of interest
RKH, AE, SJMO are employees of Unilever. Uni-lever markets food products made of vegetable oils,including margarines and dressings.
References
Adu-Afarwuah S., Lartey A., Brown K.H., Zlotkin S.,Briend A. & Dewey K.G. (2007) Randomized compari-son of 3 types of micronutrient supplements for homefortification of complementary foods in Ghana: effectson growth and motor development. The AmericanJournal of Clinical Nutrition 86, 412–420.
Adu-Afarwuah S., Lartey A., Brown K.H., Zlotkin S.,Briend A. & Dewey K.G. (2008) Home fortification ofcomplementary foods with micronutrient supplements iswell accepted and has positive effects on infant ironstatus in Ghana. American Journal of Clinical Nutrition87 (4), 929–938.
Agostoni C., Giovannini M., Sala D., Usuelli M., Livio L.,Francescato G. et al. (2007) Double-blind, placebo-controlled trial comparing effects of supplementation oftwo micronutrient sprinkles on fatty acid status in Cam-bodian infants. Journal of Pediatric Gastroenterology andNutrition 44, 136–142.
Agostoni C., Trojan S., Bellu R., Riva E. & Giovannini M.(1995) Neurodevelopmental quotient of healthy terminfants at 4 months and feeding practice: the role oflong-chain polyunsaturated fatty acids. PediatricResearch 38, 262–266.
Essential fatty acids for growth and development 61
Barbarich B.N., Willows N.D., Wang L. & Clandinin M.T.(2006) Polyunsaturated fatty acids and anthropometricindices of children in rural China. European Journal ofClinical Nutrition 60, 1100–1107.
Ben X.M., Zhou X.Y., Zhao W.H., Yu W.L., Pan W., ZhangW.L. et al. (2004) Growth and Development of terminfants fed with milk with long chain polyunsaturatedfatty acid supplementation. Chinese Medical Journal 117,1268–1270, 1–15.
Bermudez O.I., Toher C., Montenegro-Bethancourt G.,Vossenaar M., Mathias P., Doak C. et al. (2010) Dietaryintakes and food sources of fat and fatty acids in Guate-malan schoolchildren: a cross-sectional study. NutritionJournal 9, 20.
Birch E.E., Hoffman D.R., Castaneda Y.S., Fawcett S.L.,Birch D.G. & Uauy R.D. (2002) A randomized con-trolled trial of long-chain polyunsaturated fatty acidsupplementation of formula in term infants afterweaning at 6 weeks of age. The American Journal ofClinical Nutrition 75, 570–580.
Brenna J.T. (2002) Efficiency of conversion of alpha-linolenic acid to long chain n-3 fatty acids in man.Current Opinion in Clinical Nutrition and MetabolicCare 5, 127–132.
Brenna J.T. & Lapillonne A. (2009) Background paper onfat and fatty acid requirements during pregnancy andlactation. Annals of Nutrition & Metabolism 55, 97–122.
Brenna J.T., Varamini B., Jensen R.G., ersen-Schade D.A.,Boettcher J.A. & Arterburn L.M. (2007) Docosa-hexaenoic and arachidonic acid concentrations in humanbreast milk worldwide. The American Journal of ClinicalNutrition 85, 1457–1464.
Chen C.M., Wang Y.Y. & Chang S.Y. (2010) Effect ofin-home fortification of complementary feeding on intel-lectual development of Chinese children. BiomedEnviron mental Science 23 (2), 83–91.
Dalton A., Smuts C.M., Witthuhn R., Wolmarans P. &Benade A. (2005) The effect of an omega 3 fatty acid-rich spread on the cognitive function of children. S111.
Dalton A., Wolmarans P., Witthuhn R.C., van StuijvenbergM.E., Swanevelder S.A. & Smuts C.M. (2009) A ran-domised control trial in schoolchildren showed improve-ment in cognitive function after consuming a breadspread, containing fish flour from a marine source. Pros-taglandins, Leukotrienes, and Essential Fatty Acids 80,143–149.
Daniels J.L., Longnecker M.P., Rowland A.S. & Golding J.(2004) Fish intake during pregnancy and early cognitivedevelopment of offspring. Epidemiol 15, 394–402.
Dannhauser A., Bester C., Joubert G., Badenhorst P.,Slabber M., Badenhorst A. et al. (2000) Nutritionalstatus of preschool children in informal settlement areasnear Bloemfontein, South Africa. Public Health Nutri-tion 3, 303–312.
Dewey K.G. & Reinhart G. (2011) Fatty acid status inearly life in low income countries, determinants and con-sequences. Maternal & Child Nutrition 7 (Suppl. 2), 1.
Drover J., Hoffman D.R., Castaneda Y.S., Morale S.E. &Birch E.E. (2009) Three randomized controlled trials ofearly long-chain polyunsaturated Fatty Acid supplemen-tation on means-end problem solving in 9-month-olds.Child Development 80, 1376–1384.
Eilander A., Hundscheid D.C., Osendarp S.J., Transler C.& Zock P.L. (2007) Effects of n-3 long chain polyunsatu-rated fatty acid supplementation on visual and cognitivedevelopment throughout childhood: a review of humanstudies. Prostaglandins, Leukotrienes, and Essential FattyAcids 76, 189–203.
El-khayat H., Shaaban S., Emam E.K. & Elwakkad A.(2007) Cognitive functions in protein-energy malnutri-tion: in relation to long chain-polyunsaturated fattyacids. Pakistan Journal of Biological Sciences 10, 1773–1781.
Emken E.A., Adlof R.O. & Gulley R.M. (1994) Dietarylinoleic acid influences desaturation and acylation ofdeuterium-labeled linoleic and linolenic acids in youngadult males. Biochimica et Biophysica Acta 1213, 277–288.
FAO, Fats and Fatty acids in Human Nutrition, Report onan expert consultation. FAO Food Nutrition Paper 91,Rome, 2010. Available at http://foris.fao.org/preview/25553-0ece4cb94ac52f9a25af77ca5cf6a7a8c.pdf(Accessed August 4 2011).
Food and Nutrition Board (2007) Analysis of the balanc-ing of benefits and risks of seafood consumption. In:Seafood choices: balancing benefits and risks (eds M.C.Nesheim & A.L. Yaktine), pp 195–216. National Acad-emies Press: Washington, DC.
Gibson R.A., Neumann M.A. & Makrides M. (1997)Effect of increasing breast milk docosahexaenoicacid on plasma and erythrocyte phospholipid fattyacids and neural indices of exclusively breast fedinfants. European Journal of Clinical Nutrition 51, 578–584.
Glew R.H., Huang Y.S., Vander Jagt T.A., Chuang L.T.,Bhatt S.K., Magnussen M.A. & Vander Jagt D.J. (2001)Fatty acid composition of the millc lipids of Nepalesewomen: correlation between fatty acid composition ofserum phospholipidsand melting point. Prostaglandins,Leukotrienes and Essential Fatty Acids 65 (3), 147–156.
Grantham-McGregor S. (1995) A review of studiesof the effect of severe malnutrition on mentaldevelopment. The Journal of Nutrition 125, 2233S–2238S.
Gurr M.I. (1992) Role of fats in food and nutrition, 2ndedn, Elsevier applied sciences: London, UK.
Hauner H., Vollhardt C., Schneider K.T., Zimmermann A.,Schuster T. & mann-Gassner U. (2009) The impact of
nutritional fatty acids during pregnancy and lactation onearly human adipose tissue development. Rationale anddesign of the INFAT study. Annals of Nutrition &Metabolism 54, 97–103.
Helland I.B., Smith L., Blomen B., Saarem K., SaugstadO.D. & Drevon C.A. (2008) Effect of supplementingpregnant and lactating mothers with n-3 very-long-chainfatty acids on children’s IQ and body mass index at 7years of age. Pediatrics 122, e472–e479.
Hibbeln J.R. (2002) Seafood consumption, the DHAcontent of mothers’ milk and prevalence rates of post-partum depression: a cross-national, ecological analysis.Journal of Affective Disorders 69, 15–29.
Hibbeln J.R., Davis J.M., Steer C., Emmett P., Rogers I.,Williams C. et al. (2007) Maternal seafood consumptionin pregnancy and neurodevelopmental outcomes inchildhood (ALSPAC study): an observational cohortstudy. The Lancet 369, 578–585.
Hoffman D.R., Birch E.E., Castaneda Y.S., Fawcett S.L.,Wheaton D.H., Birch D.G. et al. (2003) Visual functionin breast-fed term infants weaned to formula with orwithout long-chain polyunsaturates at 4 to 6 months: Arandomized clinical trial. The Journal of Pediatrics 142,669–677.
Hoffman D.R., Boettcher J.A. & ersen-Schade D.A. (2009)Toward optimizing vision and cognition in term infantsby dietary docosahexaenoic and arachidonic acid supple-mentation: a review of randomized controlled trials.Prostaglandins, Leukotrienes, and Essential Fatty Acids81, 151–158.
Huybregts L.F., Roberfroid D.A., Kolsteren P.W. &Van Camp J.H. (2009) Dietary behaviour, food andnutrient intake of pregnant women in a rural communityin Burkina Faso. Maternal & Child Nutrition 5, 211–222.
Innis S.M. (2005) Essential fatty acid transfer and fetaldevelopment. Placenta 26 (Suppl. A), S70–S75.
Innis S.M. (2007a) Dietary (n-3) fatty acids and braindevelopment. The Journal of Nutrition 137, 855–859.
Innis S.M. (2007b) Fatty acids and early human develop-ment. Early Human Development 83, 761–766.
Innis S.M. (2007c) Human milk: maternal dietary lipidsand infant development. The Proceedings of the Nutri-tion Society 66, 397–404.
Institute of Medicine (2005) Dietary Fat: total fat and fattyacids. In: Dietary Reference intakes for energy, carbohy-drates, fiber, fat, fatty acids, cholesterol, protein and aminoacids (eds J.J. Otten, J.P. Hellwig & L.D. Meyers), pp1324–1325. The National Academies Press: Washington,D.C.
Jensen C.L., Voigt R.G., Prager T.C., Zou Y.L., Fraley J.K.,Rozelle J.C. et al. (2005) Effects of maternal docosa-hexaenoic acid intake on visual function and neurode-velopment in breastfed term infants. The AmericanJournal of Clinical Nutrition 82, 125–132.
Kennedy D.O., Jackson P.A., Elliott J.M., Scholey A.B.,Robertson B.C., Greer J. et al. (2009) Cognitive andmood effects of 8 weeks’ supplementation with 400 mgor 1000 mg of the omega-3 essential fatty acid docosa-hexaenoic acid (DHA) in healthy children aged 10–12years. Nutritional Neuroscience 12, 48–56.
Kirby A., Woodward A., Jackson S., Wang Y. & CrawfordM.A. (2010) A double-blind, placebo-controlled studyinvestigating the effects of omega-3 supplementation inchildren aged 8–10 years from a mainstream schoolpopulation. Research in Developmental Disabilities 31,718–730.
Koletzko B., Cetin I. & Brenna J.T. (2007) Dietary fatintakes for pregnant and lactating women. The BritishJournal of Nutrition 98, 873–877.
Krasevec J.M., Jones P.J., Cabrera-Hernandez A., MayerD.L. & Connor W.E. (2002) Maternal and infant essen-tial fatty acid status in Havana, Cuba. The AmericanJournal of Clinical Nutrition 76, 834–844.
Lapillonne A. & Carlson S.E. (2001) Polyunsaturated fattyacids and infant growth. Lipids 36, 901–911.
Lattka E., Illig T., Heinrich J. & Koletzko B. (2010a)Do FADS genotypes enhance our knowledgeabout fatty acid related phenotypes? Clin Nutr 29, 277–287.
Lattka E., Illig T., Koletzko B. & Heinrich J. (2010b)Genetic variants of the FADS1 FADS2 gene cluster asrelated to essential fatty acid metabolism. CurrentOpinion in Lipidology 21, 64–69.
Makrides M., Gibson R.A., Udell T. & Ried K. (2005)Supplementation of infant formula with long-chain poly-unsaturated fatty acids does not influence the growth ofterm infants. The American Journal of Clinical Nutrition81, 1094–1101.
Mardones F., Urrutia M.T., Villarroel L., Rioseco A.,Castillo O., Rozowski J. et al. (2008) Effects of a dairyproduct fortified with multiple micronutrients andomega-3 fatty acids on birth weight and gestation dura-tion in pregnant Chilean women. Public Health Nutrition11, 30–40.
Martinez M. (1992) Tissue levels of polyunsaturated fattyacids during early human development. The Journal ofPediatrics 120, S129–S138.
McNamara R.K., Able J., Jandacek R., Rider T., Tso P.,Eliassen J.C. et al. (2010) Docosahexaenoic acid supple-mentation increases prefrontal cortex activation duringsustained attention in healthy boys: a placebo-controlled, dose-ranging, functional magnetic resonanceimaging study. The American Journal of Clinical Nutri-tion 91, 1060–1067.
Mehendale S., Kilari A., Dangat K., Taralekar V., MahadikS. & Joshi S. (2008) Fatty acids, antioxidants, and oxida-tive stress in pre-eclampsia. International Journal ofGynaecology and Obstetrics 100, 234–238.
Essential fatty acids for growth and development 63
Micallef M., Munro I., Phang M. & Garg M. (2009) Plasman-3 polyunsaturated fatty acids are negatively associatedwith obesity. The British Journal of Nutrition 102, 1370–1374.
Muthayya S., Dwarkanath P., Thomas T., Ramprakash S.,Mehra R., Mhaskar A. et al. (2009a) The effect of fishand omega-3 LCPUFA intake on low birth weight inIndian pregnant women. European Journal of ClinicalNutrition 63, 340–346.
Muthayya S., Eilander A., Transler C., Thomas T., van derKnaap H.C., Srinivasan K. et al. (2009b) Effect of fortifi-cation with multiple micronutrients and n-3 fatty acidson growth and cognitive performance in Indian school-children: the CHAMPION (Children’s Health andMental Performance Influenced by Optimal Nutrition)Study. The American Journal of Clinical Nutrition 89,1766–1775.
Nyuar K.B., Min Y., Ghebremeskel K., Khalil A.K.,Elbashir M.I. & Cawford M.A. (2010) Milk of NorthernSudanese mothers whose traditional diet is high in car-bohydrate contains low docosahexaenoic acid. Acta Pae-diatrica 99 (12), 1824–1827.
Ohlund I., Hornell A., Lind T. & Hernell O. (2008)Dietary fat in infancy should be more focused on qualitythan on quantity. European Journal of Clinical Nutrition62, 1058–1064.
Oken E., Wright R.O., Kleinman K.P., Bellinger D., Ama-rasiriwardena C.J., Hu H. et al. (2005) Maternal fish con-sumption, hair mercury, and infant cognition in a U.S.Cohort. Environmental Health Perspectives 113, 1376–1380.
Olsen S.F., Grandjean P., Weihe P. & Videro T. (1993) Fre-quency of seafood intake in pregnancy as a determinantof birth weight: evidence for a dose dependent relation-ship. Journal of Epidemiology and Community Health47, 436–440.
Osendarp S.J., Baghurst K.I., Bryan J., Calvaresi E.,Hughes D., Hussaini M. et al. (2007) Effect of a 12-momicronutrient intervention on learning and memory inwell-nourished and marginally nourished school-agedchildren: 2 parallel, randomized, placebo-controlledstudies in Australia and Indonesia. The AmericanJournal of Clinical Nutrition 86, 1082–1093.
Otto S.J., van Houwelingen A.C. & Hornstra G. (2000)The effect of supplementation with docosahexaenoicand arachidonic acid derived from single cell oils onplasma and erythrocyte fatty acids of pregnant womenin the second trimester. Prostaglandins, Leukotrienes,and Essential Fatty Acids 63, 323–328.
Parra-Cabrera S., Moreno-Macias H., Mendez-Ramirez I.,Schnaas L. & Romieu I. (2008) Maternal dietary omegafatty acid intake and auditory brainstem-evoked poten-tials in Mexican infants born at term: cluster analysis.Early Human Development 84, 51–57.
Parra-Cabrera S., Stein D.A., Wang M., Martorell R.,Rivera J. & Ramakrishnan U. (2010) Dietary intakesof polyunsaturated fatty acids among pregnantMexican women. Maternal and Child Nutrition 7 (2),140–147.
Patel V., Araya R. & Bolton P. (2004) Editorial: Treatingdepression in the developing world. Tropical Medicine &International Health 9, 539–541. Article first publishedonline: 29 APR 2004. DOI: 10.1111/j.1365-3156.2004.01243.x.
Pawlosky R.J., Hibbeln J.R., Novotny J.A. & Salem N., Jr(2001) Physiological compartmental analysis of alpha-linolenic acid metabolism in adult humans. Journal ofLipid Research 42, 1257–1265.
Peng Y., Zhou T., Wang Q., Liu P., Zhang T., ZetterstromR. et al. (2009) Fatty acid composition of diet, cordblood and breast milk in Chinese mothers with differentdietary habits. Prostaglandins, Leukotrienes, and Essen-tial Fatty Acids 81, 325–330.
Prentice A.M. & Paul A.A. (2000) Fat and energy needsof children in developing countries. The AmericanJournal of Clinical Nutrition 72, 1253S–1265S.
Ramakrishnan U., Stein A.D., Parra-Cabrera S., Wang M.,Imhoff-Kunsch B., Juarez-Marquez S. et al. (2010)Effects of docosahexaenoic acid supplementation duringpregnancy on gestational age and size at birth: random-ized, double-blind, placebo-controlled trial in Mexico.Food Nutr Bull 31, S108–S116.
Rocquelin G., Tapsoba S., Dop M.C., Mbemba F., TraissacP. & Martin-Prevel Y. (1998) Lipid content and essentialfatty acid (EFA) composition of mature Congolesebreast milk are influenced by mothers’ nutritional status:impact on infants’ EFA supply. European Journal ofClinical Nutrition 52, 164–171.
Rocquelin G., Tapsoba S., Kiffer J. & Eymard-Duvernay S.(2003) Human milk fatty acids and growth of infants inBrazzaville (The Congo) and Ouagadougou (BurkinaFaso). Public Health Nutrition 6, 241–248.
Root A.W. (1992) Mechanisms of hormone action: generalprinciples. In: Clinical Pediatric Endocrinology (ed. W.Hung), pp 1–12. Mosby-Year Book: St. Louis.
Rosenfeld E., Beyerlein A., Hadders-Algra M., KennedyK., Singhal A., Fewtrell M. et al. (2009) IPD meta-analysis shows no effect of LC-PUFA supplementationon infant growth at 18 months. Acta Paediatrica 98,91–97.
Ryan A.S. & Nelson E.B. (2008) Assessing the effect ofdocosahexaenoic acid on cognitive functions in healthy,preschool children: a randomized, placebo-controlled,double-blind study. Clinical Pediatrics 47, 355–362.
Salem N., Jr, Pawlosky R., Wegher B. & Hibbeln J. (1999)In vivo conversion of linoleic acid to arachidonic acid inhuman adults. Prostaglandins, Leukotrienes, and Essen-tial Fatty Acids 60, 407–410.
Simmer K., Patole S.K. & Rao S.C. (2008) Longchain poly-unsaturated fatty acid supplementation in infants bornat term. Cochrane Database of Systematic Reviews 9 (3),1–66.
Smit E.N., Muskiet F.A. & Boersma E.R. (2004) The pos-sible role of essential fatty acids in the pathophysiologyof malnutrition: a review. Prostaglandins, Leukotrienes,and Essential Fatty Acids 71, 241–250.
Smit E.N., Oelen E.A., Seerat E., Muskiet F.A. &Boersma E.R. (2000) Breast milk docosahexaenoicacid (DHA) correlates with DHA status of malnour-ished infants. Archives of Disease in Childhood 82,493–494.
Smuts C.M., Tichelaar H.Y., Vanjaarsveld P.J., BadenhorstC.J., Kruger M., Laubscher R. et al. (1994) The effectof iron fortification on the fatty-acid composition ofplasma and erythrocyte-membranes in primary-schoolchildren with and without iron-deficiency. Prostaglan-dins, Leukotrienes, and Essential Fatty Acids 51,277–285.
Szajewska H., Horvath A. & Koletzko B. (2006) Effect ofn-3 long-chain polyunsaturated fatty acid supplementa-tion of women with low-risk pregnancies on pregnancyoutcomes and growth measures at birth: a meta-analysisof randomized controlled trials. The American Journal ofClinical Nutrition 83, 1337–1344.
Thiombiano-Coulibaly N., Rocquelin G., Eymard-Duvernay S., Kiffer-Nunes J., Tapsoba S. & Traore S.A.(2003) Seasonal and environmental effects on breastmilk fatty acids in Burkina Faso and the need toimprove the omega 3 PUFA content. Acta Paediatrica92, 1388–1393.
Tinoco S.M., Sichieri R., Setta C.L., Moura A.S. & CarmoM.G. (2009) n-3 polyunsaturated fatty acids in milk isassociate to weight gain and growth in prematureinfants. Lipids in Health and Disease 26, 8–23.
Tofail F., Kabir I., Hamadani J.D., Chowdhury F., YesminS., Mehreen F. et al. (2006) Supplementation of fish-oiland soy-oil during pregnancy and psychomotor develop-ment of infants. Journal of Health, Population, andNutrition 24, 48–56.
Uauy R. & Dangour A.D. (2009) Fat and fatty acidrequirements and recommendations for infants of 0–2
years and children of 2–18 years. Annals of Nutrition &Metabolism 55, 76–96.
Uauy R. & Castillo C. (2003) Lipid requirements ofinfants: Implications for nutrient composition of fortifiedcomplementary foods. The Journal of Nutrition 133,2962S–2972S.
Udell T., Gibson R.A. & Makrides M. (2005) The effect ofalpha-linolenic acid and linoleic acid on the growth anddevelopment of formula-fed infants: A systematic reviewand meta-analysis of randomized controlled trials.Lipids 40, 1–11.
Unay B., Sarici S.U., Ulas U.H., Akin R., Alpay F. &Gokcay E. (2004) Nutritional effects on auditory brain-stem maturation in healthy term infants. Archives ofDisease in Childhood. Fetal and Neonatal Edition 89,F177–F179.
van Eijsden M., Hornstra G., van der Wal M.F., VrijkotteT.G. & Bonsel G.J. (2008) Maternal n-3, n-6, and transfatty acid profile early in pregnancy and term birthweight: a prospective cohort study. The AmericanJournal of Clinical Nutrition 87, 887–895.
Vermunt S.H., Mensink R.P., Simonis A.M. & Hornstra G.(1999) Effects of age and dietary n-3 fatty acids on themetabolism of [13C]-alpha-linolenic acid. Lipids 34(Suppl.), S127.
Wang Y., Chen C., Wang F. & Wang K. (2007) Effects ofnutrient fortified complements food supplements ongrowth of Chinese infants and young children in poorrural area in Gansu Province. Wei Sheng Yan Jiu 36 (1),78–81.
Wolmarans P. (2009) Background paper on global trendsin food production, intake and composition. Annals ofNutrition & Metabolism 55, 244–272.
World Bank (2010) The World Bank. Classification ofeconomies. Available at: http://data.worldbank.org/about/country-classifications (Accessed August 4 2011).
Yakes E.A. (2010) Polyunsaturated Fatty Acid Intake andStatus of Breast Fed and Non-Breast Fed BangladeshiChildren 24–47 Months of Age. PhD, Dissertation.,University of California Davis.
Yuhas R., Pramuk K. & Lien E.L. (2006) Human milkfatty acid composition from nine countries varies mostin DHA. Lipids 41, 851–858.
Essential fatty acids for growth and development 65
Balancing nurturance, cost and time: complementaryfeeding in Accra, Ghanamcn_351 66..81
Gretel H. Pelto* and Margaret Armar-Klemesu†
*Division of Nutritional Sciences, Cornell University, Ithaca, New York, USA, and †Department of Nutrition, Noguchi Memorial Institute for MedicalResearch, University of Ghana, Legon, Ghana
Abstract
This paper presents a picture of the general patterns of complementary feeding behaviours in urban Ghana. Afocused ethnographic study protocol for assessing complementary feeding developed for the Global Alliance forImproved Nutrition was used to collect data from caregivers of children 6–24 months of age. We examined themultiple factors that influence the selection of foods for infants and young children in this urban setting, andfound that economic factors, health beliefs and other nurturing-related values, access to food and issues ofconvenience all play important roles. We conclude that the interactions of nurturance, cost and time are vectorsthat affect feeding decisions.
Keywords: social determinants of infant feeding, focused ethnographic studies, infant feeding beliefs and prac-tices, use of commercial infant cereals, women’s time allocation, breastfeeding.
Correspondence: Gretel H. Pelto, Cornell University, 129 Eastlake Road, Ithaca, NY 14850, USA. E-mail: [email protected]
Introduction
In the nutrition and public health community, there isnow widespread understanding that complementaryfeeding is not only about ‘what’ is fed, but also about‘how’, ‘when’, ‘where’ and ‘why’ (Pelto et al. 2003). Inother words, that in addition to macro- and micronu-trients, complementary feeding involves behaviourand the determinants of behaviour. Consequently,understanding complementary feeding behavioursand their determinants is critical for the design anddevelopment of interventions to prevent undernutri-tion and future obesity during the period from 6 to24 months of age, and research to facilitate this under-standing is essential.
Several different approaches are currentlyemployed to conduct social research on complemen-
tary feeding.The various approaches, which use quan-titative or qualitative research methodologies, or acombination of both, have their origins in differentsocial science and public health disciplines. Althoughthey often share common goals about the insights andinformation they hope to obtain, they draw on differ-ent methodologies and rest on different theoreticalframeworks, and thus can be seen as providing‘complementary’ contributions to understanding andevaluating infant and young child feeding.
One approach to the study of complementaryfeeding is focused ethnography. The concept of‘focused ethnographic studies’ (FES) is derived fromanthropology (Pelto & Gove 1992; Manderson 1998).In practice, the research protocols typically use amixed-method approach to examine specific ques-tions, which have been identified before a study is
undertaken. Thus, they are not only focused on a par-ticular topical area of human behaviour and its deter-minants, but also on a specific set of questions; theanswers to which are important for actions. Becausethe methodology rests on exploratory, qualitativetechniques, FES provides insights that go beyond theimmediate, pre-specified questions to reveal largeraspects of the topic of study, including the socio-cultural context.
In this paper, we present the results from a studybased on a FES approach.The study was conducted inAccra, Ghana in 2010 (Pelto & Armar-Klemesu2010a).
The specific question for the research in Accra,which was undertaken on behalf of the Global Alli-ance for Improved Nutrition (GAIN), was whether afortified, non-instant cereal had the potential to bewidely adopted in these (or similar Ghanaian) urbansettings. In the course of examining this question, wealso learned about what caregivers of infants andyoung children (IYC) are doing with respect tocomplementary feeding (what, how, when and where)and the reasons for their choices and decisions. In thispaper, we are concerned with this wider picture andits implications, rather than the answers to GAIN’sspecific questions about the potential future for a for-tified, non-instant cereal.
Materials and methods
The study design
The operational strategy of our FES was to collectinformation about essential aspects of IYC feedingbehaviour as efficiently as possible by stratifying datacollection according to sources of information. In
Accra, the first level of segmentation was by child age.In recent years, the acronym IYC has come to refer tochildren 6–24 months of age. However, as the biologi-cal and behavioural variability across the 18 monthsof IYC status is large, it is essential to break it downinto smaller age categories. We subdivided the agerange (6–24 months) into four divisions: 6–8 months;9–12 months; 13–18 months; and 19–24 months.Respondents could then be recruited in relation tothese four categories to ensure that all age groupswere represented. The second segmentation was byeconomic status. In order to examine behaviour infamilies who had sufficient income to purchasecomplementary foods, we did not interview respon-dents from the very poorest households, but wesought to include a range of economic conditions,with an emphasis on households with lower socio-economic status (SES). We measured SES with anestablished method based on living standards mea-sures (LSMs) derived from the Ghana Living Stan-dards Survey indicators. The LSM method of SEScategorization has wide application in market andsocial research, and has previously been used to assessmarket opportunities for processed cassava productsin Ghana (Collinson et al. 2001, 2003).
To obtain information on caregiver perspectives,we conducted individual interviews, which typicallyinvolved two visits to a household. The interview pro-tocol draws on several qualitative data collectionmethods, including cognitive mapping techniques, aswell as standard demographic and nutrition methods.The protocol is organized into modules, each ofwhich is designed to obtain information on a specifictopic. The modules, which varied in length dependingon the topic, are the equivalent of sections within aquestionnaire.
Key messages
• Application of ethnographic techniques is an effective and efficient method for obtaining and interpreting dataon complementary feeding.
• Mothers in Accra have strongly held views about the importance of foods for child health and growth.• Beliefs and values about nutrition and child health compete with the constraints imposed by low economic
resources and time demands.• Finding a balance between food costs, demands on time and beliefs and values about how to promote their
children’s health pose a continuous challenge for mothers in urban Ghana.
All of the respondents, mothers of IYC, were inter-viewed with a core set of modules, which includedsocio-economic and demographic data and childfeeding practices, as well as modules designed toobtain information on beliefs, attitudes and knowl-edge. Some modules were used only in subsets ofrespondents because we needed only a few infor-mants to obtain an adequate picture. For example, amodule designed to obtain information on types offoods that are fed to infants was applied only with thefirst respondents as the results quickly became redun-dant. With some respondents, we applied modules inaddition to the core set in order to obtain insightsabout the wider context in which infant feedingbeliefs and behaviours are imbedded.
Detailed information about the FES study designand the content of the individual modules is availablein ‘Assessing the Behavioral and Local Market Envi-ronment for a Commercial Complementary Food: aFocused Ethnographic Study Manual (First Edition)GAIN, 2010 (Pelto & Armar-Klemesu 2010b).
The study area and the sample
The study was conducted in the Greater Accra Met-ropolitan Area in eight different residential areas rep-resenting a wide range of conditions from denseurban neighbourhoods to peri-urban areas. Some ofthe areas have a long settlement history, while othersare recently established. Some are populated withhouseholds who have been in Accra for many years.Others are comprised mainly of migrants from otherparts of the country. Some are home to families thatare relatively well off; others are composed mainly offamilies who are very poor. Together, they capture awide cross section of Accra society.
Interviews were conducted in Twi or Ga, two mainlocal languages, and, with permission, were audiorecorded. Although respondents spoke in the locallanguage, they also used English words from time totime over the course of the interview. This is acommon occurrence in urban Ghana when local lan-guages are being spoken. Two of the respondentswere better able to express themselves in English, sotheir interviews were conducted in a mix of Ga or Twiand English.
To recruit respondents for our study, we laid out agrid with the combination of age and LSMs catego-ries. Field staff visited each of the eight communitiesand randomly selected a street on which to startapproaching potential respondents. The first screen-ing was for child age, after which, the LSM screeningquestions were asked. As recruiting progressed, andchild age/LSM categories were filled, the number ofwomen who were screened increased because of theneed to meet the remaining respondent slots. Usingthis method, a total of 30 caregivers (mothers) wererecruited for the study. Table 1 shows the socio-demographic and LSM characteristics of the sample.
Data analysis
The tapes from the interviews were transcribed andtranslated.These records, together with the interview-
Table 1. Socio-demographic characteristics of respondents
ers’ notes taken during the discussions with respon-dents, provided the corpus of data for text analysis.Text analysis was conducted independently by bothauthors of the paper. When differences in interpreta-tion occurred, these were discussed and reconciled.The small size of the database made it feasible tocarry out the text analysis without using computertools to facilitate coding. We worked directly withtranscripts, creating files of statements on specifictopics and issues. With small samples (30 or lessdepending on the module) and hand tabulation,simple descriptive analysis was possible without theassistance of a qualitative data analysis softwareprogram. Quantitative data from the modules wereentered and analyzed in Excel.
Results and discussion
Characteristics of the sample
From Table 1, we see that the respondents represent awide range in age, experience in child care (from newmothers to women with several children) and inhousehold composition. The majority of the respon-dents have more than one child under the age of 6.There is also a wide range in SES. All of the house-holds had electricity, but the majority of women areliving in difficult conditions. Many of the women inour respondent sample keep the house without theadvantages of running water, an indoor toilet, a refrig-erator or a gas or kerosene cooking stove.
As shown in Table 2, many respondents estimatedthat they spend just under 10 cedis ($7.00) a day onfood for the household, while the estimates of thehighest LSM respondents were about 13 cedis ($9.00)
per day. Women did not have difficulty estimating theamount of money they spent on food for their infantor young child, and we see that there is very littlevariation across LSM groups, with an estimate of 1.6cedis ($1.12) in the lowest LSM categories and 2.1cedis ($1.50) in the highest groups. On average, 25%of household food expenditure is for foods for IYC.
Feeding practices
To generate a qualitative picture of feeding practices,we administered a classic 24-h recall, beginning withasking about the first item the child had eaten onwaking and continuing through the day, for the dayprior to the interview. Table 3 shows the results forthe 30 children whose mothers we interviewed. Adescription of the cereal-based foods in this table canbe found in Table 4.
The phrase ‘complementary feeding’, which is usedwith reference to feeding practices during the periodfrom 6 to 24 months, is intended to remind us thatfoods given to IYC are intended to be ‘complemen-tary’ to breast milk. All of the children in our samplewere breastfed at birth. Twenty-two (73%) of the 30children were still breastfed at the time of the inter-view. All seven children in the 6-8 months age groupwere breastfed, while nine (82%) and six (50%) ofthose in the 9–12 and 13–24 months groups, respec-tively, were breastfed. Mothers were generally notable to estimate the number of times they breastfedtheir child in a day, and most expressed the idea thatthey breastfed an uncountable number of times, evenwith the older children.
The number of times complementary foods weregiven to the child (feedings) was derived from the24-h food record.We find that two of the seven infantsin the 6–8 months age group were fed less than therecommended ‘twice a day’. Eight of the 11 infants inthe 9–12 months age group and all of the 12 in the13–24 months age group were fed the recommendedminimum of three times a day.
Cereal-based foods in the form of instant cerealsand porridge, and as traditional family staples con-sumed with soup and stews, predominate. What isparticularly striking in these food records is that 11 ofthe 30 IYC received Cerelac (Nestlé Ghana Ltd,
Accra, Ghana), a commercial, fortified, instant por-ridge that is sold, ready to mix with water or milk, inevery community in our study.The number of times ina day that these 11 children ate Cerelac varies fromonce to three times a day. Traditional porridge, koko
and Hausa koko, are also very common in the foodrecords. What is surprisingly low is the number oftimes that weanimix or tom brown (generic orbranded, commercial, non-instant, usually multigraincereal) appears in the recalls.
Infants are more likely to be given porridge orinstant cereal as the first meal of the day, whereasyoung children (a year and above) are typically con-suming tea, or a chocolate drink (Milo Nestlé GhanaLtd, Accra, Ghana), with or without bread, as the first
food in the morning.These are family breakfast foods,and, as can be seen in the table, the foods that followlater in the day are also family foods, which suggestthat many children are no longer being given speciallyprepared complementary foods in the second year oflife.
There is a notable absence of fresh fruit in therecords.While this may reflect actual dietary intake, itis probable that respondents failed to report them,even with the typical prompting that characterizesdata collection with a 24-h recall, because they do notregard fruit as food (see below). In fact, in anotherpart of the interview, many of the women said thatthey felt that children should be given fruit, particu-larly fruit juices, because they are health promoting.
Table 3. IYC food intake records for the day prior to the interview (youngest to oldest)
Age(months)
BF Feed 1 Feed 2 Feed 3 Feed 4
6 Yes Hausa koko Hausa koko6 Yes Koko7 Yes Banku + stew7 Yes Koko Rice and egg stew Banku + egg stew Cerelac®
7 Yes Mashed kenkey Mpotompoto7 Yes Cerelac® Mpotompoto7 Yes Koko + soya Banku + soya + okro stew Koko + soya9 No Hausa koko Mpotompoto Mashed yam + garden egg stew9 Yes Koko Cerelac Koko9 Yes Koko Koko9 Yes Cerelac® Cerelac® Cerelac®
9 Yes Cerelac®
9 No Tom brown Rice + stew Mashed kenkey + milk Hausa koko + milk10 Yes Mashed kenkey10 Yes Weanimix Mpotompoto Cerelac® Banku + stew10 Yes Koko Tuo zaafi + ayoyo soup Koko11 Yes Cerelac® Rice + stew Banku + okro soup Cerelac®
We used an ethnographic technique known as ‘freelisting’ to elicit an emic inventory of the foods that areconsidered appropriate for infants and children. Thetechnical term emic is used in anthropology to refer to‘the insider’s perspective’, as contrasted with the per-spective of the investigator.Sixteen specific foods werespontaneously described by respondents. The resultsof the free listing were not a definitive list of all thefoods that children in urban Ghana receive, and manyof the foods that appear on the 24-h recall were notmentioned. We interpret this result as evidence thatthe request for a spontaneous list of complementaryfoods elicits the foods that are most salient from themothers’ perspectives. Of the 16 foods that womenmentioned, five were porridge. However, we alsoobserved a pattern in which specific foods are linked tochild age: Porridge received first mentions for 6- to8-month-old infants, while free listing of foods forchildren in the 19–24 months typically elicited itemsthat were collectively referred to as ‘family foods’, andporridge was mentioned only after probing or prompt-ing. Table 4 shows all the IYC foods that are given asporridge.Those that were mentioned spontaneously inthe free listing are indicated in boldface type.
An overview of mothers’ concerns about healthand nutrition
We begin our presentation of the results and discus-sion about beliefs, knowledge and values with an
overview of mothers’ concerns about health andnutrition. To set these concerns within the largercontext of child caregiving, we first asked our respon-dents to describe the kinds of problems and chal-lenges that families with IYC face. Mansah, a youngmother with one child 20 months of age, elaboratedher views as follows:
You do not necessarily need money to take good care of
your child. But you can manage to keep the child healthy so
that everybody will commend you for taking good care of
her . . . I do not take delight in seeing my child play on the
bare floor like other children. This is because some germs
may be picked up by the child. I also keep an eye on wher-
ever she goes to prevent accidents. I also make sure that
whoever is going to pick her up is well kept. I also ensure her
diapers are regularly changed to prevent rashes. I also make
sure she is bathed and wearing neat clothing.As for food, she
eats well so I make sure she has food all the time. . . .Feed-
ing, medication, hygiene are all part of the good care. I think
they make the child grow well in a healthy environment.
Some children are small for their ages because they did not
get the kind of care that they should have. But a well cared
for child grows well and is a delight to the mothers and
others around her. With good care, a two year old child can
look like a 4 or 5 year old child.
Some mothers responded to our opening questionwith a diverse set of health concerns and did not bringup food-related issues until we asked a probing
Table 4. IYC Foods given as porridge
Porridge
Name Description
Koko Traditional fermented maize porridge; also referred to as white koko; usually made athome
Hausa koko Fermented millet porridge, usually purchased ready-to-eat from local (street) foodvendors
A commercial instant cereal (Cerelac®) Fortified instant cereal manufactured by a multi-national company; available in a varietyof grains and flavors and in multiple package sizes, including single-serving packets;mixed with water or milk. It is made from.
Home-processed tom brown ‘Tom brown’ is a generic name for a variety of cereals prepared as porridge. Homeprocessed is usually made from roasted maize flour.
Enriched tom brown/weanimix/prepared athome or purchased from health centres
Weanimix is used interchangeably with tom brown for cereals prepared from maize, soyabeans and groundnuts roasted and milled together into composite flour; prepared asporridge.
Commercial, unfortified (branded) tom brown Processed multi-grain cereals/legume composite flours; prepared as porridge.
question. For example, Jenny, the mother of a7-month-old, said:
Well, my concerns have to do with the health of the child.
Sometimes they fall sick and you need to give them medica-
tions to make them well. Supposing you give the medica-
tions, and the baby is still not well, you send her to the
hospital . . . As a mother you need to constantly check the
baby’s diapers to be sure the baby is not wet, or else the baby
gets a lot of discomfort and may even develop heat rashes.
So the personal hygiene of the child is also very importan-
t . . . You have to be vigilant to ensure that the child does not
put dangerous things into her mouth. We must also ensure
the child is bathed well and wears clean clothes.
Interviewer: What about food? Is food another thing that
concerns you?
Jenny: Food is very important. When I wake up every
morning, I have to see to it that the child has food to eat.
Another respondent, Maureen, also gave us a list ofseveral different issues. When we said, ‘You men-tioned education, healthy eating, preventing him fromgetting hurt and money. Among these, which do youthink is the most important in ensuring your child’shealth?’, her reply was, ‘Healthy eating’.
A few respondents immediately began talkingabout food and nutrition. Sarah, the mother of a6-month-old and four other children, said,
I am mainly concerned about her feeding. I make sure she
eats nutritious foods. If her appetite goes down, I take her to
a pharmacist to prescribe some drugs for me. I also prevent
them from playing under the scorching sun . . . if my child
feeds well, she will always be healthy.
One respondent said,‘The major problem is feedingbecause each and every morning when one wakes up,she has to think about the kind of food to give to thechild’. Another respondent, Mina, whose 17-month-old daughter is not easy to feed, began by saying, ‘Thedifficulty I have identified so far is in feeding. She doesnot like food,so when it comes to eating, it’s so difficult.
How important are health concerns as a factor that affectsdecisions about what to feed IYC?
To assess this question we asked the full sample of 30respondents to consider five factors – healthiness;
cost; child acceptance of foods; convenience; and easeof acquiring food – and to rank them in order ofimportance for their decisions about what to givetheir child. In a subsample, we included another factor– influence of others.
The results of this exercise, presented in Table 5,are striking. Clearly, health trumps everything else.Nearly all mothers chose healthiness as the mostimportant factor they consider in making decisionsabout food for their children. Only three mothersassigned it to second place (after cost), and no onerelegated it to a lower position. Anthropologists usethe term ‘cultural consensus’ to describe a situation inwhich there is a very high level of agreement for aparticular value or belief, and there is a technical pro-cedure for calculating levels of cultural consensus(Weller 2004). In anthropological parlance, we can saythat there is a ‘strong cultural consensus’ that the‘healthiness’ of foods is paramount. Whether there isa cultural consensus about the relative healthiness ofspecific foods is the next issue we examine.
Are some foods healthier than others?
Underlying the health ranking is the implicit assump-tion that foods differ in their healthiness. Just howdifferent are they from the perspective of Ghanaianmothers? To address this, we turn to the interviewdata on women’s ratings of IYC foods for healthiness.To obtain these data, we initially cast a wide net,asking about all of the foods that were elicited duringthe Free Listing exercise, plus additional cereals andother family foods.We asked all of our respondents torate food items with respect to healthiness, as well asother qualities on a scale of 1 to 5 (least to most
Table 5. Ranking of factors that affect decisions about what to feed
Factor Means (5 is most important)
Healthiness 4.9Child acceptance of food 2.9Cost 2.9Convenience 2.2Ease of acquisition 2.0Influence of others 1.3
desirable). Table 6 shows the ratings for cereal foods.Mothers’ views of non-cereal IYC foods are shown inTable 7.
Mothers perceive clear differences among thecereal-based foods that are currently available intheir environment. There appears to be a basic divi-sion into cereals that generally receive high ratings onhealth and cereals that are generally viewed nega-tively in relation to their health value. While tradi-tional complementary foods, koko and milletporridge (Hausa koko), get the lowest ratings, theclear division between high health and low healthcereals is not due simply to a rejection of traditional
foods in favour of commercially produced items. Tra-ditional foods can receive high ratings on health, actu-ally somewhat higher than commercial foods that areprepared without milk, provided they are augmentedwith additional ingredients or milk.
One conclusion from Table 6 is that mothers arewell aware of the nutritional advantages of milk.Second, it appears that they have been exposed tonutrition messages about the value of adding fishpowder, ground roasted peanuts, soy flour and/or oilto traditional koko, as ‘home fortified koko’ (‘koko +’in the table) ranks just below Cerelac® with milk (andabove Cerelac® prepared without milk).
Table 6. Ratings of cereal foods (n = 30)*
Cereal Health Child acceptance Convenience Cost Ease of acquisition
Cerelac with milk 4.8 4.3 5.0 1.1 4.5Koko +† 4.7 4.4 3.8 1.6 3.6‘Tom brown home plus’† 4.6 3.5 3.3 2.3 2.7Millet porridge with milk 4.5 4.3 4.7 1.9 4.3Cerelac with water 4.5 4.3 4.9 1.2 4.6‘Tom Brown’ branded flour 4.5 4.3 4.2 2.5 3.8‘Tom Brown’ maize flour,
*All columns, the best (e.g. Best health, highest child acceptance, lowest cost) is 5 and the worst is 1. †The ‘plus’ indicates ‘home fortification’ withfish powder, ground roasted peanuts, soy flour and/or oil. ‘Tom brown’ is a generic name for porridge that are made from ingredients other thanfermented maize (koko) or millet (Hausa koko). The term covers a range of mixtures from roasted maize flour to multi-ingredient weanimix.
Table 7. Ratings of non-cereal foods
Food Healthiness Acceptance Convenience Cost Ease of acquisition
Ideas about the healthfulness of specific cerealfoods, both traditional and commercial, show a highdegree of cultural consensus. For example, 28 of 30respondents gave Cerelac® with milk high ratings (5or 4 on the scale of 1 to 5), 26 of 30 did the same forCerelac® without milk. Similarly, koko, which has thelowest mean rating of all the cereals, was given a lowrating (1 or 2) by 24 of the 30 respondents. There wassomewhat less consensus about the negative qualityof millet porridge, which rates just above koko on thelow end of the scale.We conclude that the perceptionsabout individual cereal foods, like the perceptionabout the importance of health as a factor in what onefeeds one’s children, are characterized by strong cul-tural consensus.
Table 7 shows the ratings of non-cereal foods thatare commonly fed to IYC. Many of these are alsofamily foods. The foods in the top half of the tablewere rated by all of the respondents. The foods in thelower half were rated by a subset of 12 respondents.With the exception of rice balls and mashed yam, thefoods are generally given high ratings on healthiness.Women frequently commented that the meat and fishin the stews are excellent sources of nutrients. Typicalphrases used to describe these foods include: ‘Theyare all very nutritious’; ‘They are full of energy andwill make them healthy’; ‘These will make themhealthy and strong’; ‘Generally the softness of thesefoods makes them convenient for the baby. They arealso very nutritious’; ‘They can easily eat these foods.They are highly nutritious’.
Why are some foods healthier than others?Nutrition beliefs and knowledge
In the local language, the concept of ahondene, whichtranslates best as nutritious, refers to a substance thatgives strength. This, in turn, leads to apomdene
(healthy or the state of being healthy). Regardless oftheir level of education or literacy, the respondentshad no difficulty in rating the individual food items ona scale of healthiness. The task intuitively made senseto them. They readily make comparisons among fooditems with respect to their health value.
From the perspective of our respondents, a funda-mental component of healthiness in foods is that they
are nutritious. Most of the women used one or morewords that are best translated into English as ‘nutri-tious’. Here is a sampling of the types of commentsour respondents made as they rated the specific fooditems: ‘These foods have no nutrients’, ‘They are allgood and nutritious’, ‘Children like them and they arenutritious’, ‘They are highly nutritious’, ‘They are notas nutritious as the others’, ‘These will make themhealthy’. Explaining the low rating she assigned forkoko and millet porridge, a respondent said, ‘Thenutrients [in them] are not enough.’
Some women mentioned vitamins in connectionwith specific foods. For example, Jenny said: ‘Fruitsmake the children strong and healthy. They alsocontain vitamins’. When the interviewer asked whatvitamins do, she replied, ‘They make us strong andhealthy’. Later in the discussion, she commented thatCerelac® contains vitamins.
Maureen, who has a secondary school educationand the highest LSM of the women in ourstudy, offered this articulate view of nutritionduring an exchange about healthy foods for her15-month-old son:
Interviewer: How would you prepare Albert’s food to ensure
that it is very healthy? What would you consider?
Maureen: The nutritional value of the food.
Interviewer: What nutritional values would you consider?
Maureen: It should contain proteins, vitamins, carbohy-
drates, minerals, fats and water.
Interviewer: You mentioned vitamins. What do vitamins do
for the body?
Maureen: It makes the child grow well.
The concept of vitamins is not part of the concep-tual framework about nutritious foods for all of thewomen. Consider the following exchange withEstelle, the mother of a 7-month-old girl and twoother children. After she used the word ‘nutritious’ inconnection with a discussion about some complemen-tary foods, the interviewer ask:
Interviewer: Have you heard of vitamins?
Estelle: No.
Interviewer: When you go for weighing [at the child welfare
clinic], what ‘drugs’ do they give to Jessica?
Estelle:Polio treatment drug and a red drop called vitaminA.
Estelle:Yes, especially orange. I squeeze the juice, dilute with
water and give it to her by means of a spoon.
Interviewer: Why do you give her orange?
Estelle: It helps prevent constipation.
Another respondent, Ama, the mother of a15-month-old and another child, gave us this interest-ing conceptualization of food, fruit and vitamins:
Interviewer: In talking about ensuring the health of your
child, you did not mention fruits. Do you give your children
fruits?
Ama: Yes, I do.
Interviewer: So why didn’t you mention it?
Ama: We were talking about foods and not fruits. Fruits are
not foods.
Interviewer: Why aren’t fruits food?
Ama: Fruits do not give energy. But they protect the children
against diseases and make them grow well. Fruits also give
free bowels.
Interviewer: What do fruits contain?
Ama: They contain vitamins like E, A, C.
The concept of vitamins also occurred in spontane-ous discussions about vitamin supplements in thecontext of discussing strategies for dealing with poorappetite (see below).
Another dimension of healthiness relates to foodhygiene. This idea is reflected, for example, in thefollowing statement: ‘Even if my baby does not likethe food, its healthiness is more important. Healthi-ness of food means it is commercially manufacturedlike Cerelac® and L (infant formula).’ The cleanlinessof food can be achieved through different means. Forsome women, as expressed in the quotation above,‘factory-made foods are clean’. Others feel that theonly method to ensure the health (i.e. safety) of foodsis to make it from scratch themselves. For example, inanswer to the question ‘What makes food healthy?’,Patricia said: ‘Food prepared at home because onecannot trust food prepared outside’. For women whohold such views, getting food from vendors on thestreet is to be avoided. However, others expressed theview that one can buy safe, ready-made conveniencefoods on the street if you are careful about whom youbuy from.
In summary, mothers clearly believe that somefoods are healthier than others.The education level ofour respondents varied widely from no education tocompletion of high school. Some of the women arefunctionally illiterate, and none of them reportedreading magazines or newspapers (one of the LSMindicators). Nonetheless, their beliefs about the differ-ential health value of different foods reflect largerconcepts about what constitutes healthy food andgood nutrition, many of which are closely allied tocontemporary nutrition and public health knowledge.Healthy foods are sanitary. Healthy foods are high innutrients.
Child acceptance of foods
Acceptance comes first, because the child has to eat to be
healthy.
Returning to the data in Table 6, we see that childacceptance was ranked equally with cost as a factorthat affects women’s decisions about what to givetheir children. Mothers carefully monitor their chil-dren’s reactions to foods and are quick to makechanges when a child shows signs of rejecting an item,offering substitutes for the rejected foods. In the dis-cussions about individual food items, virtually all theinterviews involved at least passing mention of chil-dren’s reactions to particular foods. Moreover, howwell or poorly children eat in general – their appetite– was a subject of concern that surfaced repeatedlythroughout our interviews. In the course of the study,no respondent ever voiced a concern about lack ofavailability of appropriate, nutritious complementaryfoods. On the other hand, a common theme, closelyrelated to child acceptance, was an abiding concernabout problematic eating – e.g. rejection of foods,refusal to eat – on the part of children.
Child psychologists emphasize the idea that infantfeeding is a two-way process in which infants play astrong role. Some nutritionists and other public healthprofessionals forget this, but mothers do not. In therating exercise, as well as in their comments through-out the interviews, they frequently reminded us thatthey are paying attention to how their childrenrespond to the foods they offer.
Managing the logistics of food: cost, acquisition, preparationand convenience
Cost
People give all sorts of advice when it comes to caring for a
child, but it is the money I have that will determine what I
would buy. (Mary, mother of a 10-month-old and three other
children)
During the course of the interviews, nearly all of therespondents voiced concerns about having enoughmoney to take care of their children. The issue ofpoverty and food insecurity was a thread that was asubtext in the interviews. Two questions were particu-larly likely to elicit comments about economicresource constraints: (1) a general question on prob-lems parents face in raising children; and (2) a ques-tion asking about where and how mothers acquirefood. As the nature of the statements was similarregardless of the question that elicited them, wepresent illustrative examples below:
The major problem is money. Currently, I am jobless so I
solely depend on the meager amount of money my husband
provides. I have to do a lot of management to keep the
family running.
It’s mainly financial issues. I used to sell at the market, but
since I gave birth, I have not been able to go, so I am much
burdened financially.
Many a time we are faced with monetary problems.
Money does everything. If there is no money, I cannot give
my child proper education and provide him with healthy
food.
It is worrying because there are times that the food gets
finished and it’s like there is no money to buy some at that
time.
Interviewer: What major problems do you face in her
upbringing?
Respondent: Financial difficulties. I am paid monthly, so
sometimes, I enquire money from my husband, and if he also
doesn’t have, I turn to my sister for assistance. So generally,
money is the problem.
It is clear that having sufficient money to feed andcare for their children is a primary concern in the livesof these Ghanaian women. However, as we see in thefollowing sections, Mary’s unidimensional character-
ization of the determinants of her decisions aboutinfant feeding does not seem to reflect the views ofmost of the respondents. In addition to food costs andfinancial resources, cultural factors (knowledge,beliefs and values), child acceptance of foods andissues related to food acquisition and preparation arealso important. We examine the latter in the nextsections.
Acquiring foods: the matter of control over resourcesto purchase food
From one culture to another, women’s roles in acquir-ing foods to feed the family vary widely. In somefarming societies, men have the responsibility forgrowing the food and ensuring that storage facilitiesare full, while in others, women have a major respon-sibility for producing food (Goodman et al. 2000). Inthe former, women typically have little to say aboutwhat foods are available to them to prepare meals fortheir IYC and other family members, althoughkitchen gardens and/or obtaining meat and eggs fromraising chickens or small animals are often exemptedfrom male control (Chatterjee 1989).
Even in many urban communities, men fullycontrol household access to purchased foods, eitherbecause they do all of the food shopping or becausethey control the amount of money a woman has avail-able to make purchases. When women earn moneyindependently of their husbands, they sometimes, butnot always, are given control over their funds, and it isoften the case that they use their earnings to improvethe family diet, particularly the diet of infants andchildren. The extent to which women have controlover household food purchasing varies widely. Thisgeneralization applies not only to differencesbetween societies, but is also within them, and it istherefore important to investigate the situation inevery community where one wants to understandfood purchasing decisions.
To gain insight into food purchasing in Accra withrespect to who controls the resources that are neces-sary to acquire food, we used two techniques: (1) weincluded ‘influence of others’ as a factor in theranking exercise of ‘factors that affect what you feed
your IYC’, and (2) we examined this in an exercise inwhich respondents were asked specifically to compareCerelac® and tom brown.
In the ranking exercise, ‘influence of others’ had thelowest rank (1.3) and most respondents relegated it tolast place (See Table 6). Intriguingly, a number of therespondents were indignant about the suggestionsthat anyone would influence how they managed thefeeding of their infants. They made forceful state-ments such as: ‘I decide what is best for my child’; ‘Idon’t listen to people. I do what is right’; ‘I am notinfluenced by anyone in anyway’.
On the other hand, the responses in the comparisonexercise with the two cereals were more nuanced andrevealed a more complex picture of variation withinthe community. In this exercise, a third of the womenchose the highest scale value (5) for the influence ofothers with respect to their decisions about buyingtom brown or Cerelac®. Another group assignedmiddle levels to the influence of others, and only aminority said that it was not important. Significantly,the women who perceived a strong influence of othersusually identified the husband as the influentialperson, or in one case, it was a sister whose influencewas explicitly ascribed to the fact that she supportedthe family financially. The husband’s role as theperson who controls the finances was typically givenas the explanation for his influence. For example, onerespondent said: ‘My husband has so much influencebecause he gives out the money for everything’.Apartfrom the influence that comes from financial control,some women indicated that they seek advice fromtheir mothers. Also, some of the women referred tothe advice they receive at the child welfare clinic as asource of influence.
Ease of access and distance as influential factors
Once it has to do with my child’s health, I will do all that I
can to keep the child healthy. Distance and time are irrel-
evant if only the child will eat the food. (Estelle, mother of a
7-month-old and two other children)
Compared with rural areas, urban centres tend tohave a high density of places to obtain a wide range offoods. They also have a great range of choices in the
types of foods that are available – from ready-to-eatand ready-to-cook foods to basic ingredients. Theeffects of these characteristics are evident in themassive dietary changes of contemporary urban life.However, access to the diversity of foods one finds inurban areas is not uniform across cities and peri-urbanarea. A recent and growing literature on food avail-ability in poor neighbourhoods is drawing attention tothe fact that,at least in large cities in Europe and NorthAmerica, constrained availability of some foods, espe-cially fresh fruits and vegetables, is exerting a negativeeffect on household diets (Larson et al. 2009; Bodoret al. 2010). Poor transportation services and the factthat most poor families do not have cars add to theproblem of access (Bostock 2001; Morland et al. 2002).
Given its potential impact on child feeding, it wasimportant to explore issues of access to IYC andhousehold food. To do so, we employed the followingtechniques: neighbourhood observations; askingabout ‘ease of access’ as a dimension in the ratings ofIYC foods; and including it in the relative ranking offactors that affect what one feeds to children. Weasked direct questions about where our respondentspurchased their IYC cereal-based foods and theingredients for these foods, and we asked a subset ofrespondents to rank distance as a factor that affectswhat they feed their children. Additionally, as a checkon the oral reports, we asked respondents to drawmaps in which they located their residence in relationto the locations of food purchases.We begin here withthe respondents’ perceptions about ‘ease of access’for IYC foods.
In Table 6, we see that the most expensive commer-cially produced infant cereal (Cerelac®) receives thehighest rating for ‘ease of acquisition’ relative to allother foods. In fact, most respondents gave it the toprating of 5. This finding is explained by the fact thatmost of the small neighbourhood kiosks that dot thelandscape offer single-portion packets of Cerelac® forsale. Millet porridge (Hausa koko) follows closelybehind Cerelac® in the ease of access rating. This isexplained by the fact that it is available, ‘ready to eat’from the ubiquitous neighbourhood ‘porridge sellers’.‘Hausa koko’ is made not only for IYC, but it has alarge market as the ultimate convenience food for ahousehold.
The cereal that gets the lowest rating is home-fortified tom brown. In this case, the referent is tothe various forms of home-prepared weanimix,which are augmented with, e.g. soya flour, groundpeanuts and other ingredients that are added toboost its nutritional value. The significantly lower‘ease of acquisition’ value of this cereal comparedwith Cerelac® (Chi square = 15.9; P < 0.0001) reflectsthe fact that the additional ingredients are notusually readily available in the urban and peri-urbanneighbourhoods.
Compared with the cereals in Table 6, the non-cereal foods in Table 7 are given substantially lowervalues on ease of acquisition. The mean values in thistable mask a range of variation among respondentson ease of access. For example, both banku with okra
and boiled yam with kontomire with fish, with meansof 2.5 and 2.6, respectively, have bimodal distributionsin which about one-third of the respondents areselecting easy access (ratings of 5 or 4), while nearlytwo-thirds are selecting difficult access (ratings of 1 or2). It is probable that the differences in the selectionof values reflect differences of proximity to largemarkets and stores from one neighbourhood toanother.
Distance is a component of ‘ease of access’. Formost people, having to travel a greater distance toobtain a service or goods reduces one’s perceptionabout how easy it is to acquire it. In a subset of 12respondents, we included distance in the ranking offactors that affect what they feed. The majority ofwomen selected intermediate values for the impor-tance of distance, compared with issues of health andcost. Two respondents gave it a high rank and onlytwo placed it last.
Comparing these rating with those of the twocereals provides another element to the interpreta-tion of the meaning of ‘distance’ and ‘ease of access’.In their ratings of Cerelac® and tom brown, three-fourths of these respondents gave Cerelac® the mostfavourable rating (5) on distance with a mean of 4.2,while the mean distance value for tom brown was 3.2.These ratings accord with the ‘ease of access’ ratingand indicate that the distance one has to go to buy afood relates to perceptions about how easy it is toacquire it.
The maps women drew, in which they located theplaces where they buy different kinds of food, confirmthe generalizations about distance.These showed thatkiosks where respondents purchase Cerelac® and thevendors from whom they buy ready-made porridgeare uniformly located a short, often very short,walking distance from their homes. On the otherhand, most of the women indicated that purchases ofingredients for family foods require a trip by trotro
(the local name for the jitney service, which is themajor source of public transportation). Typically,women make the trip to large markets once a week.On the maps, some women indicated the location ofsmaller stores and convenience stores, usually atgreater walking distance than the kiosks, where theyalso make some food purchases. The supplies formaking weanimix, or the mix itself, are sometimesobtained at the child welfare clinics, which alsoinvolves travel (with the baby) by trotro. A fewwomen reported that a relative (mother or sister)brings them the supplies they need to prepareweanimix.
Regardless of the challenges that women face inproviding foods for their children, ‘ease of access’ tofoods was ranked as the least important factor thatinfluenced our respondents’ choices about what theyfeed their children. Similarly, ‘distance’ was also gen-erally downgraded as a compelling factor, and evenconvenience is not overtly touted as being of primaryimportance. Some women, such as Estelle (quotedabove), felt these were not important influences.
On the other hand, the relationship of acquisitionto child caregiving is actually quite complex, andwomen often articulated the competing pressuresthey experience, and which they have to manage.Here are some examples: ‘If it is closer, I can get it intime and come back home to do other things. I needtime for the children’; ‘A short distance will give meample time to go and return to do other things’; ‘Withweanimix, I have to board a bus to be able to purchaseit. With Cerelac®, I just walk to the market to get it. Ineed time to be able to feed my child and take care ofher’; ‘Time is important to ensure that a child ishealthy’; ‘My child is like my eye. His health should bemy priority. Time is important; distance: I need to getback home in time to cook and take care of my child’.
These poignant, often trenchant, statementscapture critical aspects of food management from theperspective of acquisition.
Convenience
Another dimension of food management that isrelated to issues of ease of access and distance is‘convenience’. Convenience is a rather globalconcept, which may be defined differently by differentpeople. For some, ‘convenient’ means you can eat it‘on the run’. Some people regard foods that are readyto eat and need no refrigeration as convenient. Forothers, a hallmark of convenience is food thatrequires no cooking. ‘Convenient’ can also meanreadily purchased and requires no planning ahead.With our urban Ghanaian respondents, we did not tryto ‘unpack’ their various meanings of convenience.Instead, we asked them to rate foods for ‘conve-nience’, based on whatever meaning they personallygave to the term. Tables 6 and 7 show the results forthe convenience ratings.
Information on food preparation provides addi-tional insights for interpreting the meaning of conve-nience. We asked respondents to describe their foodpreparation techniques and procedures for the foodsthey give their IYC. Here are some examples for koko
and tom brown. One woman described her prepara-tion of koko as follows: ‘I bought and steeped the cornmyself, then I milled and fermented it. I took aportion of the dough, mixed it with some water andcooked in boiling water while stirring.’ Another said,‘I sieved the mixed corn dough, then I cooked it withwhintiaa. Before that, I bought corn and soaked it formilling’. A typical report on the preparation of tombrown (weanimix) was supplied by Mary: ‘I milledsome roasted corn, soya beans and groundnuts to getthe tom brown, then I mixed some with water andcooked in boiling water, stirring till cooked. After Iadded some milk and sugar.’
In contrast to the preparation methods for cerealsthat require cooking, the description of Cerelac®
preparation was uniformly short and simple. Twenty-one of the 30 respondents included a description ofthe preparation of Cerelac® in their narratives. Virtu-ally everyone said they emptied the content of a
packet into a bowl and added water; two womennoted that they use ‘hot water’, 14 women said thewater was ‘warm’, one woman described the water as‘cold’ and four of the respondents did not specify thewater temperature. It is not clear whether the water isheated to boiling and cooled or just warmed.
When it comes to convenience, only one food fromthe total of 22 foods in Tables 6 and 7 universallyreceived the same rating, and the highest rating:Cerelac® with milk. Cerelac® prepared with water didalmost as well, with a mean rating of 4.9. Next in line,with convenience means of 4.8 and 4.7, respectively,were millet porridge and millet porridge with milk.Notably, for the cereals, the lowest mean ratings onconvenience were for home-prepared tom brown andhome-fortified tom brown.
The explanation for the exceptionally high ratingand total agreement on Cerelac® involves severalfactors. The packets can be obtained quickly andeasily from neighbourhood kiosks.The product is soldin large tins, but also in small packets, and althoughthe price per unit of weight is high, individual packetscan be purchased with a small cash outlay. Anotheraspect of convenience is that it requires no cookingover fire. Although the majority of the women usewarm or hot water, this is often water that has beenstored in a thermos. Women do not have to heat up acharcoal brazier to prepare Cerelac®. It can literallybe purchased and fed ‘on demand’.Thus, it qualifies asa ‘convenience food’ par excellence. Millet porridge isalso very convenient because it can be purchasedready-made from a koko seller, and sellers are alsousually to be found very close to home.
The non-cereal foods routinely receive low ratingson convenience. Of all the items elicited from theinitial free listing of complementary foods for IYC,the popular tuozaafi (maize/cassava flour cooked intovery thick porridge-like paste) and banku (fermentedmaize and cassava dough cooked into thick paste/dumpling) with okra were given particularly lowratings on convenience. The descriptions women gaveabout their long and complex preparation techniquesfor these foods provide a clear explanation for theseratings. None of the food items in Table 7 are viewedas convenient. Even home-prepared tom brown,which had the lowest convenience mean of the por-
ridge, was marginally better than rice balls, the mostconvenient non-porridge infant food.
Conclusions
The purpose of this paper is to present a picture of thegeneral patterns of complementary feeding behav-iours in urban Ghana. The use of an ethnographicapproach provides insights not only into what caregiv-ers are giving, but also the factors that underlie theirbehaviours. Clearly, developing statistically supportedassessments of these factors in order to accuratelydescribe variability within the population, to obtainthe statistical distributions of these variabilities and toexamine their relative importance as determinants ofbehaviour requires other methods and other data.
In the study, we found that economic constraintsare critical, and cost is a primary concern. This is not‘news from the front’. In fact, this is what everyonewould expect. What is compelling is the finding thatfrom the caregivers’ perspective, the healthiness ofthe foods they give their children is also of primaryimportance. From their perspective, all foods are notequal and individual foods differ considerably withrespect to their ‘healthiness’. Providing foods thatpromote health is a central motivation. This createsdifficult problems for caregivers because the cheapestfoods are not seen as the healthiest ones. Whenmothers feed low-cost, traditional porridge, they feelthat they are not giving their children the best foodsfor their health.
Beliefs about the healthiness of foods are part of alarger complex of motivation that can be described as‘nurturance’. The New Oxford American Dictionarydefines nurturance as ‘emotional and physical nour-ishment and care given to someone’ and ‘the ability toprovide such care’. In this case, nurturance involvesnot simply the mothers’ ideas about foods for health;it includes a complex of beliefs and practices aimed atfurthering the health, well-being and development ofchildren. The voices of the mothers we have includedin this paper provide glimpses of this larger complexand its continuous importance for the women wetalked with.
Balancing the two competing determinants – costand nurturance – would be challenging enough, par-
ticularly when one considers the social constraints todecision-making that many women face, particularlyin relation to other adults in the household, primarilymale partners. But we found that a third sector ofdeterminants also plays a central role in thecaregiving/feeding equation – namely issues of timemanagement. These can be summarized by theconcept of ‘convenience’. As discussed above, this is acomplex notion that involves several different ele-ments related to women’s time management. Themultiple demands on women’s time, and the variousways in which they cope with these competingdemands, has been a matter of increasing interest andconcern in many sectors, ranging from social welfareand social action institutions to commercial activitiesand markets, as well as social and political analystsand investigators.
Convenience, as such, is not accorded a high placein the Ghanaian caregivers’ explicit value systems.But its importance for their decisions about what tofeed their IYC feeding is implicit in their behaviours,and in what they say about the challenges of timemanagement. They have to make difficult choices inwhich saving time for activities other than acquiringand preparing food for their IYC is often important,so important that they are willing to forego otherdemands on their scarce financial resources.
Nurturance, cost and time are the three vectors ofcomplementary feeding behaviour in urban Ghana.Are these three vectors uniquely applicable to urbanGhana, or are the dynamic interactions among themoperating in other cultures and environments?We suggest that this is a fruitful area for researchon complementary feeding behaviour and itsdeterminants.
Acknowledgements
We gratefully acknowledge the dedication, effectivefield research in Accra and thoughtful reflections ofour research team, Sawudatu Zakariah-Akoto,Hibbah Araba Saeed, Kuuku Biney, Evelyn Ofori-Temeng and Isaac Tuffuor. The development and pro-duction of visual materials for the cognitive mappingexercises was undertaken by Michael Mensah, and wethank him for his flexibility, as well as the excellent
drawings. Hudson Odoi took the photographs and DrGloria Folson made constructive input into this exer-cise. The Noguchi Institute for Medical Research pro-vided timely support.
We received many valuable insights and sugges-tions for the development of the Focused Ethno-graphic Study Manual from Prof Pertti J. Pelto, apioneer in the use of ethnography in public health, aswell as Dr Jonathan Siekmann, Dr Dominic Schofieldand Professor Jean-Pierre Habicht, all of whom pro-vided helpful critiques and feedback on the drafts ofthe manual and the methods.
Sources of support
The research in Accra was supported by the GlobalAlliance for Improved Nutrition, as was the develop-ment of the Focused Ethnographic Study manual onwhich the research is based.
Conflicts of interest
None.
References
Bodor J.N., Rice J.C., Farley T.A., Swalm C.M. & Rose D.(2010) Disparities in food access: does aggregate avail-ability of key foods from other stores offset the relativelack of supermarkets in African-American neighbor-hoods? Preventive Medicine 51 (1), 63–67.
Bostock L. (2001) Pathways of disadvantage? Walking as amode of transport among low-income mothers. Health &Social Care in the Community 9, 11–18.
Chatterjee M. (ed.) (1989) Women and nutrition. Specialissue. Food and Nutrition Bulletin 11.
Collinson C., Vandyck G., Gallat S. & Westby A. (2001)Urban market opportunities for high quality cassavaproducts in Ghana. Paper based on poster presented atthe International Society of Tropical Roots and TuberCrops: Africa Branch, 12–16 November.
Collinson C., Gallat S., Johnson P. & Westby A. (2003)Estimating potential urban demand: a case studyof the size of the Ghanaian domestic market forinstant fufu. Food Africa Internet Forum, 31 March–11April.
Larson N.I., Story M.T. & Nelson M.C. (2009) Neighbor-hood environments: disparities in access to healthy foodsin the U.S. American Journal of Preventive Medicine 36,74–81.
Manderson L. (1998) Applying medical anthropology inthe control of infectious disease. Tropical Medicine &International Health 3, 1020–1027.
Morland K., Wing S., Roux A.D. & Poole C. (2002) Neigh-borhood characteristics associated with the location offood stores and food service places. American Journal ofPreventive Medicine 22, 23–29.
Pelto G.H. & Armar-Klemesu M. (2010a) Balancinghealth, cost and convenience in feeding infants andyoung children in Accra. A report from a focused ethno-graphic study for gain for the purpose of assessing thefeasibility of a new commercial cereal. Global Alliancefor Improved Nutrition: Geneva.
Pelto G.H. & Armar-Klemesu M. (2010b) Assessing theBehavioral and Local Market Environment for a Com-mercial Complementary Food: a Focused EthnographicStudy Manual (First Edition). Global Alliance forImproved Nutrition: Geneva.
Pelto G.H. & Gove S. (1992) Developing a focused ethno-graphic study for the WHO Acute Respiratory InfectionControl Programme. In: Rapid Assessment Procedures:Qualitative Methodologies forPlanning and Evaluationof Health Related Programmes (eds N.S. Scrimshaw &G.R. Gleason), pp 215–226. International NutritionFoundation for Developing Countries: Boston, MA.
Pelto G.H., Levitt E. & Thairu L. (2003) Improvingfeeding practices: current patterns, common constraintsand the design of interventions. Food and Nutrition Bul-letin 24, 45–82.
Weller S.C. (2004) Measuring cultural beliefs: the culturalconsensus model. In: Encyclopedia of Social Measure-ment (ed. K. Kempf-Leonard), Vol. 1, pp 579–585.Elsevier/Academic Press: Oxford.
Formative research for the development of amarket-based home fortification programme for youngchildren in Nigermcn_352 82..95
Katie Tripp*, Cria G. Perrine*, Pascal de Campos†, Marily Knieriemen†, Rebecca Hartz*,Farah Ali‡, Maria Elena D. Jefferds* and Roland Kupka§¶
*Division of Nutrition, Physical Activity and Obesity, Centers for Disease Control and Prevention, Atlanta, Georgia, USA, †Helen Keller International, NigerCountry Office, Niamey, Niger, ‡UNICEF, Niger Country Office, Niamey, Niger, §UNICEF, West and Central Africa Regional Office, Dakar, Senegal, and¶Department of Nutrition, Harvard School of Public Health, Boston, Massachusetts, USA
Abstract
The objective of this formative research was to assess the acceptability of a micronutrient powder (Sprinkles®)and a lipid-based nutrient supplement (Nutributter®), and to explore people’s willingness to pay for theseproducts in a resource-poor context like Niger. In four sites, 84 focus group discussions among mothers, fathersand grandmothers of children 6–23 months were conducted, as well as 80 key informant interviews of motherswho participated in a home study where their children 6–23 months were given either Sprinkles® or Nutributter®
to use either for a period of 4 weeks, or they were given both products over the 4-week period, i.e. Sprinkles® for2 weeks and Nutributter® for an additional 2 weeks. The mothers understood how to use the products andgenerally used the products correctly. Both products were highly acceptable to adults and most children. InNiamey, where the 4-week home study used both products for 2 weeks each, the mothers tended to preferNutributter®. The mothers who used either product were pleased with the improvements they saw in theirchildren’s health, including increased appetite, weight gain and increased energy and activity. A few motherswere concerned with how they would be able to provide for their child’s increased appetite. Most participantsacross all four sites reported that they would be willing and able to afford to buy a single sachet of eitherSprinkles® at a cost of US$0.03 or Nutributter® at a cost of US$0.08 several times a week. This study providesevidence that both of these products were are highly acceptable in different settings in Niger and suggests thatdelivery of Nutributter® or Sprinkles® at a low or subsidized cost through a market-based system may be possiblein Niger, if an appropriate distribution system can be identified.
Correspondence: Katie Tripp, 4770 Buford Hwy NE, Mailstop K-25, Atlanta, GA 30306, USA. E-mail: [email protected]
The findings and conclusions in this report are those of the authors and do not necessarily represent the official position of the Centersfor Disease Control and Prevention.
The opinions and statements in this article are those of the authors and may not reflect official UNICEF policies. Additionally, neitherthe Centers for Disease Control and Prevention nor UNICEF endorse the products described here.
Introduction
Inadequate nutrition among young children is a sig-nificant global public health problem, with more thanone-third of deaths among children under the age of
5 years due to undernutrition (Black et al. 2008).Among children that survive, undernutrition haslong-term consequences including growth faltering,lower educational attainment, reduced economic pro-ductivity and poorer reproductive outcomes (Victora
et al. 2008).The key period for intervening to promoteoptimal growth and development of a child isthroughout pregnancy and during the first 2 years oflife (Victora et al. 2010). The World Health Organiza-tion recommends exclusive breastfeeding until 6months of age, at which point, breast milk alone is nolonger sufficient, and diverse complementary foodsneed to be introduced in addition to continued breast-feeding (WHO 2002). Throughout the developingworld, access to nutritious, energy-dense complemen-tary foods is generally limited.
Several products have been developed to increasethe nutrient intake of young children 6–23 months ofage. These include micronutrient powders (MNPs),such as Sprinkles®, and lipid-based nutrient supple-ments (LNSs), such as Nutributter®. MNPs have notaste or colour, which results in the ability to feedchildren the product without their knowledge. Thewholesale cost of a sachet of MNP typically costsabout US$0.02 per day1. A systematic review ofefficacy studies showed that Sprinkles® is very effec-tive at reducing iron deficiency, and decreases theprevalence of anaemia by half (Dewey et al.2009). Sprinkles® has not been shown to have a sig-nificant effect on growth but has been shown tohave an effect on motor development, as evidencedby an increased prevalence of children walkingat 12 months of age (Adu-Afarwuah et al.2008).
Nutributter® differs from Sprinkles® in that it pro-vides energy, fat (including essential fatty acids) andprotein, in addition to micronutrients. A daily servingof Nutributter® (20 g) provides about 100 calories,which is approximately one-half to one-quarter of thecalories needed from complementary foods for abreastfed child aged 6–23 months (Chapparro &Dewey 2010). Nutributter® has a sweet peanut taste,so it will affect the taste of any food that it is mixedinto; additionally, it can be eaten alone. A serving ofNutributter® is more expensive than Sprinkles®, at awholesale price of approximately US$0.08 per day2.LNSs have not been used or studied as extensively asSprinkles®. However, a few trials, one using Nutribut-ter® (Adu-Afarwuah et al. 2008) and others using asimilar LPS (Kuusipalo et al. 2006; Phuka et al. 2009),were shown to reduce iron deficiency and anaemiaand to improve growth and motor development(Dewey et al. 2009).
In Niger, the mortality rate for children under 5years is one of the highest in the world, at 198 deathsper 1000 live births. Among children 6–23 months,91% are anaemic, 49% are stunted and 18% arewasted (National Institute of Statistics and MacroInternational Inc 2007). Entirely free programmes areincreasingly unsustainable due to limited governmentand donor funds, and other approaches are needed tosupport nutrition interventions. Multiple partnerswere interested in investigating the possibility ofestablishing a market-based distribution of micronu-
1The cost of a sachet of Sprinkles® tends to range from US$0.015
to US$0.035 depending on volume produced and site of produc-
2One 20 g sachet of Nutributter® is estimated to cost US$0.08
(M. Zeilani, personal communication).
Key messages
• Deficiencies of macro- and micronutrients among young children in Niger are a public health concern.Strategies are needed to improve the nutritional adequacy of complementary foods in addition to supportingexclusive breastfeeding for children 0–6 months of age and continued breastfeeding for at least 2 years.
• Nutributter® was the preferred product, although both Sprinkles® and Nutributter® were well accepted bychildren 6–23 months and their mothers during a 4-week home study.The focus group participants also likedboth products but tended to prefer Nutributter®.
• Participants of the 4-week home trial and also the focus groups across all four sites were prepared to payseveral times a week for the products.
• Future studies should look at the use of home fortificants and their interaction with infant and young childfeeding practices.
Market-based home fortification programme in Niger 83
trient supplements designed for preventing undernu-trition among young children. Before developing sucha programme, extensive formative work was neededfor several reasons: (1) to update ethnographic workon infant and young child feeding; (2) to assess ifSprinkles® and Nutributter® were acceptable to thepopulation and if there were any problems with use;(3) to explore whether families would be willing topurchase preventive health items for young childrengiven families are accustomed to receiving free healthservices for children under 5 years of age; and (4) toexplore possible channels for a market-based distri-bution. The purpose of this paper is to describe theresults of the formative work related to the accept-ability of the products and the willingness of users topay for these products in a market-based system.
Methods
Location
Four sites with different levels of urbanization werechosen within two primary locations. Within Niamey,the capital, two sites were selected; Gamkalley, anurban industrial area, and Goudel, a peri-urban areawhere residents tend to be involved in some agricul-tural activities. In both of these sites, Djerma is thepredominant language used. In the second location,the district of Dogondoutchi in the Dosso region,Doutchi city and Soucoucoutane village wereselected, in order to get representation of a largertown and a very dry rural village, respectively. Thepredominant language spoken there is Hausa, whichis the principal language in Niger.
Qualitative data collection
Data collection occurred from July to November2009. Purposive sampling was used to identify theprimary target groups: mothers, fathers and grand-mothers of children 6–23 months of age. In each studysite, qualitative data collection techniques includedfocus group interviews, key informant interviews andobservations. All participants gave informed verbalconsent. After the informed consent, but before theinterviews began, demographic data were collectedfrom all participants. Bilingual or multilingual-trainedfemale data collectors conducted all interviews ineither Djerma or Hausa. During the interview, noteswere written in French as Djerma and Hausa are notgenerally written languages. The French notes werelater translated into English by a professional trans-lation company.
The content of seven focus group interview guidestailored for the three target groups centred on health,nutrition and feeding practices of young children;household dynamics related to resources’ decisionmaking and spending priorities; and reactions to thetwo products including taste, first impressions andcost (Table 1). For each topic and target group, threefocus group interviews with five to eight participantseach were carried out in each of the four sites, result-ing in a total of 84 focus group interviews.
Additionally, a 4-week home study was conductedamong 20 households with children 6–23 months ofage in each of the four sites,for a total of 80 households.All children 6–23 months within the selected house-hold were eligible to participate. A household list wasdrawn up in each of the four sites,and households were
Table 1. Summary of focus group interviews by topic and target group
No. Topic Target group Number of focusgroups in each site
Numbers of focusgroups in all sites
Guide 1 Health and nutrition Mothers of children 6–23 months 3 12Guide 2 Household dynamics Mothers of children 6–23 months 3 12Guide 3 Reactions to products Mothers of children 6–23 months 3 12Guide 4 Health, nutrition and household dynamics Fathers of children 6–23 months 3 12Guide 5 Reactions to products Fathers of children 6–23 months 3 12Guide 6 Health, nutrition and household dynamics Grandmothers of children 6–23 months 3 12Guide 7 Reactions to products Grandmothers of children 6–23 months 3 12Total 21 84
selected based on gender, age, and demographic andgeographical characteristics so that the householdswould be the representative of their community. Themothers were the respondents in key informant inter-views conducted at enrolment, midpoint and end ofthe home study. A household observation of mothersusing the product was also conducted during the mid-point visit. In each of the two sites in Doutchi, themothers received either Sprinkles®3 or Nutributter®4
but not both, to use daily for 4 weeks.In each of the twoNiamey sites, a crossover design was used, where par-ticipants were given both Sprinkles® and Nutributter®
to use for 2 weeks each. To ensure that the order inwhich the families received the products did not affecttheir impressions, the half started with Sprinkles®,while the other half started with Nutributter®.The twodifferent methods were used in order to allow somemothers a longer time to experience the products(Doutchi), while others would be able to directlycompare the products (Niamey).
Regimen and product information given toparticipants of the focus group interviews andthe 4-week home study
In both the focus group discussions and in the 4-weekhome study, participants were given informationabout the composition of the products. The fieldworkers read the following statement to the partici-pants regarding Sprinkles®: ‘Sprinkles® are a finepowder that contains several vitamins and mineralsthat can be mixed into a child’s food’; and regardingNutributter®: ‘Nutributter® is a peanut-based spreadthat is made from peanuts, oil, milk powder and sugar.It also contains several vitamins and minerals.Nutributter® can either be eaten on its own or it canbe mixed into food’. For both products, participantswere informed that Sprinkles® and Nutributter® havebeen used in various countries to reduce children’sanaemia, increase their appetite, increase their energyand, generally, improve their health.
During enrolment into the 4-week home study, fieldworkers demonstrated how to use the product, includ-ing opening the products and mixing them into asmall quantity of food, and explaining that the foodmixed with either product should best be used within30 min of mixing. The mothers were also instructedthat Nutributter® could be given directly withoutmixing it into food.
Due to concerns that supplemental iron may exac-erbate infections, particularly malaria, in iron-sufficient children, and that folic acid may interferewith the efficacy of antifolate, anti-malaria therapy(WHO Secretariat on behalf of the participants to theConsultation 2007), the Sprinkles® and Nutributter®
formulations used in this formative work were modi-fied to reduce iron content and remove folic acid. Theamount was reduced to be similar to supplying whatwould be found in normal complementary foods.Table 2 shows the nutrient content for both products.As a result of this change in the formulation, a twice-daily regimen for the products was used, in contrast toprevious studies that gave more iron and used theproduct only once per day. For Sprinkles®, themothers were instructed to mix one sachet into theirchild’s food twice per day (two sachets per day total).For Nutributter®, mothers were instructed to eithermix into food or give directly to their child one sachetper day, splitting the sachet so as to give half in themorning and half in the afternoon or evening.
For both products, participants were given detailedinformation and demonstration on how to use theproducts.They were also advised that they may noticetheir child’s stool becoming darker or that he or shehas loose stools for a few days, which was normal.
Data management and analysis
English transcripts of all data were uploaded intoNvivo 8 (QSR International, Cambridge, MA, USA).Three authors (K.T., C.P. and B.H.) read all the tran-scripts and coded and analysed the data. Interviewswere first coded by questions and then for key themes.At least two authors coded and analysed each sectionof data, and the discrepancies were resolved by dis-cussion. Key quotes were identified that representedthe majority’s view. Analyses were initially stratified
3The Sprinkles® used in this study was manufactured by
Hexagon Nutrition, Mumbai, India.4The Nutributter® used in this study was manufactured by
Nutriset, Malaunay, France.
Market-based home fortification programme in Niger 85
by site and target group; and results were combinedwhere there was little difference across sites, andunless otherwise noted, results being presented werefound to be consistent across sites.
Ethical review
Ethical approval was obtained from the Niger Minis-try of Health. Additionally, the United States Centersfor Disease Control and Prevention determined thatthe project was consistent with the standards forpublic health practice.
Results
In total, 84 focus group discussions were held with acombined total of 232 mothers, 130 fathers and 147grandmothers.
The average age of all mothers participating in thefocus group discussions was 27 years (range 15–47).The majority had no primary education. Ninety-threeper cent of mothers were married, of which, 28% werein a polygamous marriage. The average age of fatherswas 39 years (range 24–65); all were married and 19%were polygamous. The average age of grandmotherswas 58 years (range 30–110).
Key informant interviews were conducted with 80mothers who participated in the 4-week home study.Of these, 77 completed all three interviews at enrol-ment, midpoint (plus observation) and exit. Of the 83children enrolled in the 4-week study, 36 werebetween 6 and 12 months of age (Table 3).
Purchase of special items for young children
Many families do buy foods or treats specifically foryoung children that are apart from the family bowl orwhat is given to older children. The money usuallycomes from the father, but if the father does not havemoney, many mothers do have some form of incomegeneration, such as extraction of peanut oil or sellingfritters, and they will use this money to buy foods foryoung children. The foods purchased for young chil-dren include Solani (liquidy yogurt), bean fritters,bananas, potatoes, eggs, cookies, oranges and cannedmilk. Families, especially in both Niamey sites andDoutchi city with access to vendors, often buy thesesmall quantities of food multiple times throughoutthe day, with the cost of each item usually rangingfrom 25 CFA to 125 CFA (US$0.06–US$0.25). Thereason they gave for buying these foods for youngchildren was to promote the child’s growth, healthand nutrition.
In all sites, except for Soucoucoutane (ruralvillage), participants said that they purchase preven-tive health products. These included mosquito nets,nivaquine and paracetamol (acetaminophen) formalaria, Grandibien® (similar to Nutributter® exceptthat it has cocoa rather than peanut base and is tar-geted towards slightly older children) and Misola(local fortified complementary cereal for children).In Soucoucoutane, many of the participants saidthey do not purchase preventive health productsbecause mosquito nets are free and there are no
Table 2. Nutrient composition of Sprinkles® and Nutributter® used inthis study
Nutrient Sprinkles®
(total per day –two sachets)
Nutributter®*(total per day –1 ¥ 20 g sachet)
Vitamin A (vitamin A acetate) 300 mcg 0.4 mgVitamin B1 (thiamin
other preventive health products available in thevillage.
Product acceptability
Both Sprinkles® and Nutributter® were found to beacceptable and beneficial in all four sites.At the end ofthe home study in Doutchi, where mothers used onlyone of the products for the entire 4 weeks, all mothersliked the product that they used and would continue touse that product if it were available locally.
In response to Sprinkles® one mother said, ‘I sawthe usefulness of Sprinkles® and I would recommendall mothers look for it for their children. And if it ispossible, we would like it to be available on themarket as soon as possible’ (Mother in Doutchi,4-week study). Mothers said that Sprinkles® was easyto use, and several liked that the product had no tasteor smell and did not change the taste of the food. Abarrier that was encountered to using Sprinkles® isthat food is required for the Sprinkles® to be mixedinto. In Soucoucoutane, there were instances where amother was not able to give her child Sprinkles®
because she simply did not have any food.Regarding Nutributter® a mother said, ‘all that I
want to say is to thank you for having given ourchildren these very important foods. Really, we saw itsimportance and we appreciate it a lot’ (Mother inSoucoucoutane, 4-week study). Few participantsfound Nutributter® unacceptable.
For both products, a few mothers mentioned thatthey disliked the fact that their children had loose
stools in the first few days of use. However, most alsosaid that because they were warned about this sideeffect, they were not concerned.
Overall, there were very few concerns for eitherproduct.When asked if the participants had any ques-tions or concerns about using the products, the topicsraised regarding the use of Sprinkles® and Nutribut-ter® are presented in Table 4.
Perceived effects of products
Participants in the home study reported noticingchanges in their children within the first 2 weeks ofusing Sprinkles® and Nutributter®. In Doutchi, wherechildren only used one product for the entire 4 weeks,the same effects were noticed by mothers of childrenusing Sprinkles® and those using Nutributter®.Almost all mothers in the home study in all sites,regardless of the product they used, reported someincrease in appetite or weight gain in their child.‘Before I bought my daughter boule [millet-basedporridge] for 25 CFA [US$0.06 at the time of thestudy] for the whole day, but with the use ofSprinkles® she eats boule for 50 CFA [US$0.12] a day’(Mother in Goudel, 4-week study).
Many mothers reported that the weight gain in thechild was noticed not only by themselves, but also byfamily and community members. Describing theweight gain of her daughter, one mother said, ‘At firstwhen she was 5 months she weighed 3 kg. Then [myhusband] did not pick her up because she was all lean.But now since she has gained weight he always picks
Table 3. Characteristics of 80 mothers and 83 children participating in the 4-week home study
Variable Site
Dogondouchi Niamey
Douchi Soucoucoutane Goudel Gamkalley
Mean age of mothers (years) (range) 30.5 (19–45) 25.7 (16–40) 33.1 (21–48) 26.9 (18–37)Mean age of infants (months) 13.2 12.7 13.6 16.2Number of infants 6–11 months of age 9 10 11 6Mean HH size 9.0 11.0 8.7 7.9Received primary education % 55 10 45 60Polygamous marriage % 45 40 35 5Work outside the home % 75 40 55 35
HH, (Household), the basic residential unit in which activites are organised and carried out.
Market-based home fortification programme in Niger 87
her up’ (Mother in Gamkalley, 4-week study).Mothers also reported that they noticed increasedenergy and strength in their children, and that theirchildren were more likely to interact and play withother children.
Several mothers reported that at the start of thestudy, their child had darker stools and some milddiarrhoea. Most said that this did not worry them asthey were told that this might happen. Some mothersfelt that the diarrhoea was a sign that the productswere working and that the body was getting rid of‘bad blood’. Overall, the reported changes were per-ceived as very positive even though a few motherswere worried about where they would get enoughfood to satisfy their child’s improved appetite.
Twice-daily use
No mothers reported having any trouble remember-ing to give the products twice daily. All mothers withchildren enrolled in the home study understood
either to give two sachets of Sprinkles® per day or tosplit the sachet of Nutributter® into two daily doses.The mothers did not like having to split a single sachetof Nutributter® into two doses as they felt that it wasdifficult to correctly portion out half of the sachet, andthey felt that it was unhygienic to leave the sachetopen for the day. The mothers who gave their childSprinkles® twice a day were asked if they wouldprefer a single administration per day rather than two,independent of cost implications. Most mothers saidthat they would rather give two a day. Some com-mented that if the child wasted some food with theSprinkles® in it, they felt relieved that they would beable to give their child more Sprinkles® later in theday. However, a few mothers felt that one sachet perday would be easier to remember.
Feeding practices
Many of the children enrolled in the 4-week study ateboule (millet-based porridge), and some also ate fromthe family dish. Many mothers also reported prepar-ing special foods for their child such as bean soup,eggs, fritters, fruit and occasionally, pasta, rice andentrails. Nearly all mothers of children enrolled in thehome study reported that their child already had theirown bowl prior to the study and that they were gen-erally fed from an individual bowl vs. the communalbowl. Few mothers had to buy or borrow any addi-tional equipment to utilize either the Sprinkles® orNutributter®; nine of the 59 participants (15%) thatused Sprinkles®, and three of the 56 participants (5%)that used Nutributter® at some point in the 4-weekstudy said that they had to purchase something to beable to use the product.The items purchased includedbowls, plastic cups, spoons and ladles. Mothersreported that bowls cost about 125 CFA (US$0.22),and spoons were about 50–75 CFA (US$0.09–US$0.13). All the mothers thought that this cost wasacceptable and affordable for most families.
Observation of actual use of products
Nutributter®
During the home study, 37 mothers who receivedNutributter® were observed in the household feeding
Table 4. Questions/concerns about use of Sprinkles® and Nutribut-ter® among mothers participating in the 4-week home study
Questions asked about both products
Is it necessary to take my child to the health centre if their softstools/mild diarrhoea persists?
What would happen if my child consumed too much of theproduct at one time?
Will my child’s health suffer when the study ends and there areno more products?
Will using the product prevent anaemia even if the childbecomes sick while using the product?
What will happen if I forget to give my child the product everyday?
What will happen if I give my child food mixed with the productafter 30 mins has passed?
Where can I buy more and how much will it cost?
Questions asked about Sprinkles®
Can Sprinkles® make the body swell?Can I give my child two sachets in one meal?
Questions about Nutributter®
Can you give one bag in one go rather than splitting it?Will my child’s increased appetite continue once the
their child. Most mothers opened the sachet using arazor blade, their teeth or scissors. Most children whowere fed Nutributter® directly were given it on aspoon, from their mothers’ fingers or squeezed ontothe child’s hand. Most mothers gave the right amountof Nutributter®; only one mother gave the child morethan the instructed half of the sachet. One mothergave a little of the Nutributter® to an older child whowas asking for some. All children who ate theNutributter® mixed into food were given the foodimmediately after the Nutributter® was mixed in. Ofthe 16 children who had Nutributter® mixed into theirfood, four did not finish the food mixed with Nutribut-ter®. Only 2 of the 21 children eating it directlyrefused to finish all the Nutributter®.
Sprinkles®
Of the 38 mothers who were observed usingSprinkles®, three children refused to eat their foodmixed with Sprinkles®. Nearly all of the mothers usedthe Sprinkles® correctly, mixing the whole sachet intoa small quantity of food in bowl or cup and feeding itto the child immediately. In Soucoucoutane, onemother used a sachet of Sprinkles® that was alreadyopened; one mother prepared the Sprinkles® with avery dirty spoon; and one mother used a very dirtycup.All of the children were fed the food immediatelyafter the Sprinkles® had been added.
Intention to use and reported use of Nutributter®
At the beginning of the home study, mothers wereasked how they intended to give Nutributter® to theirchild. Most mothers said that they intended to mix itinto boule or some other kind of food. Severalmothers also said they would give it to their childdirectly because their child liked sweet foods. A fewmothers said that they would try it both ways and seewhich way the child preferred.
Of 37 households with Nutributter® available onthe day of the observation visit, 21 children weregiven the Nutributter® directly and 16 children had itmixed into their food. Of the 37 households, 18 chil-dren were between 6 and 12 months of age. Of those18 children, 10 were given the product directly and
eight had it mixed into their food. Four out of the 18children did not finish their Nutributter® or boulemixed with Nutributter®.
The results from the interviews at different timepoints revealed that although most mothers hadintended to mix the Nutributter® into food, moremothers ended up giving the Nutributter® directly.Several mothers reported that they started feedingthe child Nutributter® one way and then changed.Themain reasons mothers gave for changing from directfeeding to mixed with food are as follows:
• child refused the Nutributter® directly; and• child could not eat it easily alone.
The main reasons for switching from mixed withfood to direct feeding are as follows:
• child refused boule with Nutributter®;• child prefers to eat Nutributter® directly;• child did not finish boule and Nutributter® waswasted; and• it was easier for the mother to just give theNutributter® to the child to feed himself.
Sharing and pressure to share
During the course of the 4-week study, several womenexperienced pressure to share either Nutributter® orSprinkles®.Women in both sites in Doutchi seemed toexperience more pressure than women in the twoNiamey sites. Pressure to share was mainly from olderchildren in the household and neighbours. In a fewhouses, the co-spouse and other family members alsopressured the mother to share. During the course ofthe observations, the field workers also witnessedseveral instances where women were pressured toshare. Most women did not share and told those pres-suring her that the sachets were counted and were forher child only. Overall, five of the 80 mothers reportedgiving product away to other people, this includedboth Sprinkles® and Nutributter®. In two households,some of the products were stolen from the household.
Product preferences
In the two Niamey sites, children enrolled in the4-week study were given a 2-week supply of
Market-based home fortification programme in Niger 89
Sprinkles® and a 2-week supply of Nutributter®. Irre-spective of the order of receiving the products, themajority of mothers (27 out of 37, 73%) said that ifthey were given the opportunity to select a product tocontinue using, and if it was to be given for free as itwas in the home study, they would select Nutributter®.Ten mothers selected Sprinkles®. Out of the 37mothers who responded to the question on productpreference, 15 had a child between 6 and 12 months ofage. Of those 15 mothers, 13 preferred Nutributter®,and two preferred Sprinkles®. One mother said shewould select Sprinkles® because it was cheaper thanNutributter®, the other said that she would select itbecause the child would not realize that it had beenmixed into the family dish. The main reasons the par-ticipants in the two Niamey sites gave for preferringone product over another is presented in Table 5.
When asked which product they would buy if bothproducts were available on the market, the majorityof women still selected Nutributter® (25 out of 37).However, two mothers who had said they preferredNutributter® said they would choose to buySprinkles® because it is cheaper.
Willingness to pay
Nutributter®
At the end of the home study, mothers were askedhow much they would be willing to pay for a sachet of
Nutributter®. The reported median price mothers inNiamey were willing to spend was 100 CFA (US$0.22,range US$0.05–US$1.05), and 50 CFA (US$0.11,range US$0.02–US$0.63) in Doutchi. When asked ifthey thought that 35 CFA (US$0.08) was a reasonableprice for a sachet of Nutributter®, 54 out of 57 (95%)mothers who had used Nutributter® said they wouldbe willing to purchase Nutributter® at that price.
Sprinkles®
Mothers who used Sprinkles® during the home studywere asked how much they would be willing to payfor a sachet of Sprinkles®. The median reported thatthe price in Niamey was 50 CFA (US$0.11, rangeUS$0.050–US$1.05), and 25 CFA (US$0.06, rangeUS$0.02–US$0.73) in Doutchi. When asked if theythought that 15 CFA (US$0.03) was a reasonableprice for a sachet of Sprinkles®, reminding them thatit was recommended to use two sachets per day, 57 of58 (98%) said they would be willing to purchase it atthat price.
There was no marked difference between whatpeople were willing to pay for either product aftertrying the product in the home study compared withjust seeing a demonstration of the product during thefocus group discussions. Most women said that theywould either ask their husbands for money to pay forthe product or use their household money or themoney they generated themselves from their smallbusiness. Women in Doutchi city said that they woulduse their own money to buy the products more oftenthan women in the other sites.
Distribution locations
When asked where Sprinkles® or Nutributter® shouldbe sold, a variety of answers were given. The primaryplaces that people mentioned were pharmacies andhealth centres. Both of these were described as placesthat could be trusted not to sell expired products, andwhere the products would be protected from heat anddust. Additionally, pharmacies were described asplaces where set prices could be counted on; andhealth centres are where mothers are used to receiv-ing counselling about child feeding and nutrition.
Table 5. Among mothers who used both Sprinkles® and Nutributter®
for 2 weeks each, these are the reasons the participants gave forpreferring one product over the other
Primary reasons for selecting Nutributter®
Sweet taste that the child likedAbility to either mix the product or use directlyNutributter® worked better than Sprinkles®
The child can eat it by himself
Primary reasons for selecting Sprinkles®
There is no taste and can be mixed into the family food withoutthe child knowing
Stores and street vendors appealed to some becausethey are prolific, and even young children could besent with money to purchase the product. Largerstores were also described as appealing because theywere protected from the elements. A few participantssuggested having the chief of the area or village sellthe products as he is a respected authority figure, andeveryone knows where he lives and could go for moreproducts.
Most people said that they would be willing totravel up to 5 km to buy either Nutributter® orSprinkles® but that it would be difficult to travel morethan 5 km on foot. People who could afford to taketaxi motorbikes were prepared to travel much further(15–20 km).
Discussion
Overall, most participants in the focus group discus-sions and 4-week home study were enthusiastic aboutboth Sprinkles® and Nutributter®. Several otherstudies have also found Sprinkles® to be acceptable toparents and children (Christofides et al. 2006; Adu-Afarwuah et al. 2008; Jefferds et al. 2010), with lessdata available for Nutributter® as it is a newerproduct (Adu-Afarwuah et al. 2010; Hess et al. 2010).In the present study, mothers using the products wereparticularly pleased with the improvements they sawin their children’s health. For both products, almost allmothers perceived that their child had an increasedappetite and had gained weight, and many also com-mented on their child’s increased energy and activity.A few mothers were concerned with how they wouldbe able to provide for their child’s increased appetite.However, overall, these changes in appetite were con-sidered very positive. Similar concerns with increasedappetite have been reported during formativeresearch for a market-based Sprinkles® interventionin Western Kenya, where increases in household foodcosts due to increased appetite turned ‘a positive andvalued effect into a potential problem’ (Jefferds et al.2010). However, after 8 months of implementing theSprinkles® study in Western Kenya, monitoring datashowed that this was not a widespread problem asonly 5% of mothers reported that increased appetitewas a barrier to Sprinkles® use (Jefferds et al. 2009).
The results from this formative work suggest thateven though this Nigerian population is very poor,some people are willing to buy products like Nutribut-ter® and Sprinkles® for their children. Dewey foundsimilar results in a study comparing three fortifiedproducts in Ghana (Dewey et al. 2009), suggesting thatin some populations, people would be willing to pur-chase small quantities of products needed for in-homefortification. One possible weakness of this study isthat the participants were informed about some of thepotential benefits of the products, including increasesin appetite and activity, and a reduction of vitamin andmineral deficiencies, and this may have affected somepeople’s perceptions about the products and their will-ingness to pay. Despite this, it was felt necessary toprovide some general information on their use so thatparticipants would not fear using the products or thinkthat the products were being tested on them.
Most families across all four sites reported that theywould be able to afford to buy Nutributter® at a costof ~US$0.08 or Sprinkles® at a cost of ~US$0.03several times a week. Families in Soucoucoutane, themost rural site included in the study, were also willingto buy the products. However, when asked how muchthey would be prepared to pay on a daily basis, theytended to propose a unit price that was lower thanthose proposed in the other sites and said that theywould purchase the product when they were able to,but that they did not always have extra money. Sou-coucoutane is a more rural and food-insecure part ofNiger and resembles the majority of the country moreclosely than Niamey. If a market-based system was tobe established, prices may need to be subsidized forthe poorest families or for people living in the poorestareas, as it is unlikely that the most vulnerable couldpurchase the products at full cost, especially onceoverheads and marketing costs are built into theprice. The base price of Sprinkles® (depending onmanufacturer) is about US$0.03 per sachet, and theprice for Nutributter® is about US$0.08 per sachet.With overheads built in, the price is likely to double.Furthermore, if it is determined that children shouldtake two sachets a day to maximize the amount ofiron a child can consume in a day, without deliveringmore iron than fortified complementary foods, thecost could be even more.
Market-based home fortification programme in Niger 91
Another concern is whether the use of MNP orLNS products containing lower doses of iron wouldbe efficacious if only purchased a few times a week. InBangladesh, a flexible administration of Sprinkles®
led to better adherence and higher anaemia cure ratescompared with daily administration (Ip et al. 2009). Ina market-based system in Kenya, purchasing and con-suming Sprinkles® about once per week was relatedto anaemia reductions in children (Suchdev et al.2009). However, in both of these studies, the MNPused contained 12 mg of iron vs. the 6 mg used in thisformative work. It is not certain that the efficacy offlexible administration would be replicated if lower-dose iron content MNP and LNS are used. Currently,there are several ongoing studies looking at the effi-cacy of lower doses of iron in products such as MNP.Depending on the results from these studies and theongoing systematic review of the association betweeniron intake and mortality in malaria-endemic areas,recommendations for future programs using MNPand LNS could change substantially. Additionally, itshould be noted that while this study explored twopotential home fortification products, there are avariety of other fortification products available thatwere not included in this assessment. The selection ofthese products was purposeful but should not implythat these products are superior to others available, orthat they are the most appropriate for this setting.
Despite concerns that many families would not beable to afford these products, even at a very low cost,our interviews and home visits show that most fami-lies are already used to buying special foods for theiryoung children, such as yogurt, eggs, bean fritters,oranges and candies. While Sprinkles® is a powderthat must be added to other food, Nutributter® is asweet peanut-based spread that can either be mixedinto food or that children can eat separately and couldbe similarly categorized as some of the sweet itemsalready being purchased for children. It is not clear ifNutributter® was available for purchase, whether itwould be bought in addition to or instead of thesespecial foods, or which special foods the Nutributter®
might displace. Further work is needed to addressthese issues adequately. The considerable concern forchildren’s nutritional status and correspondinghealth, combined with the fact that families already
regularly buy special foods for young children, sug-gests that it is likely that many families would bewilling to purchase Sprinkles® or Nutributter® fortheir children if the products were available in thecommunity. However, although the results from thisformative work suggest that families would be willingto pay for these products on a frequent basis, there isno certainty as to what extent willingness to pay willtranslate into actual purchasing behaviour. Researchis limited in this area in relation to nutritional prod-ucts, but there have been several studies that havelooked at hypothetical and actual willingness to payfor health-related products such as insecticide-treatedbednets (ITNs) (Onwujekwe et al. 2001). The resultsfrom Onwujekwe’s study in Nigeria found that 76%of people that were hypothetically willing to pay forITNs actually purchased them. Factors such as thenumber of people living in the household, sex andannual expenditure on gifts affected people’s actualwillingness to pay. Prior exposure to free ITNs wasnegatively associated with actual willingness to pay.Further work would be necessary in Niger to deter-mine actual purchasing behaviour and to be able todetermine the optimal price to charge for the prod-ucts or the level of subsidy to include.
Other studies in Niger on people’s willingness topay for health-related products, such as condoms andwater purification, have found that a major barrier,affecting not only the price but the availability of theproducts, is the lack of a well-developed system fordelivering products. Since 2003, the German Devel-opment Corporation (GTZ) has been promoting theuse of condoms through Animas-Sutura using a socialmarketing approach. While they have found thatpeople are willing to purchase condoms at aroundU$0.05 per condom, a major barrier has been distri-bution (German Development Corporation 2009).This problem has also been encountered by Sociétéde Transformation Alimentaire5, who has been pro-ducing and selling a micronutrient-fortified cocoa andmilk-based product called GrandiBien® since 2007(Fernandez et al. 2009). GrandiBien® has been suc-cessfully marketed and distributed in Niamey, and
5Société de Transformation Alimentaire is a partner of Nutriset
formative research has demonstrated that mothersvalue the product and are aware of its beneficialeffects on children and regularly purchase it.However, scaling up the approach to more rural areasof the country has been challenging. Even if the dis-tribution system is made as efficient as possible, thepopulation is scattered over a very large territory andcosts will be higher than in more populous and urban-ized settings. The results from this analysis suggestthat in addition to transporting the products into ruralareas, other factors such as product quality (includingexpiration and protective packaging), credibility ofthe vendor and protection of the distribution sitefrom environmental conditions may affect willingnessto purchase.
Both products were well liked, but mothers gener-ally preferred Nutributter® to Sprinkles®. AlthoughNutributter® was preferred, many people dislikedsplitting the sachet, and a single sachet would beadvisable in the future. Despite concerns that askingmothers to give the product twice a day would beburdensome or reduce adherence, most mothers hadno difficulties giving the products to their childrentwice a day.
Most people said that they would prefer to buythese products in pharmacies or health centres, as theproducts will be better protected and are less likely tobe expired, and prices will be fixed.The main problemwith selling the products in pharmacies is that phar-macies are less common in rural areas. Selling theproducts in health centres may also be problematic asthe health care system in Niger provides free healthcare for children less than 5 years of age, and motherswould expect products given to their children to befree. If these products were to be sold in Niger, it islikely that they would have to be sold from a variety oflocations that both ensured the quality of the productas well as the accessibility to remote populations.
Limitations of this analysis include that data wereonly collected in two main areas of Niger that may notnecessarily be representative of other parts of thecountry, particularly more food-insecure areas. Datawere collected, transcribed and analysed in four dif-ferent languages, and it is possible that some intentionor meaning was lost in some places. Additionally,social desirability may have influenced participants’
responses. This analysis also has multiple strengths.We used rigorous methodology including training andpiloting to test the interview guides and standardizethe research assistants, back translations of guides andmultiple reviews of notes. Data were collected in dif-ferent areas of rural and urban Niger from multipletypes of informants, including mothers, fathers andgrandmothers. Finally, all of this extensive formativework was done to aid in the development of a pro-gramme. Often, programmes do minimal or no forma-tive work to understand the local context.
This study did not assess specific breastfeeding orcomplementary feeding behaviours during the4-week home study and is thus unable to determinehow these behaviours may have been impacted by theintervention. It is important that any future pro-gramme carefully monitor usage of the products,including that children of the appropriate age areusing the product and that the product is not interfer-ing with other recommended feeding behaviours.While the intention of this formative work was todevelop a market-based distribution system, promo-tional materials should still include messages andother strategies to support good hygiene practicesand recommended infant feeding behaviours, includ-ing how these products should be a part of a broaderbreastfeeding and complementary feeding context.
The findings from this formative work suggest thateither Nutributter® or Sprinkles® would be wellaccepted but that overall, Nutributter® would be thepreferred product, even though it is more expensive.To ensure that the most vulnerable populations haveaccess to the products, it may still be advisable toconsider using these products on a larger scale, possi-bly using a mix of distribution mechanisms that mayinclude free, subsidized and/or market-based distribu-tion given that (1) nutritional deficiencies between 6and 23 months lead to irreversible damage; (2) MNPand LNS can effectively address some of these defi-ciencies; and (3) these products are acceptable.Further work is needed to determine what distribu-tion system(s) could be used, especially in the morerural and inaccessible areas of the country. Workingwith other social marketing programmes alreadyestablished in Niger could provide an excellentopportunity to market nutritional products such as
Market-based home fortification programme in Niger 93
these alongside other health-related products. Anysystem promoting the use of products such asSprinkles® or Nutributter® should be integrated into acomprehensive infant and young child nutrition strat-egy to ensure that breastfeeding and other comple-mentary feeding interventions are supported.
Acknowledgements
This work was administered under a cooperativeagreement between UNICEF and the Centers forDisease Control and Prevention with Helen KellerInternational as an implementing partner, and withsupport from the Directorate of Nutrition at theNiger Ministry of Health.
Special thanks to Mamane Zeilani and VirginieClaeyssens of Nutriset and Vikram Kelkar ofHexagon for working with us to procure the Nutribut-ter® and Sprinkles® for this project.We are grateful tothe logistics coordinator, interviewers, typist anddrivers for all of their hard work, and to the familieswho participated in this project.
Conflicts of interest
The authors have no financial relationships or con-flicts of interest to disclose.
References
Adu-Afarwuah S., Lartey A., Brown K.H., Zlotkin S.,Briend A. & Dewey K. (2008) Home fortification ofcomplementary foods with micronutrient supplements iswell accepted and has positive effects on infant ironstatus in Ghana. The American Journal of Clinical Nutri-tion 87, 929–938.
Adu-Afarwuah S., Lartey A., Zeilani M. & Dewey K.G.(2010) Acceptability of lipid-based nutrient supplements(LNS) by Ghanaian infants and pregnant or lactatingwomen. Maternal & Child Nutrition 86, 1–13.
Black R.E., Allen L.H., Bhutta Z.A., Caulfield L.E., DeOnis M., Ezzati M. et al. (2008) Maternal and childundernutrition: global and regional exposures and healthconsequences. Lancet 371, 243–260.
Chapparro C.M. & Dewey K.G. (2010) Use of lipid-basednutrient supplements (LNS) to improve the nutrientadequacy of general food distribution rations for
vulnerable sub-groups in emergency settings. Maternal &Child Nutrition 6, 1–69.
Christofides A., Asante K.P., Schauer C., Sharieff W.,Owusu-Agyei S. & Zlotkin S. (2006) Multi-micronutrientSprinkles including a low dose of iron providedas microencapsulated ferrous fumarate improveshaematologic indices in anaemic children:a randomized clinical trial. Maternal & ChildNutrition 2, 169–180.
Dewey K.G., Yang Z.Y. & Boy E. (2009) Systematicreview and meta-analysis of home fortification ofcomplementary foods. Maternal & Child Nutrition 5,283–321.
Fernandez A.B., Sauguet I., Da Costa F., Claeyssens V.,Lescanne A. & Lescanne M. (2009) Social marketing ofa nutritional supplement in Niger. Field Exchange 35(online only).
German Development Corporation (2009) Social market-ing for health and family planning: building on traditionand popular culture in Niger.
Hess S.Y., Bado L., Aaron G.J., Ouédraogo J.B., Zeilani M.& Brown K.H. (2010) Acceptability of zinc-fortified,lipid-based nutrient supplements (LNS) prepared foryoung children in Burkina Faso. Maternal & Child Nutri-tion 15 [epub ahead of print. doi: 10.1111/j.1740-8709.2010.00287.x].
Ip H., Hyder S.M., Haseen F., Rahman M. & Zlotkin S.H.(2009) Improved adherence and anaemia cure rates withflexible administration of micronutrient Sprinkles: a newpublic health approach to anaemia control. EuropeanJournal of Clinical Nutrition 63, 165–172.
Jefferds M.E.D., Ruth L.J., Obure A., Ogange L., OwuorM. & Suchdev P.S. (2009) Monitoring acceptability andknowledge of Sprinkles among Luo families in WesternKenya: the Nyando Integrated Child Health and Educa-tion Project (NICHE). Abstract from Beijing Micronu-trient Forum.
Jefferds M.E.D., Ogange L., Owuor M., Cruz K., Person B.,Obure A. et al. (2010) Formative research exploringacceptability, utilization, and promotion in order todevelop a micronutrient powder (Sprinkles) interventionamong Luo families in western Kenya. Food & NutritionBulletin 31, S179–S185.
Kuusipalo H., Maleta K., Briend A., Manary M. & AshornP. (2006) Growth and change in blood hemoglobin con-centration among underweight Malawian infants receiv-ing fortified spreads for 12 weeks: a preliminary trial.Journal of Pediatric Gastroenterology & Nutrition 43,525–532.
National Institute of Statistics and Macro InternationalInc. (2007) Demographic Health Survey of Niger 2006(in French). Calverton: MD, USA.
Onwujekwe O., Chima R., Shu E., Nwagbo D. &Okonkwo P. (2001) Hypothetical and actual willingness
to pay for insecticide-treated nets in five Nigerian com-munities. Tropical Medicine & International Health 6,545–553.
Phuka J.C., Maleta K., Thakwalakwa C., Cheung Y.B.,Briend A., Manary M.J. et al. (2009) Postinterventiongrowth of Malawian children who received 12-modietary complementation with a lipid-based nutrientsupplement or maize-soy flour. The American Journal ofClinical Nutrition 89, 382–390.
Suchdev P., Ruth L., Mandava U., Quick R., Mbakaya C.,Kaduka L. et al. (2009) Effectiveness of Sprinklessales in Western Kenya in reducing childhood anemiaand iron deficiency. Abstract Beijing MicronutrientForum 2009.
Victora C.G., Adair L., Fall C., Hallal P.C., MartorellR., Richer L. et al. (2008) Maternal and child
undernutrition: consequences for adult health andhuman capital. Lancet 371, 340–357.
Victora C.G., De Onis M., Hallal P.C., Blossner M. &Shrimpton R. (2010) Worldwide timing of growth falter-ing: revisiting implications for interventions. Pediatrics125, 473–480.
WHO (2002) Complementary feeding: report of the globalconsultation, and summary of guiding principles forcomplementary feeding of the breastfed child. WHO:Geneva.
WHO Secretariat on behalf of the participants to theconsultation (2007) Conclusions and recommendationsof the WHO Consultation on prevention and controlof iron deficiency in infants and young children inmalaria-endemic areas. Food & Nutrition Bulletin 28,S621–S627.
Market-based home fortification programme in Niger 95
Implementation of a programme to market acomplementary food supplement (Ying Yang Bao)and impacts on anaemia and feeding practices inShanxi, Chinamcn_353 96..111
*Institution of Nutrition and Food Safety, China CDC, Xuanwu District, Beijing, China, †Capital Institute of Pediatrics, Chaoyang District, Beijing, China,‡Global Alliance for Improved Nutrition, Geneva, Switzerland, and §China CDC Xuanwu District, Beijing, China
Abstract
In China, a full fat soy powder mixed with multiple micronutrient powders (Ying Yang Bao (YYB)) wasdeveloped, and the efficacy of YYB was shown in controlling anaemia and improving child growth and devel-opment. However, prior to 2008, there was no sustainable way to provide YYB to vulnerable populations, exceptthrough free distribution by the government. This study was to test the concept of public-private partnership(PPP) to deliver YYB and to evaluate the effectiveness of marketing YYB through PPP. Programme activitiesincluded development of a complementary food supplement (CFS) national standard, product concept test,product development and marketing, behavior change communication, monitoring and evaluation. Baseline andend-line surveys were used to evaluate product awareness, purchasing and the impacts of the project on anaemiaand feeding practices. A Chinese CFS standard was approved. Caregivers and their 6- to-24-month-old childrenparticipated in the baseline (n = 226) and the end-line survey (n = 221). A concept test at the baseline surveyshowed that 78% of caregivers were willing to buy YYB at 0.1 USD. After developing the product andimplementing the intervention for 8 months, 59.6% of surveyed caregivers purchased YYB.While not significant,the prevalence of anaemia was marginally lower at the end line (28.8%) than at the baseline (36.2%). For thosepurchasing YYB, the risk of anaemia was significantly reduced by 87% of odds (P < 0.009). The end-line surveyfound that feeding practices had improved significantly following the intervention. An enabling policy andregulatory environment in which CFSs are defined and parameters for appropriate marketing are identified asa prerequisite for marketing YYB or other nutritious CFS. Public and private advocacy and marketing couldsuccessfully increase awareness of YYB and access and use through market channels. The YYB project may beeffective for reducing anaemia and improving feeding practices.
Correspondence: Dr Junsheng Huo, Institution of Nutrition and Food Safety, China CDC No. 29 Nanwei Road, Xuanwu District,Beijing 100050, China. E-mail: [email protected]
Introduction
Multi-nutrient powders (MNPs) have been used innumerous studies and now in large-scale programmesfor over 10 years. Their efficacy and effectiveness inreducing iron deficiency have now been well docu-
mented in many countries (Zlotkin et al. 2003a,b;Christofides et al. 2006; Giovannini et al. 2006; Hyderet al. 2007; Menon et al. 2007). These MNP productsinclude no protein or essential fatty acids, and are tobe mixed into the child’s traditional complementaryfood from 6 to 24 months of age. While they have
been shown to improve micronutrient status andmotor development, micronutrient powders alonehave not had an impact on child growth (Adu-Afarwuah et al. 2007, 2008). However, a study in Indiashowed that when combined with existing supple-mental nutrition programmes, enhanced monitoringand programme delivery, micronutrient powders hadsignificant positive impacts on children’s growth(Avula et al. 2011).
In China, Ying Yang Bao (YYB), an MNP, wasdeveloped that also included essential fatty acids andprotein through the inclusion of full fat soy flour. In2001 to 2004, a study was conducted in Gansu, Chinaamong children 4–12 months of age testing the effec-tiveness of this complementary food supplement(CFS) (Wang et al. 2006, 2007). Results showed thatuse of YYB reduced anaemia prevalence by 45% in 6months (Wang et al. 2009). Child growth (weight andlength) improved over the placebo group thatreceived an isocaloric unfortified rice flour (Wanget al. 2007). A follow-up study found that those given
YYB had significantly higher IQs than controls, andthis difference was sustained until age 6 years [IQscore 3.1–4.5 points higher (Chen et al. 2010)]. Thisproduct contained whole soybean flour fortified withiron, zinc, calcium, B2, and D, and was designed to beadded to home-made complementary foods.
While acceptance of the product was high whengiven free by health workers to families, sustainabil-ity of government programmes that provide nutri-tious products to the population is a challenge whenresources are constrained. Since even poor familiesspend funds on snack foods for young children inrural China, finding ways to market products to poorfamilies can potentially improve children’s nutri-tional status and development in a sustainableway.
The previously tested product was reformulatedand fortified with more micronutrients (iron, zinc,calcium, Vitamin A, D, B1, B2, B12 and folic acid)compared to the previous formulation (iron, zinc,calcium, vitamin B2 and vitamin D) (Table 1). The
Table 1. Formulation of Ying Yang Bao used in this project
Average level per sachet (12 g) WHO RNIs or AI (%)
6–12 months 1–3 year(s) old
Protein 3 gEnergy (kcal) 49Omega-3 fatty acids (mg) 131Omega-6 fatty acids (g) 1.0Calcium 250 mg 63% 50%Iron 5 mg (2.5 mg from EDTA iron and 2.5 mg from ferrous fumerate) 27% 43%Zinc 5 mg 60% 60%Thiamin 0.3 mg 100% 60%Riboflavin 0.3 mg 75% 60%Vitamin B12 0.3 mg 43% 33%Folic acid 50 mg 63% 33%Vitamin A 250 mg 63% 63%Vitamin D 200 IU 100% 100%
AI, adequate intake; EDTA, ethylenediamine tetraacetic acid; RNIs, recommended nutrient intakes; WHO, World Health Organization.
Key messages
• An enabling policy and regulatory environment is a prerequisite to sustain a market-based CFS project.• Public and private advocacy and social marketing could successfully increase awareness of YYB.• Market-based YYB projects can be effective for anaemia control and improving infant and young child feeding
practices.
YYB and impacts on anaemia and feeding practices 97
generic name Ying Yang Bao (meaning ‘nutrientsachet’) was used to describe and register the product.YYB is a fortified product, with nutrient levelsmeeting the World Health Organization (WHO)RNIs (recommended nutrient intakes) for severalnutrients as shown in Table 1. The nutrients used herewere based on Chinese dietary patterns and nutrientslikely to be missing in the children’s diets.
This paper describes a project to test the use ofpublic–private partnerships (PPPs) to market thisCFS in rural China to low-income families of children6–24 months of age.
Programme activities
In this project the Food Fortification Office (FFO)of the Chinese Center for Disease Control (ChinaCDC), the Capital Institute of Pediatrics (CIP) andQingDao Biomate Foodstuff Company (Biomate)worked collaboratively to market YYB through aPPP with a grant from Global Alliance for ImprovedNutrition (GAIN). The China CDC was responsiblefor overall project management, study design,product formulation improvement and social mar-keting. The CIP conducted both baseline and end-line surveys and behaviour change communicationin both breastfeeding and complementary feedingwith introduction of YYB for the target population.Biomate, a company producing primarily fortifiednoodle products with a wide distribution networkthroughout the country, produced and distributedthe product called Yu er Bao, meaning ‘Nurture yourchild sachet’ and conducted marketing activities. Theproduct was marketed through Biomate’s sales chainwith advocacy and social marketing support fromlocal health care providers in the maternal and childhealth care system. Maternal and child health carecentres focused on education and publicity about theuse of YYB in order to increase its coverage andcompliance.
The project took place in Huguan county andChangzhi county, located in Shan’xi province, in thenorth of China. Shan’xi province has a population ofover 34 000 000, and each county contains about300 000 people. The project counties are in relativelyunderdeveloped regions with a large number of chil-
dren suffering from growth retardation and anaemia.The number of children 6–24 months of age in thetarget area is about 6000. Residents in these two coun-ties, though poor, are financially able to afford CFSsfor infants and young children.
Project time line
This project was initially designed to be implementedover a 20-month period from May 2008 to January2010. The product was revised and the social market-ing plans were developed beginning in May, 2008.However, the actual marketing activities and advo-cacy of YYB were implemented later than planned,during the period of May 2009 to December 2009, dueto time needed for the official registration of theproduct in order for it to be marketed. From April2008 through February 2009, Biomate worked ondeveloping the product, taste testing it, and revisingits formulation to make it low cost, yet acceptable.Also during this time, China CDC and CIP developedsocial marketing materials and worked with healthcentres to train staff on the importance of continuedbreastfeeding and use of YYB to improve child nutri-tion. Once the product was registered, the projectintervention began, thus the intervention lasted only 8months.
In March 2008, a baseline survey among a sample ofcaregivers of children 6–24 months of age was con-ducted. This baseline included a concept test of theviews about purchase of YYB, as well as questionsabout knowledge, attitudes and practices related toinfant feeding and childhood anaemia. The follow-upstudy was conducted in January 2010 to assess theimpacts of the project.
Development of CFS standard
While YYB could be freely distributed in emergen-cies (e.g. Sichuan earthquake-affected regions) orprovided free of cost through maternal and healthprogrammes in China, in order for the product to besold, it first needed to be registered with the govern-ment. However, prior to 2008, there was no categoryfor a CFS, so therefore registration was not possible.The Chinese Ministry of Health (MOH) began work
with the National Standardization Administration todevelop and get approval for a CFS standard (shownin Box 1) in 2008.The National Standard for Comple-mentary Food Supplements (GB/T22570-2008) was
approved by the MOH and the StandardizationAdministration of the People’s Republic of China on15 December 2008 with an effective date from 1March 2009.
Box 1. Sections of Chinese standard for fortified complementary food supplements
Classification number 53
ICS 67.040
GB/T22570-2008General Standard for Complementary Food SupplementsIssued on 2008-12-15 Implement from 2009-03-01Ministry of Health of the People’s Republic of ChinaStandardization Administration of the People’s Republic of China1 ScopeThe Standard prescribes terminology and definition, basic principle, technical requirements, packaging, labeling, storage, and analyticalmethods of complementary food supplements.The Standard is applicable for nutrient supplements added to complementary foods for 6–36 month-old infants.2 Normative referencesThe following document contains provisions which, through reference in this text, constitute provisions of the Standard. As references withlabeled dates, subsequent amendments (excluding error amendments in the text) to, or revisions of any of the publications are not applicableto this standard. However, the parties who achieve an agreement according to this standard are encouraged to research whether the latesteditions are applicable. As for undated references, their latest edition of the normative document is applicable to this standard.
GB/T 601 Preparation for chemical reagents and standard titration solutionGB 2760 Hygienic Standards for Uses of Food AdditivesGB/T4789.2 Determining total count of bacteria colony, food microbiology and hygiene examinationGB/T4789.3 Determining total count of Escherichia coli, food microbiology and hygiene examinationGB/T4789.4 Determining total count of salmonella, food microbiology and hygiene examinationGB/T 5009.5 Analyzing protein content in foodsGB/T5009.11 Analyzing total arsenic and inorganic arsenic in foodsGB/T5009.12 Analyzing lead in foodsGB/T5009.24 Analyzing Aflatoxin M1 or B1 in foodsGB/T5009.93 Analyzing selenium in foodsGB/T5413.9 Analyzing Vitamin A, D, E, infant formula and milk powderGB/T5413.10 Analyzing Vitamin K1, infant formula and milk powderGB/T5413.11 Analyzing Vitamin B1, infant formula and milk powderGB/T5413.12 Analyzing Vitamin B2, infant formula and milk powderGB/T5413.13 Analyzing Vitamin B6, infant formula and milk powderGB/T5413.14 Analyzing Vitamin B12, infant formula and milk powderGB/T5413.15 Analyzing niacin and niacinamide, infant formula and milk powderGB/T5413.16 Analyzing folic acid (activity of its salt), infant formula and milk powderGB/T5413.17 Analyzing pantothenic acid, infant formula and milk powderGB/T5413.18 Analyzing Vitamin C, infant formula and milk powderGB/T5413.19 Analyzing free biotin, infant formula and milk powderGB/T5413.20 Analyzing choline, infant formula and milk powderGB/T5413.21 Analyzing calcium, iron, zinc, sodium, potassium, magnesium and manganese, infant formula and milk powderGB/T6682 Specification and testing method for water used in analytical laboratoryGB 7718 General Standard for the Labeling of Prepackaged FoodsGB13432 General Standard for the labeling of prepackaged foods used for special dietGB 14880 Hygienic standard for the use of nutritional fortificants in food
YYB and impacts on anaemia and feeding practices 99
GB 14881 General hygienic standard for food industryJJF 1070 Rules of Metrological Inspection for Net Quantity of Prepackaged Products with Fixed ContentChinese Dietary Recommendation Intakes (Chinese Nutrition Society, 2000)
3 Terminology and definitionsThe following terminology and definition are applicable to this Standard.3.1 Complementary foodsComplementary foods are the foods (home-made or industrialized) that are introduced to infants and young children to meet their nutrientrequirement after 6 months of age along with breastfeeding.3.2 Complementary food supplementsComplementary food supplements are the multiple, high-dense micronutrients (vitamin and minerals) supplements that are added tocomplementary foods for 6–36 months infants and young children, which may contain or not contain food base or other fillers. The commoncomplementary food supplements include: food-based nutrient supplements, Foodlets and Sprinkles®.3.2.1 Food-based nutrient supplementsFood-based nutrient supplements are the food base fortified with multiple high-dense vitamin and minerals, which could be powder, particle,or semi-solid and provide some high quality protein and small amount of energy.3.2.2 FoodletsFoodlets are crushable or dispersible tablets made with small amount of milk powder (or soybean powder) fortified with multiple high-densemicronutrients, which could be added into complementary foods after crushing or dispersing.3.2.3 Sprinkles®
Sprinkles® are complementary food supplements containing multiple high-dense micronutrients without food base in powder or/and particleform that are packaged in sachets.4 General principles4.1 Complementary food supplements are applicable to infants and young children aged 6 to 36 months.4.2 Guidelines for adding nutrients in complementary food supplements.4.2.1 Daily rations for vitamin and minerals intakes from complementary food supplements are determined based on RNIs, AIs and ULsfor 0.5–1 year and 1–3 year infants and young children respectively (Table 1). The reference values of RNIs, AIs and ULs are from ChineseDietary Recommended Intakes.
Table 1. Daily rations for vitamin and minerals intakes from complementary food supplements
Micronutrients Name of nutrient Minimal amount Maximum amount
Fat-soluble vitamins Vitamin A, D, D, and K 30% RNIs (AIs) 90% RNIs (AIs)Water-soluble vitamins Vitamin B1, B2, B6, B12, pantothenic acid, choline,
biotin, and vitamin C40% RNIs (AIs) 50% ULs
Folic acid and niacin 40% RNIs (AIs) 100% RNIs (1–3 year)Macro-elements Calcium and magnesium 30% RNIs (AIs) 60% RNIs (AIs)Trace elements Iron and zinc 30% RNIs (AIs) 90% RNIs (AIs)
Selenium and copper 30% RNIs (AIs) 60% RNIs (AIs)
4.2.2 Vitamin A, D, B1, B2, iron, and zinc are required for these products, and the other nutrients are optional. For food-based nutrientsupplements, protein and calcium are also required and protein should come from dairy, bean or others.4.3 Recommended daily ration of complementary food supplements: food-based nutrient supplements: 10–20 gram; Foodlets: 1.5–3 gram;and Sprinkles®: 0.8–2 gram.4.4 Workshops that produce complementary food supplements should at least meet class 300,000 clean requirements.4.5 Use of complementary food supplement is adding it into complementary foods directly.5 Technical requirements5.1 Requirements for materials5.1.1 Vitamins and mineralsAll raw materials of vitamin and minerals are listed in Annex A of this Standard.Their quality shall conform to the current national standardof food additives or Chinese pharmacopoeia. If there is no current national standard, the current industrial standard should be met.5.1.2 Food basefood bases are directly edible cow milk (or goat milk) and its products, soybeans and their products that are appropriate for direct use byinfants and young children to provide high quality protein and small amount of energy; their quality shall conform to the current relevantnational standard or industrial standard. Soybeans and their products should be processed with high temperature techniques to get rid ofanti-nutrient factors such as pancreatic proteinase inhibitor.
5.1.3 Auxiliary materialsAuxiliary materials are those edible, non-food additives materials with filling or sticky functions, which are added to meet the requirementsof producing techniques. Their quality shall conform to the current relevant national standard or industrial standard.5.1.4 Food additivesFood additives shall conform to the provisions stipulated in GB 2760. Their quality shall conform to the current relevant national standardor industrial standard.5.2 Organoleptic characteristicsOrganoleptic characteristics shall follow Table 2’s stipulation.
Table 2. Organoleptic characteristics
Name Organoleptic characteristics
Food-based nutrientsupplements
Characterized with own special flavor, taste and color; powder, in particle or semisolid form; must not containforeign matters or bad smell
Foodlets Tablet-shaped, easily crushable or dispersible in water or milk; must not contain foreign matters or bad smellSprinkles® In powder or particle form; must not contain foreign matters or bad smell
5.3 Physical and chemical requirements5.3.1 Net contentThe net content should follow the stipulation of JJF 10705.3.2 Nutrient contentNutrient content (daily ration) should follow Table 3’s stipulation in complementary food supplements.
Table 3. Nutrient daily ration in complementary food supplements
Lead (mg/kg) < 0.5Arsenic (mg/kg) < 0.5Aflatoxin M1 or B1 (ug/kg)1 < 0.5Activity of urease (U/g)2 < 0.02Total count of bacteria (cfu/g) < 10000Total count of Escherichia coli (cfu/g) < 10Total count of salmonella (cfu/25 g) 0
1Aflatoxin M1 is tested only in dairy products; Aflatoxin B1 is tested only in products containing cereal, nuts or beans.2Urease is tested only in products containing soybeans.Shaped packaging containers and materials should meet the relevant national food hygiene standards.
7 Labeling7.1 Labeling should meet the requirements of GB 7718 and GB13432.7.2 Product should be labeled with ‘complementary food supplements’ right below the name of the product.7.3 All ingredients and their compositions should be labeled.7.4 Nutrient compositions must be labeled. Daily ration of energy, protein, fat, carbohydrate and micronutrient of the product should belisted and the percentage of micronutrient daily ration relative to 0.5–1 year or 1–3 year RNIs (or AIs) should be given too. For thoseproducts applicable for 6–36 month infants and young children, the percentages of micronutrient daily ration relative to both 0.5–1 year and1–3 year RNIs (or AIs) must be labeled.7.5 ‘Dosage and administration’ should also be labeled.7.6 Cautions and ‘The product should not replace breast milk and complementary foods for infants and young children. The product shouldnot be given together with formulized foods or nutrient supplements for infants and young children.’ must be labeled.8. Storage and transportation8.1 Products shall be kept in a cool, dry, and well-ventilated place and kept away from toxic, poisonous, smelly, volatile, erosive substances.8.2 Avoid direct sunlight, rain and do not mix the products with toxic, poisonous, smelly substances that affect product quality duringshipment.9. Analytical methodsAnnex A: List of vitamins and mineralsAnnex B: Analytical method for activity of urease
In addition to product registration, all processedfood producers need to be certified by the GeneralAdministration of Quality Supervision, Inspectionand Quarantine for food production permission. Allprocessed food should be inspected and meet itsrequirements before entering the market. All quali-fied products should be labelled with , the QS(Quality Safety) logo. Without the QS certificate, aproduct cannot be legally sold through normal distri-bution channels. However, for this project, a specialresearch exception was allowed.
As a new food category, CFSs were not included inthe current QS list.Therefore, the producers could notbe certified specifically for production of YYB in ashort time period. Both China CDC and producers
are working together to add YYB to the list and to getit certified for future sales.
Product development
The first product developed with Biomate containedfull fat soybean powder in granular form, which had acoarse feel in the mouth. Biomate revised the productafter taste tests showed 8% of caregivers of 160 chil-dren aged 6 months to 5 years found the productunacceptable (Fig. 1). Soy isolate and soy milkpowder were used to improve the taste and mouthfeel, the granular form was replaced with powderform to avoid the coarse feel in the mouth, and peanutand sesame were added to conceal the soy flavor.Thisadaptation led to only 2% who found it unacceptable.
The changes made in the product led to an increasein price, from the originally estimated $0.10(0.7 RMB) to $0.15 (1 RMB) per daily sachet. Thecost to the company was $0.10 per sachet; thus, themargin for retailers or village doctors was only about$0.05 per sachet. This price of $0.15 covered the costof producing and distributing the product, but did notcover the social marketing conducted by the MOHwhich was paid for by the grant funds from GAIN.
Demand creation for YYB
Two lines of demand creation were used in this PPP.The government conducted behaviour change com-munication for health workers and the public, andBiomate conducted marketing activities to the publicthrough retail outlets. Messages about optimal breast-feeding practices were incorporated in behaviourchange communications.
Behaviour change communication bythe health system
Based on the results of the concept test, behaviourchange communication activities were developed byChina CDC and CIP. Communications were targetedto health workers and family members. Materialsincluded handbooks about infant and young childfeeding for parents, booklets about YYB for healthworkers and television spots for the public.
About 4470 copies of a Handbook for Infant
Feeding in Huguan County and 2000 copies in Chang-zhi County respectively were distributed to caregiversby maternal and child health care physicians or villagedoctors. Each caregiver received one copy of thehandbook and the health worker explained the con-tents of the handbook and answered the related ques-tions. This number is similar to the number of targetpopulation children 6–24 months of age in eachcounty, respectively, or a total of 6000 children 6–24months of age.
In March, 2009 in Changzhi County and in Septem-ber 2009 in Huguan, the MCH (Maternal and ChildHealth) centres sponsored television programmes onYYB which were aired on local TV stations. Articlesintroducing the project background, objectives, targetpopulation, sales locations and price of YYB, as wellas instructions on how to prepare YYB, were pub-lished in a local newspaper in Huguan county.
The staff of the maternal and child hospital in eachcounty regularly trains village doctors on how to traincaregivers in infant and young child feeding. The useof YYB was incorporated into this health workertraining at the township and village level. Caregiverswere educated about infant and young child feeding(including use of YYB) during their children’s regularvillage doctor visits. Brochures were also distributedby paediatricians to families with infants and youngchildren during sick and well child visits at maternaland child health care hospitals.
8%
53%
31%
8%8%
60%
26%
2%
0%
10%
20%
30%
40%
50%
60%
70%
Enjoyable Acceptable Normal Unacceptable
Per
cen
t o
f re
spo
nd
ents
Dec-08 May-09
Fig. 1. Comparison of acceptance to YYB between original version and revised version.
YYB and impacts on anaemia and feeding practices 103
Biomate built up distribution and sales channels bysetting up a two-tiered distribution network fromcounty distributors to retailers. Two distributors and12 retailers were selected for the network. Theproduct was sold and promoted in grocery stores.Biomate organised promotions for YYB, whichincluded hanging banners and distributing brochures.As they did with retailers, the distributors encouragedvillage doctors to sell YYB in their village clinics andprovided commissions. Over the 8-month period ofthe project, 38 000 sachets were sold at $0.15 to pri-marily low- to middle-income families.
Evaluation design
Baseline and end-line surveys were conducted toevaluate the effectiveness of the project on anaemia,breastfeeding and complementary feeding knowl-edge, and behaviour associated with awareness andpurchasing of YYB. The baseline survey was con-ducted in June 2008, and the end-line survey was con-ducted in January 2010.
Twenty villages were selected from 4 townshipsfor the baseline survey using a convenience samplenear the main cities. Thirteen villages were selectedfrom 5 townships for the end-line survey. All familieswith infants and young children 6–24 months ofage in the study villages were recruited for bothsurveys.
A structured questionnaire was developed basedon the indicators for assessing infant and young childfeeding practices (World Health Organization 2008).In addition to demographic characteristics includingage, gender, maternal age, maternal education, mater-nal occupation and household size, feeding practicesand feeding knowledge were assessed in both thebaseline and end-line surveys. Capillary bloodsamples were collected and haemoglobin was mea-sured by using B-Hemocue.
In the baseline survey, questions were asked toassess the concept of YYB. A sample of the productwas presented to caregivers, and questions were askedabout acceptability (See Box 2), intention to purchaseand factors influencing decisions to purchase.
In the end-line survey, access to social marketingmessages, awareness of YYB, purchasing behaviourand use of YYB instead of concept questions weresurveyed in addition to the same questions asked inthe baseline survey.
Statistical analysis
Data were entered by using Epidata 3.02. Univariateanalysis was conducted to check the distribution ofcontinuous variables.A t-test was used for mean com-parison for continuous variables (e.g. maternal age).A chi-square test was used for categorical variablecomparison (anaemia, feeding knowledge andfeeding practice). Logistic regression was used toanalyse the potential factors associated with aware-ness of YYB, purchasing YYB and anaemia afteradjusting for potential confounders. Linear regressionwas used to study the factors associated with sales ofYYB. SPSS package (version 15.0) was used for allthe data analysis with Type I error of 0.05.
Results
Infants and young children aged 6–24 months(n = 250) participated in the baseline survey, and 221with complete information were included in theanalysis. For the end-line survey, 267 infants and
Box 2. Concept test question describing Ying YangBao(Show the product) This is a food for children between the agesof 6 months to 24 months.This food is for you to add to the baby’sfood. While we recommend that you continue breastfeeding, it isnecessary to also add additional nutrition to children when theyreach the age of 6 months. The product is a powder containingmultiple nutrients, which can help baby grow up healthily andlearn quickly. It has a simple feeding method: Instant, no cookingneed. It comes in a little packet (ying yang bao) that you mix inwith the food after it is cooked. It just needs to be added to thebaby’s zhou (porridge) or other food that you would normallyfeed your baby. It will not interfere with the taste of zhou orother food.Now I would like to know about how you like the product. Pleasetell me how you like this product on a scale of ‘10’ to ‘1’. If youlike the product very much, you would use a rating of ‘10’. If youdislike it at all, you would use a rating of ‘1’.You may also use anynumber between ‘10’ and ‘1’.
young children aged 6–24 months were interviewedand 226 had complete information.
The evaluation included demographic and socio-economic information, haemoglobin, consumption ofcomplementary foods, intake of YYB and complianceas well as the parents’ knowledge on infant feeding.
Product concept test
In the baseline survey, after having been shown theproduct, caregivers were asked about how well theyliked the concept of YYB. The scale was from 1 to 10(10 meaning ‘like it very much’ and 1 meaning ‘did notlike it at all’). The mean ranking by respondents forhow well they liked the concept of YYB was 8.0. Thisvaried from 7.9 for caregivers of children 6–11months, 7.6 for those 12–17 months of age and 8.3 forthose 18–24 months of age.
Seventy-eight per cent of the respondents statedthey would definitely or probably be willing to pay theprice of 0.7 yuan/day ($0.10) for one sachet of YYB.This varied from 84% for caregivers of children 6–11months, 74% for those 12–17 months of age and 81%for those 18–24 months of age. For the 19% who saidthey were unsure if they would buy, reasons givenwere that (i) this was a new product, which has notbeen consumed previously; (ii) they were not familiarwith the product; (iii) they were concerned about thepotentially adverse effects of the product’. Only 3%said they probably or definitely would not buy YYB.
Respondents were asked where they would mostlike to buy the product, with multiple responses pos-sible. Most (61%) said they would like to purchase itat supermarkets or franchises, 48% in local foodstores in their villages, and 21% in food stores in thetown or township.
When asked what would influence them to pur-chase the product, nearly half (47%) of all respon-dents stated that television commercials wouldinfluence them, or family members (also 47%).Thirty-seven per cent said they would be influenced by adoctor or nurse recommending the product, and 21%by authorities (which could include government orCommunist party officials). Less than 5% of respon-dents stated that attractive packaging, or free samples,or special price reductions/discounts, free offer/bonus
pack or online or newspaper ads or articles wouldinfluence them.
Intake and compliance of YYB
In the end-line survey, more than half (59.6%) ofcaregivers knew about YYB and 13.5% of caregiversever purchased it. Given the estimate of 6000 childrenin the target age, this indicates about 800 childrenreached with the product. Among those who wereaware of YYB, 22.6% purchased the product. Amongchildren whose caregivers purchased the product,55.6% had consumed the product every day; 40.7%had consumed the product every other day; and only3.7% had consumed the product occasionally. Thus,more than 95% consumed the product at least threetimes per week.The purchase of YYB was not relatedto the child’s age.
While instructions were for YYB to be mixed withthe child’s food, surprisingly 61.9% of caregivers pre-pared YYB with boiled water, and the rest (38.1%)mixed YYB with porridge, noodle soup or other typeof food for their children. Powdered soy milk is mixedwith water as a common beverage in China, and thismay be why many caregivers fed YYB this way totheir children, in spite of recommendations to mix itwith complementary foods.
Demographic characteristics of subjectsand anaemia
There were no significant differences between base-line and end-line survey subjects in gender, maternaleducation level, maternal occupation, householdsize and maternal age (Table 2). However, childrenin the end-line survey were significantly youngerthan those in the baseline survey (P = 0.002). Inthe follow-on survey, 81% of caregivers weremothers. Mothers had threefold greater odds ofYYB awareness than other caregivers (mainlygrandparents).
The prevalence of anaemia among all children wasmarginally lower in the end line (28.8%) than in thebaseline (36.2%) (P = 0.098). Age, gender and car-egivers were not significantly different for anaemicinfants between the baseline and end-line survey, but
YYB and impacts on anaemia and feeding practices 105
maternal education level was significantly higher inthe end-line survey than baseline (Table 3). Purchas-ing YYB was associated with 87% less odds ofanaemia than not purchasing YYB at the end lineafter controlling for the potential confounders (age,maternal occupation, bottle usage, iron-rich food, etc.;P = 0.009) (Table 4). Use of bottles for infant feedingwas also significantly related to lower risk of anaemia.There was no association between awareness of YYBand anaemia.
Using sales data provided by the manufacturer, theamount of YYB sold by retailers was negatively
related to the distance from wholesale to retail store(r = 0.35, n = 35, P = 0.038).
Feeding practices
Because the behaviour change communication activi-ties promoted optimal child feeding in addition to useof YYB, we compared feeding practices at baselineand end line. After controlling for potential con-founders (maternal education level and age of child),early initiation of breastfeeding rate, the prevalenceof meeting minimal dietary diversity (�4 food
Table 2. Comparison of maternal and child demographic characteristics between baseline and end line
Variables Baseline (n = 221) End line (n = 226) P-value
groups), the prevalence of meeting a minimal accept-able diet and the prevalence of consuming iron-richfood were significantly greater in the end line than inthe baseline (Table 5). The early initiation of breast-feeding rate significantly increased from 8.6% at thebaseline to 16.8% at the end line. The prevalence ofmeeting minimal dietary diversity significantlyincreased from 58% to 74% for breastfed childrenand from 28% to 54% for non-breastfed children.Theprevalence of meeting a minimal acceptable diet sig-nificantly increased from 42% to 74% for breastfedchildren and from 25% to 45% for non-breastfed chil-dren. The prevalence of consuming iron-rich food sig-nificantly increased from 19% to 57% (P < 0.05).
The baseline and end line ever breastfed rate, con-tinued breastfeeding rate, age of introduction of solidfoods and minimal meal frequency rate (Table 5)were not significantly different.
Discussion
Marketing YYB through a collaboration amongChina CDC, CPI and Biomate tested the concept –‘PPP’ for improving infant and young child nutritionin China. Under the project, a Chinese standard forCFSs was approved and implemented, which is thefirst standard globally for the new category of comple-mentary foods-CFSs. After implementing the inter-vention for 8 months, 59.6% of surveyed caregiverswere aware of YYB and 13.5% of surveyed caregiverspurchased YYB.The overall prevalence of anaemia atthe end line, which was negatively associated withpurchasing YYB, was marginally lower than the oneat the baseline.
An enabling environment for appropriate market-ing of CFSs is a prerequisite for a PPP project topromote YYB, especially since YYB is part of a new
Table 4. Adjusted odds ratio (AOR) for anaemia of infants and young children at the end line
Indicators Prevalence of anaemia(# of anaemia/total #)
Controlling for age, maternal age, occupation and iron-rich food (including meat, fish, poultry, liver and iron supplements). Reference group: notuse or purchasing, anaemia is defined as haemoglobin <110 g/L. n = 131.AOR, adjusted odds ratio; YYB, Ying Yang Bao.
Table 5. Comparison of feeding practice between baseline and end line
Feeding practice Baseline (n = 221) End line (n = 226) P-value
Ever breastfed (%) 90.0 (198/220) 89.8 (203/226) P = 0.951Early initiation of breastfeeding (%) 8.6 (19/221) 16.8 (37/220) P = 0.01Continued breastfeeding at 1 year (%) 76 (38/50) 66.7 (32/48) P = 0.307Continued breastfeeding at 2 years (%) 42.3 (30/71) 71 37.0 (20/54) P = 0.555Introduction of solid, semi-solid or soft foods (%) 92.9 (13/14) 71.1 (27/38) P = 0.098Minimal dietary diversity >4 group breastfed (%) 57.5 (73/127) 74.1 (83/112) P = 0.007Minimal dietary diversity >4 group (%) non-breastfed 27.6 (16/58) 53.9 (41/76) P = 0.008Minimal meal frequency (%) breastfed 53.7 (65/121) 51.0 (52/102) P = 0.683Minimal meal frequency (%) non-breastfed 47.1 (24/51) 53.4 (39/73) P = 0.485Minimal acceptable diet (%) breastfed 42.1 (51/121) 73.5 (75/102) P < 0.01Minimal acceptable diet (%) non-breastfed 25.0 (13/51) 45 (33/73) P = 0.025Iron-rich food (%) 19.2 (38/198) 56.8 (117/206) P = 0.014
Adjusting those potential confounders of demographic characteristics.
YYB and impacts on anaemia and feeding practices 107
category of products. In this case, the lack of acomplementary food standard was a bottleneck forimplementing the project, and similarly the lack of aQuality Standard (QS) remains a barrier to scale-upthrough commercialisation.Without the standard, ini-tiation of selling YYB was delayed for more than 1year, although fast-track approval for the CFS stan-dard was given based on evidence from the trial areaand the needs from the Sichuan earthquake area,which has facilitated production and availability ofthe product in the market. Besides the standard, aproduction permit (which is called QS) is alsorequired for production and marketing in China. Aspecial permit was given for producing and marketingwithin the context of the project. In the long run, acorresponding QS permit for YYB will be requiredfor marketing it freely and responsibly in China. Dif-ferent nations have various rules for introducing anew category of products. As shown in Indonesia(Soekarjo & Zehner 2011) and Kenya (CJ Jones, per-sonal communication), a new standard for CFSs isrequired for initiating a market-based project. InBangladesh, government authorities did not allowpromotion of Monimix, an MNP, through mass mediawhen the product was first introduced through socialmarketing, which affected the volume of sales (MrMahbubur Rahman, personal communication).Having governmental standards and related regula-tions in place for appropriate composition and mar-keting and being able to meet them is a requirementfor initiating a PPP project and sustaining access bylow-income households through markets.
The combination of mass media (localTV and news-paper), brochures, individual counseling and privatesector advertisement was effective in promotingYYB. Within the short time period, about 60% ofcaregivers were aware of YYB. Mothers were morelikely to be aware of YYB than grandparents, whichcould demonstrate that younger women are moreattuned to innovations and new products. A study inBolivia showed that social marketing was able toincrease the awareness of multiple micronutrientsupplements from 37% at the baseline survey to 61%at the end-line survey among childbearing age women(Warnick et al. 2004). In a similar market-based MNPstudy in Kenya,vendors’ awareness of MNP was found
to be very low during the first 3 months of implement-ing MNP distribution (Suchdev et al.2010).However,1year later 98% of mothers had heard about MNP.
Although the concept test showed that about 80%of caregivers were willing to buy YYB, the end-linesurvey found that only 13% of caregivers who wereaware of YYB actually bought YYB. Thus, demandfor YYB was much lower than expected. In the KenyaMNP project, 33% of households bought MNP at thefollow-up survey (Suchdev et al. 2010). The ‘ever use’of multiple micronutrient supplements increasedfrom 11% to 25% in the Bolivia social marketingproject (Warnick et al. 2004). The retailer price ofYYB ($0.15) was much higher than Sprinkles®
(US$0.027) in Kenya (Suchdev et al. 2010), partiallydue to the cost of soy, which might be a factor in thelower percentage of caregivers purchasing YYB thanMNPs in other settings.
For this project, the private company (Biomate)took on significant risk, because it was introducing acompletely new category of product and needed tocreate demand for it in a policy environment that didnot address the product’s existence. This is a concern,especially for small companies with limited capital. Inthis project, a GAIN small grant funded the socialmarketing activities through the maternal and childhealth care system, which partially alleviated this risk.Village doctors were also motivated to promote YYBduring the project period because of encouragementfrom the programme. While the role the public sectorplayed and the policy steps taken were importantfactors in enabling the promotion of improved infantand young child feeding, social marketing through thehealth system remains a sensitive issue in China.Health systems promote breastfeeding and comple-mentary feeding, but there is a reluctance to promoteprocessed foods or a specific brand of product thatcould give a single company an advantage. Thus, mar-keting through the health system was initially a moredifficult approach organisationally than buildingdemand through social marketing carried out by inde-pendent organisations such as SMC (Social Market-ing Company) in Bangladesh (Mr MahbuburRahman, personal communication) and SWAP (TheSafe Water and Aids Project) in Kenya that promotedmicronutrient powders and improved feeding
practices outside of the context of public health deliv-ery system (Suchdev et al. 2010).
Although the YYB formulation was effective incontrolling anaemia and improving growth and devel-opment in the China context, a more complete formu-lation has been recommended by the GAIN in itsformulation guidelines for correcting inadequateintake of multiple micronutrients worldwide(Table 6). This formulation should be considered byothers undertaking a similar project.
As shown in a free distribution of Sprinkles® pro-gramme in Mongolia which was implemented for alonger duration (World Vision Mongolia 2005), theprevalence of anaemia in the end-line survey waslower than at baseline. The short period of interven-tion might have limited the effectiveness of the YYBproject.The prevalence of anaemia in this study at theend line was significantly negatively associated withpurchasing YYB, which indicated that the projectmight have positive impacts on anaemia control,
although other potential confounding effects cannotbe ruled out. The bottle use of formula, milk or waterwas also associated with lower risk of anaemia. Asshown in a few DHS (Demographic and HealthSurvey) studies in India and Bangladesh (Mihrshahiet al. 2010; Patel et al. 2010), bottle use was associatedwith a higher household wealth index, which mightpartially explain the reason for lower risk of anaemiaassociated with bottle use. However, reported house-hold income was not associated with the risk ofanaemia or bottle use in this study. Formula with highiron content might be associated with lower risk ofanaemia (Chantry et al. 2007; Hopkins et al. 2007).
Infant and young child feeding education throughthe maternal and child health system significantlyimproved infant and young child feeding practices.Compared with the baseline, the prevalence of earlyinitiation of breastfeeding, minimal dietary diversity,minimal acceptable diet and consumption of iron-richfood improved significantly following the interven-tion. Similarly, in a cluster randomised control trial inChina, nutrition education for 8–10 months signifi-cantly improved food diversity, meal frequency andhygiene practice for infants 2–4 months of age at thebeginning of the intervention (Shi et al. 2010). Inten-sive complementary feeding education increasednutrient intakes, diversity of diet and feeding fre-quency in India (Palwala et al. 2009).
This project had several limitations. First, the inter-vention period was too short, which might explainwhy the purchase of YYB was not as high as expectedand the overall impact on anaemia was not significant.Second, the project counties and survey townshipswere selected through a convenience sample. Thus,the results were not representative samples of thewhole province. Generalisation of the results shouldbe done with caution. Third, because the pre-intervention and the post-intervention design did notinclude a control group, residual confounders due totime effects cannot be ruled out. However, a demo-graphic comparison between baseline and end linefound the groups to be similar, except for agedistribution.
In conclusion, expanding the use of YYB could bean effective way for controlling anaemia and improv-ing infant and young child feeding practices.
Table 6. GAIN guidelines for MNP-soy formulations
Nutrients GAIN guidelines
Protein 10–15% of energy from proteinEnergy (kcal) <100–150Omega-3 fatty acids (mg) at least 130Omega-6 : Omega-3 5–10:1Vitamin A (mg) 200Vitamin D (mg) 2.5–5.0 (100–200 IU)Vitamin E (mg) 2.5–5.0 (mg a-TE)Vitamin C (mg) �15 (to improve absorbability of
However, an enabling policy and regulatory environ-ment in which CFSs are defined and parameters forappropriate marketing are identified is a prerequisiteto initiating a market for YYB or other CFSs. Publicand private advocacy and social marketing could suc-cessfully increase awareness of YYB, and combiningpublic distribution and market based approachescould have an even greater potential to improvelarge-scale access by low-income households to CFSs.However, investments in demand creation need moretime and effort, especially in order to harmonise mar-keting with public messaging. In the case of China,despite promising indications of demand and impact,large-scale access by the poor to YYB on a sustainedbasis will not be possible unless a QS accreditation isestablished.
Acknowledgements
The authors thank Global Alliance for ImprovedNutrition’s support on the project and paper prepa-ration and Chinese National High-tech R&DProgram (863 program no. 2010AA023004)’s partialsupport on paper preparation. The authors also thankMr Baozhong Zhou, Ms Bing Liu, Ms Haidi Zhu,Mr Heping Li, Ms Lijuan Wang, Mr Ping Wang, MrRongguang Sun, Ms Yanti Wei, Ms Ying Li and MsZheng Fang (in alphabetical order) and Dr SandraHuffman who have supported the project and/orassisted in manuscript preparation.
Source of funding
Global Alliance for Improved Nutrition supportedthe project and partially supported the manuscriptpreparation.
Conflicts of interest
The authors declare that they have no conflicts ofinterest.
References
Adu-Afarwuah S., Lartey A., Brown K.H., Zlotkin S.,Briend A. & Dewey K.G. (2007) Randomized compari-
son of 3 types of micronutrient supplements for homefortification of complementary foods in Ghana: effectson growth and motor development. The AmericanJournal of Clinical Nutrition 86, 412–420.
Adu-Afarwuah S., Lartey A., Brown K.H., Zlotkin S.,Briend A. & Dewey K.G. (2008) Home fortification ofcomplementary foods with micronutrient supplements iswell accepted and has positive effects on infant ironstatus in Ghana. The American Journal of Clinical Nutri-tion 87, 929–938.
Avula R., Frongillo E.A., Arabi M., Sharma S. & SchultinkW. (2011) Enhancements to nutrition program in Indianintegrated child development services increased growthand energy intake of children. The Journal of Nutrition141, 680–684.
Chantry C.J., Howard C.R. & Auinger P. (2007) Fullbreastfeeding duration and risk for iron deficiency inU.S. infants. Breastfeeding Medicine 2, 63–73.
Chen C.M., Wang Y.Y. & Chang S.Y. (2010) Effect ofin-home fortification of complementary feeding on intel-lectual development of Chinese children. Biomedicaland Environmental Sciences 23, 83–91.
Christofides A., Asante K.P., Schauer C., Sharieff W.,Owusu-Agyei S. & Zlotkin S. (2006) Multi-micronutrientSprinkles including a low dose of iron provided asmicroencapsulated ferrous fumarate improves haemato-logic indices in anaemic children: a randomized clinicaltrial. Maternal & Child Nutrition 2, 169–180.
Giovannini M., Sala D., Usuelli M., Livio L., FrancescatoG., Braga M. et al. (2006) Double-blind, placebo-controlled trial comparing effects of supplementationwith two different combinations of micronutrients deliv-ered as sprinkles on growth, anemia, and iron deficiencyin Cambodian infants. Journal of Pediatric Gastroenterol-ogy and Nutrition 42, 306–312.
Hopkins D., Emmett P., Steer C., Rogers I., Noble S. &Emond A. (2007) Infant feeding in the second 6 monthsof life related to iron status: an observational study.Archives of Disease in Childhood 92, 850–854.
Hyder S.M., Haseen F., Rahman M., Tondeur M. &Zlotkin S. (2007) Effect of daily versus once-weeklyhome fortification with micronutrient Sprinkles onhemoglobin and iron status among young children inrural Bangladesh. Food and Nutrition Bulletin 28, 156–164.
Menon P., Ruel M.T., Loechl C.U., Arimond M., HabichtJ.P., Pelto G. et al. (2007) Micronutrient Sprinklesreduce anemia among 9- to 24-mo-old children whendelivered through an integrated health and nutritionprogram in rural Haiti. The Journal of Nutrition 137,1023–1030.
Mihrshahi S., Kabir I., Roy S.K., Agho K.E., Senarath U. &Dibley M.J. (2010) Determinants of infant and youngchild feeding practices in Bangladesh: secondary data
analysis of Demographic and Health Survey 2004. Foodand Nutrition Bulletin 31, 295–313.
Palwala M., Sharma S., Udipi S.A., Ghugre P.S., Kothari G.& Sawardekar P. (2009) Nutritional quality of diets fedto young children in urban slums can be improved byintensive nutrition education. Food and Nutrition Bulle-tin 30, 317–326.
Patel A., Badhoniya N., Khadse S., Senarath U., Agho K.E.& Dibley M.J. (2010) Infant and young child feedingindicators and determinants of poor feeding practices inIndia: secondary data analysis of National Family HealthSurvey 2005–2006. Food and Nutrition Bulletin 31, 314–333.
Shi L., Zhang J., Wang Y., Caulfield L.E. & Guyer B.(2010) Effectiveness of an educational intervention oncomplementary feeding practices and growth in ruralChina: a cluster randomised controlled trial. PublicHealth Nutrition 13, 556–565.
Soekarjo D. & Zehner E. (2011) Legislation shouldsupport optimal breastfeeding practices and access tolow-cost, high quality complementary foods: Indonesiaprovides a case study. Maternal & Child Nutrition 17(Suppl. 3), 112–122.
Suchdev P.S., Ruth L., Obure A., Were V., Ochieng C.,Ogange L. et al. (2010) Monitoring the marketing, distri-bution, and use of Sprinkles micronutrient powders inrural western Kenya. Food and Nutrition Bulletin 31,S168–S178.
Wang Y., Chen C., Wang F. & Wang K. (2007) Effects ofnutrient fortified complementary food supplements ongrowth of infants and young children in poor rural areain Gansu Province. Wei Sheng Yan Jiu 36, 78–81.
Wang Y.Y., Wang F.Z., Wang K. & Chen C.M. (2006)Effects of nutrient fortified complementary food supple-ments on development of infants and young children inpoor rural area of Gansu Province. Wei Sheng Yan Jiu35, 772–774.
Wang Y.Y., Chen C.M., Wang F.Z., Jia M. & Wang K.A.(2009) Effects of nutrient fortified complementary foodsupplements on anemia of infants and young children inpoor rural of Gansu. Biomedical and Environmental Sci-ences 22, 194–200.
Warnick E., Dearden K.A., Slater S., Butron B., LanataC.F. & Huffman S.L. (2004) Social marketing improvedthe use of multivitamin and mineral supplements amongresource-poor women in Bolivia. Journal of NutritionEducation and Behavior 36, 290–297.
World Health Organization (2008) Indicators for AssessingInfant and Young Child Feeding Practices. Part I: Defini-tion. World Health Organization: Geneva, Switzerland.
World Vision Mongolia (2005) Effectiveness of home-based fortification with Sprinkles in an integrated nutri-tion program to address rickets and anemiaUlaanbaatar.
Zlotkin S., Antwi K.Y., Schauer C. & Yeung G. (2003a)Use of microencapsulated iron(II) fumarate sprinkles toprevent recurrence of anaemia in infants and young chil-dren at high risk. Bulletin of the World Health Organiza-tion 81, 108–115.
Zlotkin S., Arthur P., Schauer C., Antwi K.Y., Yeung G. &Piekarz A. (2003b) Home-fortification with iron andzinc sprinkles or iron sprinkles alone successfully treatsanemia in infants and young children. The Journal ofNutrition 133, 1075–1080.
YYB and impacts on anaemia and feeding practices 111
Legislation should support optimal breastfeedingpractices and access to low-cost, high-qualitycomplementary foods: Indonesia provides a case studymcn_354 112..122
Damayanti Soekarjo* and Elizabeth Zehner†
*Independent Consultant, Citraland, Surabaya, Indonesia, and †Independent Consultant, Bethesda, Maryland, USA
Abstract
It is important to support women to exclusively breastfeed for 6 months and continue breastfeeding for 24months and beyond. It is also necessary to provide the poor with access to affordable ways to improve the qualityof complementary foods. Currently, many countries do not have the legal and policy environment necessary tosupport exclusive and continued breastfeeding. Legislative and policy changes are also necessary for introducingcomplementary food supplements, allowing them to be marketed to those who need them, and ensuring thatmarketing remains appropriate and in full compliance with the International Code of Marketing of BreastmilkSubstitutes. This paper aims to illustrate the above with examples from Indonesia and to identify legislativerequirements for supporting breastfeeding and enabling appropriate access to high-quality complementary foodsupplements for children 6–24 months of age. Requirements include improved information, training, monitoringand enforcement systems for the International Code of Marketing of Breastmilk Substitutes; implementationand monitoring of the Baby-Friendly Hospital Initiative; establishment of a registration category for comple-mentary food supplements to enhance availability of high-quality, low-cost fortified products to help improveyoung child feeding; clear identification and marketing of these products as complementary food supplementsfor 6–24-month-olds so as to promote proper use and not interfere with breastfeeding.
Keywords: complementary food supplements, lipid nutrient supplements, micronutrient powders, breastfeed-ing, Code of Marketing, baby-friendly hospitals, infant and young child nutrition.
Correspondence: Damayanti Soekarjo, Independent Consultant, Vila Sentral Raya Blok C2/7, Citraland, Surabaya 60217, Indonesia.E-mail: [email protected]
Introduction
Exclusive breastfeeding for the first 6 months of lifeand continued breastfeeding up to 24 months andbeyond promotes optimal infant and young childgrowth and development (World Health Organiza-tion & UNICEF 2003). While young infants thrivebest when exclusively breastfed, by the time theyreach 6 months of age, timely, adequate, safe andproperly fed complementary foods need to be intro-
duced in addition to continued breastfeeding in orderto fully meet their nutrient needs (World HealthOrganization & UNICEF 2003). The period aroundthe introduction of complementary foods, unfortu-nately, is also the time that growth faltering starts tomanifest itself (Victora et al. 2010). A balanced dietbased on locally available foods including animalproducts can provide optimal nutrition to the youngchild. However, large proportions of the population indeveloping countries cannot afford a balanced diet
(Kothari & Abderrahim 2010; de Pee et al. 2010).Because deficient dietary intake during the so-called‘window of opportunity’ (the 1000 days between con-ception and the second birthday) can lead to irrevers-ible impairment of physical and mental growth,development, immunity and future economic poten-tial (Victora et al. 2008), it is important to supportwomen to exclusively breastfeed for 6 months andcontinue breastfeeding for 24 months and beyond.Additionally, it is also necessary to provide the poorwith access to affordable ways to improve the qualityof the foods fed to children to complement breastmilk after 6 months of age.
Often, the habitual diets of poor children 6–24months of age in developing countries lack certainmicronutrients and essential fatty acids, all essentialfor growth and development. Rather than replacingthe local foods or requiring mothers to cook a differ-ent meal for their young children, fortifying thechild’s portion of the family meal with thesenutrients can be a feasible approach to addressingdietary deficiencies.
Complementary food supplements (CFS) are forti-fied food-based products to be added to other foods(as ‘point of use’ or ‘home’ fortificants) or eaten aloneto improve both macronutrient and micronutrientintake of children 6–24 months of age. Multiplemicronutrient powders (MNP) are also used for homefortification, and they can be comprised of micronu-trients alone or contain other factors/ingredients, suchas essential fatty acids, amylase, and flavouring. Theirinclusion as an addition to the traditional foods sup-ports local feeding practices rather than competingwith them. Additionally, because of their low watercontent, they are resistant to microbial proliferation,
resistant to spoilage, and the micronutrients in theseproducts cannot interact with each other chemicallybecause there is no water to do so. Studies have docu-mented improved child growth with consumption ofthe CFS, Nutributter® (Nutriset SAS, Malaunay,France), a fortified peanut-based paste (Adu-Afarwuah et al. 2007, 2008) and fortified soy flour(Wang et al. 2007; Chen et al. 2010).
Currently, however, many countries do not have thelegal and policy environment to support exclusive andcontinued breastfeeding. Legislative and policychanges are also necessary for introducing CFS, allow-ing them to be marketed to those who need them, andat the same time ensuring that marketing remainsappropriate and in full compliance with the Interna-tional Code of Marketing of Breastmilk Substituteswhere it applies, and within the spirit of the Codewhere products are not addressed by the Code. Thispaper aims to illustrate the above with examples fromIndonesia and to identify legislative and policyrequirements for supporting breastfeeding andenabling appropriate access to high-quality CFS forchildren 6–24 months of age.
Methods
We reviewed infant and young child feeding (IYCF)practices, legislation, food regulations and nationalpolicies related to IYCF in Indonesia. We proposechanges to strengthen support for improved IYCFpractices.
Results
The Republic of Indonesia is the fourth most popu-lous country in the world, with an estimated popula-
Key messages
• Improved information, training, monitoring and enforcement systems for the International Code of Marketingof Breastmilk Substitutes are needed to prevent marketing practices that are harmful to breastfeeding.
• Monitoring of Baby-Friendly hospitals to ensure compliance is essential to improve breastfeeding practices.• A registration category needs to be established for complementary food supplements to enhance availability
of high-quality, low-cost fortified products that do not interfere with breastfeeding and help improve youngchild feeding.
• Products need to be clearly identified and marketed as complementary food supplements for 6–24-month-oldsso as to promote proper use and not interfere with breastfeeding.
tion size of around 240 million. An estimated 4.4million infants are born annually [Statistics Indonesia(Badan Pusat Statistik – BPS) and Macro Interna-tional 2008]. Although the past decades have seensome major improvements in the health of the Indo-nesian people (UNICEF 2009), the poorer segmentsof the population still suffer from lack of access toadequate hygiene, sanitation, food and health care.Twenty-one per cent of the population lives below theinternational poverty line of less than USD1.25 perperson per day, which means that approximately 50million Indonesians are living in poverty (The WorldBank Group 2010).The poorer 60% of the populationspends between USD 3.70–11 on food per month perperson (World Bank 2010).
Despite declines in recent years, Indonesia still hasthe highest maternal mortality rate in Southeast Asia,estimated at 228/100 000 live births [Statistics Indone-sia (Badan Pusat Statistik – BPS) and Macro Interna-tional 2008], an infant mortality rate of 31/1000 livebirths, and an under five mortality rate of 41/1000(UNICEF 2008). The national prevalence of stuntingamong children under five is 36.8% (Agency forHealth Research and Development. Republic ofIndonesia 2008). Among infants 6–11 months, 35%were already stunted, and among young children12–23 months, this figure increases to 41% (WHO2009). In addition, micronutrient deficiencies arecommon, with anaemia prevalence among childrenunder five as high as 50–60% in some areas, while zincand vitamin A deficiency are also common (ChurchWorld Service et al. 2008) (Dijkhuizen et al. 2001).Alarmingly, anaemia is most prevalent among 12- to23-month-old children, and has been found to be ashigh as 60–75% (de Pee et al. 2004).
IYCF practices and the nutrient gap
Indonesian infants are generally breastfed until wellinto their second year or beyond, and the medianduration of any breastfeeding is 21 months [StatisticsIndonesia (Badan Pusat Statistik – BPS) and MacroInternational 2008]. However, only 32% of infants areexclusively breastfed in the first 6 months of life, asagainst the goal of 100%. Ironically, breastfeedingpractices (early initiation, no prelacteal feeds) are
noticeably better among poorer, less educated, ruralwomen whose delivery was not attended by a healthprofessional [Statistics Indonesia (Badan Pusat Statis-tik – BPS) and Macro International 2008]. Despite thefact that this practice is prohibited by law, distributionof breast milk substitutes within hospitals has beenobserved (Besar et al. 2004).
The use of infant formula is widespread in Indone-sia, even among breastfeeding infants (Fig. 1).Increasing rates of exclusive breastfeeding and dis-couraging the use of breast milk substitutes wouldhelp improve health of Indonesian infants and theirmothers.
According to the 2007 Demographic and HealthSurvey (DHS) [Statistics Indonesia (Badan PusatStatistik – BPS) and Macro International 2008], halfthe children at 6–8 months did not consume carotene-rich fruit and vegetables the day and night before thesurvey, while only about 30% of breastfeeding and40% of non-breastfeeding infants consumed meat,fish, poultry and eggs. Only 42% of breastfed and 51%of non-breastfed children 6–23 months of age con-sumed foods made with fat or oil. It can be assumedthat if these children’s intake of animal-sourcefoods is also low, they are likely to consume low levelsof essential fatty acids, especially if they are notbreastfed.
Continued breastfeeding ensures children receivethe nutrients in breast milk that they cannot attain inadequate amounts from food (such as calcium andhigh-quality protein) unless they are fed with otheranimal and milk products. But of non-breastfed chil-dren aged 12-17 months, 24% received no milk prod-ucts on the preceding day; and at the age of 18–23months, this increased to 36%. Even though 75% ofchildren aged 6–23 months received animal productson the preceding day, the amount consumed is likely tobe small given the high cost and, so, is unlikely tosignificantly contribute to overall micronutrientintake.
World Health Organization (WHO) and UNICEFrecommend the use of complementary products inaddition to breast milk after 6 months of age whenthere is a gap in critical nutrients (World HealthOrganization & UNICEF 2008). The use of linearprogramming models for rural and peri-urban Indo-
nesian poor demonstrated that even with adequateintake of breast milk and use of the currently avail-able fortified infant cereals, soy-based foods andanimal-source foods in amounts that are affordable tothe poor, it is difficult to provide children aged 9–11months with adequate iron, zinc, calcium and B vita-mins because of the cost constraints faced by theaverage family (Ferguson et al. 2006; Santika et al.2009). A recent survey in West Timor reported con-sumption of vitamin A-rich foods to be only 113 RE/day among children aged 12–35 months, while theRecommended Daily Allowance is 400 RE/day(Church World Service et al. 2008). Given the currentdietary pattern, there is clearly a need for affordableCFS containing sufficient levels of fortification withthe critical micronutrients and essential fatty acids toimprove the local diet of infants and young children.
Until recently, the Ministry of Health (MOH) pro-vided, free of charge, fortified blended food to poorchildren aged 6–11 months and fortified biscuits topoor children aged 12–23 months but has now starteddistributing a MNP ‘Taburia’ during child health ses-sions (posyandu) in selected areas instead of theseproducts. The MOH, however, has insufficient fundsto distribute MNP to all poor children and, thus, dis-
tributes them to selected regions.The product is madelocally in East Java and has the potential to be mar-keted for wider availability. It is registered as a foodsupplement. A similar product registered in the samecategory is also being marketed by a subsidiary of acompany that also markets infant formula andcereals. As both these products fall in a general cat-egory not specifically created for products for olderinfants and young children, there is no language toensure that these products are marketed in line withthe Code of Marketing of Breastmilk Substitutes or inthe spirit of the Code, supporting breastfeeding.
Policy and regulatory environment with regardsto IYCF
Breastfeeding
The Indonesian government gives much attention toIYCF, in particular, to supporting breastfeeding (Min-ister of Health Republic of Indonesia 2004). A 2009Health Bill (UU 36/2009) made exclusive breastfeed-ing until 6 months mandatory and any person ‘inten-tionally obstructing breastfeeding’ is punishable withimprisonment for up to 1 year and a fine of up to USD
30 30 29 30 28
82 85 88
73
53
0
20
40
60
80
100
<6 6–8 9–11
Months
12–17 18–23
% o
f ch
ild
ren
Breastfed Not breastfed
Fig. 1. Per cent of children receiving infant formula in the preceding day and night (Statistics Indonesia (Badan Pusat Statistik – BPS) and MacroInternational 2008).
10 000. If a corporation commits this unlawful act, thefine can be tripled. In addition, the business licenseand/or legal entity status of the corporation can berevoked (Republic of Indonesia 2009).
Marketing of breast milk substitutes
Indonesia ratified part of the International Code forthe Marketing of Breastmilk Substitutes (the Code)(World Health Organization 1981) in 1997 (Ministerof Health, Republic of Indonesia 1997). This decree(which is currently being revised) only addressesinfants 0–11 months, thus providing no guidance formarketing of products targeted at young childrenaged 12 months or older. Furthermore, the languagesurrounding complementary foods has not lent itselfto easy interpretation.
The decree defines breast milk substitutes as ‘foodproducts that are marketed or otherwise meant asinfant food and used to substitute breast milk par-tially or completely’, while complementary foods aredefined as ‘food products that are marketed or other-wise stated as foods for infants over 4 months old tomeet their nutritional needs in addition to breastmilk’1. While the definitions are complex, the distinc-tion is critical. Foods marketed or intended as a sub-stitute for breast milk are covered by Codelimitations. However, foods marketed as a comple-ment to fulfil the nutrient gaps from 4 months andolder are not breast milk substitutes and, thus, may bepromoted. Unfortunately, early in the document thetext does not clarify the distinction between infantformula and complementary foods, which may add toconfusion. Further in the document, there is specificmention of ‘complementary food given using a bottleand nipple’ (and not other complementary foods) asbeing a ‘commercial breast milk substitute’. Whilecomplementary food given using a bottle and a nipplewould clearly be covered under the Code, it is not theonly manner in which to identify when a complemen-tary food is serving as a breast milk substitute (and assuch is subject to the Code). The complexity of defin-ing when a complementary food becomes a breast
milk substitute, as well as the language used in theIndonesian decree, might explain some parties’ reluc-tance to accept complementary foods as an indispens-able part of older infants’ and young children’s dietsand the need to ethically promote them.The outdateduse of 4 months rather than 6 months for age ofintroduction of solids within the Indonesian Codemay have further contributed to a less than whole-hearted universal endorsement of the need to activelyencourage the use of high-quality complementaryfoods and supplements. (This will be changed to 6months in the forthcoming revised decree.)
As for all food products, a registration permit fromthe National Agency for Food and Drug Control(BPOM) is required to distribute breast milk substi-tutes, including imported products. Although quitespecific on what exactly is prohibited in terms of mar-keting of breast milk substitutes, no legal penalties aredetailed in the Ministerial Decree of 1997. It onlymentions ‘administrative penalties, starting from averbal reprimand to withdrawal of permits as per thegoverning laws’2. In spite of these existing laws, andcertainly in part because of the lack of legal penalties,and difficulties with setting up a monitoring systemand systematic enforcement, there are multiplereports of retail level promotion of infant formula,follow-up formula and complementary foods forinfants under 6 months, with little or no public sectoraction to address these Code violations. (Besar et al.2004).
Baby-Friendly Hospital policies
Since the early 1990s, the Indonesian government hasmade progress in its support of appropriate IYCFpractices, including adoption of the Baby-FriendlyHospital Initiative (BFHI) (UNICEF 2009), launchedin 1991 by WHO and UNICEF. A maternity facilitycan be designated ‘baby-friendly’ when it does notaccept free or low-cost breast milk substitutes, feedingbottles or teats, and has implemented the Ten StepsTowards Effective Breastfeeding, which include ‘Givenewborn infants no food or drink other than breastmilk, unless medically indicated’. In 2004, a decree
1This was in 1997, when it was generally assumed complementary
feeding (CF) should start at 4 months of age. 2Punishment is mentioned in UU 36/2009.
from the Minister of Health officially promoted exclu-sive breastfeeding until 6 months, supported by theTen Steps Towards Effective Breastfeeding (WorldHealth Organization & UNICEF 1989) together withcontinued breastfeeding until 2 years along withappropriate complementary feeding (Ministry ofHealth Republic Indonesia 2004). This was, however,only legislated in October 2009 (Republic of Indone-sia 2009).
Despite the fact that legislation supporting breast-feeding references the Ten Steps, it does not requireimplementation of the BFHI. Reports indicate thatimplementation of the Baby-Friendly Hospital Initia-tive has long been neglected, although efforts arebeing made to revitalize it (Laksono et al. 2010).
There is a need to monitor Baby-Friendly hospitalson an annual basis and require annual recertificationso that those not meeting the requirements can beinformed and encouraged to make appropriatechanges.The DHS illustrates that 70% of infants bornin health facilities were given prelacteal feeds, and57% were not breastfed in the first hour afterdelivery, illustrating that these facilities were notBaby Friendly. There is also a need to include Baby-Friendly Hospital practices within accreditation crite-ria for hospitals so that these become an establishedpractice just as standard operational proceduresand hospital by-laws are compulsory for hospitalaccreditation.
In addition to Baby-Friendly policies for hospitals,maternity leave policies and employer policies pro-viding time, space and support for breastfeeding arealso critical for exclusive and continued breastfeed-ing. However, these are beyond the scope of thispaper, which is focused on policies directly relating toavailability, marketing, use and misuse of infant foodproducts.
National Codex
The Indonesian National Standard for Complemen-tary Foods (SNI MP-ASI) (Head of the NationalBureau of Standards 2005) consists of four parts:instant cereal powders, biscuits, ready-to-cook prod-ucts and ready-to-eat products. The standard definescomplementary foods as ‘nutritious foods given in
addition to breastmilk to infants aged 6 months andolder or on medical indication, until the age of 24months’. The formulation of this standard took 4years and involved all stakeholders including theassociations of food and beverages producingcompanies and baby-food producers, universities,professional organizations, non-governmentalorganizations (NGOs) and related governmentinstitutions.
Unfortunately, there is no category within thisnational standard for CFS. Therefore, the only com-mercially available food products falling under thiscategory for infants and young children are instantcereals, biscuits and a few ready-to-cook products. Allthese products are currently fortified to some degree.The contents of these products comply with thenational Codex standards as this is a prerequisite forthe registration and marketing of these products.However, there is a concern that they could poten-tially interfere with continued breastfeeding becauseof the caloric content, recommended portion size andthe recommended frequency of feeding, which areoften not in line with best practices (Ten Year Strat-egy to Reduce Vitamin and Mineral DeficienciesMIYCN Working Group: Formulations Subgroup2009). For example, there are products that are sug-gested for use from 4 months of age that are in linewith existing national Codex regulations; however,relevant World Health Assembly resolutions subse-quent to the International Code and other interna-tional guidelines identify 6 months as the appropriateage for the introduction of complementary foods.Examples such as this lead to understandable concernfrom the nutrition and child health community, andindeed all those who support optimal infant feedingand should be rectified.
The fortified infant cereals sold in Indonesia typi-cally contain 200–210 kcal per portion of 40-50 g perserving and suggest multiple servings per day. Thisalready exceeds the recommended energy intakefrom complementary foods for infants 6–8 months oldwho are breastfeeding and is almost half the require-ment for children 12–23 months of age who arebreastfeeding (Pan American Health Organization/World Health Organization 2003). Biscuits contain78–90 kcal per serving and typically 6 g sugar (30%E)
in approximately 20 g per biscuit. This is in line withthe National Codex that requires infant cereals tocontain at least 0.8 kcal per gram and biscuits at least4 kcal per gram (Head of the National Bureau ofStandards 2005). National guidelines, however, shouldconsider a lower limit for sugar (such as less than10%) (Ten Year Strategy to Reduce Vitamin andMineral Deficiencies MIYCN Working Group: For-mulations Subgroup 2009) and lower the suggestedserving sizes of complementary foods (e.g. 25 g) so asto ensure that these foods do not interfere withbreastfeeding. Current pending revision of NationalCodex guidelines also suggests exclusion of productscontaining trans-fatty acids. Because it is currently notrequired that infant food labels contain informationon trans-fatty acid content, it is likely that many prod-ucts sold in Indonesia do contain trans-fatty acids.
Support and promotion of optimalIYCF practices
Both the MOH and NGOs/International organiza-tions have extensively promoted breastfeeding, inparticular exclusive breastfeeding for the first 6months, and many policies and guidelines are inplace to support optimal practices. However, thereare still many hurdles to overcome as evidencedby the unsatisfactory exclusive breastfeeding rates.The rate of exclusive breastfeeding for children lessthan 6 months of age is just 32.4%, and continuedbreastfeeding at 2 years is 50.3% [StatisticsIndonesia (Badan Pusat Statistic – BPS) and MacroInternational)].
In contrast to breastfeeding interventions, comple-mentary feeding interventions have been relativelyneglected – perhaps because the messages are morecomplicated and more context specific than forexclusive breastfeeding. It is telling that the MOHhas set behaviour change communications forimproved complementary feeding as a goal in itsNational Action Plan for Food & Nutrition 2006–2010. It might be useful to set targets for comple-mentary feeding practices such as increasing the percent of children 6–24 months of age who receiveiron rich or iron fortified food (World Health Orga-nization 2008).
Promoting CFS and protecting breastfeeding:what needs to be done?
CFS such as lipid-based nutrient supplements (e.g.Nutributter®) should be part of a larger strategy tocombat childhood malnutrition, which also includesexclusive breastfeeding for 6 months, continuedbreastfeeding for up to 2 years and beyond, improveddietary diversity, appropriate frequency of feeding,and the inclusion of animal products in young chil-dren’s diets. As part of a broader nutrition strategy,CFS provide a powerful tool with which to addressthe poor dietary quality of the complementary diet(Adu-Afarwuah et al. 2007; Wang et al. 2007; Deweyet al. 2009; de Pee & Bloem 2009). In order to provideaccess to these products, barriers to use and promo-tion need to be addressed, and controls ensuring theirproper use and promotion need to be in place.
Category in Codex
Many countries follow Codex Alimentarius whensetting their national legislation, but Codex does notyet have a category under which CFS fall. Codex Ali-mentarius, therefore, needs to revise their texts toinclude a category for ‘complementary food supple-ments’: products that can supplement the nutritionalcontent of locally accepted complementary foods.This category should at least include lipid-basedsupplements, and it could serve as a model for indi-vidual country standards.
As the revision of the Codex Alimentarius stan-dards and guidelines is a lengthy process, it is possiblefor individual countries to initiate a process to revisetheir own national Codex to allow appropriate use ofCFS. This has already been done in some countries.For example, there is a standard for fortified soy flourand for supplements for complementary foods inChina.
Product registration
Currently in Indonesia, as in most countries, there isno special category for CFS such as MNPs or lipidnutrient supplements. Complementary foods can onlybe registered if they fall in one of four very distinct
categories: cereal-based, biscuits, ready-to-eat andready-to-cook. This greatly limits companies’ oppor-tunity to produce and market innovative products toreduce malnutrition as part of the local diet.Any foodthat is marketed for infants and young children has tofall under the current categories, and no other cat-egory allows for foods targeted at this group or anyother particular age group.
However, there are two other categories underwhich CFS could fall: food supplements (as is cur-rently the case with MNPs) or ‘foods for specialuses’. As these are loosely defined and non-age spe-cific, it is easier to fit a product in one of these catego-ries. This has the advantage of providing wider accessto products that help fill the nutrient gap of youngchildren. Unfortunately, it also opens the way to un-controlled and misleading promotion and marketing.
In order to be able to combine wide access to high-quality products designed to prevent malnutritionamong vulnerable 6–24 months old children, andstrict regulation as to the labelling and marketing ofthese products to prevent inappropriate use, it isessential that a new, specific category be defined forthese products.
The establishment of the existing categories forcomplementary foods in Indonesia took 4 years. Inorder for the registration rules to be altered or for anew subcategory to be added, a long process needs totake place, including numerous meetings with expertsin the field and all companies in the industry. It is,therefore, expedient for the public sector to initiateand manage the process of developing a new categoryfor CFS.
Clearly identify products as complementary foods ratherthan breast milk substitutes
Once a category is created for CFS,products should belabelled and marketed in a manner such that they willbe used solely as a complementary food and are notmisused as a substitute for breastfeeding. In order toavoid misrepresentation of the product, certain guide-lines emanating from the Code need to be followed:
• The age of introduction should not precede 6months and should be clearly stated on all packaging.
If pictures are used, children should appear older than6 months and show achievement of a physical ordevelopmental milestone clearly reached after6 months.• Instruction should be given to serve the productwith a daily ration of food that is less than the rec-ommended daily energy intake from complementaryfoods for a breastfed child. Large servings (whichare often now recommended for many infantcereals) would interfere with continued breastfeed-ing and, thus, act as a breast milk substitute. (SeeTable 1.)• To further ensure that the product is not misused,the importance of exclusive breastfeeding for the first6 months and continued breastfeeding to 2 years andbeyond should be clearly stated in a conspicuous wayon product packaging and in marketing messages.• All marketing messages should make clear that theproduct is for children 6–24 months as well as makeclear the points listed above.
These requirements are in keeping with thecurrent wording in the International Code and sub-sequent World Health Assembly (WHA) resolu-tions. (World Health Organization 1981) (Quinnet al. 2010). Explicit national guidelines stating theserequirements would help clarify which productis a complementary food to be promoted andwhich one serves as a breast milk substitute andis, therefore, subject to all marketing restrictionsoutlined in the Code. The national guidelinesshould also give guidance on which nutrition andhealth claims are acceptable for such products,if any.
Table 1. Energy needs from complementary foods (kcal/day) byfeeding status (Pan American Health Organization/World Health Orga-nization 2003).
Enforce the Code of Marketing of Breastmilk Substitutes
A landscape analysis of the health system was con-ducted in 2010, coordinated by the Ministry of Healthand Bappenas (the National Planning Board) withtechnical and financial support of UNICEF, WHOand WFP Indonesia. One of the recommendations ofthis analysis was that a government regulation (incontrast to a decree which is less enforceable) shouldbe approved to control the marketing of breast milksubstitutes and develop a mechanism for monitoringand enforcement (Ministry of Health/Bappenas/UNICEF/WHO 2010). Without effective monitoringand enforcement systems to ensure compliance, leg-islation implementing the Code is of little value.Aguayo et al. (2003) found that comparable levels ofCode violations were observed in Burkina Faso,where there is regulating legislation, and in Togo,where there is no legislation, and concluded that leg-islation must be accompanied by effective informa-tion, training and monitoring systems to ensure thathealthcare providers and manufacturers comply withevidence-based practice and the Code. Improved edu-cation about, and enforcement of, the Code is criticalboth to protect breastfeeding as well as to responsiblyallow for the necessary opening of a clearly definedspace to promote appropriate complementaryfeeding in addition to breastfeeding for 6–24 months.
Discussion
Breastfeeding advocates have done an enormous jobin getting breastfeeding on the Indonesian healthagenda to the extent that exclusive breastfeeding forthe first 6 months of life is now mandatory in Indone-sia. In addition to protecting breastfeeding, the impor-tance of timely, adequate and safe complementaryfeeding needs to be emphasized.
The Indonesian Code itself is not easy to interpreton the topic of complementary foods leaving it opento multiple interpretations that can, and do, result inirresponsible marketing of these products. Further-more, it was not designed to address CFS, which didnot exist at the time that the Code was drafted buthave now been shown to be beneficial.
While previously the Indonesian governmentreceived funding for special health department activi-
ties from infant formula manufacturers, this policy hasnow been changed and existing contracts will be dis-continued (Supriyono 2010). In line with WHA Reso-lution 58.32 (World Health Assembly 2005), thegovernment will no longer use sponsor funds for itshealth activities from companies that produce breastmilk substitutes but instead will work together withnon-profit organizations such as WHO, UNICEF andothers. These changes were necessary and should beapplauded. Further government and multistake-holder action needs to be taken to fully implementand enforce the International Code of Marketing ofBreastmilk Substitutes and ensure Baby-FriendlyHospitals are certified and follow the practices out-lined in the 10 Steps to Successful Breastfeeding(World Health Organization & UNICEF 1989),including not distributing infant formula. Along withthis, the government now needs to open the door forthe private sector groups that comply with the Codeof Marketing of Breastmilk Substitutes to developand appropriately promote CFS for children aged6–24 months in order to promote optimal develop-ment during the crucial 1000-day window of opportu-nity from birth to 2 years.
Source of funding
Authors (Soekarjo, Zehner) received support fromthe Global Alliance for Improved Nutrition.
Conflict of interest statement
No conflicts of interest have been declared.
References
Adu-Afarwuah S., Lartey A., Brown K.H., Zlotkin S.,Briend A. & Dewey K.G. (2007) Randomized compari-son of 3 types of micronutrient supplements for homefortification of complementary foods in Ghana: effectson growth and motor development. American Journal ofClinical Nutrition 86, 412–420.
Adu-Afarwuah S., Lartey A., Brown K.H., Zlotkin S.,Briend A. & Dewey K.G. (2008) Home fortification ofcomplementary foods with micronutrient supplements iswell accepted and has positive effects on infant ironstatus in Ghana. American Journal of Clinical Nutrition87, 929–938.
Agency for Health Research and Development. Republicof Indonesia (December 2008) Basic Health Research(Riskesdas) 2007 National Report (Badan Penelitian danPengembangan Kesehatan Departemen Kesehatan,Republik Indonesia. Riset Kesehatan Dasar (RISKES-DAS) 2007, Laporan Nasional 2007. Desember 2008.Available at: http://www.gizi.net/download/statgizi-nas-riskesdas%202007.pdf (Accessed 31 January 2011).
Aguayo V.M., Ross J.S., Kanon S. & Ouedraogo A.N.(2003) Monitoring compliance with the InternationalCode of Marketing of Breastmilk Substitutes in westAfrica: multisite cross sectional survey in Togo andBurkina Faso. British Medical Journal 326, 127–132.Available at: http://www.bmj.com/content/326/7381/127.1.full (Accessed 20 December 2010).
Besar D.S. et al. (2004). Indonesia code violations. Avail-able at: http://aimi-asi.org/wp/wp-content/files/ibfan%20report%20indo.pdf (Accessed 11 January2011).
Chen C.M., Wang Y.Y. & Chang S.Y. (2010) Effect ofin-home fortification of complementary feeding onintellectual development of Chinese children. Biome-dical and Environmental Sciences 23, 83–91.
Church World Service, Helen Keller International, CARE(2008) Nutrition Survey in East Nusa Tenggara (NTT).Final Report.
Dewey K.G., Yang Z. & Boy E. (2009) Systematic reviewand meta-analysis of home fortification of complemen-tary foods. Maternal & Child Nutrition 5, 283–232.
Dijkhuizen M.A., Wieringa F.T., West C.E. & Muherdiyan-tiningsih, Muhilal (2001) Concurrent micronutrient defi-ciencies in lactating mothers and their infants inIndonesia. American Journal of Clinical Nutrition 73,786–791.
Head of the National Bureau of Standards (2005) Decisionof the Head of the National Bureau of Standards (SKKepala BSN Nomor 52/KEP/BSN/05/2005) dated 23 Mei2005 regarding the formulation of four IndonesianNational Standards. Available at: http://websisni.bsn.go.id/index.php?/sk_main/surat_keputusan/sksni/1/91(Accessed 5 November 2010).
Kothari, M & Abderrahim, N (2010) Nutrition Update2010. ICF Macro: Calverton, MD.
Laksono T., Soeharsono S., Budihardja S., Kirana P., ErnaM., Handy A.F. et al. (2010) Reducing child mortality inIndonesia. Bulletin of the World Health Organization[serial on the Internet] 88, 642–642. Available at: http://www.scielosp.org/scielo.php?script=sci_arttext&
Ministry of Health/Bappenas/UNICEF/WHO (2010) TheLandscape Analysis Indonesia Country assessment. Sep-tember Jakarta, Indonesia.
Minister of Health, Republic of Indonesia (1997) Ministe-rial Decree Number 237, 1997. Available at: http://www.selasi.net/keputusan-menteri/kemmenkes-237-tahun-1997 (Accessed 5 November 2010).
Ministry of Health Republic of Indonesia (2004) Keputu-san Menteri Kesehatan Republik Indonesia No. 450/Menkes/IV/2004 tentang Pemberian Air Susu Ibu (ASI)secara Eksklusif pada Bayi di Indonesia, 10 April 2004.Available at: http://www.gizi.net/kebijakan-gizi/download/SK-ASI-Eksklusif.pdf (Accessed 5 November2010).
Pan American Health Organization/World Health Organi-zation (2003) Guiding Principles for ComplementaryFeeding of the Breastfed Child. Available at: http://www.who.int/child_adolescent_health/documents/a85622/en/index.html (Accessed 21 January 2011).
de Pee S., Martini E., Moench-Pfanner R., Firdaus M.A.,Stormer A., Halati S. et al. (2004) Nutrition and HealthTrends in Indonesia 1999-2003. Nutrition & HealthSurveillance System Annual Report 2003. Jakarta, Indo-nesia: Helen Keller International.
de Pee S., Moench-Pfanner R., Martini E., Zlotkin S.,Darnton-Hill I. & Bloem M.W. (2007) Home fortifica-tion in emergency response and transition programming:experiences in Aceh and Nias, Indonesia. Food andNutrition Bulletin 28, 189–197.
de Pee S. & Bloem M.W. (2009) Current and potential roleof specially formulated foods and food supplements forpreventing malnutrition amung 6- to 23-month-old chil-dren and for treating moderate malnutrition amoung 6-to 59-month-old children. Food and Nutrition Bulletin 30(Suppl.), S434–S463.
de Pee S., Brinkman H.J., Webb P., Godfrey S., Darnton-Hill I., Alderman H., Semba R.D., Piwoz E. & BloemM.W. (2010) How to ensure nutrition security inthe global economic crisis to protect and enhancedevelopment of young children and our common future.The Journal of Nutrition 140, 138S–142S. Epub 2009Nov 25.
Quinn V., Zehner E., Schoefield D., Guyon A. & HuffmanS.L. (2010) Using the code of marketing of breast-milksubstitutes to guide the marketing of complementaryfoods to protect optimal infant feeding practices. GlobalAlliance for Improved Nutrition (GAIN). Geneva,Switzerland.
Republic of Indonesia (2009) Health Bill (Law no 36,2009). Available at: http://www.depdagri.go.id/produk-hukum/2009/10/13/undang-undang-no-36-tahun-2009(Accessed 5 November 2010).
Santika O., Fahmida U. & Ferguson E.L. (2009) Develop-ment of food based complementary feeding recommen-dations for 9- to 11-month-old peri-urban Indonesianinfants using linear programming. Journal of Nutrition139, 135–141.
Statistics Indonesia (Badan Pusat Statistik – BPS) andMacro International (2008) Indonesia Demographic andHealth Survey (2007) Calverton, Maryland, USA: BPSand Macro International. Available at: http://www.measuredhs.com/pubs/pub_details.cfm?id=897&srchTp=home (Accessed 15 November 2010).
Supriyono A. (2010) Government Health Activities will nolonger Use Sponsor Funds [Kegiatan Kesehatan Pemerin-tah tak Lagi Pakai Dana Sponsor]. Republika – Thurs-day, August 12, 2010. Available at: http://www.repulika.co.id (Accessed 5 November 2010).
Ten Year Strategy to Reduce Vitamin and MineralDeficiencies, Maternal, Infant and Young ChildNutrition Working Group: Formulations Subgroup(2009) Formulations for fortified complementary foodsand supplements: review of successful products forimproving the nutritional status of infants and youngchildren. Food and Nutrition Bulletin 30 (Suppl.), S239–S255.
The World Bank Group (2010) PovcalNet. Available at:http://iresearch.worldbank.org/PovcalNet/povcalSvy.html(Accessed 5 November 2010).
UNICEF (December 2008) The State of the World’s Chil-dren 2009: Maternal and Newborn Health. UNICEF.New York, USA. Available at: http://www.unicef.org/publications/index_47127.html (Accessed 5 November2010).
UNICEF (12 August, 2009) The Baby Friendly HospitalInitiative. Available at: http://www.unicef.org/nutrition/index_24806.html (Accessed 5 November 2010).
Victora C.G., Adair L., Fall C., Hallal P.C., Martorell R.,Richter L., Sachdev H.S. & Maternal and Child Under-nutrition Study Group (2008) Maternal and child under-nutrition: consequences for adult health and humancapital. Lancet 371, 340–357.
Victora C.G., de Onis M., Hallal P.C., Blössner M. &Shrimpton R. (2010) Worldwide timing of growth falter-ing: revisiting implications for interventions. Pediatrics125, e473–e480. Epub 2010 Feb 15.
Wang Y., Chen C., Wang F. & Wang K. (2007) Effects ofnutrient fortified complementary food supplements ongrowth of infants and young children in poor rural areain Gansu Province. Journal of Hygiene Research 36,78–81. (in Chinese).
World Health Assembly (25 May 2005) WHA 58.32 Infantand Young Child Nutrition. Available at: http://www.who.int/gb/ebwha/pdf_files/WHA58/WHA58_32-en.pdf (Accessed 5 November 2010).
World Health Organization (1981) International Code ofMarketing of Beastmilk Substitutes. World Health Orga-nization: Geneva. Available at: http://www.infactcanada.ca/crackcode.htm (Accessed 21 February 2011).
World Health Organization (2008) Indicators for AssessingInfant and Young Child Feeding Practices: Conclusionsof a Consensus Meeting Held 6-8 November 2007 inWashington D.C., USA. WHO: Geneva.
World Health Organization (18 July 2009) Global Data-base on Child Growth and Malnutrition. Available at:http://www.who.int/nutgrowthdb/database/countries/who_standards/idn.pdf (Accessed 5 November 2010).
World Health Organization & UNICEF (1989) ProtectingPromoting and Supporting Breastfeeding: The SpecialRole of Maternity Services, a joint WHO/UNICEF state-ment. Geneva, 1989. Available at: http://www.unicef.org/newsline/tenstps.htm (Accessed 19 December 2010).
World Health Organization & UNICEF (2003) GlobalStrategy for Infant and Young Child Feeding. WHO:Geneva. Available at: http://www.who.int/nutrition/publications/infantfeeding/9241562218/en/index.html(Accessed 6 April 2010).
World Health Organization & UNICEF (2008) Strengthen-ing Actions to Improve Feeding of Infants and YoungChildren 6-23 Months of Age in Nutrition and ChildHealth: Report of Proceedings, Geneva, 6-9 October 2008.WHO: Geneva.
Fortifying complementary foods with NaFeEDTA –considerations for developing countriesmcn_355 123..128
Zhenyu Yang*†, Jonathan Siekmann* and Dominic Schofield**Global Alliance for Improved Nutrition (GAIN), Geneva, Switzerland, and †National Institute for Nutrition and Food Safety, China Center for DiseaseControl, Xuanwu District, Beijing, China
Abstract
As a highly bioavailable iron compound, sodium iron (iii) ethylenediaminetetraacetate (NaFeEDTA) has beenrecommended as a food additive for fortification. The amount of a food additive that can be ingested daily overa lifetime without appreciable health risk is termed the acceptable daily intake (ADI).The ADI for NaFeEDTAis based on body weight. For complementary foods and food supplements for infants and young children inlow-income countries, where prevalence of underweight is high yet nutrient needs are also high, it is not clearwhich doses might be appropriate. The objective is to calculate the dosage of NaFeEDTA for fortifyingcomplementary foods assuming different population prevalences of underweight. Mathematical models wereused to simulate the dosage of NaFeEDTA for 6- to 8-month-old infants under different prevalences ofunderweight ranging from 5% to 40%. In order to keep NaFeEDTA intake below the ADI for ethylenedi-aminetetraacetate (EDTA) recommended by the Joint Food and Agriculture Organization (FAO)/World HealthOrganization (WHO) Expert Committee on Food Additives for 95% of 6- to 8-month-old infants, the daily irondose from NaFeEDTA in fortified complementary foods should be set between 2.2 mg and 1.8 mg in countrieswith a prevalence of underweight among 6- to 8-month-old infants between 5% and 40%, respectively. If 2 mgof iron is given to all 6- to 8-month-old infants, the percentage exceeding the ADI for EDTA would be <10% forpopulations with <30% of children who are underweight, which is the case for many countries. In conclusion,2 mg of iron from NaFeEDTA could be used for fortifying one daily serving of complementary food to ensureEDTA levels are below the ADI for infants 6–8 months of age. An additional source of iron (such as ferroussulfate) should be included to increase the iron dose to desired fortification levels.
Correspondence: Zhenyu Yang, National Institute for Nutrition and Food Safety, China CDC no. 29 Nanwei Road, Xuanwu District,Beijing 100050, China. E-mail: [email protected]
Introduction
Iron deficiency is one of the most commonly recog-nized micronutrient deficiencies for infants and youngchildren around the world. Iron deficiency can resultin anaemia, abnormal psychological development andsuboptimal physical work capacity (World HealthOrganization 2001). The causes of iron deficiency
during infancy are related to high iron requirementsfor growth and relatively low iron content and poorbioavailability in complementary foods in low-income countries (Dewey 2007). The bioavailablilityof iron is low in plant-based complementary foods,and consumption of foods with high iron bioavailabil-ity such as meat, fish and poultry is generally inad-equate in the developing world (Dewey 2007).
Iron-fortified complementary food is considered to bea cost-effective way to fulfil infants’ iron require-ments. Fortification of complementary foods can bedone at the site of manufacturer (e.g. a commerciallyprepared fortified porridge) or at home {e.g. homefortification with multimicronutrient powder [MNP]or fortified soy powder [Ying Yang Bao (YYB)]}.
Various iron compounds are available for fortifyingcomplementary foods, including ferrous sulfate,ferrous fumarate and electrolytic iron (Allen et al.2006). As a highly bioavailable iron compound,sodium iron (iii) ethylenediaminetetraacetate(NaFeEDTA) has been recommended for food forti-fication (e.g. wheat flour, soy sauce, fish sauce andsugar) (Allen et al. 2006), and the relatively highercost of NaFeEDTA is offset by its higher bioavailabil-ity, particularly in high-phytate diets. Some home for-tificants (e.g. MNP and YYB) also use NaFeEDTA astheir iron source. Like other EDTA and metal com-pounds, NaFeEDTA releases iron from EDTA salt inthe gastrointestinal tract (mainly intestinal) (Heim-bach et al. 2000). The iron is absorbed through apathway similar to other non-haem iron. The EDTAabsorption is independent of iron absorption (Heim-bach et al. 2000). Thus, the safety concern forNaFeEDTA is similar to the concern for other metal-EDTA compounds (Heimbach et al. 2000).
The Joint Food and Agriculture Organization(FAO)/ World Health Organization (WHO) ExpertCommittee on Food Additives (JECFA) states thatthe total intake of EDTA should not exceed accept-able levels (1.9 mg/kg body weight EDTA) aftertaking into account the intake of EDTA in the form offood additives based on EDTA compounds (JECFA2007). Acceptable daily intake (ADI) is a measure ofthe amount of a food additive that can be consumedon a daily basis over a lifetime without an appreciablehealth risk.The ADI for NaFeEDTA is based on body
weight, and body weight increases rapidly during 6–24months of age. Complementary food recommenda-tions are commonly grouped into 6–8 months, 9–11months and 12–23 months. While the youngest chil-dren have a higher iron requirement, their weights arelower, and thus this puts them at greater risk ofexceeding the ADI for EDTA.
In addition, the prevalence of underweight for chil-dren 6–24 months of age is high and varies acrosslow-income countries (Black et al. 2008).Thus, it is notclear which doses would be appropriate for fortifyingcomplementary foods for infants and young childrenin countries with high burdens of underweight. Thepurpose of the present analyses is to estimate the doseof NaFeEDTA used in iron-fortified complementaryfoods in countries with a high burden of underweight.Additionally, the methodology used here has implica-tions for calculating levels of nutrients in foods forthis target age group that are also based on bodyweight (e.g. essential fatty acids).
Materials and methods
The distribution of z-score was simulated with normalfunction with a sample size (n = 10 000). The com-bined body weight distributions for 6- to 8-month-oldmale and female reference infants were constructedbased on the Box-Cox power exponential methodwith the formula weight = (z-value*S*L+1)1/L*M (deOnis 2006). The WHO Child Growth Standardsparameters (L, M, S) were used for the calculation (deOnis 2006) where ‘L’ is the power transformationparameter for normal distribution, ‘M’ is the medianof weight distribution and ‘S’ is the sample standarddeviation.
The combined body weight distributions for 6- to8-month-old infants in high burden countries wereconstructed under different levels of prevalence of
Key messages
• Two milligrams of iron from sodium iron (iii) ethylenediaminetetraacetate NaFeEDTA could be used forfortifying one daily serving of complementary food to ensure ethylenediaminetetraacetate (EDTA) levels arebelow the acceptable daily intake for infants 6–8 months of age in many low-income countries.
• An additional source of iron (such as ferrous sulfate) should be included to increase the iron dose to desiredfortification levels.
underweight ranging from 5% to 40%, which aretypical for many low-income countries. Underweightwas defined as weight-for-age z-score < -2 (de Onis2006). Either mean changes or mean and variancechanges were assumed for constructing a new bodyweight distribution. Both assumptions yielded similarresults. Then the newly constructed weight distribu-tion for each prevalence of underweight was used tocalculate 2.5th and 5th percentile body weight. Basedon the 2.5th percentile and 5th percentile body weightunder each prevalence of underweight and ADI forEDTA (1.9 mg/kg body weight), the maximumamount of iron from NaFeEDTA was calculated.
RAND function in the Statistical Analysis System(SAS) was used for normal distribution simulation(SAS version 9.2; SAS Institute Inc., Cary, NC, USA).
Results
Based on Demographic and Health Survey data, thecountries with prevalence of underweight between5% and 40% are shown in Table 1.The combined 6–8months boy and girl body weight distribution is shownin Fig. 1 with the 2.5th percentile, 5th percentile andmedian body weight at 6.14 kg, 6.41 kg and 7.97 kg,respectively. By increasing the rates of underweight inthe model from 5% to 40%, the 2.5th percentile and5th percentile body weight decreases from 5.83 kg to4.76 kg and from 6.08 kg to 4.97 kg, respectively. Inorder to keep NaFeEDTA intake below the ADI forEDTA recommended by JECFA for 95% of 6- to8-month-old infants, the daily iron dose fromNaFeEDTA in fortified complementary foods cannotexceed 2.2 mg to 1.8 mg, correspondingly (Table 1). Inorder to keep NaFeEDTA intake below the ADI forEDTA recommended by JECFA for 95% of 6–8months of age girls, the daily iron dose fromNaFeEDTA in fortified complementary foods cannotexceed 2.2 mg to 1.7 mg, correspondingly (data notshown).
The overall prevalence of underweight in low-income countries is about 20%, and only a few coun-tries in South Asia and East Africa have a prevalence�30%. If 2 mg of iron from NaFeEDTA were givento all 6- to 8-month-old infants, the percentageexceeding the ADI for EDTA would be <10% for Ta
populations with <30% of children who are under-weight, which is the case for most of these countries(Table 2).
However, if 2.5 mg iron were given in NaFeEDTAform to all 6- to 8-month-old infants, 30–64% ofinfants would be above the ADI of EDTA. For infants9–11 months, with the use of 2.5 mg, these figures are
5% and 30%, and for those 12–23 months, thesefigures are 1% and 8% (data not shown).
Discussion
These analyses indicate that the daily iron dose fromNaFeEDTA in fortified complementary foods shouldrange from 2.2 mg to 1.8 mg to maintain EDTAintake below the ADI recommended by JECFA for95% of 6- to 8-month-old infants, as prevalence ofunderweight of 6- to 8-month-old infants ranges from5% to 40% in the statistical model. In low-incomecountries with various prevalences of underweight,2 mg of iron from NaFeEDTA could be used for for-tifying complementary foods for 6-to 24-month olderinfants and young children. This minimizes the risk ofexceeding the ADI in infants 6–8 months of age. If asmaller portion size were suggested for the youngestinfants (such as 1/2 portion per day), a higher level(such as 2.5 mg) could be used for young children12–23 months of age, but then the infant would notreceive sufficient quantities of the other nutrients.
The iron absorption rate from NaFeEDTA is abouttwo to three times greater than that from eitherferrous fumarate or ferrous sulfate in high-phytate
Fig. 1. The body weight (kg) distribution for 6- to 8-month male and female infants in World Health Organization reference population.
Table 2. Estimated percentage of children 6–8 months of age whoseintake of EDTA would be above upper limit under different prevalencesof underweight given a single iron dose (2 mg or 2.5 mg)
Prevalenceof underweight(%)
Percentage ofchildren whoseintake of EDTAwould be aboveADI at 2 mg iron (%)
Percentage ofchildren whoseintake of EDTAwould be aboveADI at 2.5 mg iron (%)
diets (Allen et al. 2006). This could be very effectivefor enriching complementary foods or complemen-tary food supplements, as phytate content is generallyhigh in cereal-based complementary foods [Inter-national Nutritional Anemia Consultative Group(INACG) 1993; Hurrell et al. 2000]. The dose of 1.8–2.2 mg iron from NaFeEDTA would provide about0.18–0.22 mg absorbed iron, assuming 10% absorp-tion based on MNP intervention studies and isotopicstudies (Troesch et al. 2009; Troesch et al. 2011), whichcorresponds to 19–24% of iron requirements for 6- to11-month-old infants and 31–38% of iron require-ments for children aged 1–3 years (WHO/FAO 2004).Although this level still only meets about 1/5–1/3 ofiron requirements for infants and young children, theEDTA could also enhance the absorption of food ironand soluble iron compounds from other sources (e.g.other iron fortificants) (Allen et al. 2006). However,this model also assumes consumption of a fixed dailyserving and comparable absorption rates of iron indifferent settings. It does not take into accountinfection/inflammation and other factors that canaffect iron absorption.
A recent study in South Africa showed that a MNPcontaining 2.5 mg of iron from NaFeEDTA signifi-cantly improved iron status (ferritin, transferrinreceptor and body iron) and reduced iron deficiencyof children aged ~8 years old when it was added to amaize porridge (Troesch et al. 2011). Another studyprovided 6 mg iron from NaFeEDTA to infants andyoung children through a fortified full-fat soy powder(YYB) in China (Wang et al. 2009). This was an inter-vention trial for older infants (n = 1478) and lasteduntil the children reached 24 months of age.YYB wasgiven to an intervention group daily and a non-fortified isocaloric rice powder was given to a controlgroup. The results found that YYB significantlydecreased the prevalence of anaemia (Wang et al.2009). MNP containing 2.5 mg of iron fromNaFeEDTA was also used in a programme in theKakuma Refugee Camp in Kenya to improve ironstatus in a malaria-endemic area (World FoodProgram et al. 2009). MNP was offered to children6–59 months and to non-pregnant women for 13months.At baseline, mid-term and endline, haemoglo-bin and iron status were evaluated. Compared to
baseline, iron status was improved at the mid-termand endline, but anaemia did not decrease (Ndemwaet al. 2011).
During the complementary feeding period, bodyweight increases rapidly and iron requirements arelower at 12–23 months of age than at 6–11 months ofage. If body weight of 12- to 23-month-old children isused for estimating NaFeEDTA dose for fortifyingcomplementary foods (e.g. if 2.5 mg of iron fromNaFeEDTA is given to children aged 12–23 months,1–8% of the population under 5–30% of prevalenceof underweight would be over ADI for EDTA.), therewill be higher risk of intakes over the ADI for 6- to11-month-old infants (e.g. if 2.5 mg of iron fromNaFeEDTA is given to children aged 6–11 months,30–64% of 6- to 8-month-old infants and 5–30% of 9-to 11-month-old infants under 5–30% of prevalenceof underweight would be over ADI for EDTA).However, if body weight of 6-month-old infants isused for estimating the NaFeEDTA dose, the irondose from NaFeEDTA would be relatively small forother older children. Thus, body weights of 6- to8-month-old infants were combined for estimatingNaFeEDTA dose. The 6- to 8-month age group iscommonly used for estimating energy and nutrientrequirements from complementary foods (Dewey& Brown 2003). Although 6 mg of iron fromNaFeEDTA was used in YYB in China and 2.5 mg ofiron from NaFeEDTA was used in MNP in Kenya,there were no adverse effects (although the studieswere not powered to assess adverse effects) reportedin these two projects; 18–64% of 6- to 8-month-oldinfants would be over ADI of EDTA when 2.5 mg ofiron from NaFeEDTA is given to infants and youngchildren where the prevalence of underweight rangesbetween 5% and 30%.
In conclusion, 2 mg of iron daily from NaFeEDTAcould be used for fortifying complementary foodswithout exceeding the ADI for EDTA for the major-ity of 6- to 24-month-old infants and young children indeveloping countries with varying prevalences ofunderweight. Because this level is below the iron ref-erence nutrient intake (RNI), NaFeEDTA should beone part of the iron fortification used in complemen-tary food and should be in addition to another goodsource of iron to reach the desired iron levels in the
complementary food. For example, in China, acomplementary food supplement included 2.5 mgfrom EDTA iron and 2.5 mg from ferrous fumarate(Sun et al. 2011).
Acknowledgements
The authors would like to thank Jan Peerson at Uni-versity of California Davis for statistical support, DrsRichard Hurrell at The Swiss Federal Insitute of Tech-nology Zurich (ETH) and Fabian Rohner at GlobalAlliance for Improved Nutrition (GAIN) for com-ments, and GAIN for its support to produce the paperand make it available for the benefit of all thoseworking to improve maternal and infant and youngchild nutrition. Chinese National High-tech Researchand Development Program (863 program number2010AA023004) partially supported the work.
Conflict of interest
No conflicts of interest exist.
References
Allen L.H., de Benoist B., Dary O. & Hurrel R. (2006)Guidelines on Food Fortification with Micronutrients.World Health Organization: Geneva, Swizerland.
Black R.E., Allen L.H., Bhutta Z.A., Caulfield L.E., deOnis M., Ezzati M. et al. (2008) Maternal and childundernutrition: global and regional exposures and healthconsequences. Lancet 371, 243–260.
Dewey K.G. (2007) Increasing iron intake of childrenthrough complementary foods. Food and Nutrition Bul-letin 28, S595–S609.
Dewey K.G. & Brown K.H. (2003) Update on technicalissues concerning complementary feeding of young chil-dren in developing countries and implications for inter-vention programs. Food and Nutrition Bulletin 24, 5–28.
Heimbach J., Rieth S., Mohamedshah F., Slesinski R.,Samuel-Fernando P., Sheehan T. et al. (2000) Safetyassessment of iron EDTA {sodium iron [Fe(3+)] ethyl-enediaminetetraacetic acid}: summary of toxicological,fortification and exposure data. Food and Chemical Toxi-cology 38, 99–111.
Hurrell R.F., Reddy M.B., Burri J. & Cook J.D. (2000) Anevaluation of EDTA compounds for iron fortification of
cereal-based foods. The British Journal of Nutrition 84,903–910.
International Nutritional Anemia Consultative Group(INACG) (1993) Iron EDTA for Food Fortification.International Life Sciences Institute: Washington, DC.
JECFA (2007) Summary and conclusions of the sixty-eighth meeting of the Joint FAO/WHO Expert Commit-tee on Food Additives (JECFA). Geneva, Swizerland.
Ndemwa P., Klotz C.L., Mwaniki D., Sun K., Muniu E.,Andango P. et al. (2011) Relationship of the availabilityof micronutrient powder with iron status and hemoglo-bin among women and children in the Kakuma RefugeeCamp, Kenya. Food and Nutrition Bulletin 32, in press.
de Onis M. (2006) WHO Child Growth Standards : Length/Height-for-Age, Weight-for-Age, Weight-for-Length,Weight-Forheight and Body Mass Index-for-Age :Methods and Development. World Health Organization:Geneva, Swizerland.
Sun J., Dai Y., Zhang S., Huang J., Yang Z., Huo J. et al.(2011) Implementation of a program to market acomplementary food supplement (Ying Yang Bao) andimpacts on anemia and feeding practices in Shanxi,China. Maternal & Child Nutrition 7 (Suppl. 3), 96–111.
Troesch B., Egli I., Zeder C., Hurrell R.F., de Pee S. &Zimmermann M.B. (2009) Optimization of a phytase-containing micronutrient powder with low amounts ofhighly bioavailable iron for in-home fortification ofcomplementary foods. The American Journal of ClinicalNutrition 89, 539–544.
Troesch B., van Stuijvenberg M.E., Smuts C.M., KrugerH.S., Biebinger R., Hurrell R.F. et al. (2011) A micronu-trient powder with low doses of highly absorbable ironand zinc reduces iron and zinc deficiency and improvesweight-for-age Z-scores in South African children. TheJournal of Nutrition 141, 237–242.
Wang Y.Y., Chen C.M., Wang F.Z., Jia M. & Wang K.A.(2009) Effects of nutrient fortified complementary foodsupplements on anemia of infants and young children inpoor rural of Gansu. Biomedical and Environmental Sci-ences 22, 194–200.
WHO/FAO (2004) Vitamin and Mineral Requirements inHuman Nutrition. World Health Organization and Foodand Agriculture Organization of the United Nations:Geneva, Switzerland.
World Food Program, DSM & UNHCR (2009) Micronu-trient powder (MixMe TM) use in kakuma refugeecamp in Kenya, Africa. Implementing, Improving Nutri-tion, Improving Lives 2, 3–4.
World Health Organization (2001) Iron deficiencyanaemia: assessment, prevention and control. A guidefor programme managers. In: WHO/NHD/01.3, pp 7–10.World Health Organization: Geneva.
Early child growth: how do nutrition andinfection interact?mcn_357 129..142
Kathryn G. Dewey and Daniel R. MayersDepartment of Nutrition and Program in International and Community Nutrition, University of California, Davis, California, USA
Abstract
It is well known that the relationship between child nutrition and infection is bidirectional, i.e. frequent illnesscan impair nutritional status and poor nutrition can increase the risk of infection. What is less clear is whetherinfection reduces the effectiveness of nutrition interventions or, vice versa, whether malnutrition lessens theimpact of infection control strategies. The objective of this paper is to review the evidence regarding thisinteraction between nutrition and infection with respect to child growth in low-income populations. Even whenthere are no obvious symptoms, physiological conditions associated with infections can impair growth bysuppressing appetite, impairing absorption of nutrients, increasing nutrient losses and diverting nutrients awayfrom growth. However, there is little direct evidence that nutrition interventions are less effective when infectionis common; more research is needed on this question. On the other hand, evidence from four intervention trialssuggests that the adverse effects of certain infections (e.g. diarrhoea) on growth can be reduced or eliminated byimproving nutrition. Interventions that combine improved nutrition with prevention and control of infectionsare likely to be most effective for enhancing child growth and development.
Correspondence: Kathryn Dewey, Department of Nutrition, University of California, One Shields Avenue, Davis, CA 95616, USA.E-mail: [email protected]
Introduction
Infections are very common in the first two years oflife. For example, children under 2 years experiencean average of three to five episodes of diarrhoea peryear in developing countries (Fig. 1). In some coun-tries, the rate is six to eight episodes per year. Diar-rhoeal incidence peaks at 6–11 months of age asinfants eat increasing amounts of complementaryfoods that may be contaminated. At this time, theybegin to crawl and explore their environment, puttingthem in direct contact with multiple sources of
pathogens. During an infection, the immune systemrequires a broad range of nutrients to mount adefence against the invading organism. It has beenhypothesized that nutrition interventions targetinggrowth may not be effective if infections are preva-lent. On the other hand, improved nutrition maystrengthen the child’s ability to fight infection andreduce the negative effects of infection.
The objective of this paper is to review the avail-able evidence on whether infection diminishes thepositive impact of nutrition interventions on childgrowth and whether improved nutrition limits the
negative impact of infections on child growth – i.e. theinteraction between nutrition and infection. Ourpurpose is not to examine the direct effect of nutritionon infection, which is a vast topic that goes beyond thescope of this paper. We begin with an overview of therelationship between child growth and the two mostcommon categories of infection: diarrhoeal and respi-ratory infections. We then discuss the potentiallygrowth-suppressing impact of subclinical infectionsand conditions, i.e. the ones that cause no obviousoutward symptoms but may have important physi-ological effects. Next, we examine the evidence onwhether there is an interaction between nutrition and
infection with respect to child growth. We con-clude with a brief discussion of the programmaticimplications.
How strong is the impact ofdiarrhoeal and respiratory infectionson child growth?
Diarrhoeal disease has many causes including patho-genic bacteria and other infectious microorganisms.In most cases, exposure to these pathogens occursthrough the ingestion of contaminated food andwater. Diarrhoeal illness is generally self-limiting,
Fig. 1. Episodes of diarrhoea per year among children under five (Margaret et al. 2003). Bars represent the 25th–75th percentiles across 20countries (1990–2000).
Key messages
• Infections are very common in the first 2 years of a child’s life.• Even when there are no obvious symptoms, physiological conditions associated with infections can impair
growth by:� Suppressing appetite� Impairing absorption of nutrients and increasing nutrient losses� Diverting nutrients away from growth
• There is little direct evidence that nutrition interventions are less effective when infection is common. Furtherresearch is needed.
• Four intervention trials showed that the negative effects of diarrhoea on growth can be reduced or eliminatedby improved nutrition.
• Interventions that combine improved nutrition with prevention and control of infections are likely to be mosteffective for enhancing child growth and development.
meaning that the infection will run its course and thechild will return to normal without requiring specifictreatment. However, severe or persistent diarrhoeaand repeated exposure to pathogens that affect thegut can have serious consequences. Diarrhoea robsthe child of fluids and certain key nutrients such aszinc and copper (Castillo-Duran et al. 1988). If thesefluids and nutrients are not replaced, the result can besevere dehydration, malnutrition, growth faltering ordeath in extreme cases.
It is normal for children to exhibit growth falteringduring a bout of diarrhoea and to grow more rapidlythan usual (‘catch-up’ growth) after recovery, but theextent of ‘catch-up’ growth may depend on the age ofthe child, the child’s initial nutritional status, the spe-cific pathogen(s) causing infection, the duration of theinfection and the duration of the ‘diarrhoea-free’interval following infection (Checkley et al. 1998;Wierzba et al. 2001). For example, children inPeru who were infected with the microorganismCryptosporidium parvum experienced both weightand height growth faltering for several months post-infection followed by periods of ‘catch-up’ growth.Infants took longer to ‘catch-up’ in weight than chil-dren infected after 12 months of age, and those whowere infected between birth and 5 months of age hada deficit of nearly 1 cm in height 1 year after infection,compared with non-infected infants (Checkley et al.1998). Children who were already stunted (low lengthfor age) at the time of infection did not catch up ineither weight or height within 1 year after infection.Those who were not stunted at the time of infectionachieved catch-up in weight within approximately 3months and catch-up in height within approximately 6months after infection, compared with their non-infected counterparts.
A high burden of diarrhoea in the first 2 years of lifeis associated with a much higher risk of stunting(height for age <-2 SD). In a pooled analysis of datafrom nine studies in five countries (Bangladesh,Brazil,Ghana, Guinea-Bissau and Peru), 25% of stunting at24 months of age was attributed to having five or moreepisodes of diarrhoea in the first 2 years (Checkleyet al. 2008). There was a ‘dose–response’ relationshipbetween the cumulative burden of diarrhoea (e.g. pro-portion of days with diarrhoea) and the likelihood of
being stunted at 24 months of age.Adjusting for socio-economic status did not alter these results.
The impact of respiratory infections on growth isless clear, in part because of a paucity of research onthis relationship. The most common types of respira-tory infections – mild, upper respiratory infections –are unlikely to have persistent effects in most chil-dren. But respiratory infections that include fever arelinked with a higher risk of stunting. In a longitudinalstudy of children in the Philippines followed frombirth to 24 months of age, the cumulative impact offebrile respiratory infections on risk of stunting wassimilar to that of diarrhoea (Adair & Guilkey 1997).Fever is one indicator of immune system activation,which (as explained below) can suppress appetite andlead to re-allocation of nutrients away from growth.
What is the role of subclinicalinfections and related conditions?
An infection is defined as subclinical when there areno obvious signs or symptoms, but there is physiologi-cal evidence of abnormality.Young children often testpositive for certain infections (e.g. Helicobacter
pylori, Epstein–Barr virus, cytomegalovirus, mycobac-teria, cryptosporidium and even HIV) without exhib-iting clinical symptoms. Many children also carrymalaria parasites or gastrointestinal parasites with nooutward signs. Subclinical abnormalities of the gas-trointestinal tract, presumably caused by frequentexposure to pathogens, are also thought to becommon. Even though symptoms are not evident,these subclinical conditions may have a strong,perhaps cumulative effect on metabolic function andgrowth. Microorganisms in the gut play a critical rolein these functions (Preidis et al. 2010). The types andrelative amounts of different gut bacteria can beaffected by the diet (De Filippo et al. 2010).
Environmental enteropathy
One subclinical condition that is likely to be prevalentin developing countries is environmental enteropathy(EE), also known as tropical enteropathy. This condi-tion often has no outward manifestation but can causenutrient malabsorption by changing the structure and
function of the small intestine. It has been hypoth-esized that EE causes growth faltering and maydecrease the efficacy of nutritional interventions(Goto et al. 2009; Humphrey 2009).
EE has been linked to living conditions with poorsanitation and hygiene practices, and is thought to becaused by chronic ingestion of pathogenic microor-ganisms. Gut exposure to high levels of harmfulmicroorganisms results in a near-continuous state ofimmune system activation (see next section), which isharmful to the affected individual. Evidence that EEis related to sanitation and hygiene practices is pro-vided by studies of Peace Corps volunteers and USsoldiers stationed abroad who developed the condi-tion during their assignments and regained normalintestinal function upon returning home. Researchfrom the 1960s suggested that nearly all residents ofthe developing world at that time showed some signsof EE (Haghighi et al. 1997).
EE is characterized by various small intestinalabnormalities in seemingly healthy individuals. EEcan be diagnosed by microscopic examination of anintestinal sample or by laboratory tests for intestinalpermeability (sugar ratios present in the urine) orantibodies indicating that bacteria have been able tocross from the intestines into the body (endotoxin-core antibody). In healthy individuals, the surface ofthe small intestine is covered in millions of tiny, finger-shaped projections called villi. This architecture hasevolved to maximize the surface area of the smallintestine to facilitate nutrient absorption (Fig. 2). In aperson affected by EE, changes occur in the structureof the small intestine including decreased villousheight, sometimes referred to as ‘flat architecture’(Fig. 3).
Not all people with EE will experience completeloss of villi; however, regardless of villous architec-ture, people with EE have increased intestinal inflam-mation and other structural changes that indicate anelevated immune response (Sullivan et al. 1991). EE istypically associated with a ‘leaky gut’ (increased per-meability of the intestinal tract) and impaired abilityto prevent pathogens from breaching the intestinalbarrier.
The potential pathways by which fecal contamina-tion leads to EE and subsequently to child undernu-
trition are illustrated in Fig. 4. Exposure to thecausative agents of EE appears to occur very early inlife (Haghighi et al. 1997). In a comparison of intesti-nal tissues from stillborn fetuses and young infants indeveloping countries, the fetal tissues exhibitednormal finger-shaped villi, but the tissues from infantsshowed the flat architecture associated with EEwithin 3 months after birth. These changes may resultin malabsorption of certain nutrients such as vitamin
Fig. 2. Normal small intestine with healthy villi. http://duncanmarasanitation.blogspot.com/2009/09/tropical-enteropathy-3.html
Fig. 3. Small intestine with environmental enteropathy characterizedby unhealthy villi. http://duncanmarasanitation.blogspot.com/2009/09/tropical-enteropathy-3.html
B12 and fats (Haghighi et al. 1997; Ramakrishna et al.2006; Humphrey 2009).
In a study in Peru, children in the worst conditionsfor sanitation and hygiene experienced 54% morediarrhoeal episodes between birth and 24 months ofage and were 1 cm shorter at 24 months than childrenliving in the best conditions. However, the associationof water quality and sanitation with height was inde-pendent of the association with diarrhoeal disease.The investigators speculated that constant exposureto harmful bacteria could be causing EE and hinder-ing the children’s ability to effectively absorb andutilize ingested nutrients, regardless of whether itcaused diarrhoea (Checkley et al. 2004).
EE is probably far more common than overt diar-rhoeal illness in such settings. In a cohort of childrenin the Gambia, increased intestinal permeability wasidentified in 76% of the 922 samples collected from119 children between birth and 2 years of age,whereas children were reported to have diarrhoea on7.3% of all days during this period (Lunn et al. 1991).Based on the negative correlation between intestinalpermeability and monthly length gain (corrected forage), the investigators calculated that impaired intes-tinal permeability accounted for 43% of linear growthfaltering during this period. In a subsequent study(Campbell et al. 2003) in the same population,markers of intestinal function were normal at 2months of age but deviated sharply from the norms by15 months of age. The combined effects of three dif-ferent markers of intestinal function were calculatedto explain 56% of linear growth faltering. Becausethese were observational studies and the investigatorsdid not control for potentially confounding variables,it is difficult to ascribe cause and effect, but the resultspoint to the high prevalence of EE as a key risk factorfor stunting in this population.
Immune activation, cytokines and appetite
In response to infection, the immune system becomesactivated and produces specific immune cells andcytokines in large amounts to combat the invadingorganism. Cytokines are protein molecules that assistin fighting infection. They are beneficial in the shortterm; however, a chronic condition – like EE – can
lead to continuously high levels of cytokines, whichcan cause negative metabolic consequences and sup-press appetite (Wong & Pinkney 2004).
Reports of ‘poor appetite’ by caregivers of childrenunder 2 in developing countries are common and mayaccount for a substantial proportion of low energyintakes in this age group (Brown et al. 1995).Appetiteis controlled by a group of chemicals called satietyhormones. Two important hormones involved inappetite regulation are ghrelin and leptin. Ghrelinstimulates food intake; leptin suppresses food intake.During infection, elevated levels of cytokines can leadto increased blood leptin concentrations and dimin-ished appetite (Somech et al. 2007). This effect hasbeen verified in cases of severe systemic infectionsuch as neonatal blood infections (Orbak et al. 2003).
Immune system activation also lowers circulatinglevels of certain nutrients, in particular vitamin A andzinc, and increases iron retention in the liver, whichrestricts the availability of iron to other tissues in thebody. These effects are probably part of an adaptiveresponse to withhold key nutrients from invadingpathogens, but they can result in inadequate availabil-ity of certain nutrients to support growth, even ifintake is adequate, during the period of metabolicdisturbance. Among children 6–20 months of age inZambia, blood markers of inflammation (usuallyassociated with infection) were negatively related togrowth in length during the subsequent 3 months(Hautvast et al. 2000).
The ‘dirty chicken’ experiment
Studies of how sanitation affects the growth of newlyhatched chickens provide clues that may be relevantto growth faltering of children in developing coun-tries (Roura et al. 1992). A classic experiment con-ducted in 1992, called the ‘dirty chicken’ study,involved raising chicks in either steam-cleaned orunclean cages in close proximity with their ownfaeces. In each of the two living environments, thechicks were either administered an antibiotic cocktailor no antibiotics.
Unsurprisingly, living in close proximity to faeces inthe poor sanitation environment caused the chicksraised without antibiotics to experience decreased
rates of weight gain, decreased efficiency of food uti-lization and increased levels of the cytokine plasmainterleukin 1.
However, chicks raised in poor sanitary conditionsand given antibiotics grew just as well and had thesame low levels of circulating cytokines as chicksraised in steam-cleaned cages. The investigators con-cluded that the administration of antibiotics facili-tated growth by preventing the immunologic stressand associated metabolic changes brought about bychronic exposure to faeces.
Researchers have attempted to treat EE in humanchildren with antibiotics but with little success. In fact,in one study, provision of antibiotics led to anincreased incidence of diarrhoea, perhaps due to anegative effect of antibiotics on the ‘good’ bacteria inthe gut (Trehan et al. 2009). Short-term antibiotictherapy may fail because of re-exposure to fecal bac-teria soon after treatment. Without improved sanita-tion and hygiene practices, a single course ofantibiotics is unlikely to reverse EE, which may takemonths to resolve especially if there is repeated expo-sure to pathogens (Kirkpatrick et al. 2006; Thabane &Marshall 2009).
While prevention of infection-related growth fal-tering with antibiotics in humans may not be feasible,the ‘dirty chicken’ experiment indicates that living inpoor sanitary conditions can cause growth falteringand implies that decreasing the burden of infection –including subclinical infection – may significantlyimprove growth outcomes.
What is the interaction betweennutrition and infection?
Does infection make nutrition interventionsless effective?
During infection, energy and other nutrients arediverted towards the immune response and awayfrom growth. After all, survival is more importantthan continuing to grow, so growth faltering duringinfections may be an adaptive mechanism. However,repeated episodes of infection or persistent subclini-cal infection may put the child in a near-constant stateof growth suppression. Does this mean that nutri-
tional interventions for populations with high expo-sure to infections will be unsuccessful in improvingchild growth?
Evidence on this question is scant. In Indonesia, theeffect of high-dose vitamin A supplements on lineargrowth in pre-school children (6–48 months of age)was dependent on the burden of respiratory infection(Hadi et al. 2003). In children with a low burden ofrespiratory infection, especially those with lowvitamin A intake, linear growth improved aftervitamin A supplementation. In children with a highburden of respiratory infection, there was little or noimpact of vitamin A supplementation on growthregardless of vitamin A intake.
One potential explanation is that supplementalvitamin A is not well absorbed during an acute infec-tion and a large proportion is excreted in the urine,rendering the high-dose supplement much less effec-tive in improving vitamin A status if it is administeredwhen the child is ill. Another potential explanation isthat fever during respiratory infections causes meta-bolic changes that reduce circulating levels of vitaminA and make it less available to tissues to supportgrowth. Regardless of the mechanism for the effect,the investigators concluded that coupling vitamin Asupplementation programmes with efforts to reducerespiratory infections would increase the likelihoodof a positive impact on growth.
Apart from the single study described above, thereis little direct evidence that the impact of nutritioninterventions is blunted when infections are common.Further research on this question is needed.
Does improved nutrition reduce the negativeimpact of infection?
The contrasting hypothesis is that improved nutritioncan lessen or even eliminate the negative impact ofinfections on growth. The potential mechanisms bywhich improved nutrition could reduce the impact ofinfections on growth are shown in Box 1. Thesemechanisms include (1) strengthening the immunesystem; (2) compensating for malabsorption, realloca-tion or losses of key nutrients; (3) allowing forcatch-up growth following infection; (4) enhancingappetite; and (5) favouring the growth of beneficial
gut microorganisms. Four nutrition intervention trialsamong pre-school children in Colombia, Guatemala,Tanzania and South Africa indicate that provision ofmacronutrients and/or micronutrients can limit thenegative effects of diarrhoea on child growth.
Randomized food supplementation study in Colombia,1973–1980
Families were eligible for food supplementation if themother was in the first or second trimester of preg-nancy and at least half of her pre-school-aged chil-dren were underweight (Lutter et al. 1989). Allhousehold members in the intervention groupreceived protein-enriched food that included pow-dered skim milk. Children in all groups were supple-mented with iron and vitamin A. For the analysis ofchild stunting related to diarrhoea, the investigatorsused data for 241 children followed for the first 3years of life for whom they had complete morbiditydata and measurement of height (length) at 36months of age (148 unsupplemented children and 140children who were supplemented from the sixthmonth of pregnancy up to 36 months).
Diarrhoea was very common in the Colombiastudy. The number of episodes from birth to 36months was 18 in the unsupplemented group and 16
in the supplemented group (not significantly differ-ent). In the unsupplemented children, height at 36months was strongly inversely associated with thenumber of days ill with diarrhoea (-0.03 cm for eachday of illness, P < 0.001). In the supplemented chil-dren, there was no relationship between diarrhoealillness and height at 36 months (see Fig. 5, P < 0.001for the interaction) (Lutter et al. 1992). The positiveimpact of supplementation on height (overall,approximately 3 cm) was greatest in children with thehighest burden of diarrhoea (nearly 5 cm). The inves-tigators concluded that nutritional supplementationeliminated the negative impact of diarrhoeal diseaseon child growth.They speculated that improved nutri-ent intake during and/or after illness episodes facili-tated catch-up growth.
Supplementary feeding intervention in Guatemala,1969–1977
A large supplementary feeding trial targeting preg-nant and lactating women and their children frombirth to 7 years of age was conducted in two sets oftwo matched villages. One village in each set wasrandomly selected to receive either a high-protein,high-energy supplement called ‘Atole’ or a non-protein low-energy supplement called ‘Fresco’, bothfortified with several micronutrients (Martorell et al.1995; Ramirez-Zea et al. 2010).
Among children 3–36 months of age who receivedFresco, there was a significant negative relationshipbetween the percentage of time with diarrhoea andlength gain. By contrast, among children whoreceived Atole, there was no significant relationshipbetween diarrhoea prevalence and length gain(P < 0.05 for interaction effect) (Lutter et al. 1992).These findings were similar to those from the Colom-bia trial.
Vitamin A supplementation in Tanzania, 1993–1997
In this study, 687 children 6 to 60 months of age whohad been admitted to the hospital with pneumoniawere randomly assigned to high-dose capsules ofvitamin A or placebo while hospitalized and, again, 4and 8 months after discharge (Villamor et al. 2002).
Box 1. Improved nutrition may reduce the negativeimpact of infections on growth by
1. Strengthening the child’s immune system, thereby reducingthe severity and duration of infections and their impact ongrowth2. Providing extra amounts of nutrients to compensate forthose that are not well absorbed during infection, lost duringdiarrhoea, reallocated elsewhere in the body due to immunesystem activation or consumed in lower amounts than usualbecause of reduced appetite during infection3. Providing the required amounts of nutrients for catch-upgrowth following infection, particularly the nutrients that areneeded to build lean body tissue such as protein, potassium,magnesium, phosphorus, zinc and sodium4. Preventing poor appetite caused by micronutrient deficien-cies, thereby facilitating catch-up growth5. Favouring the growth of beneficial bacteria in the gut thatenhance gut function and immune defences
There was no significant effect of vitamin A supple-mentation on growth for otherwise healthy children,but in children with persistent diarrhoea during thefollow-up period, vitamin A eliminated the risk ofstunting usually associated with this condition. Spe-cifically, in the placebo group, the risk of stunting(adjusted for potential confounders) was 3.7 timeshigher in children with persistent diarrhoea than inthose without persistent diarrhoea. In the vitamin Agroup, there was no risk of stunting associated withpersistent diarrhoea (P = 0.015 for interaction effect).Children with persistent diarrhoea may have lowerlevels of circulating vitamin A than children withacute or no diarrhoea, so the vitamin A supplementsmay have compensated for this phenomenon andallowed for catch-up growth in children recoveringfrom persistent diarrhoea.Although vitamin A is gen-erally not considered a key growth-limiting nutrient(Golden 2009), ensuring adequate vitamin A mayfacilitate growth by restoring other physiologicalfunctions that must be normalized to permit rapidgain in lean tissue.
Micronutrient supplementation in South Africa,2003–2006
In this study, 373 infants in three cohorts (32 HIV-infected children, 154 HIV-uninfected children bornto HIV-infected mothers and 187 uninfected childrenborn to uninfected mothers) were randomly assignedat 6 months of age to receive daily micronutrientsupplementation for 18 months with either vitamin A,vitamin A plus zinc, or multiple micronutrients thatincluded vitamin A and zinc (Chhagan et al. 2010).The study showed no overall impact on growth of zincor multiple micronutrients compared with vitamin Aalone (although there was a positive impact of mul-tiple micronutrients on child length in those who werealready stunted at enrolment). In the two cohorts ofHIV-uninfected children, the addition of zinc or mul-tiple micronutrients to vitamin A reduced the impactof repeated diarrhoea episodes on linear growth. Thiswas most evident among children who had more thansix episodes of diarrhoea per year (n = 34). In thissubgroup, infants who received only vitamin A exhib-
Fig. 5. Relationship between length at 36 months of age and number of days of diarrhoea during the first three years of life among supplementedand unsupplemented children in Colombia (Lutter et al. 1992).
ited a decline of 0.6 z-scores in length for age between6 and 24 months of age, but those who receivedmultiple micronutrients showed no decline in lengthfor age during the same interval (P = 0.06 within thissubgroup of 34). The investigators suggested thatthe progressive stunting usually observed in childrenwith repeated episodes of diarrhoea may be relatedto deficiencies of certain micronutrients, andcould be prevented by adequate intake of thosemicronutrients.
These four studies all show that the negative effectsof diarrhoea on growth can be offset by nutritioninterventions, at least in these particular situations.However, as mentioned above, clinical symptoms ofdiarrhoea may be just the ‘tip of the iceberg’ when itcomes to gastrointestinal conditions that can affectgrowth. EE may be much more prevalent than diar-rhoea. Whether nutrition interventions can reduce oreliminate the growth-suppressing impact of EE isunknown.
In adults, however, there is some evidence thatmultiple micronutrients may partially reverse theimpact of EE on gut function. In a study of intestinalimpairment in Zambia, 500 adults (with or withoutHIV infection) were randomly assigned to receivemultiple micronutrients or placebo for 2 years.Micronutrients had no impact on markers of intes-tinal permeability, but there was a significant reduc-tion in one of the markers reflecting bacterialmovement across the intestinal wall (Kelly et al.2010). This suggests an improvement in gut integrityor immune function, but further research, particu-larly in children, is needed.
To date, there is almost no information on whetherimproved nutrition can reduce the impact of infec-tions other than gastrointestinal infections, such asrespiratory illnesses, and malaria on child growth,although the Tanzania study described above showedthat vitamin A supplements were more effective forimproving growth in children infected with malaria orHIV than in non-infected children.
Some nutrients, such as iron, have the potential toincrease the risk of infection, or mortality due toinfection, and may interfere with linear growth(Dewey et al. 2002; Hurrell 2010).The mode of admin-istration, such as supplementation vs. fortification,
and the initial iron status of the individual are keyfactors to consider when evaluating whether nutritioninterventions that include iron are likely to reduce orexacerbate the influence of infection on growth.
Conclusions andprogrammatic implications
Infections play a major role in preventing children indeveloping countries from reaching their growthpotential. A high burden of diarrhoeal disease is akey risk factor for stunting, and other types of infec-tions also contribute to growth faltering, althoughtheir impact is not as well documented. However,the view that ‘disease rather than diet’ is the maincause of growth impairment (Campbell et al. 2003)ignores the important interaction between infectionand nutrition. To date, the limited evidence availablesuggests that nutrition interventions can substan-tially reduce or even eliminate the negative effect ofdiarrhoeal disease on child growth. This is encourag-ing, but it should be recognized that subclinical con-ditions such as EE may account for a largeproportion of growth faltering, and it is not yetknown whether improved nutrition can prevent orreverse the deleterious effects of EE (or growth fal-tering associated with infections other than diar-rhoeal disease).
At present, evidence is insufficient to conclude thathigh rates of infection make nutrition interventionsineffective for improving child growth. Only onestudy was found that supported this hypothesis (Hadiet al. 2003). In this study, a high burden of respiratoryinfection limited the potential for vitamin A supple-mentation to improve growth. Clearly, furtherresearch on this issue is needed, but a single studyinvolving a single micronutrient does not warrantholding back on efforts to improve nutrition in popu-lations where infections are prevalent.
Nonetheless, combining improved nutrition withefforts to prevent and control infections will likely bethe most effective approach for optimizing childgrowth and development (Box 2). This question wasexplored many years ago in the Narangwal NutritionExperiment conducted between 1969 and 1973 inPunjab, India (Kielmann et al. 1983). In that project,
10 villages were selected in clusters of two to threevillages to receive a package of services that includedeither nutrition care (NUT), health care focused oninfection control (HC), integrated services includingboth nutrition and health care (NUTHC) or standardcare (control – symptomatic health care on demandonly). NUT services included growth monitoring,food supplementation (initially only for malnour-ished children, but later made available to all chil-dren) and nutrition education. Health care servicesincluded curative and preventive care for commonillnesses, immunizations and hygiene education. Thetarget group was children under 3 years of age. At 36months of age, children in the NUT or NUTHC vil-lages were 1.3 cm taller than children in control vil-lages, with no significant difference between NUT andNUTHC villages. Children in HC villages were tallerthan those in control villages, but not as tall as chil-dren in the NUT or NUTHC villages. Thus, in thissetting, the combination of nutrition and health caredid not produce a greater improvement in growththan nutrition care alone. However, the psychomotordevelopment scores of children in the NUTHC vil-lages generally exceeded the summed separate effectsof NUT and HC, suggesting a synergistic effect onthose outcomes. Apart from the Narangwal experi-ment, very little information exists on whether pro-viding infection control together with direct nutritioninterventions has an additive or synergistic effect onchild growth or other key outcomes.
Key components of infection control are effectivepromotion of handwashing with soap and water andimprovements in sanitation and water quality, whichcan significantly decrease diarrhoeal disease. In a
recent meta-analysis (Cairncross et al. 2010), hand-washing was linked to a 48% risk reduction of diar-rhoea across study designs and pathogens. Asubstantial positive effect was also found for bothwater quality and sanitation improvements – 17%and 36% risk reductions, respectively. Access to andutilization of toilets is a high priority (Humphrey2009), yet an estimated 2.6 billion people globally livewithout basic toilets to dispose of faeces (Coombes2010).
An essential element of combined approaches isthe promotion of breastfeeding for at least 2 years(exclusively for the first 6 months, and continuedbreastfeeding in combination with nutritious comple-mentary foods thereafter), which has the dual benefitof reducing infection and improving nutrition. Otherkey practices, highlighted in the Guiding Principles
for Complementary Feeding of the Breastfed Child
(PAHO/WHO 2003), are feeding during and afterillness to sustain adequate nutrient intake andpromote catch-up growth, and safe preparation andstorage of complementary foods to reduce food-borne illnesses.
Although many nutrition programmes alreadyinclude hygiene messages, simply increasing knowl-edge and awareness about behaviours such ashandwashing is not enough. Sustainable changes inbehaviours are more difficult to achieve because offactors such as lack of access to clean water, longdistance from water sources, the cost of hygiene prod-ucts and poor design of educational interventions thatdo not take into account cultural beliefs or craft mes-sages tailored to the needs and values of the targetaudience (Luby et al. 2008; Arnold et al. 2009; Aungeret al. 2009; Biran et al. 2009). The difficulty of improv-ing household hygiene and sanitation practices,outside of intensive efficacy trials, is well recognized byresearchers (Curtis 2003; Luby et al. 2008; Scott et al.2008; Arnold et al. 2009; Luby et al. 2009). Innovativestrategies have been suggested that focus on emotionalmotivations for behaviour change and engagementof professional consumer and market research agen-cies, rather than relying solely on knowledge-basedapproaches (Curtis 2003; Biran et al. 2009).
Research is needed on the efficacy and effective-ness of approaches that combine nutrition interven-
Box 2. Nutrition and infection prevention andcontrol interventions to improve child growth
• Promote handwashing with soap and water• Improve sanitation and water quality• Promote exclusive breastfeeding for the first 6 months and
continued breastfeeding thereafter• Promote appropriate complementary feeding practices
including feeding during and after illness and safe prepara-tion and storage of complementary foods
• Step up efforts to prevent and treat respiratory illnesses andother infections such as malaria
tions with multiple strategies for prevention andcontrol of infections, including hygiene education,improvements in water quality and sanitation andmeasures to prevent and treat respiratory illness andother infections such as malaria. Development andevaluation of integrated cost-effective programmesdesigned to tackle these multiple objectives should bea high priority.
Acknowledgements
This paper has previously been posted on the web sitefor Alive & Thrive (http://www.aliveandthrive.org/).We gratefully acknowledge the input of the followingreviewers of an earlier draft of this paper: MaryArimond, William Checkley, Sandra Huffman, JeanHumphrey, Steve Luby, Chessa Lutter, Luann Martin,Ellen Piwoz, Andrew Prentice and Christine Stewart.We also thank Bineti Vitta for her assistance in thepreparation of this paper.
Source of funding
Funding for the preparation of this paper for Alive &Thrive came from the Bill & Melinda Gates Founda-tion via a grant to AED-ARTS (Academy for Educa-tional Development-Applied Research and TechnicalServices).
Conflicts of interest
The authors have no conflict of interest to report.
References
Adair L.S. & Guilkey D.K. (1997) Age-specific determi-nants of stunting in Filipino children. The Journal ofNutrition 127, 314–320.
Arnold B., Arana B., Mäusezahl D., Hubbard A. &Colford J.M. (2009) Evaluation of a pre-existing, 3-yearhousehold water treatment and handwashing interven-tion in rural Guatemala. International Journal of Epide-miology 38, 1651–1661.
Aunger R., Schmidt W.-P., Ranpura A., Coombes Y.,Maina P.M., Matiko C.N. et al. (2009) Three kinds ofpsychological determinants for hand-washing behaviourin Kenya. Social Science & Medicine 70, 383–391.
Biran A., Schmidt W.-P., Wright R., Jones T., Seshadri M.,Isaac P. et al. (2009) The effect of a soap promotion andhygiene education campaign on handwashing behaviourin rural India: a cluster randomised trial. Tropical Medi-cine & International Health 14, 1303–1314.
Brown K.H., Peerson J.M., Lopez de Romana G., deKanashiro H.C. & Black R.E. (1995) Validity and epide-miology of reported poor appetite among Peruvianinfants from a low-income, periurban community. TheAmerican Journal of Clinical Nutrition 61, 26–32.
Cairncross S., Hunt C., Boisson S., Bostoen K., Curtis V.,Fung I.C.H. et al. (2010) Water, sanitation and hygienefor the prevention of diarrhoea. International Journal ofEpidemiology 39 (Suppl. 1), i193–i205.
Campbell D.I., Elia M. & Lunn P.G. (2003) Growth falter-ing in rural Gambian infants is associated with impairedsmall intestinal barrier function, leading to endotoxemiaand systemic inflammation. The Journal of Nutrition 133,1332–1338.
Castillo-Duran C., Vial P. & Uauy R. (1988) Trace mineralbalance during acute diarrhea in infants. The Journal ofPediatrics 13, 452–457.
Checkley W., Epstein L.D., Gilman R.H., Black R.E.,Cabrera L. & Sterling C.R. (1998) Effects of Cryptospo-ridium parvum infection in Peruvian children: growthfaltering and subsequent catch-up growth. AmericanJournal of Epidemiology 148, 497–506.
Checkley W., Gilman R.H., Black R.E., Epstein L.D.,Cabrera L., Sterling C.R. et al. (2004) Effect of waterand sanitation on childhood health in a poor Peruvianperi-urban community. Lancet 363, 112–118.
Checkley W., Buckley G., Gilman R.H., Assis A.M.O.,Guerrant R.L., Morris S.S., Mølbak K., Valentiner-Branth P., Lanata C.F. & Black R.E. (2008) Multi-country analysis of the effects of diarrhoea on childhoodstunting. International Journal of Epidemiology 37, 816–830.
Chhagan M., Van den Broeck J., Luabeya K.-K., Mponts-hane N., Tomkins A. & Bennish M. (2010) Effect on lon-gitudinal growth and anemia of zinc or multiplemicronutrients added to vitamin A: a randomized con-trolled trial in children aged 6–24 months. BMC PublicHealth 10, 145–155.
Coombes R. (2010) Toiling for toilets. BMJ 341, 582–583.Curtis V. (2003) Talking dirty: how to save a million lives.
International Journal of Environmental Health Research13 (Suppl. 1), 73–79.
De Filippo C., Cavalieri D., Di Paola M., Ramazzotti M.,Poullet J.B., Massart S., Collini S., Pieraccini G. & Lion-etti P. (2010) Impact of diet in shaping gut microbiotarevealed by a comparative study in children fromEurope and rural Africa. Proceedings of the NationalAcademy of Sciences of the United States of America107, 14691–14696.
Dewey K.G., Domelloef M., Cohen R.J., Landa Rivera L.,Hernell O. & Loennerdal B. (2002) Iron supplementa-tion affects growth and morbidity of breast-fed infants:results of a randomized trial in Sweden and Honduras.The Journal of Nutrition 132, 3249–3255.
Golden M.H. (2009) Proposed recommended nutrient den-sities for moderately malnourished children. Food andNutrition Bulletin 30 (Suppl.), S267–S342.
Goto R., Mascie-Taylor C.G.N. & Lunn P.G. (2009) Impactof intestinal permeability, inflammation status and para-sitic infections on infant growth faltering in rural Bang-ladesh. The British Journal of Nutrition 101, 1509–1516.
Hadi H., Dibley M.J. & West K.P. (2003) Complex interac-tions with infection and diet may explain seasonalgrowth responses to vitamin A in preschool aged Indo-nesian children. European Journal of Clinical Nutrition58, 990–999.
Haghighi P., Wolf P.L. & Durie P. (1997) Tropical sprueand subclinical enteropathy: a vision for the nineties.Critical Reviews in Clinical Laboratory Sciences 34, 313–341.
Hautvast J.L.A., Tolboom J.J.M., Willems J.L., Mwela C.M.& Monnens L.A.H. (2000) Consequences of infectionsfor three-month length increment in young children inrural Zambia. Acta Paediatrica 89, 296–301.
Hurrell R. (2010) Iron and malaria: absorption, efficacyand safety. International Journal for Vitamin and Nutri-tion Research 80, 279–292.
Kelly P., Shawa T., Mwanamakondo S., Soko R., Smith G.,Barclay G.R. & Sanderson I. (2010) Gastric and intesti-nal barrier impairment in tropical enteropathy and HIV:limited impact of micronutrient supplementation duringa randomised controlled trial. BMC Gastroenterology 10,72–80.
Kielmann A., Taylor C., DeSweemer C., Parker R., Cherni-chovsky D., Reinke W. et al. (1983) Child and maternalhealth services in rural India: the Narangwal experi-ment. In: Integrated Nutrition and Health Care, Vol. 1.The Johns Hopkins University Press: Baltimore. AWorld Bank Research Publication.
Kirkpatrick B.D., Noel F., Rouzier P.D., Powell J.L., PapeJ.W., Bois G. et al. (2006) Childhood cryptosporidiosis isassociated with a persistent systemic inflammatoryresponse. Clinical Infectious Diseases 43, 604–608.
Luby S.P., Mendoza C., Keswick B.H., Chiller T.M. &Hoekstra R.M. (2008) Difficulties in bringing point-of-use water treatment to scale in rural Guatemala. TheAmerican Journal of Tropical Medicine and Hygiene 78,382–387.
Luby S.P., Agboatwalla M., Bowen A., Kenah E., SharkerY. & Hoekstra R.M. (2009) Difficulties in maintainingimproved handwashing behavior, Karachi, Pakistan. The
American Journal of Tropical Medicine and Hygiene 81,140–145.
Lutter C., Habicht J., Rivera J. & Martorell R. (1992) Therelationship between energy intake and diarrhoealdisease in the effects on child growth: biological model,evidence and implications for public health policy. Foodand Nutrition Bulletin 14, 36–42.
Lutter C.K., Mora J.O., Habicht J.P., Rasmussen K.M.,Robson D.S., Sellers S.G. et al. (1989) Nutritionalsupplementation: effects on child stunting because ofdiarrhea. The American Journal of Clinical Nutrition 50,1–8.
Margaret K., Bern C. & Guerrant R. (2003) The globalburden of diarrhoeal disease, as estimated from studiespublished between 1992 and 2000. Bulletin of the WorldHealth Organization 81, 197–204.
Martorell R., Habicht J.P. & Rivera J.A. (1995) Historyand design of the INCAP longitudinal study (1969–77)and its follow-up (1988–89). The Journal of Nutrition 125(Suppl.), 1027S–1041S.
Orbak Z., Ertekin V., Akçay F., Ozkan B. & Ors R. (2003)Serum leptin levels in neonatal bacterial septicemia.Journal of Pediatric Endocrinology & Metabolism 16,727–731.
PAHO/WHO (2003) Guiding Principles for Complemen-tary Feeding of the Breastfed Child. PAHO/WHO: Wash-ington, DC.
Preidis G.A., Hill C., Guerrant R.L., Ramakrishna B.S.,Tannock G.W. & Versalovic J. (2010) Probiotics, entericand diarrheal diseases, and global health. Gastroenterol-ogy 140, 8.e19–14.e19.
Ramirez-Zea M., Melgar P. & Rivera J.A. (2010) INCAPoriente longitudinal study: 40 years of history andlegacy. The Journal of Nutrition 140, 397–401.
Roura E., Homedes J. & Klasing K.C. (1992) Preventionof immunologic stress contributes to the growth-permitting ability of dietary antibiotics in chicks. TheJournal of Nutrition 122, 2383–2390.
Scott B.E., Schmidt W.P., Aunger R., Garbrah-Aidoo N. &Animashaun R. (2008) Marketing hygiene behaviours:the impact of different communication channels onreported handwashing behaviour of women in Ghana.Health Education Research 23, 392–401.
Somech R., Reif S., Golander A. & Spirer Z. (2007) Leptinand C-reactive protein levels correlate during minorinfection in children. The Israel Medical AssociationJournal 9, 76–79.
Sullivan P., Mirakian R., Hill S., Milla P., Neale G. & MarshM. (1991) Chronic diarrhea and malnutrition – histologyof the small intestinal lesion. Journal of Pediatric Gastro-enterology and Nutrition 12, 195–203.
Thabane M. & Marshall J. (2009) Post-infectious irritablebowel syndrome. World Journal of Gastroenterology 15,3591–3596.
Trehan I., Shulman R.J., Ou C.-N., Maleta K. & ManaryM.J. (2009) A randomized, double-blind, placebo-controlled trial of rifaximin, a nonabsorbable antibiotic,in the treatment of tropical enteropathy. The AmericanJournal of Gastroenterology 104, 2326–2333.
Villamor E., Mbise R., Spiegelman D., Hertzmark E.,Fataki M., Peterson K.E. et al. (2002) Vitamin A supple-ments ameliorate the adverse effect of HIV-1, malaria,and diarrheal infections on child growth. Pediatrics 109,e6.
Wierzba T.F., El-Yazeed R.A., Savarino S.J., Mourad A.S.,Rao M., Baddour M. et al. (2001) The interrelationshipof malnutrition and diarrhea in a periurban area outsideAlexandria, Egypt. Journal of Pediatric Gastroenterologyand Nutrition 32, 189–196.
Wong S. & Pinkney J. (2004) Role of cytokines in regulat-ing feeding behaviour. Current Drug Targets 5, 251–263.