84
H/I Streets Bus Improvements Final Technical Report October 2013
H/I Streets Bus Improvements
Final Technical Report
October 2013


H/I Streets Bus Improvements Technical Report
Final
PREFACE
District of Columbia’s downtown, home to the
White House and the Capitol, is a vibrant
community – its diverse cultural, commercial
and entertainment attractions allow for the
District’s businesses compete at a national
level. According to the Downtown DC Business
Improvement District, in 2012, employment
located within the greater downtown area
was 383,400 and population located within
a one mile radius of city center was 58,000.
The downtown also has approximately 9.5
million annual visitors to Downtown’s
attractions.
The District of Columbia is actively planning
for the future development in its downtown
that will transform neighborhoods and create
new opportunities. Over the next ten years,
multiple development projects throughout
downtown will add significant retail,
residential and office space. DC’s downtown
is also building upon its development
dynamic by adding 4.6 thousand multifamily
units under construction within 1.5 miles of
Downtown.
The unprecedented level of growth has
added capacity constraints to the
transportation network. The District
Department of Transportation (DDOT) and
the Washington Metropolitan Area Transit
Authority (WMATA) are currently actively
working to explore various transportation
improvements that will facilitate the east-west
and north-south movements of vehicles,
transit, pedestrians and bicycles throughout
the downtown area, from ongoing
implementation of Metrobus Priority Corridor
Network, bike lanes and transit signal
optimization to the potential development of
bus lanes and streetcar over short and long
terms.
This Technical Report documents the collective
effort by DDOT and WMATA to explore bus
improvements on H and I Streets in
downtown, the region’s most heavily traveled
and most productive bus corridor. The H and
I Streets Bus Improvements Project
investigated traffic management
improvements and bus-only lane options with
the objective of providing reliable and
efficient bus service and alleviating Metrorail
core congestion through surface transit
improvements. Based on the findings of
technical and policy analysis, this report calls
for further evaluation of the collective
benefits and effects of the H and I Streets
bus lanes and other planned transportation
improvements on the downtown
transportation network.

H/I Streets Bus Improvements Technical Report
Final
This page left intentionally blank.

H/I Streets Bus Improvements Technical Report
Final P a g e | i
Table of Contents
EXECUTIVE SUMMARY ....................................................................................................................................................................................... ES-1
BACKGROUND/PURPOSE ....................................................................................................................................................................................... 1
Project Needs ................................................................................................................................................................................................................................................ 3
Study Process ................................................................................................................................................................................................................................................. 5
Document Organization ............................................................................................................................................................................................................................... 5
EXISTING CONDITIONS SUMMARY ........................................................................................................................................................................ 6
ALTERNATIVES SIMULATION ................................................................................................................................................................................ 10
Improvement Options Considered .......................................................................................................................................................................................................... 10
Optimized No-Build (2012) ................................................................................................................................................................................................................. 11
Alternative 1 – Concurrent Flow on H/I Streets ............................................................................................................................................................................... 12
Alternative 2 – Contra-Flow on H Street ........................................................................................................................................................................................... 13
Alternative 3 – Contra-Flow on H/I Streets ...................................................................................................................................................................................... 14
Contra-Flow Operations (Alternatives 2 and 3) .............................................................................................................................................................................. 15
Analysis Methodology: Establishing No-Build vs. Build Alternatives................................................................................................................................................ 16
Model Assumptions and Inputs ................................................................................................................................................................................................................ 17
Simulation Results ....................................................................................................................................................................................................................................... 21
Auto Travel-Time Changes (AM/PM) .................................................................................................................................................................................................. 24
Person Delay Changes (AM/PM) ........................................................................................................................................................................................................ 27
Bus Reliability .......................................................................................................................................................................................................................................... 29
Intersection LOS ...................................................................................................................................................................................................................................... 31
Sensitivity Analysis on Right-Turn Restriction Compliance .................................................................................................................................................................. 32
Summary of Simulation Results and Conclusions .................................................................................................................................................................................. 34
BENEFIT COST ANALYSIS ...................................................................................................................................................................................... 37
Elements of a Benefit Cost Analysis ....................................................................................................................................................................................................... 39
OPERATIONAL MANAGEMENT AND POLICY ....................................................................................................................................................... 42
Bus-Only Lane Hours of Operation ........................................................................................................................................................................................................ 42
Bus-Only Lane Access Policy .................................................................................................................................................................................................................... 42
Other Operational Considerations ........................................................................................................................................................................................................ 43
Curb Lane Uses Effects ............................................................................................................................................................................................................................. 44

H/I Streets Bus Improvements Technical Report
P a g e | ii Final
Mitigation Strategies ................................................................................................................................................................................................................................ 46
ENFORCEMENT ISSUES AND STRATEGIES ............................................................................................................................................................ 48
Dedicated Lane Enforcement Best Practices ......................................................................................................................................................................................... 48
Summary of Current District of Columbia Enforcement ...................................................................................................................................................................... 52
New York City MTA Enforcement Case Study ..................................................................................................................................................................................... 53
Proposed H/I Bus-only lane Enforcement Strategies .......................................................................................................................................................................... 54
COORDINATION WITH OTHER DDOT OFFICES ..................................................................................................................................................... 55
COORDINATION WITH COMMUTER BUS OPERATORS ......................................................................................................................................... 56
TECHNICAL REPORT CONCLUSIONS AND FINDINGS ........................................................................................................................................... 57
List of Tables
Table 1: H/I and K Street Bus Ridership ...................................................................................................................................................................................................... 3
Table 2: Model Simulations ......................................................................................................................................................................................................................... 16
Table 3: Annual Traffic Growth .................................................................................................................................................................................................................. 17
Table 4: Bus Route Modifications Summary ............................................................................................................................................................................................. 19
Table 5: Bus Travel-Time Changes ............................................................................................................................................................................................................. 22
Table 6: Auto Travel Time Changes ........................................................................................................................................................................................................... 24
Table 7: Changes in Person Delay ............................................................................................................................................................................................................. 27
Table 8: Bus Reliability Summary (Route 32/36) (2012) ..................................................................................................................................................................... 30
Table 9: LOS Thresholds for Signalized Intersections ............................................................................................................................................................................ 31
Table 10: Failing Intersection Analysis ..................................................................................................................................................................................................... 31
Table 11: Number of Violators per Signal Cycle in the PM ................................................................................................................................................................. 32
Table 12: Simulation Results Matrix ........................................................................................................................................................................................................... 34
Table 13: BCA Ratios for the Bus-only Lane Alternatives: Base + Fleet Savings + Bus Operating Cost Reduction Scenario .............................................. 38
Table 14: Preliminary Capital Cost Estimates (2013 Dollars) .............................................................................................................................................................. 39
Table 15: Enforcement Requirements by Alternative ............................................................................................................................................................................. 40
Table 16: Fleet Reduction Due to Improved Bus Reliability and Bus Travel Time Savings (Total Vehicle Savings in 2030) ................................................... 41
Table 17: Curb Lane Uses Inventory and Impacts Summary ................................................................................................................................................................ 44
Table 18: Potential Parking Revenue Loss ................................................................................................................................................................................................ 45
Table 19: Penalties for Bus-only lane Violations ................................................................................................................................................................................... 51
Table 20: Bus-Only Lanes Alternatives Performance Summary Matrix.............................................................................................................................................. 59
H/I Streets Bus Improvements Technical Report
Final P a g e | iii
List of Figures
Figure 1: Study Area Map ............................................................................................................................................................................................................................. 2
Figure 2: Regional Bus Frequencies (Peak, Off-Peak) .............................................................................................................................................................................. 4
Figure 3: Regional bus routes converging on H/I and K Streets ............................................................................................................................................................. 5
Figure 4: Bus vs. Vehicle Travel Speeds ....................................................................................................................................................................................................... 6
Figure 5: Study Area Bottlenecks .................................................................................................................................................................................................................. 7
Figure 6: Peak hour peak bicycle volumes (2012 – pre L/M Bicycle lanes implementation) ........................................................................................................... 8
Figure 7: Contra-flow Exit and Entry Transitions ..................................................................................................................................................................................... 15
Figure 8: Bus Travel Time Changes by Direction ..................................................................................................................................................................................... 23
Figure 9: Auto Travel Time Changes by Direction .................................................................................................................................................................................. 26
Figure 10: Bus Reliability Box Plots (Route 32/36) (2012) .................................................................................................................................................................. 30
Figure 11: 2012 PM Bus and Auto Travel Time Changes by Compliance Rate Scenario .............................................................................................................. 33
Appendices
A. Existing Conditions Report
B. Benefit Cost Analysis Technical Memorandum and Worksheets
C. 15% Design Plans
D. MWCOG CLRP H/I Bus-only Lane Project Sheets
E. Bus Route Modification Maps
F. Simulation Results and Calculation Worksheets
G. Capital Cost Estimates
H. Current District of Columbia Traffic and Parking Laws and Fines
H/I Streets Bus Improvements Technical Report
P a g e | iv Final
This page left intentionally blank.
H/I Streets Bus Improvements Technical Report
Final P a g e | ES – 1
EXECUTIVE SUMMARY
Overview
The H/I Streets Bus Improvements Technical
Report examines the feasibility of traffic
management improvements and bus-only
lanes within the downtown core of
Washington, D.C. Bus-only lanes have the
potential to improve operational efficiencies
for public transit as well as provide an
enhanced bus passenger experience by
bypassing traffic congestion and achieving
predictable bus arrival and travel times.
Additionally, segregating automobile and
bus travel modes reduces the “friction factor”
between the modes and improves travel
speeds for all users of the corridor.
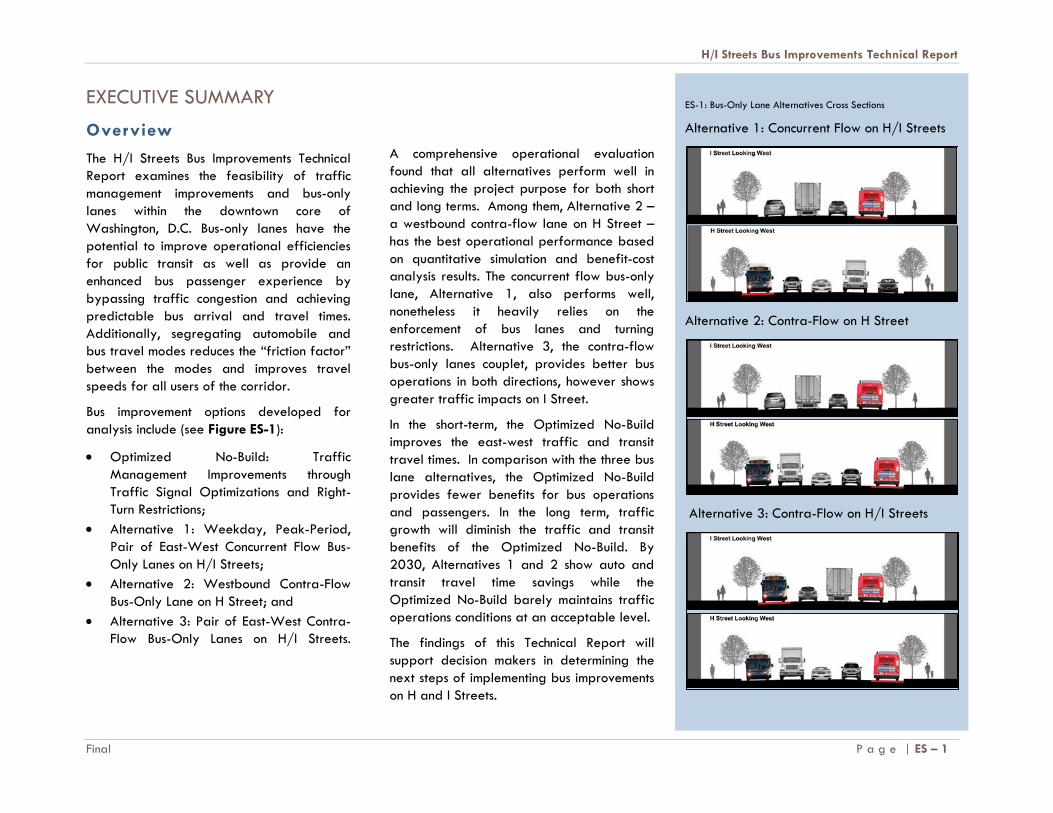
Bus improvement options developed for
analysis include (see Figure ES-1):
Optimized No-Build: Traffic
Management Improvements through
Traffic Signal Optimizations and Right-
Turn Restrictions;
Alternative 1: Weekday, Peak-Period,
Pair of East-West Concurrent Flow Bus-
Only Lanes on H/I Streets;
Alternative 2: Westbound Contra-Flow
Bus-Only Lane on H Street; and
Alternative 3: Pair of East-West Contra-
Flow Bus-Only Lanes on H/I Streets.
A comprehensive operational evaluation
found that all alternatives perform well in
achieving the project purpose for both short
and long terms. Among them, Alternative 2 –
a westbound contra-flow lane on H Street –
has the best operational performance based
on quantitative simulation and benefit-cost
analysis results. The concurrent flow bus-only
lane, Alternative 1, also performs well,
nonetheless it heavily relies on the
enforcement of bus lanes and turning
restrictions. Alternative 3, the contra-flow
bus-only lanes couplet, provides better bus
operations in both directions, however shows
greater traffic impacts on I Street.
In the short-term, the Optimized No-Build
improves the east-west traffic and transit
travel times. In comparison with the three bus
lane alternatives, the Optimized No-Build
provides fewer benefits for bus operations
and passengers. In the long term, traffic
growth will diminish the traffic and transit
benefits of the Optimized No-Build. By
2030, Alternatives 1 and 2 show auto and
transit travel time savings while the
Optimized No-Build barely maintains traffic
operations conditions at an acceptable level.
The findings of this Technical Report will
support decision makers in determining the
next steps of implementing bus improvements
on H and I Streets.
ES-1: Bus-Only Lane Alternatives Cross Sections
Alternative 1: Concurrent Flow on H/I Streets
Alternative 2: Contra-Flow on H Street
Alternative 3: Contra-Flow on H/I Streets
H/I Streets Bus Improvements Technical Report
P a g e | ES – 2 Final
Project Purpose and Need
In 2010, the District of Columbia Department
of Transportation (DDOT) and the
Washington Metropolitan Area Transit
Authority (WMATA) formed an inter-agency
working group to identify roadway segments
for traffic improvements and bus-only lane
implementation. The inter-agency group
identified the H/I Street couplet due to the
very high number of WMATA buses traveling
these segments. The H/I Bus Improvements
Technical Report was developed to identify
bus improvement alternatives along these
corridors and provide comprehensive
assessments of potential costs and benefits
for all corridor users.
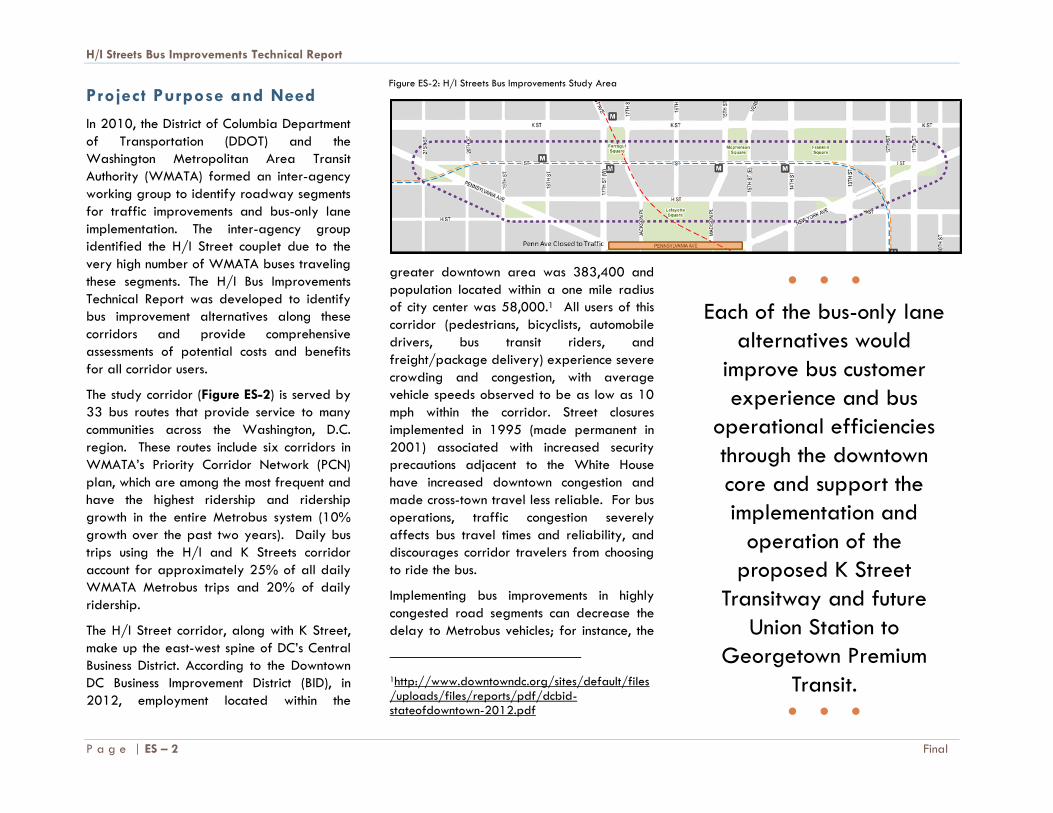
The study corridor (Figure ES-2) is served by
33 bus routes that provide service to many
communities across the Washington, D.C.
region. These routes include six corridors in
WMATA’s Priority Corridor Network (PCN)
plan, which are among the most frequent and
have the highest ridership and ridership
growth in the entire Metrobus system (10%
growth over the past two years). Daily bus
trips using the H/I and K Streets corridor
account for approximately 25% of all daily
WMATA Metrobus trips and 20% of daily
ridership.
The H/I Street corridor, along with K Street,
make up the east-west spine of DC’s Central
Business District. According to the Downtown
DC Business Improvement District (BID), in
2012, employment located within the
greater downtown area was 383,400 and
population located within a one mile radius
of city center was 58,000.1 All users of this
corridor (pedestrians, bicyclists, automobile
drivers, bus transit riders, and
freight/package delivery) experience severe
crowding and congestion, with average
vehicle speeds observed to be as low as 10
mph within the corridor. Street closures
implemented in 1995 (made permanent in
2001) associated with increased security
precautions adjacent to the White House
have increased downtown congestion and
made cross-town travel less reliable. For bus
operations, traffic congestion severely
affects bus travel times and reliability, and
discourages corridor travelers from choosing
to ride the bus.
Implementing bus improvements in highly
congested road segments can decrease the
delay to Metrobus vehicles; for instance, the
1http://www.downtowndc.org/sites/default/files/uploads/files/reports/pdf/dcbid-stateofdowntown-2012.pdf
Figure ES-2: H/I Streets Bus Improvements Study Area
● ● ●
Each of the bus-only lane
alternatives would
improve bus customer
experience and bus
operational efficiencies
through the downtown
core and support the
implementation and
operation of the
proposed K Street
Transitway and future
Union Station to
Georgetown Premium
Transit. ● ● ●
H/I Streets Bus Improvements Technical Report
Final P a g e | ES – 3
bus-only lane alternatives developed and
evaluated in this study result in a reduction of
bus travel time through the corridor by 30-
70% in the current year. This could allow for
resources to be redeployed improving bus
service on other corridors.
Further, improving transit speed and
reliability increases the attractiveness of
surface transit and can increase transit mode
share and decrease automobile demand. The
bus-only lane alternatives were developed
to provide reliable and efficient bus service
in the region’s most heavily traveled bus
corridor and to help alleviate Metrorail core
congestion through surface transit
improvements. The study provides a
comprehensive assessment of potential
benefits, effects, and costs associated with
each of the bus-only lane alternatives on the
corridor users, including traffic, transit, non-
motorized transportation and curbside uses.
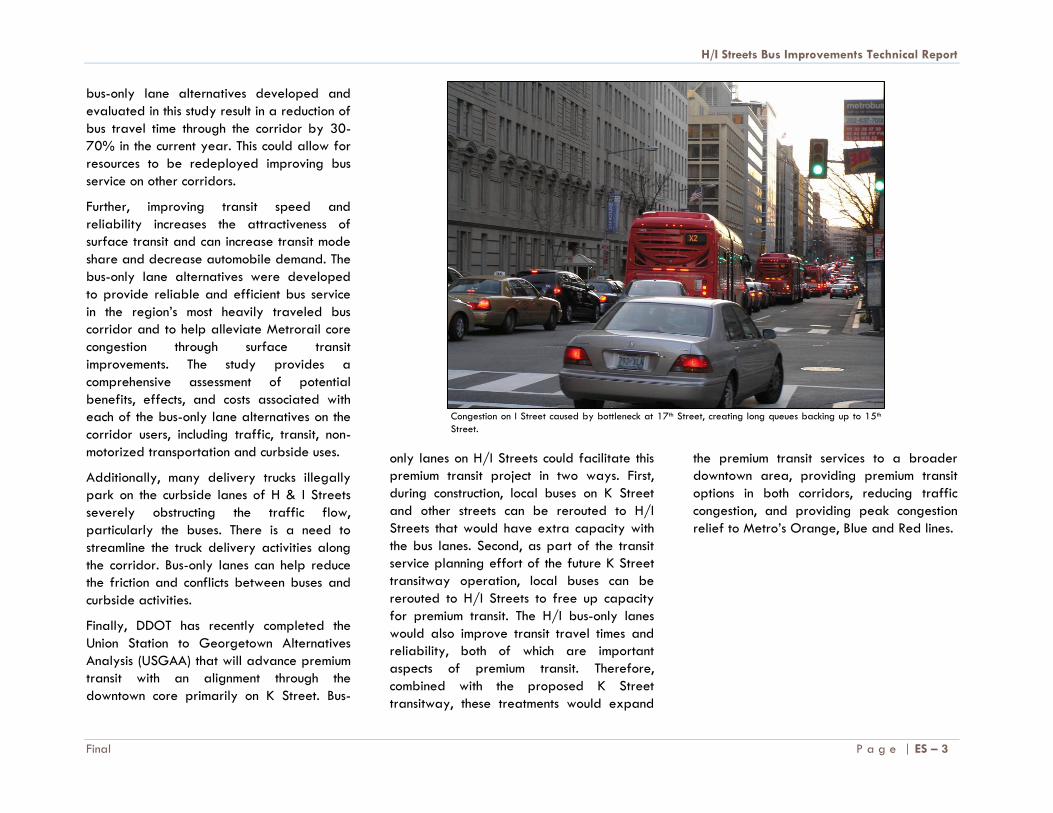
Additionally, many delivery trucks illegally
park on the curbside lanes of H & I Streets
severely obstructing the traffic flow,
particularly the buses. There is a need to
streamline the truck delivery activities along
the corridor. Bus-only lanes can help reduce
the friction and conflicts between buses and
curbside activities.
Finally, DDOT has recently completed the
Union Station to Georgetown Alternatives
Analysis (USGAA) that will advance premium
transit with an alignment through the
downtown core primarily on K Street. Bus-
only lanes on H/I Streets could facilitate this
premium transit project in two ways. First,
during construction, local buses on K Street
and other streets can be rerouted to H/I
Streets that would have extra capacity with
the bus lanes. Second, as part of the transit
service planning effort of the future K Street
transitway operation, local buses can be
rerouted to H/I Streets to free up capacity
for premium transit. The H/I bus-only lanes
would also improve transit travel times and
reliability, both of which are important
aspects of premium transit. Therefore,
combined with the proposed K Street
transitway, these treatments would expand
the premium transit services to a broader
downtown area, providing premium transit
options in both corridors, reducing traffic
congestion, and providing peak congestion
relief to Metro’s Orange, Blue and Red lines.
Congestion on I Street caused by bottleneck at 17th Street, creating long queues backing up to 15th
Street.
H/I Streets Bus Improvements Technical Report
P a g e | ES – 4 Final
Existing Conditions
The H/I Streets study corridor is located
between New York Avenue and Pennsylvania
Avenue, and extends approximately one
mile. The H/I Streets, along with K, L and M
Streets provide east-west connectivity
through the downtown core. There are
approximately 15,000 vehicles per day on
each of the two streets.2 About 3,000 daily
bus trips, which use the H/I corridor as part
of their route structure, carry 62,300 riders
per day, 80% of which are DC residents. This
level of ridership requires frequent service.
Routes from around the region converge in
this corridor; the combined Metrobus
frequency averages about a bus every
minute during peak period and every 2
minutes in the midday period on weekdays
and Saturdays. Additionally, bicyclists are
observed frequently in the study corridor as
well as on the adjacent streets. The corridor
is heavily used by pedestrians driven by not
only the dense urban land uses but also by
the frequent bus service and Metrorail
stations. Finally, other users, including
commuter buses, tour buses, delivery trucks
and taxis frequent the curbside lanes.
An assessment of the existing conditions of
the study corridor based on a combination of
field observations and transportation
network simulation (VISSIM) results identified
2 2010 DDOT Traffic Volume Map
the conditions and issues of all users of
corridor. The assessment concluded that
congestion severely impacts bus travel times
and reliability on the H/I Streets corridor.
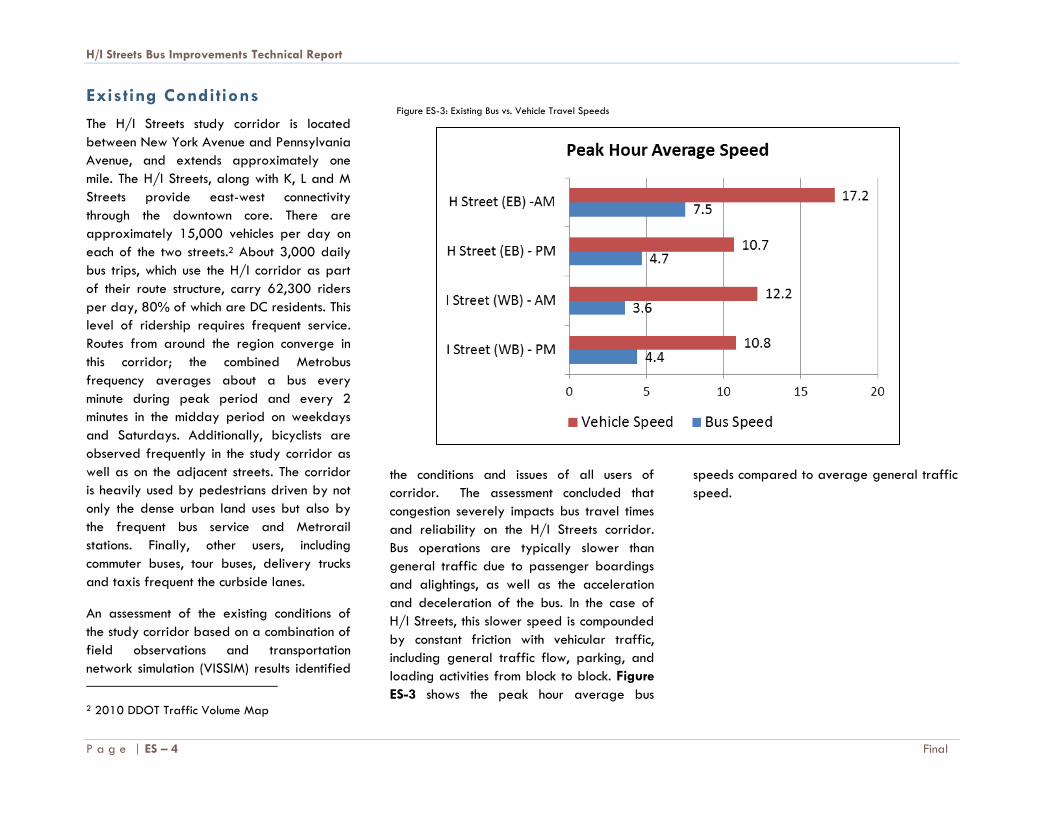
Bus operations are typically slower than
general traffic due to passenger boardings
and alightings, as well as the acceleration
and deceleration of the bus. In the case of
H/I Streets, this slower speed is compounded
by constant friction with vehicular traffic,
including general traffic flow, parking, and
loading activities from block to block. Figure
ES-3 shows the peak hour average bus
speeds compared to average general traffic
speed.
Figure ES-3: Existing Bus vs. Vehicle Travel Speeds

H/I Streets Bus Improvements Technical Report
Final P a g e | ES – 5
Bus priority treatments will be able to
improve bus travel speeds, improving their
operating efficiency and reliability making
them more attractive to riders.
There are also other major on-going multi-
modal projects in the greater study area,
including the Union Station to Georgetown
Alternatives Analysis focusing on K Street
and the L and M Street bicycle lanes. An
understanding of these ongoing projects in
the study area is necessary to evaluate the
combined effects of transportation
improvements in the downtown core and the
study corridor.
Overall, corridor congestion is the result of a
few bottlenecks and friction points between
modes, specifically between buses and autos,
and between turning vehicles and
pedestrians. As shown in Figure ES-4, these
bottlenecks are located at I Street and 13th
Street, I Street and 17th Street (W), H Street
and 17th Street, H Street and 15th Street,
and H Street and 14th Street. Improving the
travel conditions at these bottlenecks by
segregating buses and autos can yield travel
time savings for both modes and an
improved bus customer experience.
Figure ES-4: H/I Bus Improvements Study Area Intersection Bottlenecks

H/I Streets Bus Improvements Technical Report
P a g e | ES – 6 Final
Improvement Options
Considered
Four types of improvements options were
considered in the technical report: Optimized
No-Build traffic management improvements
and three dedicated bus-only lane
alternatives.. The bus-only lane alternatives
were developed after documenting the
existing traffic and transit operations in the
corridor, extensive field observations, and
VISSIM traffic simulation of today’s
conditions. The study team researched best
practices for bus improvements and applied
best engineering judgment in the
development of the four alternatives based
on field observations and data analysis.
Bus improvement options were developed for
analysis (see Figure ES-5):
Optimized No-Build: Traffic
Management Improvements through
Traffic Signal Optimizations and Right-
Turn Restrictions;
Alternative 1: Weekday, Peak-Period,
Pair of East-West Concurrent Flow Bus-
Only Lanes on H/I Streets;
Alternative 2: Westbound Contra-Flow
Bus-Only Lane on H Street; and
Alternative 3: Pair of East-West Contra-
Flow Bus-Only Lanes on H/I Streets.
ES-5: Bus Improvement Options Considered
Optimized No-Build: Traffic Signal Optimizations and Right-Turn Restrictions (2012)
Alternative 1: Concurrent Flow on H/I Streets
Alternative 2: Contra-Flow on H Street
Alternative 3: Contra-Flow on H/I Streets

H/I Streets Bus Improvements Technical Report
Final P a g e | ES – 7
Technical Analysis Findings and Policy Implications
Based on existing traffic condition analysis,
several models were developed using
VISSIM simulation software to understand
traffic impacts under the current and future
build conditions. The 2030 models assumed
future conditions including traffic growth, bus
ridership growth and increased bus dwell
times, bus operation frequencies, and
modification of bus routes for each of the
three build alternatives.
The alternatives were evaluated based on
the following quantitative performance
metrics:
Bus Travel Time Changes;
Auto Travel Time Changes;
Person Delay Changes;
Bus Reliability; and
Intersection Level of Service (LOS).
Bus Travel Time Changes:
Bus travel-time changes were documented
for eastbound- and westbound-traveling
buses for each improvement option. Changes
were determined by comparing existing bus
travel times in mixed traffic to bus travel
times in bus-only lanes. For the Optimized
No-Build, bus travel times were compared to
those buses traveling along the right-side
curb lane.
Westbound concurrent and contra-flow bus-
only lanes provide significant travel time
savings for buses and passengers in the
peak-periods, resulting in a reduction of bus
travel time by 30-70% or a maximum of 5
to 7.5 minutes. Contra-flow bus-only lanes on
H Street provide the most westbound bus
travel time savings.
Alternatives 1 and 2 do not provide benefits
from the existing condition in the eastbound
direction. Alternative 3, with a contra-flow
bus lane on I Street, is the only alternative
that provides eastbound bus travel time
benefits.
The Optimized No-Build provides transit and
traffic travel time savings comparable to
Alternative 1 in the short-term, however these
benefits lessen as traffic conditions worsen
into the future years.
Bus travel time savings in segregated bus-
only lanes will increase in future years as
traffic continues to grow on H and I Streets.
All alternatives assumed full compliance of
turning and operating restrictions in the bus-
only lanes.
Auto Travel Time Changes:
Auto travel-time changes were documented
for eastbound and westbound travel for
each improvement option. Changes were
determined by comparing existing mixed-
Table ES-1: 2012 Bus Improvements Technical Report Findings Summary
Alternatives
Max Bus
Travel Time
Savings
(minutes)*
Max Auto
Travel Time
Savings
(minutes)
Net Corridor
Person Delay
Savings (minutes)
Potential Reduction
in Travel Time
Standard Deviation
(minutes)
Opt. No-Build 4.5 3.0 106 1.2
Alternative 1 5.0 2.5 143 1.4
Alternative 2 7.5 2.5 158 1.8
Alternative 3 7.0 1.0 119 2.2
*Maximum travel time savings in westbound direction
● ● ●
Westbound bus lanes in all
three alternatives perform
exceptionally well during
rush hours, resulting in a
reduction of bus travel time
by 30-70%.
● ● ●
H/I Streets Bus Improvements Technical Report
P a g e | ES – 8 Final
traffic travel times to the mixed-traffic travel
times in the Optimized No-Build and the
three bus-only lane alternatives.
To be conservative and consistent with the
baseline conditions, the technical report did
not assume any decrease in auto demand
and increase in bus passenger demand.
Additionally, the existing traffic levels as
well as the future year projections were
operationally accommodated within the
study corridor with the bus lane alternatives.
This was achieved by optimizing traffic
signal operation as well as restricting right-
turn movements at several intersections. As
such, potential through traffic diversion to
neighboring streets is expected to be
minimal. The effect of rerouted right-turns
(about 280 peak hour trips) beyond the
study corridor was not operationally
analyzed. Subsequent studies, such as the
planned environmental impact assessment for
the Union Station to Georgetown premium
transit project, are recommended to analyze
the benefits and impacts for a larger area.
The Optimized No-Build shows auto travel
time savings comparable to Alternatives 1
and 2 in 2012. In 2030, the traffic
improvements seen in the Optimized No-
build are required to maintain an acceptable
traffic level of service and the Optimized
No-Build scenario is used as the base of
comparison for the bus-only lane
alternatives. With the addition of bus-only
lanes seen in Alternatives 1 and 2, auto
travel times are improved over the
Optimized No-Build even with increased
traffic growth. In 2030, the auto travel time
savings can be attributed to the separation
of bus and auto traffic.
The bus-only lanes in all three alternatives
have marginal effects on the eastbound
traffic. Eastbound auto travel time
experiences +/- 30 seconds change in the
rush hours. Westbound bus-only lanes
provide auto travel time savings of up to 2.5
minutes in 2012 due to separation of bus
traffic from general traffic (less friction)
along with signal timing optimizations at
several key intersections. An eastbound
contra-flow bus lane on I Street shows auto
travel time increase due to reduced auto
capacity and projected traffic demand
growth on I Street traffic in 2030.
Person Delay Changes:
Person delay (person hours/hour) is the
measure of time required to move
individuals, rather than measuring time
required to move vehicles. Measuring person
delay rather than vehicle delay is an
analysis approach that captures the overall
impact of transportation improvements.
Person delay changes are a function of
person throughput and bus and auto travel
time changes. All of the bus improvement
options, including the three alternatives
provide net person delay improvements.
Alternative 2 provides the most person delay
improvements in both 2012 and 2030.
Bus Reliability:
The bus travel time reliability is reflected by
travel time standard deviation. A low
standard deviation indicates the travel times
tend to be close to the average; a high
standard deviation indicates the travel times
are more spread out over a large range of
values. As the bus travel time standard
deviation becomes smaller, the more reliable
and constant the bus operations are. The
results show that all three alternatives
provide smaller bus travel time standard
deviation than in the mixed traffic, which
means implementing the bus-only lanes will
help improve the bus travel-time reliability
and runtime consistency. In the westbound
direction, the maximum time to travel the
corridor decreases and the variability
becomes more constant in both the AM and
PM peak-periods. In the eastbound direction,
the variability of bus travel time shows
marginal improvement or similar runtime
reliability to the existing condition in all
alternatives.
● ● ●
All three bus-lane
alternatives provide bus
reliability improvements
over the existing conditions.
● ● ●
H/I Streets Bus Improvements Technical Report
Final P a g e | ES – 9
Alternative 3 provides the best bus reliability
results in terms of potential reduction of
travel time standard deviation in the
westbound direction.
Intersection Level of Service (LOS):
Under the existing conditions, three
intersections in the study area were
determined to be failing in either the AM or
PM peak-periods: I St and 17th St E; I St and
13th St; and H St and 17th St.
In 2012 and 2030, all three bus lane
alternatives maintain the same LOS or
provide LOS improvements at existing failing
intersections on H/I Streets, under the
assumption that there would be no traffic
diversion or reduction resulting from the
implementation of bus-only lanes.
Effects of Turning Restrictions and
Signal Optimizations:
Proposed right-turn restrictions were tested
at intersections of I and 17th Streets W and
E to further understand the operational
benefits of these turn restrictions on the
corridor operations and how much potential
violators would negate these benefits. The
results showed that signal timing optimization
contributes to auto and bus travel time
savings of approximately 1.5 and 3.5
minutes respectively in the westbound
direction for all build alternatives.
While Alternative 1 and 3 could
accommodate occasional violations of
restricted right-turns in the rush hours (1 to 2
vehicles per signal cycle) without negating
the bus-only lane performance, any increase
in violations will quickly lead to the
breakdown of the bus-only lane operations.
The ultimate success of these treatments
depends on the effectiveness of enforcement,
whose costs are included the Benefit Cost
Analysis section of the Final Report and page
ES-11 of the Executive Summary. Alternative
2 did not include any right-turn restrictions.
As discussed earlier, while traffic rerouting
due to these restrictions were operationally
accommodated in the study corridor
acceptably, their effects on the neighboring
streets need to be assessed further.
H/I Streets Bus Improvements Technical Report
P a g e | ES – 10 Final
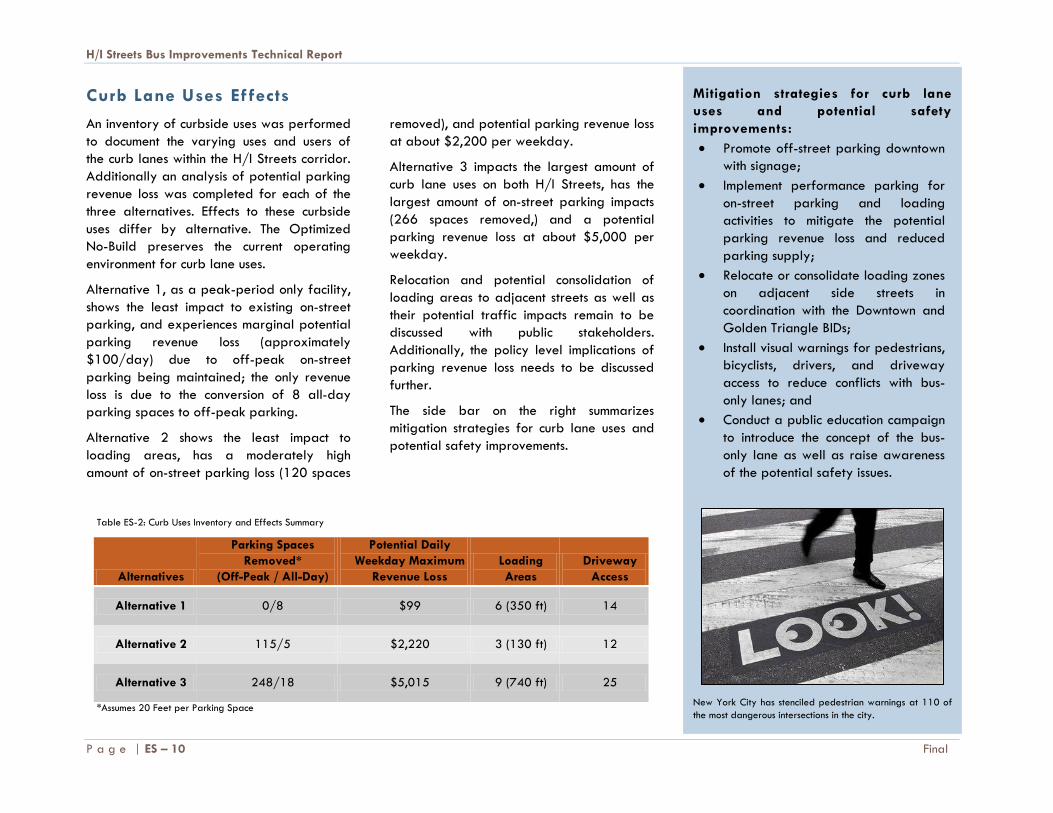
Curb Lane Uses Ef fects
An inventory of curbside uses was performed
to document the varying uses and users of
the curb lanes within the H/I Streets corridor.
Additionally an analysis of potential parking
revenue loss was completed for each of the
three alternatives. Effects to these curbside
uses differ by alternative. The Optimized
No-Build preserves the current operating
environment for curb lane uses.
Alternative 1, as a peak-period only facility,
shows the least impact to existing on-street
parking, and experiences marginal potential
parking revenue loss (approximately
$100/day) due to off-peak on-street
parking being maintained; the only revenue
loss is due to the conversion of 8 all-day
parking spaces to off-peak parking.
Alternative 2 shows the least impact to
loading areas, has a moderately high
amount of on-street parking loss (120 spaces
removed), and potential parking revenue loss
at about $2,200 per weekday.
Alternative 3 impacts the largest amount of
curb lane uses on both H/I Streets, has the
largest amount of on-street parking impacts
(266 spaces removed,) and a potential
parking revenue loss at about $5,000 per
weekday.
Relocation and potential consolidation of
loading areas to adjacent streets as well as
their potential traffic impacts remain to be
discussed with public stakeholders.
Additionally, the policy level implications of
parking revenue loss needs to be discussed
further.
The side bar on the right summarizes
mitigation strategies for curb lane uses and
potential safety improvements.
Table ES-2: Curb Uses Inventory and Effects Summary
Alternatives
Parking Spaces
Removed*
(Off-Peak / All-Day)
Potential Daily
Weekday Maximum
Revenue Loss
Loading
Areas
Driveway
Access
Alternative 1 0/8 $99 6 (350 ft) 14
Alternative 2 115/5 $2,220 3 (130 ft) 12
Alternative 3 248/18 $5,015 9 (740 ft) 25
*Assumes 20 Feet per Parking Space
Mitigation strategies for curb lane
uses and potential safety
improvements:
Promote off-street parking downtown
with signage;
Implement performance parking for
on-street parking and loading
activities to mitigate the potential
parking revenue loss and reduced
parking supply;
Relocate or consolidate loading zones
on adjacent side streets in
coordination with the Downtown and
Golden Triangle BIDs;
Install visual warnings for pedestrians,
bicyclists, drivers, and driveway
access to reduce conflicts with bus-
only lanes; and
Conduct a public education campaign
to introduce the concept of the bus-
only lane as well as raise awareness
of the potential safety issues.
New York City has stenciled pedestrian warnings at 110 of
the most dangerous intersections in the city.
H/I Streets Bus Improvements Technical Report
Final P a g e | ES – 11
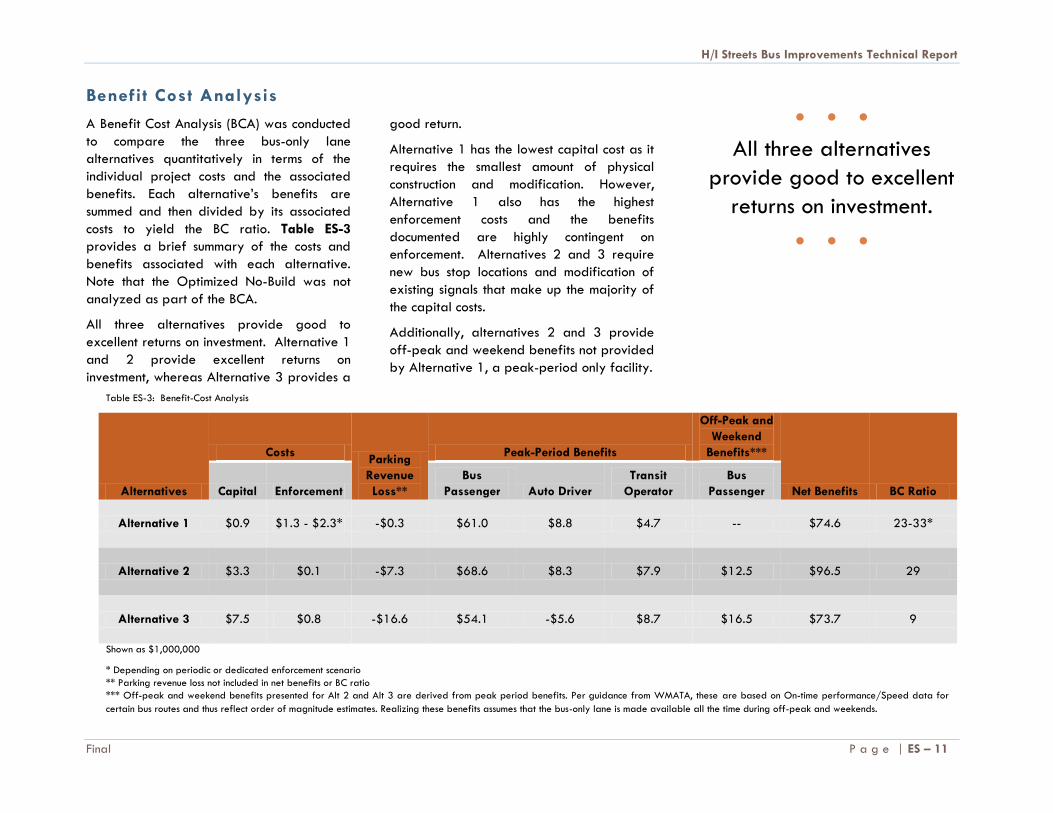
Benefit Cost Analysis
A Benefit Cost Analysis (BCA) was conducted
to compare the three bus-only lane
alternatives quantitatively in terms of the
individual project costs and the associated
benefits. Each alternative’s benefits are
summed and then divided by its associated
costs to yield the BC ratio. Table ES-3
provides a brief summary of the costs and
benefits associated with each alternative.
Note that the Optimized No-Build was not
analyzed as part of the BCA.
All three alternatives provide good to
excellent returns on investment. Alternative 1
and 2 provide excellent returns on
investment, whereas Alternative 3 provides a
good return.
Alternative 1 has the lowest capital cost as it
requires the smallest amount of physical
construction and modification. However,
Alternative 1 also has the highest
enforcement costs and the benefits
documented are highly contingent on
enforcement. Alternatives 2 and 3 require
new bus stop locations and modification of
existing signals that make up the majority of
the capital costs.
Additionally, alternatives 2 and 3 provide
off-peak and weekend benefits not provided
by Alternative 1, a peak-period only facility.
Table ES-3: Benefit-Cost Analysis
Alternatives
Costs Parking
Revenue
Loss**
Peak-Period Benefits
Off-Peak and
Weekend
Benefits***
Net Benefits BC Ratio Capital Enforcement
Bus
Passenger Auto Driver
Transit
Operator
Bus
Passenger
Alternative 1 $0.9 $1.3 - $2.3* -$0.3 $61.0 $8.8 $4.7 -- $74.6 23-33*
Alternative 2 $3.3 $0.1 -$7.3 $68.6 $8.3 $7.9 $12.5 $96.5 29
Alternative 3 $7.5 $0.8 -$16.6 $54.1 -$5.6 $8.7 $16.5 $73.7 9
Shown as $1,000,000
* Depending on periodic or dedicated enforcement scenario
** Parking revenue loss not included in net benefits or BC ratio
*** Off-peak and weekend benefits presented for Alt 2 and Alt 3 are derived from peak period benefits. Per guidance from WMATA, these are based on On-time performance/Speed data for
certain bus routes and thus reflect order of magnitude estimates. Realizing these benefits assumes that the bus-only lane is made available all the time during off-peak and weekends.
● ● ●
All three alternatives
provide good to excellent
returns on investment.
● ● ●

H/I Streets Bus Improvements Technical Report
P a g e | ES – 12 Final
Operational Management Considerations and Enforcement Strategies:
There are several operational management and policy considerations that are vital to the successful implementation of bus-only lanes on H/I Streets.
These operational management and policy considerations include the hours of operation, vehicle access policy, and bus lane enforcement strategies,
and may vary between the three alternatives.
Table ES-4: Bus-Only Lane Hours of Operation
Alternative Hours of Operation
Alternative 1 Weekdays, Peak Periods
Alternative 2 24/7
Alternative 3 24/7
Table ES-5: Bus-Only Lane Access Policy
Alternative
WMATA
Buses
DC
Circulator
Publicly
Operated
Commuter
Buses
Private
Shuttles/
Charters/ Long
Distance
Providers Taxis Bicycles
Alternative 1 X X 1 3 3 X
Alternative 2 X X 2
Alternative 3 X X 2
1 – Permitted, as WMATA/DC Circulator buses are able to overtake dwelling commuter buses
2 – Through buses permitted only (no stopping)
3 –Allowed only outside of restricted hours
Table ES-6: Bus-Only Lane Enforcement Strategies
Alternative
Signage and
Pavement Markings
Enforcement Personnel for
Right-Turn Restrictions
Enforcement for
Mid-Block Operating
Restrictions
Alternative 1 X X X
Alternative 2 X
Alternative 3 X X
Enforcement Strategies
Signage and Pavement Markings:
Signage would clearly communicate the
restrictions of the bus-only lanes, including
the hours of operation, vehicles permitted,
and fines for violations in all alternatives.
Enforcement Personnel: Concurrent flow
bus-only lanes require on-going
enforcement personnel in order to ensure
the peak operational efficiency of the
facility. Contra-flow is typically self-
enforcing by design. Enforcement personnel
would be required during the early
implementation period for all alternatives
to help change driver behavior. The
Optimized No-Build and Alternatives 1
and 3 require continuous enforcement of
right-turn restrictions by DDOT traffic
control officers. DPW and MPD personnel
would continue to enforce parking and
traffic violations in the corridor in all
alternatives.
H/I Streets Bus Improvements Technical Report
Final Technical Report P a g e | ES – 13
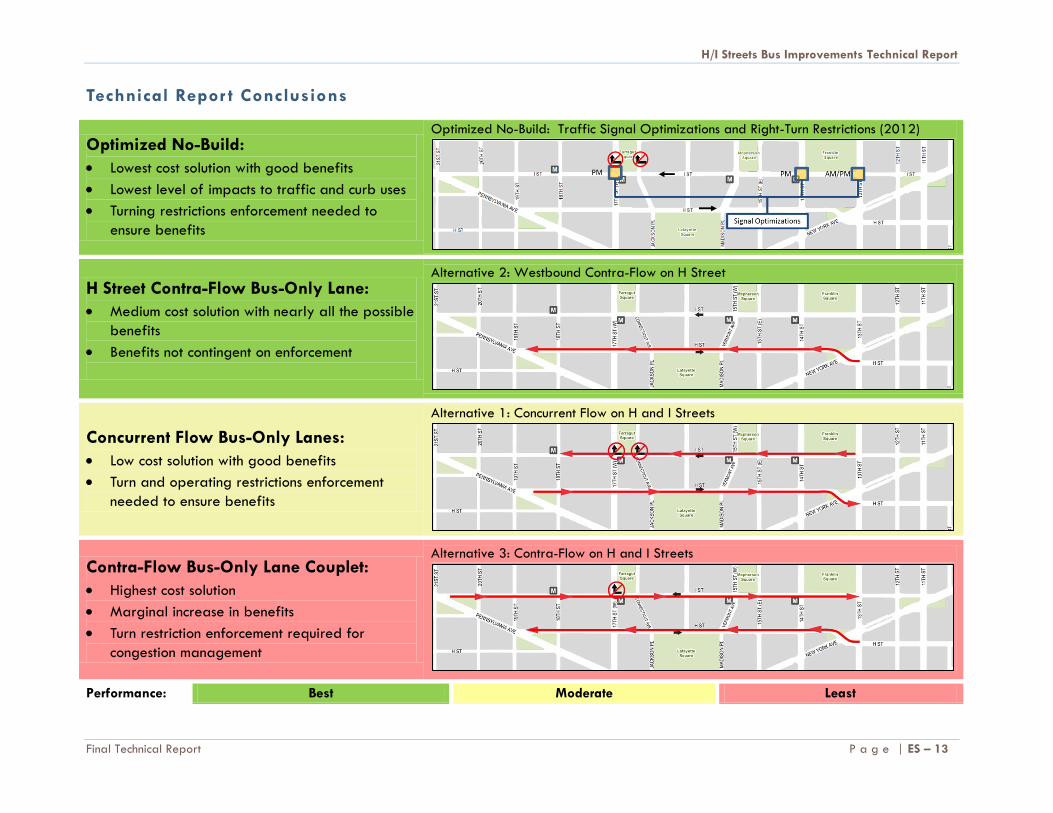
Technical Repor t Conclusions
Optimized No-Build:
Lowest cost solution with good benefits
Lowest level of impacts to traffic and curb uses
Turning restrictions enforcement needed to
ensure benefits
Optimized No-Build: Traffic Signal Optimizations and Right-Turn Restrictions (2012)
H Street Contra-Flow Bus-Only Lane:
Medium cost solution with nearly all the possible
benefits
Benefits not contingent on enforcement
Alternative 2: Westbound Contra-Flow on H Street
Concurrent Flow Bus-Only Lanes:
Low cost solution with good benefits
Turn and operating restrictions enforcement
needed to ensure benefits
Alternative 1: Concurrent Flow on H and I Streets
Contra-Flow Bus-Only Lane Couplet:
Highest cost solution
Marginal increase in benefits
Turn restriction enforcement required for
congestion management
Alternative 3: Contra-Flow on H and I Streets
Performance: Best Moderate Least

H/I Streets Bus Improvements Technical Report
P a g e | ES – 14 Final
Technical Report Conclusions (cont.)
Table ES-7 and the text below illustrate the
overall performance of each bus-only lane
alternative and the general conclusions of this
Technical Report.
Transit Performance: Alternative 3, the
contra-flow bus-only lanes couplet, provides
better travel times with exclusive bus lanes in
both travel directions, however when bus
person throughput is measured Alternative 2
performs the best.
Traffic Impacts: Alternative 2 provides the
best results in terms of traffic impacts
including improved automobile travel times
and no significant impacts to intersection
LOS.
Curb Lane Impacts: With the preservation of
off-peak on-street parking, Alternative 1
performs the best in terms of curb lane
impacts.
Capital and Enforcement Costs: Alternative
1 has low upfront capital costs compared to
the other two alternatives. However,
Alternative 1 has the highest enforcement
costs.
BCA Standard Benefits: Alternative 2
provides the most monetary benefits as
determined by the BCA in terms of travel
time savings (bus and automobile), bus
reliability savings, and bus emission savings.
All three alternatives provide good to
excellent returns on investment. Alternative 1
and 2 provide excellent returns on
investment, whereas Alternative 3 provides a
good return.
BCA Operating Cost Reduction Benefits:
Alternative 3 provides the most monetary
benefits as determined by the BCA in terms
of operating cost reduction benefits.
Other Major Findings:
Generally, both vehicular traffic and
buses gain benefits in the westbound
direction. Eastbound mixed traffic and
buses are marginally affected (both
positively and negatively varying on
alternative).
As a result of bus travel time savings and
bus reliability improvements, WMATA
would experience operational benefits in
terms of fleet savings under all three
alternatives by 2030.
Because bus service is cyclic, bus-only
lane improvements would benefit the
entire route under all alternatives.
Passengers would experience more
predicable travel times and uniform
headways, resulting in reduced waiting
time at bus stops.
Intersection LOS is not negatively
affected due to the addition of bus-only
lanes in any alternative. All alternatives
improve or maintain LOS at existing
failing intersections on H/I Streets.
Enforcement of right-turn restrictions are
needed to ensure the desired bus-only
lane performance as simulated (100%
compliance), with the recognition that
occasional violators could be tolerated
by the bus-only lane. Occasional
violations are highly likely to happen
even under diligent enforcement.
One potential benefit of Alternative 2 is
the removal of buses from busy I Street
without dedication of a general purpose
lane to bus operations. Bus route
modifications move 23 peak-hour bus
trips off of I Street onto the westbound
contra-flow bus-only lane on H Street
during the PM peak hour.
Signal timing optimizations and right-turn
restrictions improve westbound traffic
flow on I Street from the existing
condition.
Optimized No-Build:
Applying traffic management
improvements without bus lanes, such as
signal timing optimizations and right-turn
restrictions, can improve westbound
traffic flow on I Street from the existing
condition in the near-term.

H/I Streets Bus Improvements Technical Report
Final P a g e | ES – 15
Table ES-7: Bus-Only Lanes Alternatives Performance Summary Matrix
Alternative
Transit
Performance Traffic Impacts
Curb Lane
Impacts
Capital and
Enforcement Costs
BCA Standard
Benefits
BCA Operating
Cost Reduction
Benefits
Alternative 1:
Concurrent Flow Bus-
Only Lanes on H/I
Streets
Alternative 2: Contra-
Flow Bus-Only Lane
on H Street
Alternative 3: Contra-
Flow Bus-Only Lanes
on H/I Streets
Performance: Least to Best

H/I Streets Bus Improvements Technical Report
P a g e | ES – 16 Final
Technical Repor t Findings and Next Steps
The Technical Report analyzed and
evaluated bus operational improvements and
bus lane alternatives through a combination
of quantitative operational measures and
policy considerations, including travel time
savings, curb lane impacts, enforcement
strategies, and costs. This study found that
all bus improvement alternatives provide
good to excellent returns on transit
investment, and identified a technical
preference for the H Street contra-flow bus-
only lane (Alternative 2).
In consideration of the ongoing land use
development and transportation
improvement initiatives in Downtown, a short-
term traffic management option, as seen in
the Optimized No-Build scenario, could
provide immediate benefits to the existing
traffic and transit operations in the east-west
corridor of H/I and K Streets and allow
flexibility for a later determination of transit
investment.
This Technical Report recommends further
analysis of the bus-lane alternatives in order
to understand the overall benefits and
effects to the downtown transportation
network, including traffic diversion and
reroutings due to turn restrictions. While the
technical report assumed auto traffic would
remain on the H and I Streets, the proposed
operational changes including turning
restrictions could potentially induce traffic
diversion to other streets.
If a bus-lane alternative were selected for
implementation, DDOT would require NEPA
& Section 106 approval. Therefore,
subsequent studies could include the
recommendations and findings of this study,
which would also allow for the determination
of the benefits and impacts at the network
level.
Relocation and potential consolidation of
loading areas to adjacent streets as well as
their potential traffic impacts remain to be
discussed with public stakeholders.
Additionally, the policy level implications of
parking revenue loss needs to be discussed
further.
H/I Streets Bus Improvements Technical Report
Final P a g e | 1
BACKGROUND/PURPOSE
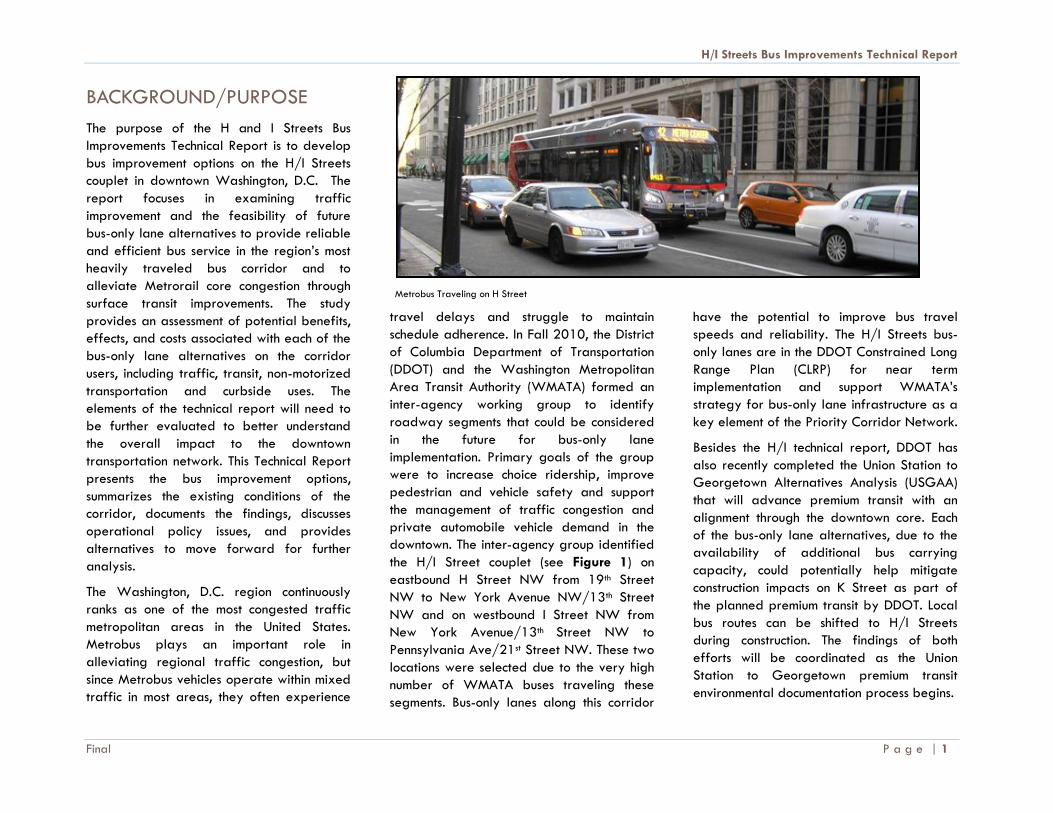
The purpose of the H and I Streets Bus
Improvements Technical Report is to develop
bus improvement options on the H/I Streets
couplet in downtown Washington, D.C. The
report focuses in examining traffic
improvement and the feasibility of future
bus-only lane alternatives to provide reliable
and efficient bus service in the region’s most
heavily traveled bus corridor and to
alleviate Metrorail core congestion through
surface transit improvements. The study
provides an assessment of potential benefits,
effects, and costs associated with each of the
bus-only lane alternatives on the corridor
users, including traffic, transit, non-motorized
transportation and curbside uses. The
elements of the technical report will need to
be further evaluated to better understand
the overall impact to the downtown
transportation network. This Technical Report
presents the bus improvement options,
summarizes the existing conditions of the
corridor, documents the findings, discusses
operational policy issues, and provides
alternatives to move forward for further
analysis.
The Washington, D.C. region continuously
ranks as one of the most congested traffic
metropolitan areas in the United States.
Metrobus plays an important role in
alleviating regional traffic congestion, but
since Metrobus vehicles operate within mixed
traffic in most areas, they often experience
travel delays and struggle to maintain
schedule adherence. In Fall 2010, the District
of Columbia Department of Transportation
(DDOT) and the Washington Metropolitan
Area Transit Authority (WMATA) formed an
inter-agency working group to identify
roadway segments that could be considered
in the future for bus-only lane
implementation. Primary goals of the group
were to increase choice ridership, improve
pedestrian and vehicle safety and support
the management of traffic congestion and
private automobile vehicle demand in the
downtown. The inter-agency group identified
the H/I Street couplet (see Figure 1) on
eastbound H Street NW from 19th Street
NW to New York Avenue NW/13th Street
NW and on westbound I Street NW from
New York Avenue/13th Street NW to
Pennsylvania Ave/21st Street NW. These two
locations were selected due to the very high
number of WMATA buses traveling these
segments. Bus-only lanes along this corridor
have the potential to improve bus travel
speeds and reliability. The H/I Streets bus-
only lanes are in the DDOT Constrained Long
Range Plan (CLRP) for near term
implementation and support WMATA’s
strategy for bus-only lane infrastructure as a
key element of the Priority Corridor Network.
Besides the H/I technical report, DDOT has
also recently completed the Union Station to
Georgetown Alternatives Analysis (USGAA)
that will advance premium transit with an
alignment through the downtown core. Each
of the bus-only lane alternatives, due to the
availability of additional bus carrying
capacity, could potentially help mitigate
construction impacts on K Street as part of
the planned premium transit by DDOT. Local
bus routes can be shifted to H/I Streets
during construction. The findings of both
efforts will be coordinated as the Union
Station to Georgetown premium transit
environmental documentation process begins.
Metrobus Traveling on H Street

H/I Streets Bus Improvements Technical Report
P a g e | 2 Final
Figure 1: Study Area Map
H/I Streets Bus Improvements Technical Report
Final P a g e | 3
Project Needs
The H/I Streets corridor, along with K Street,
make up the east-west spine of the District’s
Central Business District. All users of these
corridors experience severe traffic congestion,
including pedestrians, bicyclists, automobile
drivers, and bus transit riders. Street closures
associated with the increased security
precautions adjacent to the White House in
1995 (made permanent in 2001) have
increased downtown congestion and made
cross-town travel less reliable. As noted in the
2011 White House Area Transportation
Study, the loss in street grid continuity and
capacity caused by the street closures has led
to increases in congestion on parallel streets,
vehicular travel times, turning movements, and
conflicts between motorized and non-
motorized traffic.
For bus operations, congestion severely
affects bus travel times and reliability, and
discourages corridor travelers from choosing
to ride the bus. As the District and region are
forecasted to experience increased
residential and commercial growth, travel
associated with the growth will exacerbate
the existing congestion.
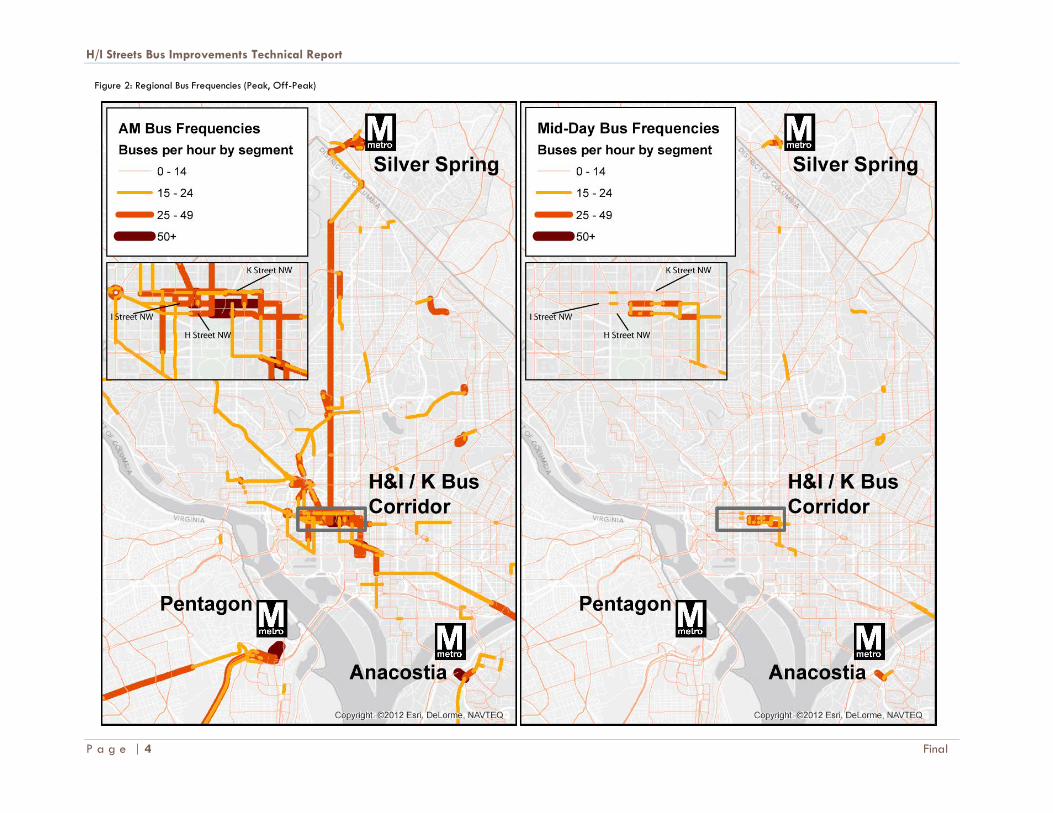
As seen in Figure 2, the study corridor
provides the most frequent bus service in both
the peak and off-peak-periods, rival to only
bus connections at three Metrorail stations:
Pentagon, Anacostia, and Silver Spring.
Metrobus services using H/I and K Streets are
among the region’s most frequent and
productive ridership lines, making up
approximately 25% of the entire WMATA
daily bus trips and 20% of the entire WMATA
bus ridership (see Table 1). During the peak
hours, the combined Metrobus frequency
reaches 1 bus every minute, carrying as many
as 850 passengers per hour in the most
heavily traveled segment. While travel time
savings due to the bus-only lanes would only
benefit the passengers traveling on the
corridor, the reliability improvements would
affect the experience of all riders, as shown in
Table 1, along the routes that serve the H/I
corridor. Additionally, bus fleet savings would
be possible if the bus lanes save a full
headway under current conditions or deter
additional fleet requirements in the near
future for those routes currently approaching
operating capacity.
The H/I and K corridors include six of
Metrobus’ Priority Corridors which, as seen in
Figure 3, serve the greater Washington, D.C.
metropolitan area. These Priority Corridor
Network (PCN) routes include the 30s, 80s, S,
X, 16s, and the G8 lines. Under today’s
operating conditions, bus transit capacity is
maxed out on both H/I Streets and K Street.
Comprehensive improvements are needed to
enhance pedestrian, automobile, and bus
experience along H, I, and K Streets traveling
east-west across the city.
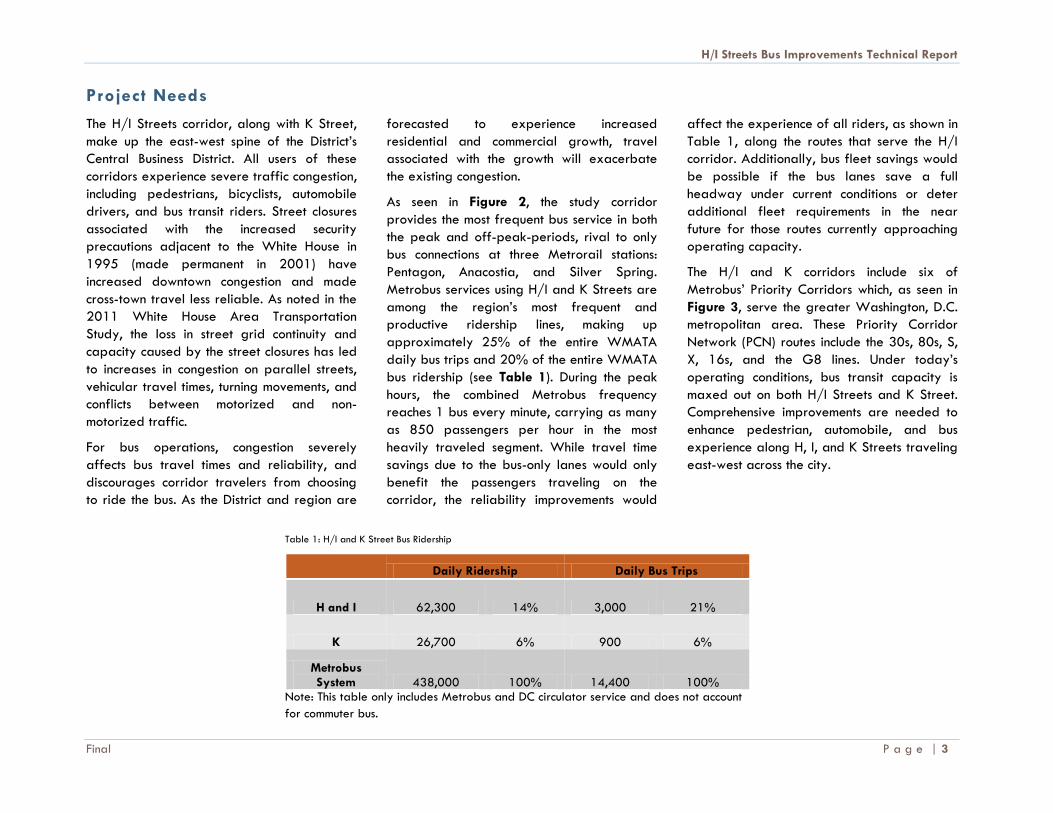
Table 1: H/I and K Street Bus Ridership
Daily Ridership Daily Bus Trips
H and I 62,300 14% 3,000 21%
K 26,700 6% 900 6%
Metrobus System 438,000 100% 14,400 100%
Note: This table only includes Metrobus and DC circulator service and does not account
for commuter bus.
H/I Streets Bus Improvements Technical Report
P a g e | 4 Final
Figure 2: Regional Bus Frequencies (Peak, Off-Peak)

H/I Streets Bus Improvements Technical Report
Final P a g e | 5
Study Process
In February 2012, WMATA and DDOT initiated the H/I Bus
Improvements Technical Report. This report developed traffic
improvements and bus-only lane alternatives for the H/I
Street couplet in downtown Washington, D.C. Coordination
between WMATA and DDOT was established early in the
project development. After completing an assessment of the
existing conditions, the project team developed a set of bus-
improvement alternatives to further analyze. In the
development of the alternatives, the project team reviewed
best practices for enhancing bus conditions and bus-only
lanes as well as incorporated experience from other local
bus-only lane projects in the Washington, D.C. metropolitan
area. A traffic simulation was developed for the bus-only
lane alternatives using the VISSIM software model. Traffic
and bus operations results were developed for the existing
(2012) and future build (2030) conditions. After the study
and stakeholder outreach process is complete, WMATA and
DDOT will select a preferred alternative to develop further.
Document Organization
This report summarizes the findings of the H/I Streets Bus
Improvements Technical Report and is organized as follows:
Existing Conditions Summary
Alternatives Simulation and Results
Cost Benefit Analysis
Operational Management and Policy
Enforcement Issues and Strategies
Conclusion and Recommendations
Figure 3: Regional bus routes converging on H/I and K Streets
H/I Streets Bus Improvements Technical Report
P a g e | 6 Final
EXISTING CONDITIONS SUMMARY
The assessment of the existing conditions
included field observation visits, data
provided by WMATA and DDOT, and a
VISSIM existing conditions traffic simulation.
VISSIM was used to measure queues and
travel times of personal autos and buses.
Intersection Level of Service (LOS)
determination was obtained by post-
processing VISSIM delay data, which were
measured for each approach from the stop
bar to the adjacent upstream intersection. For
short segments, queues often extend beyond
the upstream intersection. In those instances,
this methodology only captures delays up to
the upstream intersection, where LOS will then
include all the remaining vehicle delay.
Therefore, there might be differences in the
LOS results that are obtained from other
software packages such as SYNCHRO.
The following summarizes the conditions and
issues of all users of the corridor based on a
combination of field observations and model
simulation results. The full existing conditions
technical memorandum can be seen in
Appendix A.
Transit Conditions
Downtown transit core. The H/I Streets
are located in the downtown transit core.
The mile-long study corridor between
New York Avenue and Pennsylvania
Avenue is served by 33 bus routes,
sixteen stops and connected with 3
Metrorail stations— Farragut North,
Farragut West and McPherson Square,
providing access to Red, Orange, and
Blue Lines. Twenty-four local bus routes
include those operated by Metrobus and
DC Circulator. Additionally, nine commuter
bus routes are operated by Loudoun
County Transit and Potomac and
Rappahannock Transportation Commission
(OmniRide). Combined with bus service on
K Street just one block north, the H/I
Streets and K Street corridors formed the
core of downtown surface transit for east-
west movements.
High level of Metrobus service. Twenty-
three Metrobus routes serve H/I Streets
from the District, Virginia and Maryland,
including six (6) PCN lines: 30s, 80s, S, X,
16s, and G8. The combined Metrobus
frequency averages 1 bus every minute in
the peak on weekdays and 1 bus every 2
minutes in the midday on weekdays and
Saturdays. The Metrobus lines using H/I
carry 63,000 ridership on a daily basis
and the most heavily traveled segment on
I Street carries more than 850 passengers
in the PM peak hour. Based on the 2008
Metrobus Survey, 80% of the trips on
routes that use H/I Streets are made by
District residents.
Severe congestion impacts on bus travel
times and reliability. Bus operations are
typically slower than general traffic due
to passenger boardings and alightings, as
well as the acceleration and deceleration
of the bus. In the case of H/I Streets, this
slower speed is compounded by constant
friction with vehicular traffic, including
general traffic flow, parking and delivery
trucks from block to block. Additionally,
the high volume of turning movements at
intersections, slowed by crossing
pedestrians, results in the spillover of
vehicle queue for several blocks, further
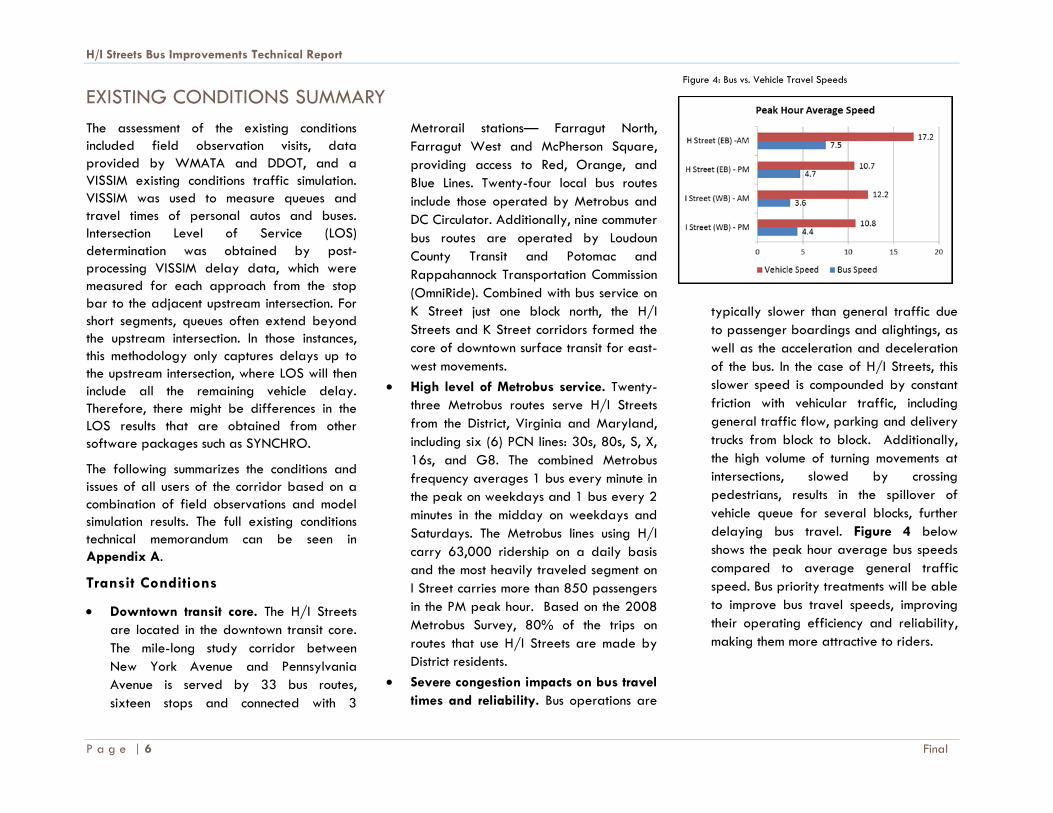
delaying bus travel. Figure 4 below
shows the peak hour average bus speeds
compared to average general traffic
speed. Bus priority treatments will be able
to improve bus travel speeds, improving
their operating efficiency and reliability,
making them more attractive to riders.
Figure 4: Bus vs. Vehicle Travel Speeds
H/I Streets Bus Improvements Technical Report
Final P a g e | 7
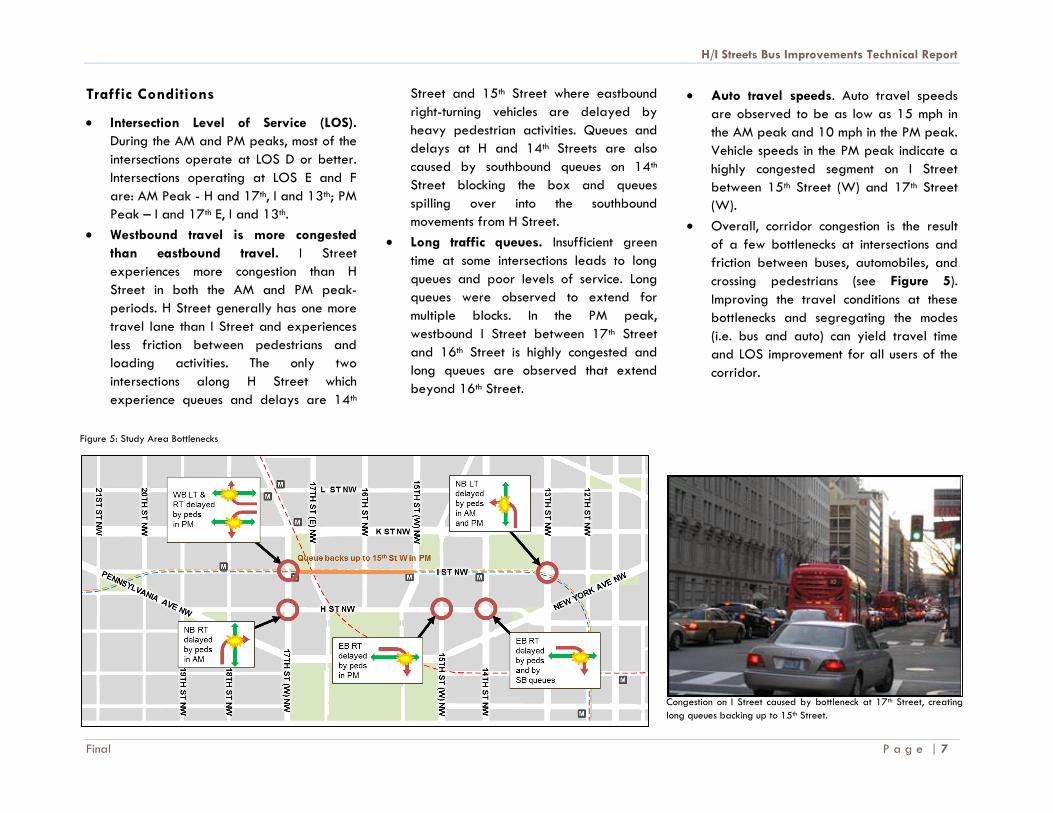
Traffic Conditions
Intersection Level of Service (LOS).
During the AM and PM peaks, most of the
intersections operate at LOS D or better.
Intersections operating at LOS E and F
are: AM Peak - H and 17th, I and 13th; PM
Peak – I and 17th E, I and 13th.
Westbound travel is more congested
than eastbound travel. I Street
experiences more congestion than H
Street in both the AM and PM peak-
periods. H Street generally has one more
travel lane than I Street and experiences
less friction between pedestrians and
loading activities. The only two
intersections along H Street which
experience queues and delays are 14th
Street and 15th Street where eastbound
right-turning vehicles are delayed by
heavy pedestrian activities. Queues and
delays at H and 14th Streets are also
caused by southbound queues on 14th
Street blocking the box and queues
spilling over into the southbound
movements from H Street.
Long traffic queues. Insufficient green
time at some intersections leads to long
queues and poor levels of service. Long
queues were observed to extend for
multiple blocks. In the PM peak,
westbound I Street between 17th Street
and 16th Street is highly congested and
long queues are observed that extend
beyond 16th Street.
Auto travel speeds. Auto travel speeds
are observed to be as low as 15 mph in
the AM peak and 10 mph in the PM peak.
Vehicle speeds in the PM peak indicate a
highly congested segment on I Street
between 15th Street (W) and 17th Street
(W).
Overall, corridor congestion is the result
of a few bottlenecks at intersections and
friction between buses, automobiles, and
crossing pedestrians (see Figure 5).
Improving the travel conditions at these
bottlenecks and segregating the modes
(i.e. bus and auto) can yield travel time
and LOS improvement for all users of the
corridor.
Figure 5: Study Area Bottlenecks
Congestion on I Street caused by bottleneck at 17th Street, creating
long queues backing up to 15th Street.
H/I Streets Bus Improvements Technical Report
P a g e | 8 Final
Pedestrian Conditions
An enforcement challenge is jay-walking –
where 25% to 50% pedestrians cross the
roadway while the signal is red.
High volume of pedestrian activity at
several intersections causes automobile
and bus traffic to experience long delays,
resulting in long queues. Some of these
delays can be attributed to high volumes
of pedestrians accessing Metrorail stations
on I Street which conflict with right-turning
vehicles.
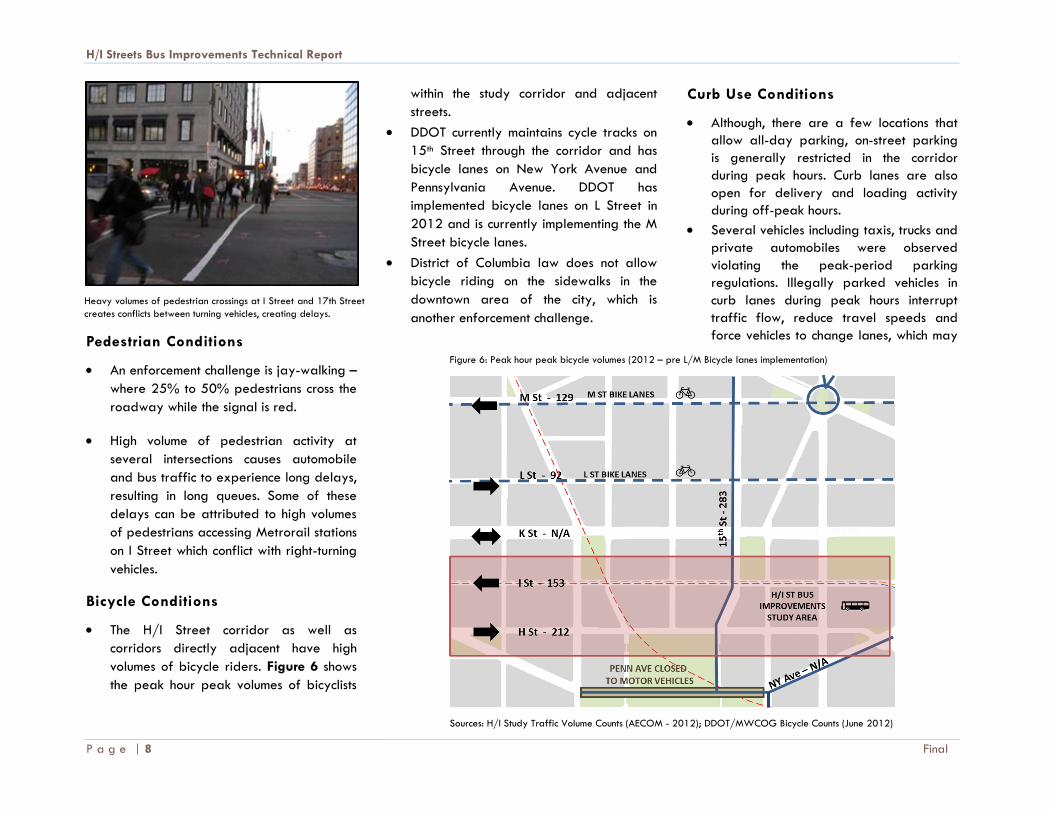
Bicycle Conditions
The H/I Street corridor as well as
corridors directly adjacent have high
volumes of bicycle riders. Figure 6 shows
the peak hour peak volumes of bicyclists
within the study corridor and adjacent
streets.
DDOT currently maintains cycle tracks on
15th Street through the corridor and has
bicycle lanes on New York Avenue and
Pennsylvania Avenue. DDOT has
implemented bicycle lanes on L Street in
2012 and is currently implementing the M
Street bicycle lanes.
District of Columbia law does not allow
bicycle riding on the sidewalks in the
downtown area of the city, which is
another enforcement challenge.
Curb Use Conditions
Although, there are a few locations that
allow all-day parking, on-street parking
is generally restricted in the corridor
during peak hours. Curb lanes are also
open for delivery and loading activity
during off-peak hours.
Several vehicles including taxis, trucks and
private automobiles were observed
violating the peak-period parking
regulations. Illegally parked vehicles in
curb lanes during peak hours interrupt
traffic flow, reduce travel speeds and
force vehicles to change lanes, which may
Heavy volumes of pedestrian crossings at I Street and 17th Street
creates conflicts between turning vehicles, creating delays.
Figure 6: Peak hour peak bicycle volumes (2012 – pre L/M Bicycle lanes implementation)
Sources: H/I Study Traffic Volume Counts (AECOM - 2012); DDOT/MWCOG Bicycle Counts (June 2012)

H/I Streets Bus Improvements Technical Report
Final P a g e | 9
be a safety concern and could lead to
crashes. Stricter enforcement and higher
fines may be required to deter violations.
There are several driveways providing
access to alleys and garages in the
corridor. Vehicles trying to access these
driveways and alleys come in conflict with
through traffic, including transit vehicles,
and negatively impact transit travel
speeds.
Stricter enforcement of existing laws
would free up the curb lanes to improve
traffic flow through the study area.
Ongoing Projects in the Study Area
An understanding of the ongoing projects in
the study area is necessary to evaluate the
combined effects of transportation
improvements in the downtown core and the
study corridor.
DDOT implemented cycle tracks on L
Street and is currently developing cycle
tracks on M Street, which provides an
east-west connection adjacent to the H/I
Street Bus-only Lanes study corridors. The
L and M bicycle tracks will form the
northern portion of a downtown network
of cycle tracks.
DDOT is performing an Alternatives
Analysis Study for premium transit service
in the Union Station to Georgetown
corridor. The study will evaluate premium
transit on various alignments in the
corridor and result in an Alternatives
Analysis Report in Fall of 2013. Premium
transit is high-quality transit that offers
improved reliability and speed from
normal bus operations. It is typically
achieved through limited stops, faster fare
collection, signal priority and some level
of dedicated right-of-way. At the time of
this report, DDOT has not selected a
preferred alignment or mode for the
premium transit service currently under
evaluation in the alternatives analysis.
The District Transportation Improvement
Program (TIP) has allocated funds for the
design and construction for an East-West
Transitway. The transitway will run in the
median of K Street between Mt. Vernon
Triangle and Washington Circle, serving
the downtown area. The new roadway
will provide improved transit and
vehicular mobility, reduce congestion and
air pollution, and improve transportation
safety.

H/I Streets Bus Improvements Technical Report
P a g e | 10 Final
ALTERNATIVES SIMULATION
Improvement Options
Considered
Four types of improvements options were
considered in the technical report: Optimized
No-Build traffic management improvements
and three dedicated bus-only lane
alternatives. The bus-only lane alternatives
were developed after documenting the
existing traffic and transit operations in the
corridor, extensive field observations, and
VISSIM traffic simulation of today’s conditions.
The study team researched best practices for
bus improvements and applied best
engineering judgment in the development of
the four alternatives based on field
observations and data analysis. The four
alternatives are as follows:
Optimized No-Build: Traffic Management
Improvements through Traffic Signal
Optimizations and Right-Turn Restrictions;
Alternative 1: Concurrent Flow Bus-Only
Lanes on H/I Streets;
Alternative 2: Contra-Flow Bus-Only Lane
on H Street; and
Alternative 3: Contra-Flow Bus-Only Lanes
on H/I Streets.
The following discussion details the four
alternatives, including the physical design and
the operational assumptions for each
alternative.
Optimized No-Build: Traffic Signal Optimizations and Right-Turn Restrictions (2012)
Alternative 1: Concurrent Flow on H/I Streets
Alternative 2: Contra-Flow on H Street
Alternative 3: Contra-Flow on H/I Streets
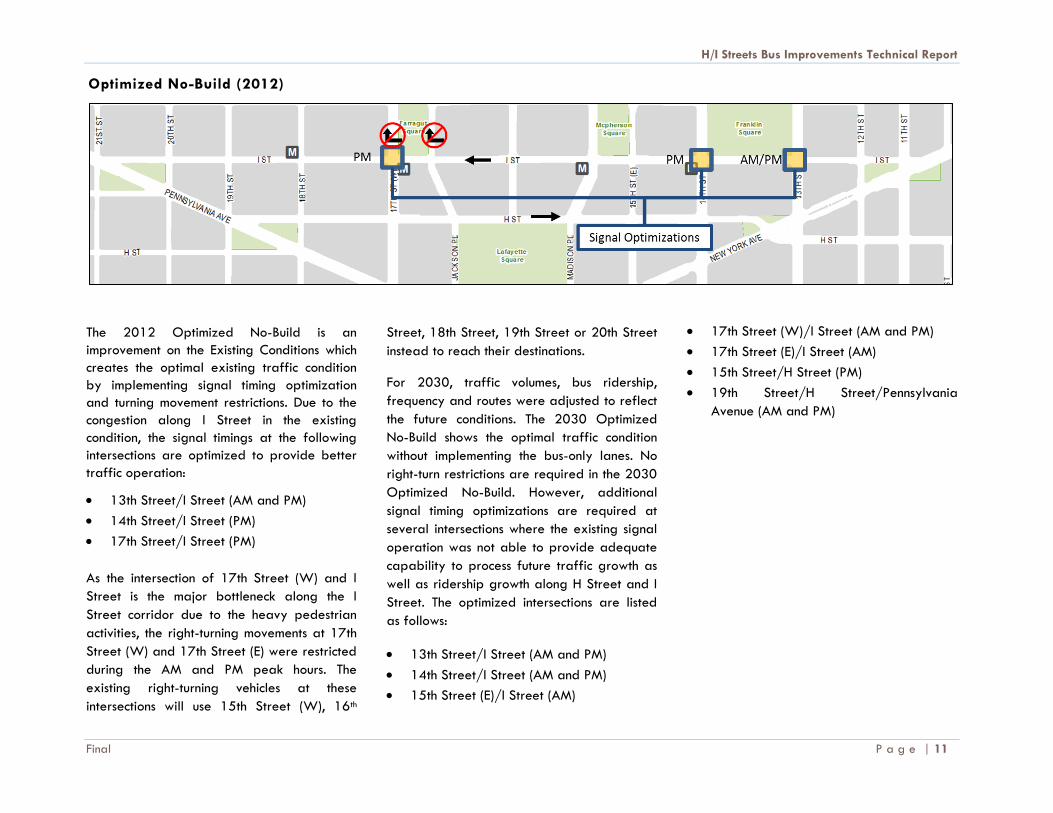
H/I Streets Bus Improvements Technical Report
Final P a g e | 11
Optimized No-Build (2012)
The 2012 Optimized No-Build is an
improvement on the Existing Conditions which
creates the optimal existing traffic condition
by implementing signal timing optimization
and turning movement restrictions. Due to the
congestion along I Street in the existing
condition, the signal timings at the following
intersections are optimized to provide better
traffic operation:
13th Street/I Street (AM and PM)
14th Street/I Street (PM)
17th Street/I Street (PM)
As the intersection of 17th Street (W) and I
Street is the major bottleneck along the I
Street corridor due to the heavy pedestrian
activities, the right-turning movements at 17th
Street (W) and 17th Street (E) were restricted
during the AM and PM peak hours. The
existing right-turning vehicles at these
intersections will use 15th Street (W), 16th
Street, 18th Street, 19th Street or 20th Street
instead to reach their destinations.
For 2030, traffic volumes, bus ridership,
frequency and routes were adjusted to reflect
the future conditions. The 2030 Optimized
No-Build shows the optimal traffic condition
without implementing the bus-only lanes. No
right-turn restrictions are required in the 2030
Optimized No-Build. However, additional
signal timing optimizations are required at
several intersections where the existing signal
operation was not able to provide adequate
capability to process future traffic growth as
well as ridership growth along H Street and I
Street. The optimized intersections are listed
as follows:
13th Street/I Street (AM and PM)
14th Street/I Street (AM and PM)
15th Street (E)/I Street (AM)
17th Street (W)/I Street (AM and PM)
17th Street (E)/I Street (AM)
15th Street/H Street (PM)
19th Street/H Street/Pennsylvania
Avenue (AM and PM)
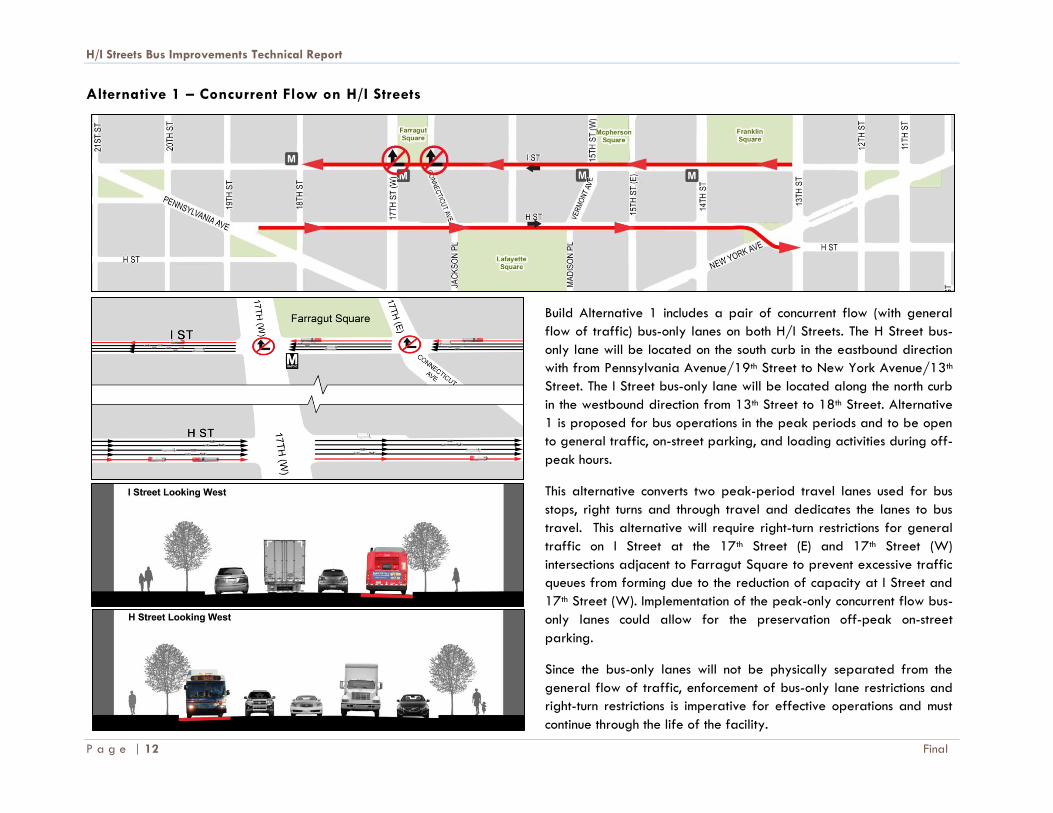
H/I Streets Bus Improvements Technical Report
P a g e | 12 Final
Alternative 1 – Concurrent Flow on H/I Streets
Build Alternative 1 includes a pair of concurrent flow (with general
flow of traffic) bus-only lanes on both H/I Streets. The H Street bus-
only lane will be located on the south curb in the eastbound direction
with from Pennsylvania Avenue/19th Street to New York Avenue/13th
Street. The I Street bus-only lane will be located along the north curb
in the westbound direction from 13th Street to 18th Street. Alternative
1 is proposed for bus operations in the peak periods and to be open
to general traffic, on-street parking, and loading activities during off-
peak hours.
This alternative converts two peak-period travel lanes used for bus
stops, right turns and through travel and dedicates the lanes to bus
travel. This alternative will require right-turn restrictions for general
traffic on I Street at the 17th Street (E) and 17th Street (W)
intersections adjacent to Farragut Square to prevent excessive traffic
queues from forming due to the reduction of capacity at I Street and
17th Street (W). Implementation of the peak-only concurrent flow bus-
only lanes could allow for the preservation off-peak on-street
parking.
Since the bus-only lanes will not be physically separated from the
general flow of traffic, enforcement of bus-only lane restrictions and
right-turn restrictions is imperative for effective operations and must
continue through the life of the facility.

H/I Streets Bus Improvements Technical Report
Final P a g e | 13
Alternative 2 – Contra-Flow on H Street
Build Alternative 2 includes a single contra-flow (opposite direction of
general flow of traffic) bus-only lane on H Street. The contra-flow
lane on H Street will be located on the north curb in the westbound
direction from New York Avenue/13th Street to Pennsylvania
Avenue/19th Street. Buses in the eastbound direction will continue to
operate in mixed traffic on H Street. This alternative requires
exclusive bus operations in the westbound bus-only lane 24 hours a
day and 7 days a week.
This alternative converts a travel lane used for bus stops, right turns
and through travel and dedicates the lane to bus travel. This lane is
currently used for on-street parking in the off-peak. Implementation of
the contra-flow bus-only lane does not allow for the preservation off-
peak on-street parking on the north curb of H Street.
This alternative requires the bus-only lane to be separated from the
general flow of traffic as well as special bus signalization at
intersections. Physical separation could include double yellow lines and
other low impact devices, such as raised concrete or plastic/rubber
barriers, or flexible pylon stanchions. Physical barriers would be
designed to allow lane access for emergency situations. Raised
barriers can also complicate snow removal. Signal timing optimizations
at some signalized intersections is also assumed as part of this
alternative.
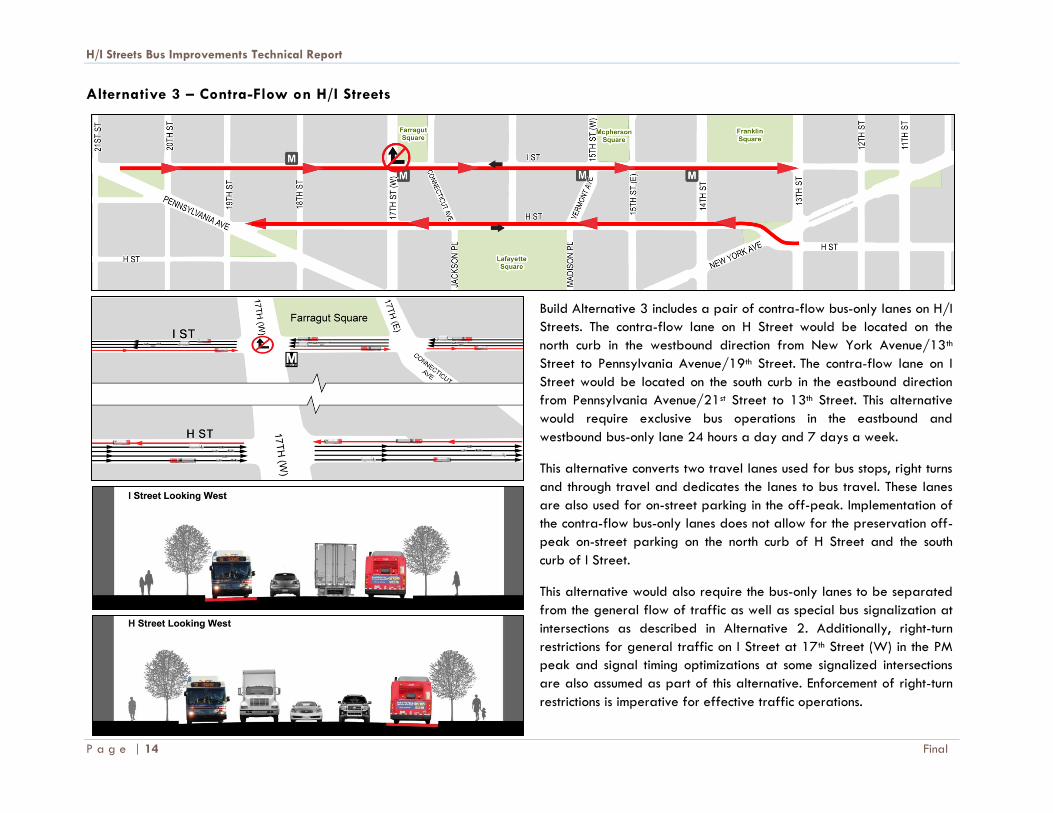
H/I Streets Bus Improvements Technical Report
P a g e | 14 Final
Alternative 3 – Contra-Flow on H/I Streets
Build Alternative 3 includes a pair of contra-flow bus-only lanes on H/I
Streets. The contra-flow lane on H Street would be located on the
north curb in the westbound direction from New York Avenue/13th
Street to Pennsylvania Avenue/19th Street. The contra-flow lane on I
Street would be located on the south curb in the eastbound direction
from Pennsylvania Avenue/21st Street to 13th Street. This alternative
would require exclusive bus operations in the eastbound and
westbound bus-only lane 24 hours a day and 7 days a week.
This alternative converts two travel lanes used for bus stops, right turns
and through travel and dedicates the lanes to bus travel. These lanes
are also used for on-street parking in the off-peak. Implementation of
the contra-flow bus-only lanes does not allow for the preservation off-
peak on-street parking on the north curb of H Street and the south
curb of I Street.
This alternative would also require the bus-only lanes to be separated
from the general flow of traffic as well as special bus signalization at
intersections as described in Alternative 2. Additionally, right-turn
restrictions for general traffic on I Street at 17th Street (W) in the PM
peak and signal timing optimizations at some signalized intersections
are also assumed as part of this alternative. Enforcement of right-turn
restrictions is imperative for effective traffic operations.
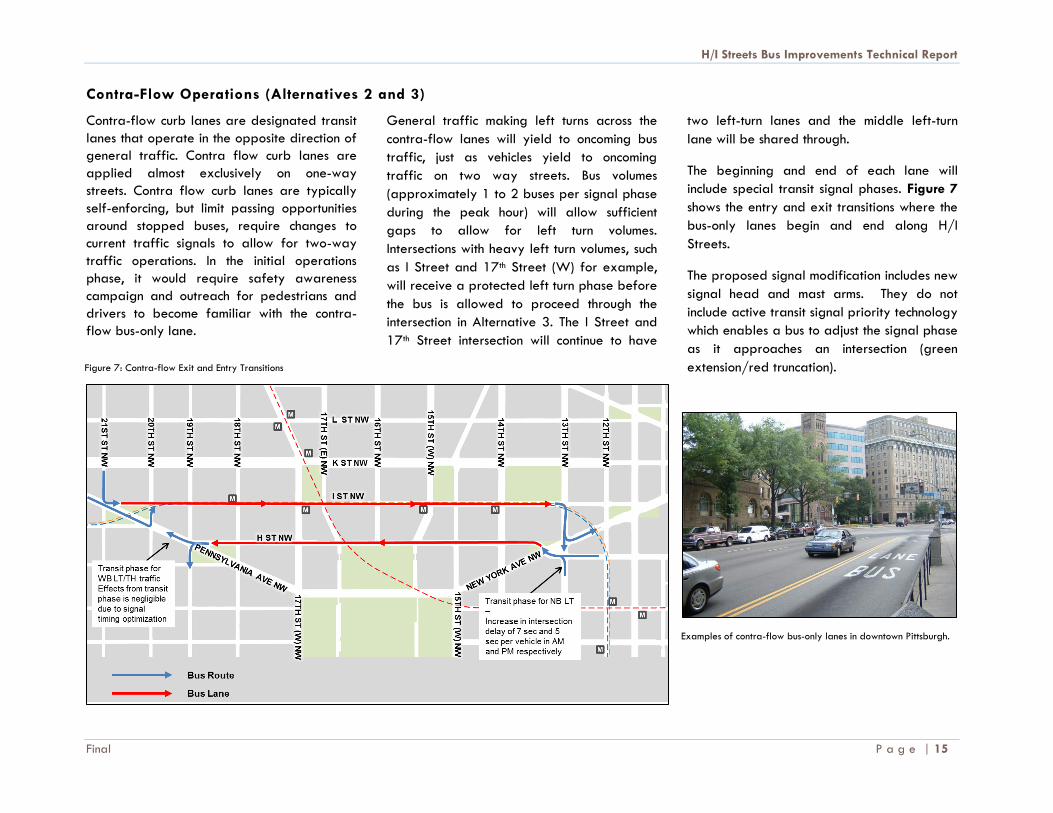
H/I Streets Bus Improvements Technical Report
Final P a g e | 15
Contra-Flow Operations (Alternatives 2 and 3)
Contra-flow curb lanes are designated transit
lanes that operate in the opposite direction of
general traffic. Contra flow curb lanes are
applied almost exclusively on one-way
streets. Contra flow curb lanes are typically
self-enforcing, but limit passing opportunities
around stopped buses, require changes to
current traffic signals to allow for two-way
traffic operations. In the initial operations
phase, it would require safety awareness
campaign and outreach for pedestrians and
drivers to become familiar with the contra-
flow bus-only lane.
General traffic making left turns across the
contra-flow lanes will yield to oncoming bus
traffic, just as vehicles yield to oncoming
traffic on two way streets. Bus volumes
(approximately 1 to 2 buses per signal phase
during the peak hour) will allow sufficient
gaps to allow for left turn volumes.
Intersections with heavy left turn volumes, such
as I Street and 17th Street (W) for example,
will receive a protected left turn phase before
the bus is allowed to proceed through the
intersection in Alternative 3. The I Street and
17th Street intersection will continue to have
two left-turn lanes and the middle left-turn
lane will be shared through.
The beginning and end of each lane will
include special transit signal phases. Figure 7
shows the entry and exit transitions where the
bus-only lanes begin and end along H/I
Streets.
The proposed signal modification includes new
signal head and mast arms. They do not
include active transit signal priority technology
which enables a bus to adjust the signal phase
as it approaches an intersection (green
extension/red truncation).
Figure 7: Contra-flow Exit and Entry Transitions
Examples of contra-flow bus-only lanes in downtown Pittsburgh.

H/I Streets Bus Improvements Technical Report
P a g e | 16 Final
Analysis Methodology: Establishing No-Build vs. Build Alternatives
Based on existing traffic condition analysis,
traffic simulation models were developed to
understand traffic impacts under no-build and
build conditions. The 2012 Optimized No-
Build model is an improvement to the Existing
Conditions model which represents the optimal
existing traffic condition by implementing
signal timing optimization and turning
movement restrictions. This model helps
differentiate the traffic impacts from the
signal timing optimizations, turning movements,
and bus-only lane operation. Three Build
models are developed to simulate the traffic
conditions with three proposed bus-only lane
alternatives. Build Alternative 1 shows the
concurrent-flow dedicated bus-only lane
operation on I Street from 13th Street to 18th
Street, and concurrent-flow dedicated bus-
only lane operation on H Street from 19th
Street to 13th Street. Build Alternative 2 has
the contra-flow dedicated bus-only lane
operation on H Street from 13th Street to
19th Street. The eastbound buses remain in
the mixed operation on H Street. Build
Alternative 3 shows contra-flow dedicated
bus-only lanes on I Street from 21st Street to
13th Street, and on H Street from 13th Street
to Pennsylvania Avenue.
The 2030 Optimized No-Build and Build
models were also developed to forecast
future year traffic conditions. 2030 Optimized
No-Build model represents the optimal traffic
condition without implementing the bus-only
lanes in 2030. The base 2030 model required
optimizations due to observed gridlock when
traffic growth projections were applied to the
existing conditions model. It is reasonable to
expect that these traffic signal optimizations
will be applied in the study corridor. Signal
timing was optimized at several intersections
where the existing signal operation was not
able to provide adequate capability to
process future traffic growth as well as
ridership growth along H Street and I Street.
The 2030 Build models assume the same
configurations of bus-only lanes as for the
2012 models.
The following section discusses in detail the
model assumptions and inputs for 2012 and
2030 No-Build and Build models (see Table 2
for all Model Simulations developed).
Table 2: Model Simulations
Current Condition Future Condition
Model Simulation Model Simulation
2012 Existing Conditions (Base for Comparison) 2030 Optimized No-Build (Base for Comparison)
2012 Optimized No-Build
2012 Alternative 1 2030 Alternative 1
2012 Alternative 2 2030 Alternative 2
2012 Alternative 3 2030 Alternative 3

H/I Streets Bus Improvements Technical Report
Final P a g e | 17
Model Assumptions and Inputs
Future Traffic Growth
In order to estimate the future traffic growth
rate along the H/I Street corridors, available
data on annual average daily traffic (AADT)
volumes between 2002 and 2009 within the
study area were analyzed. The AADT data
were obtained from DDOT’s online website.
Table 3 provides a comparison of AADT
volumes for select road segments in 2002 and
2009. Based on this data, an annual growth
rate was determined for each of the
segments.
AADT comparison indicated that while some
road segments experienced a steady increase
in traffic volumes, volumes along other
segments stayed constant or slightly
decreased. An average growth rate of 0.4%
was estimated based on data across all the
segments within the study area.
To further analyze the traffic volume
projections, the project team also looked at
projections from Metropolitan Washington
Council of Governments (MWCOG) version
2.3 model. Link level traffic volume estimates
from the 2012 and 2035 COG models were
analyzed. Based on the model outputs, annual
growth rates of 0.54% and 0.35% were
estimated for the AM and PM peak period,
respectively.
Considering the growth rates estimated from
the two sources (AADT data and MWCOG
model outputs), an annual traffic growth rate
of 0.45% is assumed for both AM and PM
peak periods along H/I Streets.
Future Bus Ridership Growth and
Dwell Time
The 2010 Metrobus Fleet Management Plan
estimates that Metrobus ridership between
2009 and 2020 will grow at a steady 1.4
percent annual rate. The study also
anticipates that a similar growth trend up to
2030 for the regional transit market consisting
of Metrobus and local services. Actual
ridership data from Metrobus indicates an
average of 4.2% annual growth rate from
2005 to 2012 of major bus routes serving the
H Street and I Street corridors. Considering
the growth rates from the Plan and historical
data, the study team agrees that 2% annual
growth rate which leads to a total growth of
36% from 2012 to 2030 is a fair assumption
to project the future ridership growth along H
Street and I Street. The ridership growth will
be reflected by longer dwell time at each bus
stop for each bus route.
The ridership growth rate of 2% was also
applied to other bus services along the
corridors including PRTC Omni Ride, Loudoun
County, and DC Circulator. Both PRTC and
Loudoun County buses provide one-way
commuter services, which is more of a
schedule-based operation. The bus dwell time
is assumed to be the same as the existing
condition considering the same bus operation
schedule in 2030.
Table 3: Annual Traffic Growth
Road Segment Annual Average
Daily Traffic (AADT),
2002
Annual Average
Daily Traffic
(AADT), 2009
Annual
Growth
Rate
I Street: Between 13th and 14th Street 8.9 9.3 0.63%
I Street: Between 17th Street and
Connecticut Avenue
16.0 16.4 0.35%
I Street: Between 14th and 15th Street 15.9 15.9 0.0%
H Street: Between Vermont Avenue and
16th Street
20.0 20.5 0.35%
H Street: Between 16th and 17th Street 16.0 15.7 -0.27%
H Street: Between 17th Street and
Connecticut Avenue
15.0 15.4 0.38%
Note: The volumes shown are expressed in thousands, rounded to the nearest 100.
H/I Streets Bus Improvements Technical Report
P a g e | 18 Final
Future Bus Operation Frequency
The current bus routes which are currently near
their maximum load will likely require more
service in the future years. In the 2030 model,
additional buses were added to
accommodate ridership growth on the
following routes: 37, 39, 42, 43, 52, 54, 80,
G8, N2, N4, S2, S4, X2, and X9.
Modification of Bus Operations
In coordination with WMATA bus planners,
existing bus routes were evaluated and
modified to take advantage of the proposed
bus-only lanes under each alternative.
Rerouting some WMATA bus routes to the
proposed bus-only lanes along H/I Streets
may improve bus operations thereby
improving reliability while also fully utilizing
the infrastructure investment. All commuter bus
routes remained unchanged in all alternatives.
Table 4 shows a summary of the bus route
modifications by build alternative. See
Appendix E for detailed route by route maps
for bus route modifications.
Individual Model Assumptions
The 2012 Optimized No-Build model is an
improvement on the Existing Conditions model
which creates the optimal existing traffic
condition by implementing signal timing
optimization and turning movement
restrictions. Due to the congestion along I
Street in the existing condition, the signal
timings at the following intersections are
optimized to provide better traffic operation:
13th Street/I Street (AM and PM)
14th Street/I Street (PM)
17th Street/I Street (PM)
As the intersection of 17th Street (W) and I
Street is the major bottleneck along the I
Street corridor due to the heavy pedestrian
activities, the right-turning movements at 17th
Street (W) and 17th Street (E) were restricted
during the AM and PM peak hours. The
existing right-turning vehicles at these
intersections will use 15th Street (W), 16th
Street, 18th Street, 19th Street or 20th Street
instead to reach their destinations.
The 2012 Build Alternative 1 model uses the
existing curb travel lane as a dedicated bus-
only lane shared with right-turning vehicles on
both H Street and I Street. This alternative
could reduce the friction between buses and
autos while on other hand reducing the
roadway capacity for automobile traffic. To
generate ideal traffic condition in this
alternative, same signal timing optimization
plans and right-turn restrictions as in the 2012
Optimized No-Build model were tested and
modeled in the 2012 Build Alternative 1
model.
The 2012 Build Alternative 2 model assumes
the north-side curb lane on H Street to be
used as a contra-flow bus-only lane. The
majority of WMATA bus routes currently
running on I Street will be rerouted to H
Street. This alternative will relieve the current
traffic congestion along I Street while
potentially worsening the traffic along H
Street. Signal timing optimization/adjustment
was conducted at the following intersections to
accommodate bus-only lane operation in this
alternative:
14th Street/I Street (PM)
13th Street/I Street (PM)
13th Street/H Street/New York Avenue
(AM and PM)
19th Street/H Street/Pennsylvania
Avenue (AM and PM)
Exclusive transit signal phase was provided at
the intersections of 13th Street/H Street/New
York Avenue and 19th Street/H
Street/Pennsylvania Avenue to allow buses to
enter and exit the contra-flow bus-only lane.
H Street becomes a two-way roadway in this
alternative. The eastbound left-turning
vehicles on H Street will yield to the
westbound buses. No additional left-turn
traffic phase will be provided.

H/I Streets Bus Improvements Technical Report
Final P a g e | 19
Table 4: Bus Route Modifications Summary
Route Current Routing Alternative 1 Alternative 2 Alternative 3
11Y H St EB from 18th St to 15th St; I St WB
from 14th St to 19th St
Extend EB alignment Reroute to EB and WB on H St, extend
entire length of bus-only lane
Reroute to EB to I St and WB on H St
3Y/16Y K St EB from 18th St to 14th St; K St WB
from 15th St to 19th St
Remain As Is AM: Remain As Is
PM: Reroute WB to H St Bus-only lane
Remain As Is
32, 36, 37,
39
H St EB from Penn Ave to 15th St; I St
WB from 15th St to Penn Ave
Extend EB and WB alignment east
to 13th St
Reroute to EB and WB on H St, extend
entire length of bus-only lane
Reroute to EB to I St and WB on H St,
extend entire length of bus-only lane
38B I St WB from 17th St to Penn Ave Remain As Is Remain As Is Remain As Is
42, 43 H St EB from 17th St to 9th St; I St WB
from 11th St to 17th St
Remain As Is Reroute to EB and WB on H St Reroute to EB to I St and WB on H St
53 I St WB from 13th St to 14th St Reroute WB alignment to layover
at McPherson Square
Extend route south; discontinue Franklin
Park turnaround
Extend route south; discontinue Franklin
Park turnaround
80, 80/ 80: K St EB and WB from 19th/18th St
to 13th St
80/: I St WB from 13th St to 15th St
80: Remain As Is
80/: Remain As IS
80: Remain As Is
80/: Reroute WB alignment to H St
80: Reroute from K St to EB to I St and
WB on H St, extend entire length of bus-
only lane
80/: Remain As Is
D3 K St EB and WB from 19th/18th St to
13th St
Remain As Is Remain As Is Remain As Is
D4 I St WB from 13th St to 14th St Extend WB alignment to layover
at McPherson Square
Remain As Is Remain As Is
D5 I St WB from 17th St E to 17th St W Extend WB alignment Remain As Is Remain As Is
D6, D6/ D6: K St EB and WB from 19th to 13th St
D6/: I St WB from 17th St E to 17th St
W
D6: Remain As Is
D6/: Remain As Is
D6: Remain As Is
D6/W: Remain As Is
D6/E: Reroute to EB and WB on H St
D6: Reroute from K St to EB to I St and
WB on H St, extend entire length of bus-
only lane
D6/W: Remain As Is
D6/E: Remain As Is
G8 H St EB from Conn Ave to 13th St; I St
WB from 13th St to 17th St
Discontinue Farragut Square
turnaround
Reroute to EB and WB on H St Reroute to EB to I St and WB on H St
L2, N2, N4,
N6
H St EB from 17th St E to 18th St Reroute south to Penn Ave,
discontinue Farragut Square
turnaround
Reroute south to Penn Ave, discontinue
Farragut Square turnaround
L2: Reroute south to Penn Ave,
discontinue Farragut Square turnaround
N2, N4, N6: Remain As Is
P17, P19,
W13
H St EB from 17th St to 13th St; I St WB
from 11th St to 17th St
Extend WB alignment to 19th St Reroute to EB and WB on H St, extend
entire length of bus-only lane
Reroute to EB to I St and WB on H St,
extend route via 11th St
S2, S4 H St EB from 16th St to 11th St; I St WB
from 11th St to 16th St
Remain As Is Reroute to EB and WB on H St Remain As Is
S4/, S9 H St EB from 13th St to 16th St Remain As Is Remain As Is Remain As Is
X2 H St EB from 16th St to 13th St; I St WB
from 13th St to 16th St
Extend EB and WB alignment to
19th St
Reroute to EB and WB on H St, extend
entire length of bus-only lane
Reroute to EB to I St and WB on H St,
extend entire length of bus-only lane

H/I Streets Bus Improvements Technical Report
P a g e | 20 Final
The 2012 Build Alternative 3 model assumes
contra-flow bus-only lanes on both H Street
and I Street. This alternative reduces the
friction between buses and automobiles while
reducing the roadway capacity for auto
traffic on both corridors. For I Street which
currently operates under congested condition,
the capacity reduction creates great traffic
impacts on the traffic operation. Signal timing
optimization/adjustment was conducted at the
following intersections to accommodate bus-
only lane operation in this alternative:
13th Street/I Street (PM)
14th Street/I Street (PM)
17th Street (W)/I Street (PM)
13th Street/H Street/New York
Avenue (AM and PM)
19th Street/H Street/Pennsylvania
Avenue (AM and PM)
21st Street/I Street/Pennsylvania
Avenue (AM and PM)
Exclusive transit signal phase was provided at
the intersections of 13th Street/ H Street/
New York Avenue, 19th Street/ H Street/
Pennsylvania Avenue and 21st Street/ I
Street/ Pennsylvania Avenue to allow buses to
enter and exit contra-flow bus-only lanes.
Based on the modeling, the reduction of
roadway capacity for auto traffic on I Street
will create major traffic impacts and
potentially fail the corridor operation. In
order to minimize this impact, the study team
adjusted signal timing at the intersection of
17th Street and I Street by minimizing the
pedestrian walk and flash-don’t-walk (FDW)
time across the north and south legs of the
intersection during the PM peak hours.
However, it should be noted that this
adjustment will cause severe delays as well as
crowding for pedestrians given the high
pedestrian activities at this intersection.
Westbound right-turning movement was also
restricted at this intersection during the PM
peak hours to facilitate the traffic operation.
The 2030 Optimized No-Build model shows
the optimal traffic condition without
implementing the bus-only lanes in 2030.
Traffic volumes, bus ridership, frequency and
routes were adjusted to reflect 2030
assumptions discussed above. Signal timing
was optimized at several intersections where
the existing signal operation was not able to
provide adequate capability to process future
traffic growth as well as ridership growth
along H Street and I Street. The optimized
intersections are listed as follows:
13th Street/I Street (AM and PM)
14th Street/I Street (AM and PM)
15th Street (E)/I Street (AM)
17th Street (W)/I Street (AM and PM)
17th Street (E)/I Street (AM)
15th Street/H Street (PM)
19th Street/H Street/Pennsylvania
Avenue (AM and PM)
The 2030 Build Alternative 1 model assumes
the same bus-only lane operation as in the
2012 Build Alternative 1 model. Signal timing
was optimized for the following intersections:
13th Street/I Street (AM/PM)
14th Street/I Street (PM)
17th Street (W)/I Street (AM/PM)
17th Street (E)/I Street (AM)
18th Street/I Street (AM)
15th Street/H Street (PM)
19th Street/H Street/Pennsylvania
Avenue (AM and PM)
Right-turning movements were restricted at
17th Street (W) and 17th Street (E) on I Street
to improve the traffic operation with the bus-
only lane.
The 2030 Build Alternative 2 model assumes
the same bus-only lane operation as in the
2012 Build Alternative 2 model. Signal timing
was optimized for the following intersections:
13th Street/I Street (AM/PM)
14th Street/I Street (PM)
17th Street (W)/I Street (PM)
15th Street/H Street (PM)
13th Street/H Street/New York Avenue
(AM and PM)
19th Street/H Street/Pennsylvania
Avenue (AM and PM)
Exclusive transit signal phase was provided at
the intersections of 13th Street/ H Street/
New York Avenue and 19th Street/ H Street/
H/I Streets Bus Improvements Technical Report
Final P a g e | 21
Pennsylvania Avenue to allow buses to enter
and exit the contra-flow bus-only lane on I
Street.
The 2030 Build Alternative 3 model assumes
the same bus-only lane operation as in the
2012 Build Alternative 3 model. Signal timing
was optimized for the following intersections:
13th Street/I Street (AM/PM)
14th Street/I Street (PM)
15th Street (E)/I Street (AM)
17th Street (W)/I Street (PM)
15th Street/H Street (PM)
13th Street/H Street/New York Avenue
(AM and PM)
19th Street/H Street/Pennsylvania
Avenue (AM and PM)
21st Street/I Street/Pennsylvania Avenue
(AM and PM)
Exclusive transit signal phase was provided at
the intersections of 13th Street/ H Street/
New York Avenue, 19th Street/ H Street/
Pennsylvania Avenue and 21st Street/ I
Street/ Pennsylvania Avenue to allow buses to
enter and exit contra-flow bus-only lanes.
Simulation Results
The following section provides the results of
the alternatives simulation. The alternatives
were evaluated based on the following
quantitative performance metrics: Bus Travel
Time Changes; Auto Travel Time Changes;
Person Delay Changes; Bus Reliability; and
Intersection Level of Service.
In order to conduct an apple-to-apple
comparison of bus travel time among three
build alternatives which shows different bus
alignments/operations and scopes of the
network, bus travel time between 13th Street
and 19th Street in the westbound direction and
17th Street to 13th Street in the eastbound
direction was collected regardless of the
roadways where the buses are running. The
same segment was selected to conduct the
auto travel time comparison. Eastbound (EB)
and westbound (WB) directions mentioned
below refer to the travel directions of buses
and autos either on H Street or I Street.
The 2012 Existing serves as the basis for the
2012 alternative comparisons and the 2030
Optimized No-Build serves as the basis for
2030 alternative comparisons. Build
Alternative 3 assumes bus lane on I Street
starts from 21st Street to 13th Street. To
understand the traffic impacts at the
intersections of 21st Street and I Street, and
20th Street and I Street, which are two
intersections not included in the 2012 existing
or 2030 No Build models, extended models
(so called “Full Network” models) were
developed to include these two intersections
as part of the study area. The Full Network
models are used as base models to be
compared with Build Alternative 3. The
existing and No Build models, which are the
Non Full Network, are compared with Build
Alternatives 1 and 2.
Due to the stochastic nature of VISSIM, the bus
and auto travel time results from Non Full
Network models and Full Network models are
slightly different. The Full Network includes a
larger study area and more study
intersections as compared to the Non Full
Network. The study team ran both models
multiple times to reduce the impacts from
statistical variation. Nonetheless, a slight
variation between the two models remained in
that the Non Full Network was slightly more
congested than the Full Network model.
Therefore, vehicular travel times are shorter
with the Full Network.
To understand the travel time changes from no
build to build alternatives, travel times in Build
Alternatives 1 and 2 are compared to Non
Full Network models while Build Alternative 3
is compared to Full Network models. Due to
the difference of travel time results between
the Non Full Network and Full Network
models, we predict that the travel time savings
of Build Alternative 3 may be somewhat
undervalued as compared to the travel time
savings in Build Alternatives 1 and 2. A factor
could be applied to the Alternative 3 results;
however, one was not used in this study.
Other qualitative information on
pedestrian/bicycle safety, enforcement, and
curbside impacts used to evaluate the
alternatives will be discussed in later sections.
Detailed simulation results can be seen in
Appendix F.

H/I Streets Bus Improvements Technical Report
P a g e | 22 Final
Bus Travel Time Changes (AM/PM)
Bus travel-time changes were documented for
eastbound and westbound buses for each
alternative. Changes were determined by
comparing existing bus travel times in mixed
traffic to bus travel times in bus-only lanes for
each alternative. Note that Alternative 2 does
not include an eastbound bus-only lane and
that these results reflect buses traveling in
mixed traffic for the eastbound direction. See
Table 5 and Figure 8 for the bus travel-time
changes for both the AM and PM peak-
periods for 2012 and 2030.
As seen in the results table, all three bus-only
lane alternatives outperform current mixed-
traffic operations in the westbound direction.
The bus travel time savings in Optimized No-
Build are attributed to signal timing
optimization and right-turn restrictions at the
17th Street intersections. The dedicated bus-
only lane operation in three Build alternatives
improves travel time. The eastbound direction
generally experiences marginal loss or
savings (+/- 30 seconds), except for
Alternative 3 which experiences
approximately 35% time savings in the PM
period in 2012 and in 2030 due to the
contra-flow bus-only lane operation.
However, the concurrent flow bus-only lane
along H Street (in Alternative 1) does not
show much savings for bus travel time.
Compared to Optimized No-Build in 2012,
bus-only lane Alternatives 2 and 3 show
substantial travel time savings in the
westbound direction. In 2012, the more bus
travel time savings are shown in the PM on the
westbound than in the AM in Optimized No-
Build models. This is because the right-turn
restriction at 17th Street (W) and 17th Street
(E) has more benefits in the PM model than in
the AM model due to higher right-turn volumes
in the AM.
As explained earlier as to the difference of
travel time results, Alternative 3 –2030 PM
results may be somewhat underestimating bus
travel time changes in the westbound
direction. We predict that the travel time
changes would be closer to the results seen in
Alternative 2 (-4.5 seen in Alternative 3 vs. -
7.5 seen in Alternative 2), as the model
simulates the same westbound contra-flow
bus-only lane on H Street.
Table 5: Bus Travel-Time Changes
2012 Bus Travel Time Changes by Direction
WB EB
AM Time (Min) % Change Time (Min) % Change
Optimized No-Build -1.0 - 6% > - 0.5 - 1%
Alternative 1 -5.0 - 39% < 0.5 6%
Alternative 2 -7.5 - 57% < 0.5 5%
Alternative 3 -7.0 - 56% 0.5 11%
PM
Optimized No-Build -4.5 -33% < 0.5 3%
Alternative 1 -4.5 -32% 0.5 10%
Alternative 2 -6.0 -44% < 0.5 1%
Alternative 3 -4.5 -37% -2.5 - 36%
2030 Bus Travel Time Changes by Direction
WB EB
AM Time (Min) % Change Time (Min) % Change
Alternative 1 -11.5 -60% 0.5 10%
Alternative 2 -13.5 -70% 0.5 11%
Alternative 3 -14.0 -72% 0.5 13%
PM
Alternative 1 -4.0 -26% < 0.5 3%
Alternative 2 -7.5 -50% < 0.5 2%
Alternative 3 -4.5 -36% -3.0 -36%
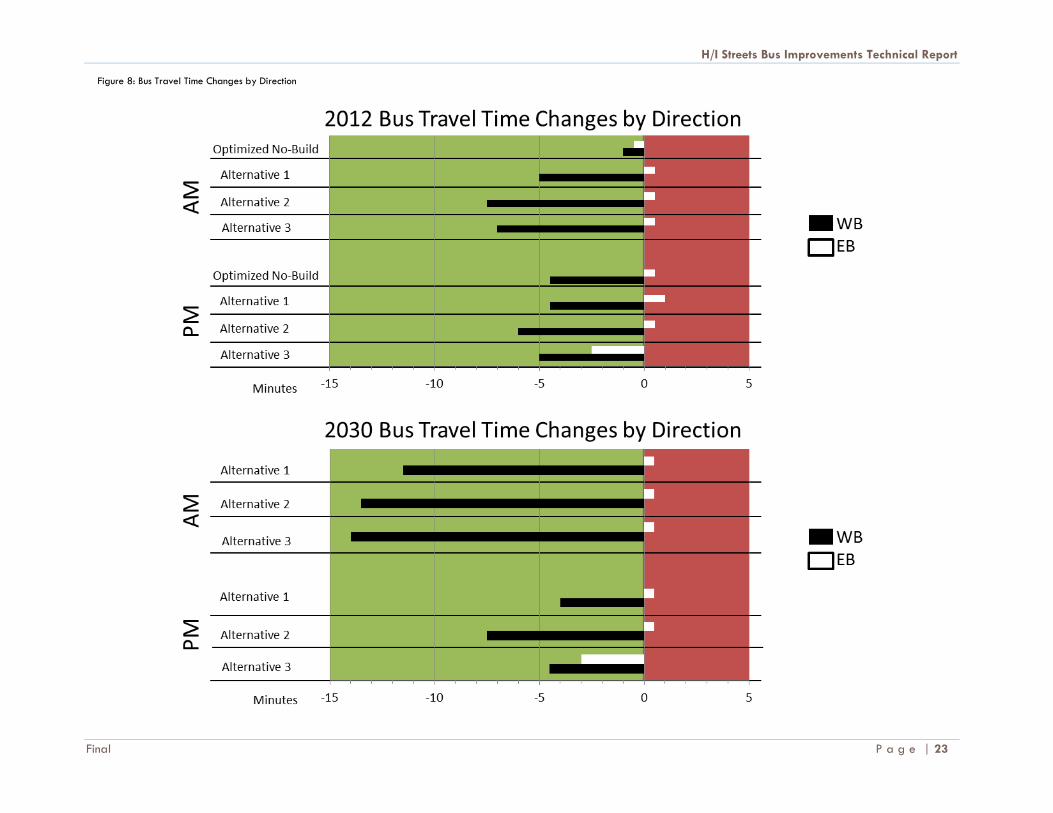
H/I Streets Bus Improvements Technical Report
Final P a g e | 23
Figure 8: Bus Travel Time Changes by Direction

H/I Streets Bus Improvements Technical Report
P a g e | 24 Final
Auto Travel-Time Changes (AM/PM)
Auto travel-time changes were also
documented for eastbound and westbound
travel for each alternative. Changes were
determined by comparing existing mixed-
traffic travel times to the mixed-traffic travel
times in the three alternatives. Note that in
Alternatives 2 and 3, the mixed-traffic travel
times also include buses that were not re-
routed into the bus-only lanes.
Generally, auto travel time savings are due to
(1) the separation of bus operations with
automobile traffic, and (2) signal timing
optimizations at sever major intersections such
as 17th Street and 13th Street. As seen in
Table 6 and Figure 9, auto travel times
experience marginal negative or positive
changes (+/- 30 seconds) due to the addition
of a bus-only lane in all three alternatives in
the AM peak-period. However, auto travel
times in the PM experience significant travel
time savings in the westbound direction.
Eastbound travel times experience marginal
positive and negative changes.
In 2012, the Optimized No-Build provides the
most auto time travel savings in the westbound
direction in the PM peak, which is attributed to
signal timing optimization and right-turn
restrictions at 17th Street (W) and 17th Street
(E) along I Street. Alternative 3 experiences
the least travel time savings as compared to
other alternatives due to the reduced lane
capacity along I Street; this offsets the
benefits from signal timing optimization and
right-turn restriction, and results in more traffic
congestion. Alternative 1 also shows some
traffic impacts from lane reduction; however
the impacts are not as significant as
Alternative 3 as in Alternative 1 right-turning
vehicles are allowed to share the bus-only
lane. Alternative 2 shows comparable travel
time savings as Alternative 1 even though
there is no lane reduction in Alternative 2.
However, Alternative 2 does not assume right-
turn restrictions at any intersection which
would slightly offset the travel time savings.
Westbound auto travel time does not gain
much benefit in the AM as compared to PM.
Table 6: Auto Travel Time Changes
2012 Auto Travel Time Changes by Direction
WB EB
AM Time (Min) % Change Time (Min) % Change
Optimized No-Build < 0.5 0% > -0.5 -1%
Alternative 1 > -0.5 -5% < 0.5 4%
Alternative 2 > -0.5 -10% < 0.5 14%
Alternative 3 0.5 16% < 0.5 1%
PM
Optimized No-Build -3.0 -45% < 0.5 1%
Alternative 1 -2.5 -35% < 0.5 2%
Alternative 2 -2.5 -38% 0.5 15%
Alternative 3 -1.0 -21% > -0.5 -1%
2030 Auto Travel Time Changes by Direction
WB EB
AM Time (Min) % Change Time (Min) % Change
Alternative 1 -1.5 -28% < 0.5 6%
Alternative 2 -1.5 -31% 0.5 28%
Alternative 3 0.5 12% 1.0 42%
PM
Alternative 1 -1.5 -25% < 0.5 1%
Alternative 2 -2.5 -40% 0.5 19%
Alternative 3 2.0 44% < 0.5 13%
H/I Streets Bus Improvements Technical Report
Final P a g e | 25
This is because AM has higher right-turn
volumes on I Street than in the PM. When
right-turn vehicles at 17th Street (W) and 17th
Street (E) reroute to other intersections,
vehicles experience more delays at those
intersections. This can also be seen in
Alternative 3 where there is a right turn
restriction at 17th Street (W).
2030 results follow the same pattern as
2012, with moderate automobile travel time
savings in the westbound direction and
marginal gains in travel time in the eastbound
direction, with the exception of Alternative 3.
Alternative 3 shows the most delay in travel
time in the westbound direction in both the AM
and PM peak-periods with 0.5 and 2.0
minutes respectively. This delay in travel time
in the westbound direction is caused by the
reduced lane capacity for automobiles and
the expected growth in automobile volumes
by 2030 on I Street. Alternative 2 shows the
highest travel time savings in the westbound
direction in 2030.

H/I Streets Bus Improvements Technical Report
P a g e | 26 Final
Figure 9: Auto Travel Time Changes by Direction

H/I Streets Bus Improvements Technical Report
Final P a g e | 27
Person Delay Changes (AM/PM)
Person delay (person hours/hour) measures
time required to move individuals, rather than
time required to move vehicles. Measuring
person delay rather than vehicle delay is an
analysis approach that captures the overall
impact of transportation improvements.
For this study, the changes in travel time were
applied to the person throughput for bus-only
lanes and mixed traffic for the three
alternatives for 2012 and 2030 conditions.
Bus person throughput was determined using
existing average loads per trip by roadway
segment multiplied by the number of trips per
segment for each alternative. Existing
average loads per trip by segment were
determined by dividing the total person
throughput by the total number of existing bus
trips for each roadway segment.
Bus person throughput for each alternative
included both buses using the bus-only lanes
as well as buses traveling in mixed traffic.
Traffic volumes were used to determine the
mixed traffic person throughput. See
Appendix F for the detailed calculation
worksheets for person delay changes
including person throughput tables.
The following assumptions were used:
For 2012, all bus trips carry the existing
average load for each of the segments in
each alternative. 2030 average loads
were determined using the 36% ridership
growth rate as previously noted;
Table 7: Changes in Person Delay
2012 Change in Person Hours/Hour
Westbound Eastbound
Peak-period Mixed Traffic Bus-only
lane
Mixed Traffic Bus-only
lane
Opt. No-Build AM 0 -4 0 0
PM -60 -43 0 2
Alternative 1 AM -4 -50 2 1
PM -47 -53 1 6
Alternative 2 AM -9 -65 7 1
PM -61 -42 10 1
Alternative 3
AM 15 -56 0 2
PM -29 -30 0 -21
2030 Change in Person Hours/Hour
Westbound Eastbound
Peak-period Mixed Traffic Bus-only
lane
Mixed Traffic Bus-only
lane
Alternative 1 AM -34 -166 3 4
PM -34 -64 1 3
Alternative 2 AM -43 -159 16 5
PM -68 -97 14 2
Alternative 3
AM 16 -145 27 5
PM 56 -46 11 -37
Net Change in Person Hours/Hour
2012 2030
Opt. No-Build -106 --
Alternative 1 -143 -286
Alternative 2 -158 -330
Alternative 3 -119 -112
H/I Streets Bus Improvements Technical Report
P a g e | 28 Final
Commuter bus trips were included in
Alternative 1 bus-only lane calculation,
but were assigned to mixed traffic for
Alternatives 2 and 3; and
Autos in mixed traffic carried 1.2
persons/auto.
As seen in Table 7, all three alternatives
provide significant westbound person hour
savings for bus-only lanes during both the AM
and PM peak-periods in 2012. In the PM,
mixed traffic experiences improved
westbound travel time as the conflicts between
buses and automobiles and right-turning
vehicles and pedestrians are reduced.
Increases to bus-only lane and mixed traffic
person delay are minimal in the eastbound
direction.
In 2030, all the alternatives continue to
experience westbound person hour savings for
bus-only lanes. Increases are especially
evident in the AM peak-period as the bus-
only lanes experience over three times the
reduction of person hours from 2012.
Alternatives 1 and 2 also experience person
hour savings for mixed traffic in the
westbound direction. Alternative 3, however,
experiences increased person hour delay as a
result by the increased automobile volumes
and decreased lane capacity on I Street.
Eastbound travel delay also continues to
increase from 2012. Alternative 3 is the only
alternative which provides eastbound person
hour savings for bus-only lanes.
All three alternatives provide net person
delay improvements. In 2012, Alternative 2
provides the most improvement in net person
delay, followed by Alternatives 1 and 3,
respectively. However, in 2030, Alternative 3
does not experience any additional person
delay improvements whereas Alternatives 1
and 2 experience over two times more
reduction in net person delay. This is due to a
number of factors including the difference in
the VISSIM simulation (as discussed previously
on Page 20) and the increased delay
experienced by automobiles (increased auto
travel time) offsetting the person delay
improvements experienced by buses. The
combination of increased travel time savings
and increased person throughput for both
mixed traffic and in the bus-only lanes
contribute to the dramatic increase in net
person delay for Alternatives 1 and 2.
H/I Streets Bus Improvements Technical Report
Final P a g e | 29
Bus Reliability
Improving bus reliability is one of the main
goals of any bus priority treatment. Improved
bus reliability, meaning maintaining the bus on
schedule with uniform headways and
consistent travel times, has positive effects for
both bus passengers and transit operators. Bus
passengers experience enhanced service
quality and punctuality. The increased
passenger satisfaction may lead to increased
ridership and farebox revenues for the
agency. Improved bus reliability also provides
bus operators efficiencies in vehicle usage
time and reduced operating costs.
The bus travel time reliability is reflected by
travel time standard deviation. A low
standard deviation indicates the travel times
tend to be close to the average; a high
standard deviation indicates the travel times
are more spread out over a large range of
values. As the bus travel time standard
deviation becomes smaller, the more reliable
and constant the bus operations. The results
show that all three alternatives provide
smaller bus travel time standard deviation
than in the mixed traffic, which means
implementing the bus-only lanes will help
improve the bus travel time reliability and
runtime consistency. Alternative 3 provides
the greatest reduction of travel time standard
deviation.
The box plot is a straight-forward way of
showing the variation of data set. It displays
the range and distribution of data based on
five number summary – minimum, first quartile,
median, third quartile and maximum. The
spacing between the different parts of the
box helps indicate the degree of dispersion
(spread) and skewing in the data. The smaller
the space is the more converged the data is.
The box plots in Figure 10 take Metrobus
Route 32/36 as an example. The results
shown here use the same travel time segments
as the previous travel time results: WB from
13th Street to 19th Street and EB from 17th
Street to 13th Street. Table 8 provides a
summary of the worst, average and best
travel time scenario under each alternative.
The results for the westbound direction
indicates that the bus runtime in the three
build alternatives are more converged than in
the existing condition, indicating less
variability and more reliability of bus travel
time. Under the exiting conditions, Route
32/36 could take up to 15 minutes to travel
the corridor in the AM and 20 minutes in the
PM in the westbound direction. Under all three
build scenarios, the maximum time to travel
the westbound corridor decreases and the
variability becomes more constant in both the
AM and PM peak periods.
In the eastbound direction, the variability of
bus travel time shows marginal improvement
or similar runtime reliability in all build
alternatives.
The Benefit Cost Analysis (BCA), in a later
section, describes the benefits associated with
improved reliability for both the transit user
and transit operator.

H/I Streets Bus Improvements Technical Report
P a g e | 30 Final
Figure 10: Bus Reliability Box Plots (Route 32/36) (2012)
Table 8: Bus Reliability Summary (Route 32/36) (2012)
AM PM
Travel
Time
(Minutes)
Best
Travel
Time
Average
Travel
Time
Worst
Travel
Time
Best
Travel
Time
Average
Travel
Time
Worst
Travel
Time
Westbound
Existing 4.6 9.7 15.0 3.0 8.9 20.4
Opt. No-Build 3.1 5.8 9.9 2.8 6.5 12.8
Alternative 1 3.3 6.1 9.1 3.5 6.2 10.2
Alternative 2 3.9 4.3 5.7 3.2 5.9 8.4
Alternative 3 3.9 4.3 7.2 3.1 6.1 9.8
Eastbound
Existing 1.8 3.6 6.4 2.7 6.3 9.6
Opt. No-Build 1.8 3.7 6.5 2.9 6.6 11.0
Alternative 1 1.6 3.5 5.3 3.3 7.0 10.9
Alternative 2 1.8 3.7 6.6 2.9 5.9 9.8
Alternative 3 2.4 4.1 5.9 2.5 4.2 7.3

H/I Streets Bus Improvements Technical Report
Final P a g e | 31
Intersection LOS
Intersection Level of Service (LOS) analysis
provides a measure of delay and service
condition for all approaches to the
intersection. Analysis of intersection LOS
informs whether the congested intersections on
H/I Streets will likely improve or worsen with
the provision of bus-only lanes, signal
optimizations and right-turn restrictions at key
locations.
The Highway Capacity Manual 2010 edition
uses LOS as a qualitative measure to describe
the operating conditions at signalized and
unsignalized intersections based on control
delay per vehicle (seconds). The LOS range of
A through F represents driving conditions from
best to worst, respectively. LOS A represents
free-flow conditions with no congestion, and
LOS F represents severe congestion, significant
delays, queues, and stop-go conditions. For
the purpose of this study, LOS D or better was
assumed to be acceptable at intersections for
urban conditions. Table 9 presents the LOS
thresholds for signalized intersections per the
HCM 2010.
The LOS analysis examined the AM and PM
peak hour LOS conditions at the corridor
intersections for the existing year 2012
conditions, 2012 Optimized conditions, 2012
proposed build conditions, 2030 no-build
conditions, and the 2030 proposed build
conditions.
Under the existing conditions analysis (see
Appendix A), three intersections in the study
area were determined to be failing in either
the AM or PM periods: I Street and 17th Street
(E); I Street and 13th Street; and H Street and
17th Street.
As seen in Table 10, the analysis showed that
in 2012 and in 2030, all three bus-only lane
alternatives preserve the same LOS or
provide LOS improvements at existing failing
intersections on H/I Streets.
At I Street and 17th Street, high delays and
long queues are observed for the traffic
traveling westbound in the PM peak period in
the existing condition. Under Alternative 1
and Alternative 2, these high delays and long
queues are still present in the PM for mixed
traffic; however, due to the bus-only lanes,
bus travel does not experience these delays
at this intersection.
Table 10: Failing Intersection Analysis
Scenarios I and 17 (E) I and 13 H and 17
2012 Existing D/F E/E E/C
2012 Optimized No-Build B/D D/D E/C
2012 Alternative 1 B/F D/D E/C
2012 Alternative 2 C/F D/D D/C
2012 Alternative 3 C/D D/D E/C
2030 Optimized No-Build F/F F/E E/C
2030 Alternative 1 C/F F/E E/C
2030 Alternative 2 C/E F/E E/C
2030 Alternative 3 E/F F/E E/C
Table 9: LOS Thresholds for Signalized Intersections
Control Delay at Signalized Intersections
Delay (sec/veh) LOS
<= 10 A
> 10 – 20 B
> 20 – 35 C
> 35 – 55 D
> 55 – 80 E
> 80 F
Source: HCM 2010

H/I Streets Bus Improvements Technical Report
P a g e | 32 Final
Sensitivity Analysis on Right-Turn Restriction Compliance
Right-turn restrictions were proposed and
tested in westbound I Street at the
intersections of 17th Street (W) and 17th
Street (E) in both 2012 Optimized No-Build
and 2012 Build Alternative 1. To further
understand if the right-turn restrictions at these
intersections would be effective in high traffic
corridors in DC and if the corridor traffic
would be sensitive to the violation of the
restriction, the team developed a sensitivity
analysis for the compliance of right-turn
restriction. The analysis could also help agents
identify the enforcement efforts needed in the
field. Right-turn restriction was also proposed
at 17th Street (W) and I Street in Build
Alternative 3 during the PM peak period only.
Due to the less enforcement efforts needed in
this alternative, sensitivity analysis was not
conduced for this alternative.
The study team tested 100%, 50% and 0%
compliance rate of right-turn restrictions at the
intersection of 17th Street (W) and 17th
Street (E) on I Street for the PM models in both
2012 Optimized No-Build and 2012 Build
Alternative 1 scenarios. 100% compliance
refers to the condition where all vehicles obey
the right-turn restriction rules at both sides of
Farragut Square and reroute to other
roadways such as 16th Street, 18th Street,
19th Street and 20th Street. 0% compliance
refers to the condition where none of drivers
obey the turning restriction at 17th Streets.
50% compliance means half of the drivers
obey the rules. Table 11 shows the number of
violators per signal cycle in the PM peak
corresponding to each compliance rate. The
number of violators with 0% compliance also
indicates the total number of right-turning
vehicles per cycle at two intersections in 2012.
Figure 11 presents the bus and auto travel
time change in 2012 Optimized No-Build and
Build Alternative 1 scenarios with three
compliance rates as compared to the existing
travel times. Negative numbers mean the
travel time savings while the positive means
the travel time loss.
The figure indicates that due to the signal
timing optimization and right-turn restriction,
buses gain approximately 1.5 minutes to 2.0
minutes more travel time savings than auto
drivers in both No-Build and Build Alternative
1 conditions with all compliance rates tested.
The figure also helps differentiate traffic
improvements from signal timing optimization
and right-turn restriction in No-Build and Build
Alternative 1. The auto and bus travel time
savings of approximately 1.5 minutes and 3.5
minutes in the westbound direction are
attributed to signal timing optimization in
2012 Optimized No-Build (see Optimized No
Build 0% compliance; i.e. no turn restrictions),
while the additional auto and bus travel time
savings of 1.5 minutes and 1.0 minutes,
respectively, are attributed to turning
restriction (see the difference between
Optimized No Build 0% and 100%
compliance).
Auto and bus gains similar travel time savings
with 50% compliance and 100% compliance
while experience 1.5 minutes and 1.0 minutes
of travel time delay, respectively, with 0%
compliance as compared to 100%
compliance. The results indicate that the traffic
condition on I Street is not very sensitive to the
compliance rate of right-turn restriction at
17th Streets.
Moderate enforcement efforts may be
sufficient in order to limit right-turn violations
without significant negative impacts to the
operations of the bus-only lane in Alternative
1. However this level of enforcement does not
actively monitor the behavior of automobiles
violating the restrictions of driving and
parking in the bus-only lanes, including
making through movements in the bus-only
lanes (where right-turns are allowed).
Alternative 1 is more dependent on
compliance of these restrictions than the right-
turn restrictions. Alternatives 2 and 3, due to
the contra-flow design, provide a level of
self-enforcement that limit these violations.
Table 11: Number of Violators per Signal Cycle in the PM
Intersection 50% 0%
17th St W 2-3 4-5
17th St E 1-2 3-4
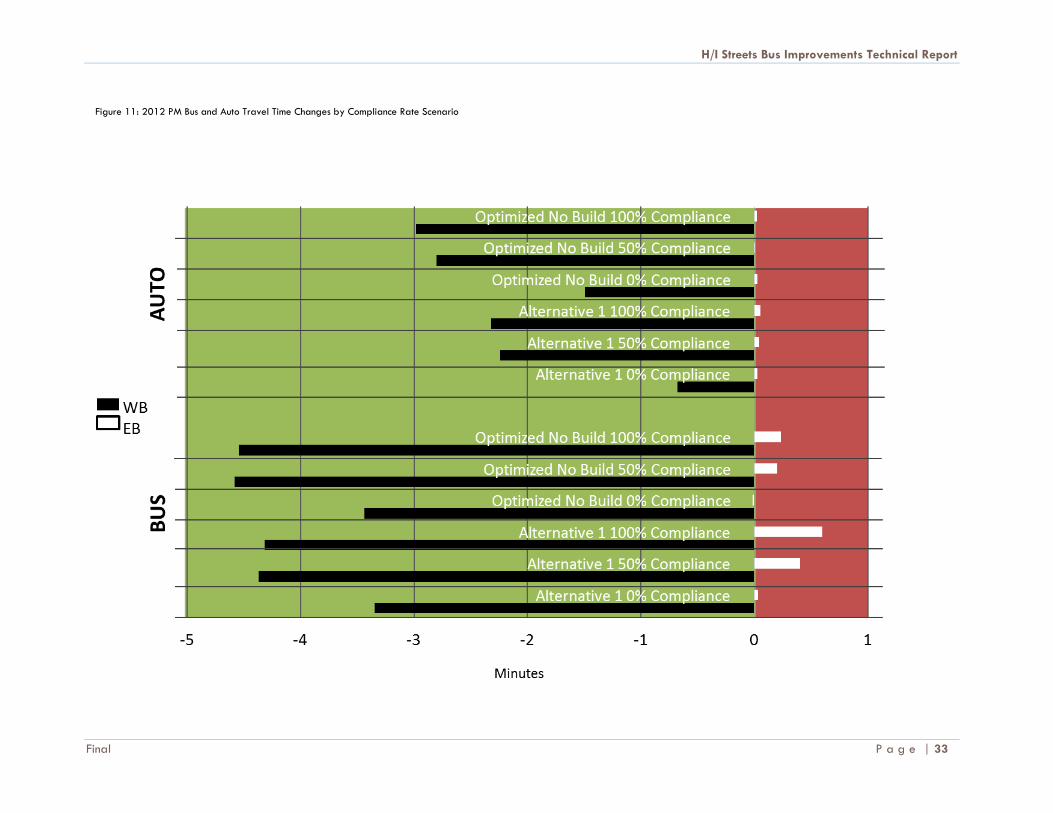
H/I Streets Bus Improvements Technical Report
Final P a g e | 33
Figure 11: 2012 PM Bus and Auto Travel Time Changes by Compliance Rate Scenario
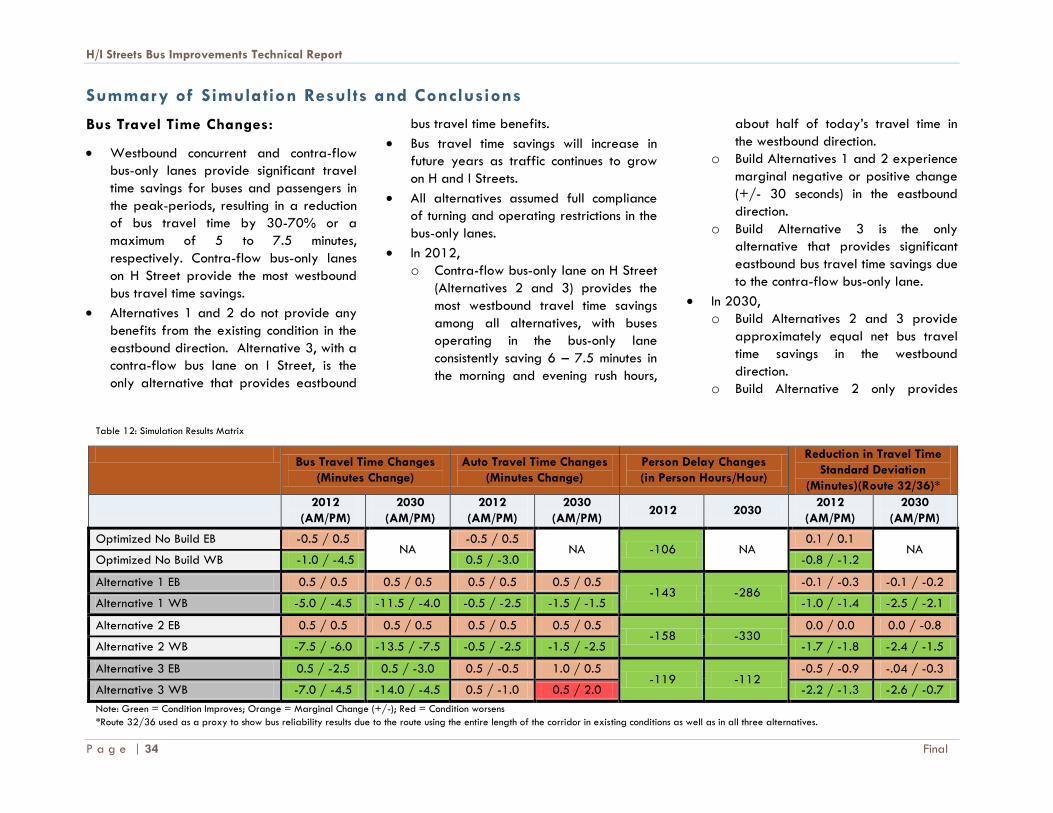
H/I Streets Bus Improvements Technical Report
P a g e | 34 Final
Summary of Simulation Results and Conclusions
Bus Travel Time Changes:
Westbound concurrent and contra-flow
bus-only lanes provide significant travel
time savings for buses and passengers in
the peak-periods, resulting in a reduction
of bus travel time by 30-70% or a
maximum of 5 to 7.5 minutes,
respectively. Contra-flow bus-only lanes
on H Street provide the most westbound
bus travel time savings.
Alternatives 1 and 2 do not provide any
benefits from the existing condition in the
eastbound direction. Alternative 3, with a
contra-flow bus lane on I Street, is the
only alternative that provides eastbound
bus travel time benefits.
Bus travel time savings will increase in
future years as traffic continues to grow
on H and I Streets.
All alternatives assumed full compliance
of turning and operating restrictions in the
bus-only lanes.
In 2012,
o Contra-flow bus-only lane on H Street
(Alternatives 2 and 3) provides the
most westbound travel time savings
among all alternatives, with buses
operating in the bus-only lane
consistently saving 6 – 7.5 minutes in
the morning and evening rush hours,
about half of today’s travel time in
the westbound direction.
o Build Alternatives 1 and 2 experience
marginal negative or positive change
(+/- 30 seconds) in the eastbound
direction.
o Build Alternative 3 is the only
alternative that provides significant
eastbound bus travel time savings due
to the contra-flow bus-only lane.
In 2030,
o Build Alternatives 2 and 3 provide
approximately equal net bus travel
time savings in the westbound
direction.
o Build Alternative 2 only provides
Table 12: Simulation Results Matrix
Bus Travel Time Changes
(Minutes Change)
Auto Travel Time Changes
(Minutes Change)
Person Delay Changes
(in Person Hours/Hour)
Reduction in Travel Time
Standard Deviation
(Minutes)(Route 32/36)*
2012
(AM/PM)
2030
(AM/PM)
2012
(AM/PM)
2030
(AM/PM) 2012 2030
2012
(AM/PM)
2030
(AM/PM)
Optimized No Build EB -0.5 / 0.5 NA
-0.5 / 0.5 NA -106 NA
0.1 / 0.1 NA
Optimized No Build WB -1.0 / -4.5 0.5 / -3.0 -0.8 / -1.2
Alternative 1 EB 0.5 / 0.5 0.5 / 0.5 0.5 / 0.5 0.5 / 0.5 -143 -286
-0.1 / -0.3 -0.1 / -0.2
Alternative 1 WB -5.0 / -4.5 -11.5 / -4.0 -0.5 / -2.5 -1.5 / -1.5 -1.0 / -1.4 -2.5 / -2.1
Alternative 2 EB 0.5 / 0.5 0.5 / 0.5 0.5 / 0.5 0.5 / 0.5 -158 -330
0.0 / 0.0 0.0 / -0.8
Alternative 2 WB -7.5 / -6.0 -13.5 / -7.5 -0.5 / -2.5 -1.5 / -2.5 -1.7 / -1.8 -2.4 / -1.5
Alternative 3 EB 0.5 / -2.5 0.5 / -3.0 0.5 / -0.5 1.0 / 0.5 -119 -112
-0.5 / -0.9 -.04 / -0.3
Alternative 3 WB -7.0 / -4.5 -14.0 / -4.5 0.5 / -1.0 0.5 / 2.0 -2.2 / -1.3 -2.6 / -0.7
Note: Green = Condition Improves; Orange = Marginal Change (+/-); Red = Condition worsens
*Route 32/36 used as a proxy to show bus reliability results due to the route using the entire length of the corridor in existing conditions as well as in all three alternatives.

H/I Streets Bus Improvements Technical Report
Final P a g e | 35
savings in the westbound direction as
buses are in mixed traffic in the
eastbound direction.
o Build Alternative 3 provides bus
travel time savings for both the east-
and westbound directions due to the
bus-only lane.
Auto Travel Time Changes:
In 2012 and 2030, the bus-only lanes in
all three alternatives have marginal
effects on the eastbound traffic.
Eastbound auto travel time experiences
+/- 30 seconds change in the rush hours.
Westbound bus-only lanes provide auto
travel time savings of up to 2.5 minutes. In
2012, an eastbound contra-flow bus lane
on I Street shows auto travel time increase
due to reduced auto capacity and
projected traffic demand growth on I
Street traffic in the future condition.
In 2012,
o Build Alternatives 1 and 2 results in
significant travel time savings for
vehicular traffic in the westbound
direction in the PM peak period.
Savings are attributed to signal timing
optimization, right-turn restrictions,
and reduced friction between buses
and autos.
In 2030,
o Build Alternative 2 shows the highest
auto travel time savings in westbound
direction in 2030 as traffic continues
to grow in the H/I corridor.
o Build Alternatives 1 and 2 provide
westbound auto travel time savings in
both the AM and PM peak-periods
with marginal increases in travel
delay in the eastbound direction.
o Build Alternative 3 experiences
increased auto travel delay due to
the reduced lane capacity for
automobiles and the expected growth
in automobile volumes by 2030 on I
Street.
Person Delay Changes:
Person delay changes are a function of
person throughput and bus and auto
travel time changes.
All three alternatives provide net person
delay improvements. Build Alternative 2
provides the most person delay
improvements in both 2012 and 2030.
All three bus-only lane alternatives
provide significant person hour savings for
buses in the westbound direction for both
AM and PM. Build Alternatives 1 and 2
provide westbound person hour savings
for mixed traffic in the westbound
direction with minimal person hour delays
experienced for the eastbound direction.
Build Alternative 3 experiences increased
person hour delay for mixed traffic as a
result of the increased automobile volumes
and decreased lane capacity on I Street.
Bus Reliability:
All three alternatives provide bus
reliability improvements from the existing
condition. The maximum time to travel the
westbound corridor decreases and the
variability becomes more constant in both
the AM and PM peak periods. In the
eastbound direction, the variability of bus
travel time shows marginal improvement
or similar runtime reliability in all
alternatives.
Alternative 3 provides the best bus
reliability results in terms of potential
reduction of travel time standard
deviation the westbound direction.
Intersection Level of Service (LOS):
Under the existing condition, three
intersections in the study area were
determined to be failing in either the AM
or PM peak periods: I Street and 17th
Street (E); I Street and 13th Street; and H
Street and 17th Street.
In 2012 and 2030, all three bus-only lane
alternatives preserve the same LOS or
provide LOS improvements at existing
failing intersections on H/I Streets, under
the assumption that there would be no
traffic diversion or reduction resulting
from the implementation of bus-only lanes.
H/I Streets Bus Improvements Technical Report
P a g e | 36 Final
Effects of Turning Restrictions and
Signal Optimizations:
Signal timing optimization contributes to
auto and bus travel time savings of
approximately 1.5 and 3.5 minutes
respectively in the westbound direction for
all alternatives.
While Alternative 1 could accommodate
occasional violations (1 to 2 vehicles per
signal cycle) of restricted right-turns in the
rush hours without negating the bus-only
lane performance, any increase in
violations will quickly lead to the
breakdown of the bus-only lane
operations.
Conclusions from Traffic and Transit
Simulations:
Generally, both mixed traffic and bus
travel experience benefits in the
westbound direction. Eastbound mixed
traffic and bus travel is marginally
affected (both positively and negatively
varying on alternative).
As a result of bus travel time savings and
bus reliability improvements, WMATA
would experience operational benefits in
terms of fleet savings under all three
alternatives by 2030.
All bus passengers waiting downstream on
the routes using the bus-only lanes would
experience improved bus service due to
more reliable travel times under all
alternatives. Passengers would experience
more predicable travel times and uniform
headways, resulting in reduced waiting
time at bus stops.
Intersection LOS is not negatively affected
due to the addition of bus-only lanes in
any alternative and improves at existing
failing intersections on H/I Streets.
Enforcement of right-turn restrictions are
needed to ensure the desired bus-only
lane performance as simulated (100%
compliance), with the recognition that
occasional violators could be tolerated by
the bus-only lane, which is highly likely to
happen even under diligent enforcement.
Signal timing optimizations and right-turn
restrictions improve westbound traffic flow
on I Street from the existing condition.
H/I Streets Bus Improvements Technical Report
Final P a g e | 37
BENEFIT COST ANALYSIS
A Benefit Cost Analysis1 (BCA) was conducted
to help with the evaluation of bus-only lane
alternatives (see Appendix B). The purpose of
the BCA is to compare three bus-only lane
alternatives quantitatively in terms of the
individual project costs and the associated
benefits. The results of the BCA, in conjunction
with other qualitative factors, provide
WMATA and DDOT with information on how
each alternative would affect bus operations
and the overall system.
This section describes the long-term benefits
generated by the alternatives. The stream of
anticipated benefits and costs for the
alternative capital investments have been
estimated over a 20-year analysis horizon,
starting the first full year each alternative is in
operation. The 20-year analysis horizon is
based on the useful life of asphalt pavement,
which will be used for the bus-only lanes.
1 A BCA is a ratio that compares the sum of a project’s benefits
to the cost of constructing and operating the project. Typically, a BCA ratio of 1.0 says that the benefits and costs are equal over the analysis period, and a BCA ratio over 1.0 shows that there are more quantifiable benefits than costs for the project. Alternately, a BCA ratio of less than 1.0 may indicate that there are not enough benefits to outweigh the costs, or that all of the benefits are not quantifiable. The difference between a BCA of 0.99 and 1.01 does not amount to a meaningful difference and could amount to nothing more than rounding error in the long term. Given the risks associated with forecasting costs and benefits, a successful project or program generally has a BCA ratio well over 1.0. The greater the ratio is over 1.0, the more downside risk the project or program can absorb. The qualitative benefits should also be considered when comparing project alternatives.
Each alternative’s benefits are summed and
then divided by its associated costs to yield
the BCA ratio. The benefits outlined in this
analysis are based on peak hour traffic
simulations and include peak and off-peak
period benefits. Build Alternative 1 is a peak
period only facility and will not have any off-
peak benefits. However, Build Alternative 2
and Build Alternative 3 are all day facilities
and will have some off-peak benefits.
Since simulation models were only developed
for analyzing weekday conditions during the
AM peak hour and PM peak hour within the
study area, the off-peak benefits (midday,
early night, weekends) for Alternative 2 and
Alternative 3 were derived from peak period
benefits. These derivations were based on on-
time performance (OTP) and speed data for
certain bus routes that traverse the study
area. Average bus speed and OTP data from
the field were used as the basis for estimating
the bus travel time benefits and passenger
reliability benefits, respectively. For these
reasons, the off-peak benefits presented
reflect order of magnitude estimates.
Table 13 summarizes the BCA results for the
three alternatives analyzed (discounted at a
7% rate). The tables have two costs: capital
and enforcement.
Benefits include travel time savings (for auto
and bus), bus reliability savings and bus
emission savings (value of bus emissions
avoided). In addition to the aforementioned
benefits, fleet savings and an operating cost
reduction have also been included.
The benefits for this scenario are listed below:
Build Alternative 1 – $75 million
Build Alternative 2 – $84 million
Build Alternative 3 – $57 million
Compared to a similarly discounted cost
estimate, the Benefit Cost Ratio for:
Build Alternative 1 – Ranges from 22 to
32 (depending on enforcement scenario),
an excellent return on investment;
Build Alternative 2 – 28, an excellent
return on investment; and
Build Alternative 3 – 9, a good return on
investment.
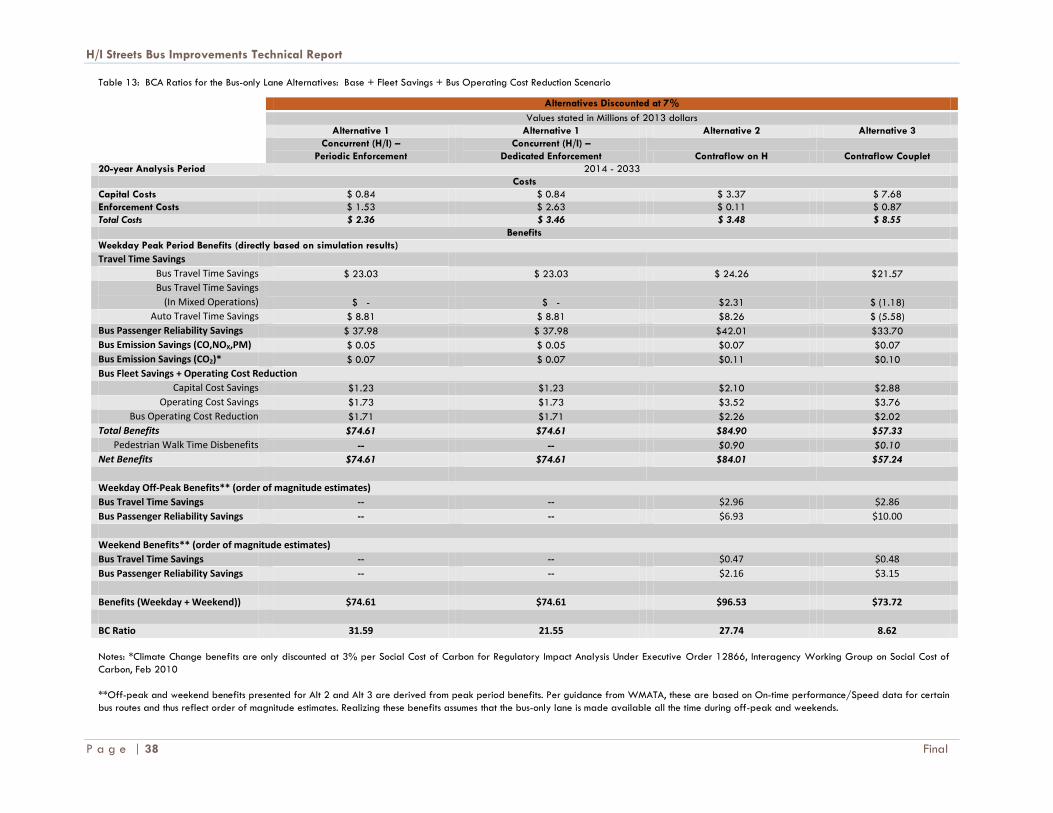
H/I Streets Bus Improvements Technical Report
P a g e | 38 Final
Table 13: BCA Ratios for the Bus-only Lane Alternatives: Base + Fleet Savings + Bus Operating Cost Reduction Scenario
Alternatives Discounted at 7%
Values stated in Millions of 2013 dollars
Alternative 1 Alternative 1 Alternative 2 Alternative 3
Concurrent (H/I) –
Periodic Enforcement
Concurrent (H/I) –
Dedicated Enforcement Contraflow on H Contraflow Couplet
20-year Analysis Period 2014 - 2033
Costs
Capital Costs $ 0.84 $ 0.84 $ 3.37 $ 7.68
Enforcement Costs $ 1.53 $ 2.63 $ 0.11 $ 0.87
Total Costs $ 2.36 $ 3.46 $ 3.48 $ 8.55
Benefits
Weekday Peak Period Benefits (directly based on simulation results)
Travel Time Savings
Bus Travel Time Savings $ 23.03 $ 23.03 $ 24.26 $21.57
Bus Travel Time Savings
(In Mixed Operations) $ - $ - $2.31 $ (1.18)
Auto Travel Time Savings $ 8.81 $ 8.81 $8.26 $ (5.58)
Bus Passenger Reliability Savings $ 37.98 $ 37.98 $42.01 $33.70
Bus Emission Savings (CO,NOX,PM) $ 0.05 $ 0.05 $0.07 $0.07
Bus Emission Savings (CO2)* $ 0.07 $ 0.07 $0.11 $0.10
Bus Fleet Savings + Operating Cost Reduction
Capital Cost Savings $1.23 $1.23 $2.10 $2.88
Operating Cost Savings $1.73 $1.73 $3.52 $3.76
Bus Operating Cost Reduction $1.71 $1.71 $2.26 $2.02
Total Benefits $74.61 $74.61 $84.90 $57.33
Pedestrian Walk Time Disbenefits -- -- $0.90 $0.10
Net Benefits $74.61 $74.61 $84.01 $57.24
Weekday Off-Peak Benefits** (order of magnitude estimates)
Bus Travel Time Savings -- -- $2.96 $2.86
Bus Passenger Reliability Savings -- -- $6.93 $10.00
Weekend Benefits** (order of magnitude estimates)
Bus Travel Time Savings -- -- $0.47 $0.48
Bus Passenger Reliability Savings -- -- $2.16 $3.15
Benefits (Weekday + Weekend)) $74.61 $74.61 $96.53 $73.72
BC Ratio 31.59 21.55 27.74 8.62
Notes: *Climate Change benefits are only discounted at 3% per Social Cost of Carbon for Regulatory Impact Analysis Under Executive Order 12866, Interagency Working Group on Social Cost of
Carbon, Feb 2010
**Off-peak and weekend benefits presented for Alt 2 and Alt 3 are derived from peak period benefits. Per guidance from WMATA, these are based on On-time performance/Speed data for certain
bus routes and thus reflect order of magnitude estimates. Realizing these benefits assumes that the bus-only lane is made available all the time during off-peak and weekends.
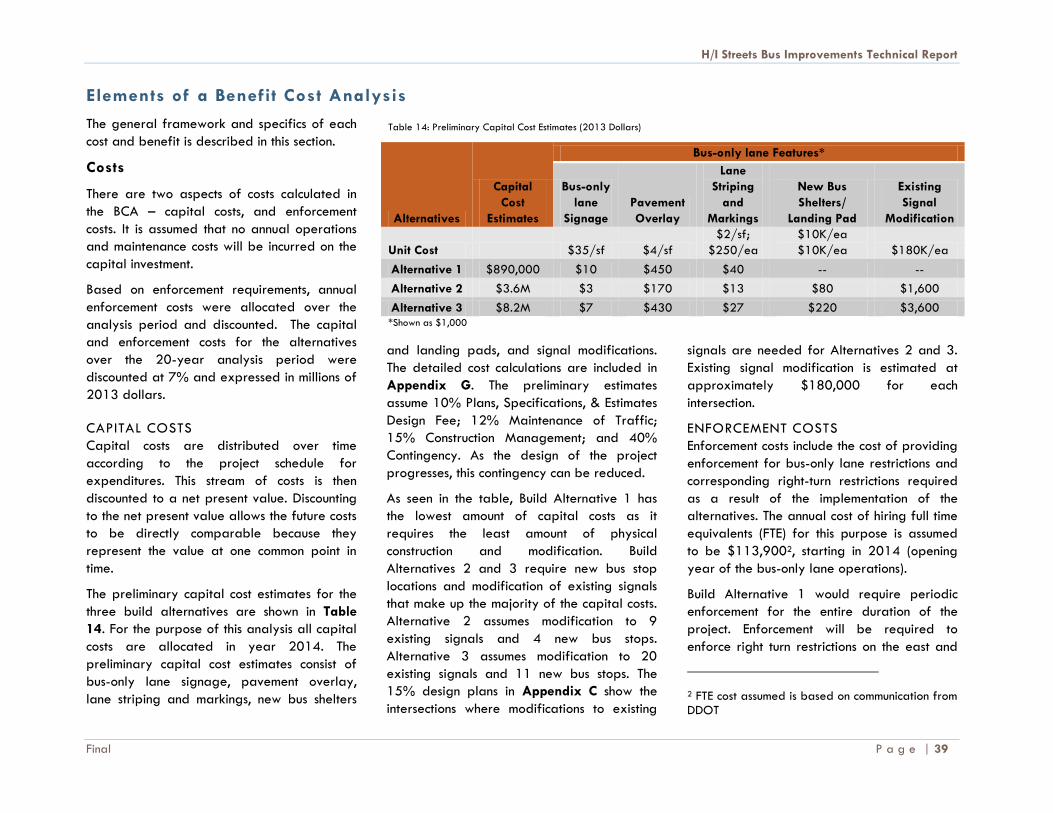
H/I Streets Bus Improvements Technical Report
Final P a g e | 39
Elements of a Benefit Cost Analysis
The general framework and specifics of each
cost and benefit is described in this section.
Costs
There are two aspects of costs calculated in
the BCA – capital costs, and enforcement
costs. It is assumed that no annual operations
and maintenance costs will be incurred on the
capital investment.
Based on enforcement requirements, annual
enforcement costs were allocated over the
analysis period and discounted. The capital
and enforcement costs for the alternatives
over the 20-year analysis period were
discounted at 7% and expressed in millions of
2013 dollars.
CAPITAL COSTS
Capital costs are distributed over time
according to the project schedule for
expenditures. This stream of costs is then
discounted to a net present value. Discounting
to the net present value allows the future costs
to be directly comparable because they
represent the value at one common point in
time.
The preliminary capital cost estimates for the
three build alternatives are shown in Table
14. For the purpose of this analysis all capital
costs are allocated in year 2014. The
preliminary capital cost estimates consist of
bus-only lane signage, pavement overlay,
lane striping and markings, new bus shelters
and landing pads, and signal modifications.
The detailed cost calculations are included in
Appendix G. The preliminary estimates
assume 10% Plans, Specifications, & Estimates
Design Fee; 12% Maintenance of Traffic;
15% Construction Management; and 40%
Contingency. As the design of the project
progresses, this contingency can be reduced.
As seen in the table, Build Alternative 1 has
the lowest amount of capital costs as it
requires the least amount of physical
construction and modification. Build
Alternatives 2 and 3 require new bus stop
locations and modification of existing signals
that make up the majority of the capital costs.
Alternative 2 assumes modification to 9
existing signals and 4 new bus stops.
Alternative 3 assumes modification to 20
existing signals and 11 new bus stops. The
15% design plans in Appendix C show the
intersections where modifications to existing
signals are needed for Alternatives 2 and 3.
Existing signal modification is estimated at
approximately $180,000 for each
intersection.
ENFORCEMENT COSTS
Enforcement costs include the cost of providing
enforcement for bus-only lane restrictions and
corresponding right-turn restrictions required
as a result of the implementation of the
alternatives. The annual cost of hiring full time
equivalents (FTE) for this purpose is assumed
to be $113,9002, starting in 2014 (opening
year of the bus-only lane operations).
Build Alternative 1 would require periodic
enforcement for the entire duration of the
project. Enforcement will be required to
enforce right turn restrictions on the east and
2 FTE cost assumed is based on communication from DDOT
Table 14: Preliminary Capital Cost Estimates (2013 Dollars)
Alternatives
Capital
Cost
Estimates
Bus-only lane Features*
Bus-only
lane
Signage
Pavement
Overlay
Lane
Striping
and
Markings
New Bus
Shelters/
Landing Pad
Existing
Signal
Modification
Unit Cost $35/sf $4/sf
$2/sf;
$250/ea
$10K/ea
$10K/ea $180K/ea
Alternative 1 $890,000 $10 $450 $40 -- --
Alternative 2 $3.6M $3 $170 $13 $80 $1,600
Alternative 3 $8.2M $7 $430 $27 $220 $3,600 *Shown as $1,000
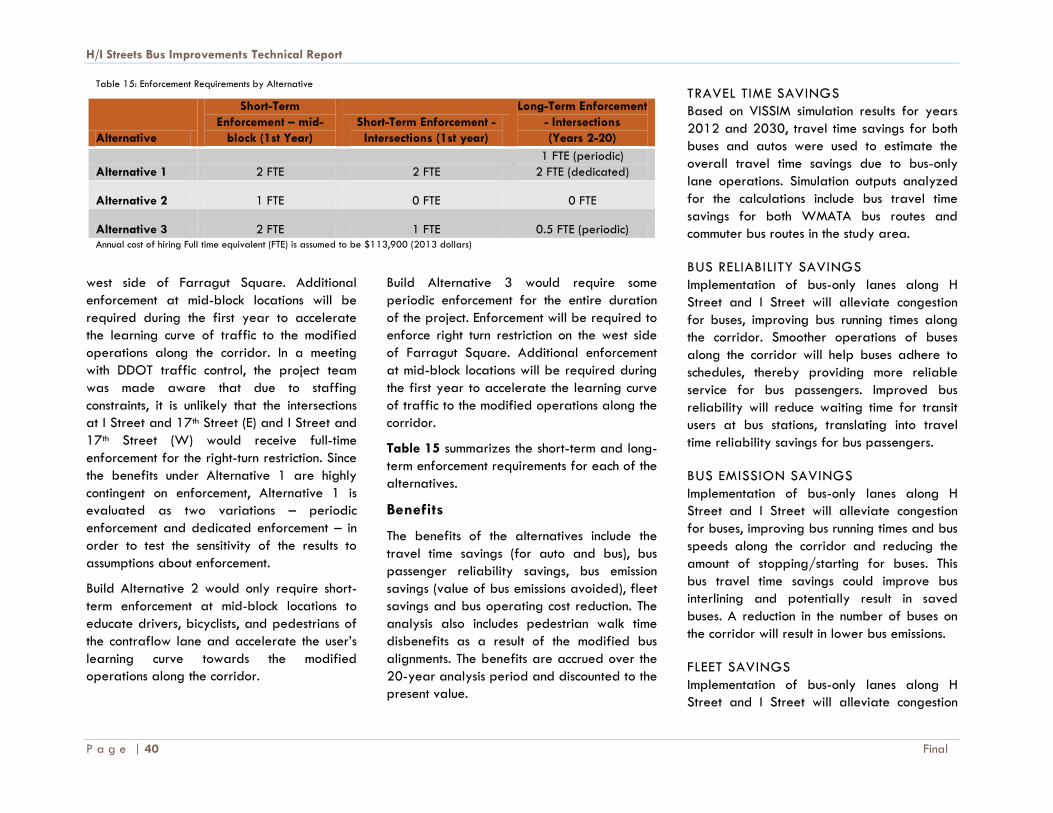
H/I Streets Bus Improvements Technical Report
P a g e | 40 Final
west side of Farragut Square. Additional
enforcement at mid-block locations will be
required during the first year to accelerate
the learning curve of traffic to the modified
operations along the corridor. In a meeting
with DDOT traffic control, the project team
was made aware that due to staffing
constraints, it is unlikely that the intersections
at I Street and 17th Street (E) and I Street and
17th Street (W) would receive full-time
enforcement for the right-turn restriction. Since
the benefits under Alternative 1 are highly
contingent on enforcement, Alternative 1 is
evaluated as two variations – periodic
enforcement and dedicated enforcement – in
order to test the sensitivity of the results to
assumptions about enforcement.
Build Alternative 2 would only require short-
term enforcement at mid-block locations to
educate drivers, bicyclists, and pedestrians of
the contraflow lane and accelerate the user’s
learning curve towards the modified
operations along the corridor.
Build Alternative 3 would require some
periodic enforcement for the entire duration
of the project. Enforcement will be required to
enforce right turn restriction on the west side
of Farragut Square. Additional enforcement
at mid-block locations will be required during
the first year to accelerate the learning curve
of traffic to the modified operations along the
corridor.
Table 15 summarizes the short-term and long-
term enforcement requirements for each of the
alternatives.
Benefits
The benefits of the alternatives include the
travel time savings (for auto and bus), bus
passenger reliability savings, bus emission
savings (value of bus emissions avoided), fleet
savings and bus operating cost reduction. The
analysis also includes pedestrian walk time
disbenefits as a result of the modified bus
alignments. The benefits are accrued over the
20-year analysis period and discounted to the
present value.
TRAVEL TIME SAVINGS
Based on VISSIM simulation results for years
2012 and 2030, travel time savings for both
buses and autos were used to estimate the
overall travel time savings due to bus-only
lane operations. Simulation outputs analyzed
for the calculations include bus travel time
savings for both WMATA bus routes and
commuter bus routes in the study area.
BUS RELIABILITY SAVINGS
Implementation of bus-only lanes along H
Street and I Street will alleviate congestion
for buses, improving bus running times along
the corridor. Smoother operations of buses
along the corridor will help buses adhere to
schedules, thereby providing more reliable
service for bus passengers. Improved bus
reliability will reduce waiting time for transit
users at bus stations, translating into travel
time reliability savings for bus passengers.
BUS EMISSION SAVINGS
Implementation of bus-only lanes along H
Street and I Street will alleviate congestion
for buses, improving bus running times and bus
speeds along the corridor and reducing the
amount of stopping/starting for buses. This
bus travel time savings could improve bus
interlining and potentially result in saved
buses. A reduction in the number of buses on
the corridor will result in lower bus emissions.
FLEET SAVINGS
Implementation of bus-only lanes along H
Street and I Street will alleviate congestion
Table 15: Enforcement Requirements by Alternative
Alternative
Short-Term
Enforcement – mid-
block (1st Year)
Short-Term Enforcement -
Intersections (1st year)
Long-Term Enforcement
- Intersections
(Years 2-20)
Alternative 1 2 FTE 2 FTE
1 FTE (periodic)
2 FTE (dedicated)
Alternative 2 1 FTE 0 FTE 0 FTE
Alternative 3 2 FTE 1 FTE 0.5 FTE (periodic) Annual cost of hiring Full time equivalent (FTE) is assumed to be $113,900 (2013 dollars)
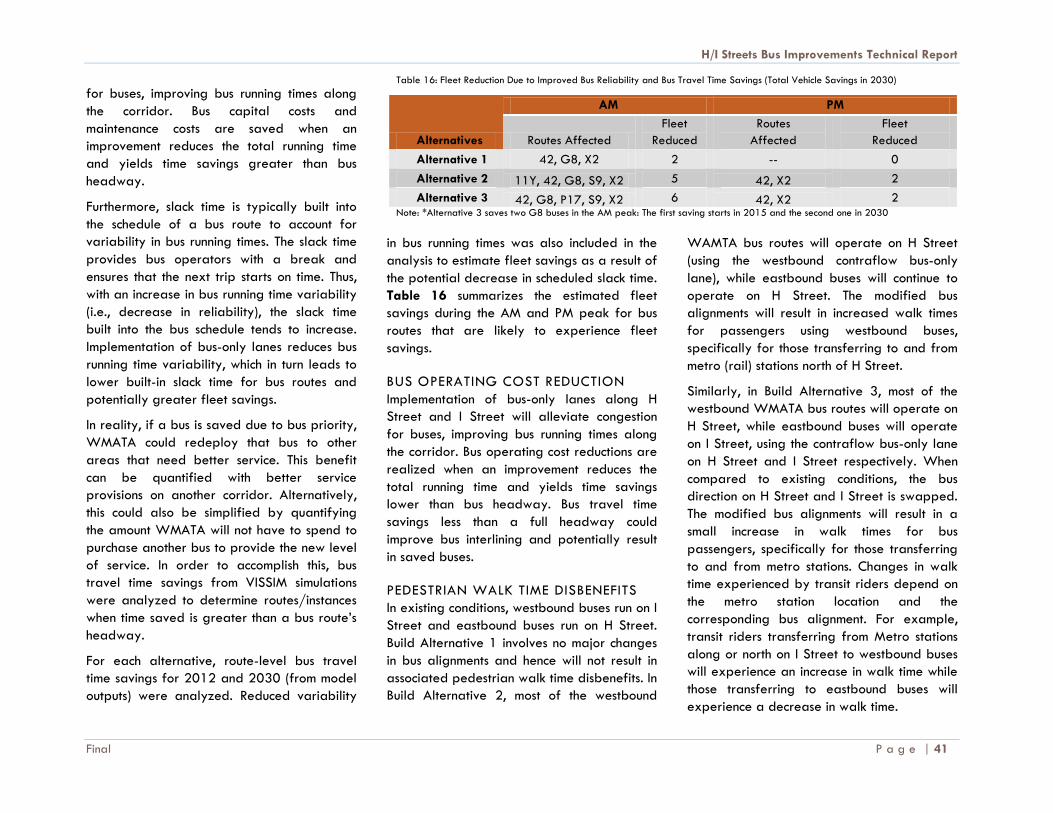
H/I Streets Bus Improvements Technical Report
Final P a g e | 41
for buses, improving bus running times along
the corridor. Bus capital costs and
maintenance costs are saved when an
improvement reduces the total running time
and yields time savings greater than bus
headway.
Furthermore, slack time is typically built into
the schedule of a bus route to account for
variability in bus running times. The slack time
provides bus operators with a break and
ensures that the next trip starts on time. Thus,
with an increase in bus running time variability
(i.e., decrease in reliability), the slack time
built into the bus schedule tends to increase.
Implementation of bus-only lanes reduces bus
running time variability, which in turn leads to
lower built-in slack time for bus routes and
potentially greater fleet savings.
In reality, if a bus is saved due to bus priority,
WMATA could redeploy that bus to other
areas that need better service. This benefit
can be quantified with better service
provisions on another corridor. Alternatively,
this could also be simplified by quantifying
the amount WMATA will not have to spend to
purchase another bus to provide the new level
of service. In order to accomplish this, bus
travel time savings from VISSIM simulations
were analyzed to determine routes/instances
when time saved is greater than a bus route’s
headway.
For each alternative, route-level bus travel
time savings for 2012 and 2030 (from model
outputs) were analyzed. Reduced variability
in bus running times was also included in the
analysis to estimate fleet savings as a result of
the potential decrease in scheduled slack time.
Table 16 summarizes the estimated fleet
savings during the AM and PM peak for bus
routes that are likely to experience fleet
savings.
BUS OPERATING COST REDUCTION
Implementation of bus-only lanes along H
Street and I Street will alleviate congestion
for buses, improving bus running times along
the corridor. Bus operating cost reductions are
realized when an improvement reduces the
total running time and yields time savings
lower than bus headway. Bus travel time
savings less than a full headway could
improve bus interlining and potentially result
in saved buses.
PEDESTRIAN WALK TIME DISBENEFITS
In existing conditions, westbound buses run on I
Street and eastbound buses run on H Street.
Build Alternative 1 involves no major changes
in bus alignments and hence will not result in
associated pedestrian walk time disbenefits. In
Build Alternative 2, most of the westbound
WAMTA bus routes will operate on H Street
(using the westbound contraflow bus-only
lane), while eastbound buses will continue to
operate on H Street. The modified bus
alignments will result in increased walk times
for passengers using westbound buses,
specifically for those transferring to and from
metro (rail) stations north of H Street.
Similarly, in Build Alternative 3, most of the
westbound WMATA bus routes will operate on
H Street, while eastbound buses will operate
on I Street, using the contraflow bus-only lane
on H Street and I Street respectively. When
compared to existing conditions, the bus
direction on H Street and I Street is swapped.
The modified bus alignments will result in a
small increase in walk times for bus
passengers, specifically for those transferring
to and from metro stations. Changes in walk
time experienced by transit riders depend on
the metro station location and the
corresponding bus alignment. For example,
transit riders transferring from Metro stations
along or north on I Street to westbound buses
will experience an increase in walk time while
those transferring to eastbound buses will
experience a decrease in walk time.
Table 16: Fleet Reduction Due to Improved Bus Reliability and Bus Travel Time Savings (Total Vehicle Savings in 2030)
Alternatives
AM PM
Routes Affected
Fleet
Reduced
Routes
Affected
Fleet
Reduced
Alternative 1 42, G8, X2 2 -- 0
Alternative 2 11Y, 42, G8, S9, X2 5 42, X2 2
Alternative 3 42, G8, P17, S9, X2 6 42, X2 2 Note: *Alternative 3 saves two G8 buses in the AM peak: The first saving starts in 2015 and the second one in 2030

H/I Streets Bus Improvements Technical Report
P a g e | 42 Final
OPERATIONAL MANAGEMENT AND POLICY
There are several operational management
and policy considerations that are vital to the
successful implementation of bus-only lanes on
H/I Streets. These operational management
and policy considerations include the hours of
operation, vehicle access policy, and impacts
to on-street parking and other curbside uses.
Bus-Only Lane Hours of
Operation
Designating the hours of bus-only lanes
operations is a key decision in the
establishment of bus priority. Bus-only lanes
hours of operations can either be at all times
(24 hours a day) or during peak-periods only.
Due to the physical design of contra-flow
lanes, Build Alternatives 2 and 3 will require a
bus-only lane operation policy of 24 hours a
day and 7 days a week.
For Build Alternative 1, a review of the traffic
peaking pattern was done for the H/I
corridor and found the peak-period was
between the hours of 7:30 – 10:00 AM and
4:00 – 6:30 PM. Traffic enforcement
personnel has stated in a previous study for
the Crystal City-Potomac Yard Transitway
with WMATA and Arlington County, that the
hours of restriction should consider a buffer
period around the actual hours of operation.
For example, if the lanes are to be cleared
for transit use by 7:30 AM, the posted
restriction time should be 7:00 AM. The hours
of restriction should also be clearly signed so
that drivers can easily recognize the
restriction. It is also recommended that the
bus-only lanes hours of restriction should also
be standardized among the other areas of
city where vehicular operations on streets are
restricted. The recommended posted bus-only
restriction for Build Alternative 1 will be 7:00
– 10:00 AM and 3:30 – 6:30 PM Weekdays
Only. Outside of these restricted hours, the
lane may be used for general traffic, parking,
and commercial deliveries; when blocked,
buses can take over or switch to other lanes
during off-peak periods.
Bus-Only Lane Access Policy
The purpose of the bus-only lanes is to
provide reliable and efficient bus service in
the region’s most heavily traveled bus corridor
and to alleviate Metrorail core congestion
through surface transit improvements. Defining
bus-only lane access is critical to ensuring
smooth operations of bus-only lanes and
eliminating unnecessary frictions with other
users coming into the bus-only lane. This access
policy designates which transit services, in
addition to WMATA and DC Circulator
services, will have access to the bus-only lanes.
In summary:
Bus-only lanes are for the exclusive use of
WMATA Metrobus and DC Circulator
services.
Publicly operated commuter bus providers
(PRTC, Loudoun County Transit, MTA) will
be permitted to use the bus-only lanes in
Build Alternative 1 as Metrobus and DC
Circulator buses will be able to overtake
commuter buses often with longer dwelling
time at stops up to 2 minutes. Commuter
bus operators will also be permitted to
use the bus-only lanes in Build Alternatives
2 and 3 for through buses only. In
coordination with these three publicly
operated commuter bus services, both
Alternatives 1 and 2 were favored as the
alternatives offer benefits to commuter
buses. A slightly higher preference was
given for Alternative 1 as it allows
commuter buses to remain on their current
routings in drop-off/pick-up mode.
Alternative 2 provides benefits to
commuter buses remaining on I Street as it
moves the majority of bus traffic off of I
Street onto H Street in the westbound
direction. This allows traffic to move more
freely on I Street and opens up the curb
lane for commuter bus operations without
conflict with Metrobus vehicles.
All other transit operators, including
private long distance providers, private
employment shuttles, and motorcoach/tour
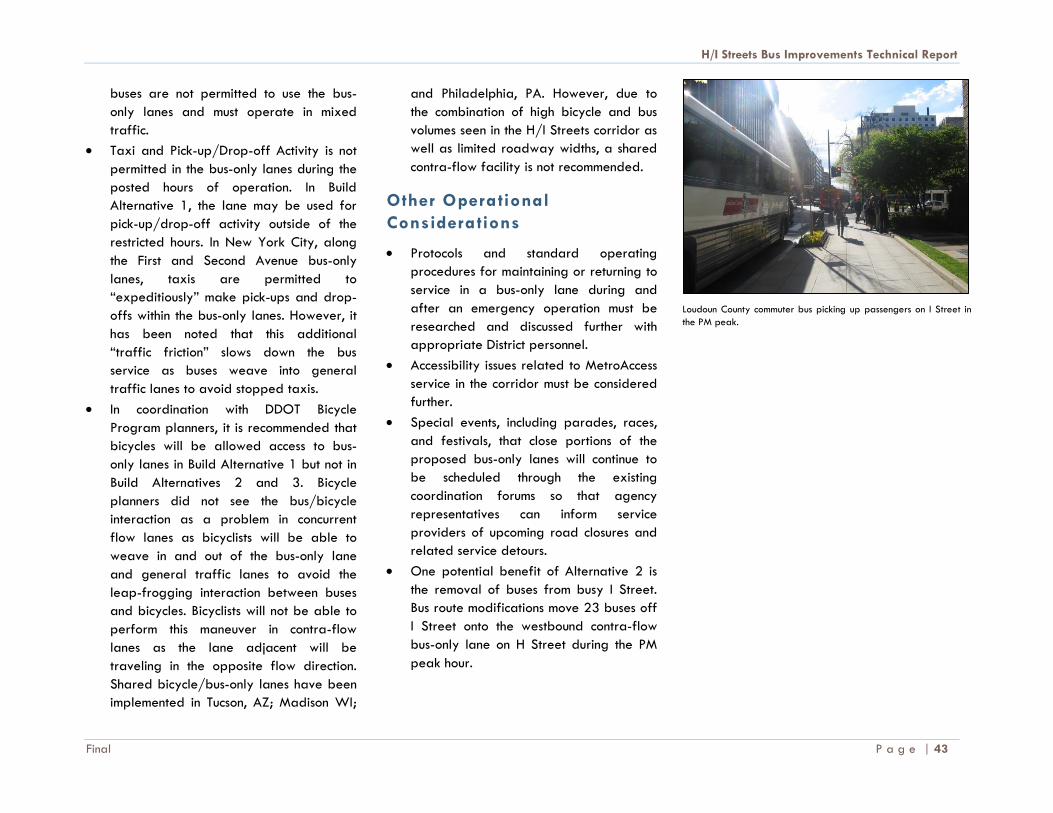
H/I Streets Bus Improvements Technical Report
Final P a g e | 43
buses are not permitted to use the bus-
only lanes and must operate in mixed
traffic.
Taxi and Pick-up/Drop-off Activity is not
permitted in the bus-only lanes during the
posted hours of operation. In Build
Alternative 1, the lane may be used for
pick-up/drop-off activity outside of the
restricted hours. In New York City, along
the First and Second Avenue bus-only
lanes, taxis are permitted to
“expeditiously” make pick-ups and drop-
offs within the bus-only lanes. However, it
has been noted that this additional
“traffic friction” slows down the bus
service as buses weave into general
traffic lanes to avoid stopped taxis.
In coordination with DDOT Bicycle
Program planners, it is recommended that
bicycles will be allowed access to bus-
only lanes in Build Alternative 1 but not in
Build Alternatives 2 and 3. Bicycle
planners did not see the bus/bicycle
interaction as a problem in concurrent
flow lanes as bicyclists will be able to
weave in and out of the bus-only lane
and general traffic lanes to avoid the
leap-frogging interaction between buses
and bicycles. Bicyclists will not be able to
perform this maneuver in contra-flow
lanes as the lane adjacent will be
traveling in the opposite flow direction.
Shared bicycle/bus-only lanes have been
implemented in Tucson, AZ; Madison WI;
and Philadelphia, PA. However, due to
the combination of high bicycle and bus
volumes seen in the H/I Streets corridor as
well as limited roadway widths, a shared
contra-flow facility is not recommended.
Other Operational
Considerations
Protocols and standard operating
procedures for maintaining or returning to
service in a bus-only lane during and
after an emergency operation must be
researched and discussed further with
appropriate District personnel.
Accessibility issues related to MetroAccess
service in the corridor must be considered
further.
Special events, including parades, races,
and festivals, that close portions of the
proposed bus-only lanes will continue to
be scheduled through the existing
coordination forums so that agency
representatives can inform service
providers of upcoming road closures and
related service detours.
One potential benefit of Alternative 2 is
the removal of buses from busy I Street.
Bus route modifications move 23 buses off
I Street onto the westbound contra-flow
bus-only lane on H Street during the PM
peak hour.
Loudoun County commuter bus picking up passengers on I Street in
the PM peak.
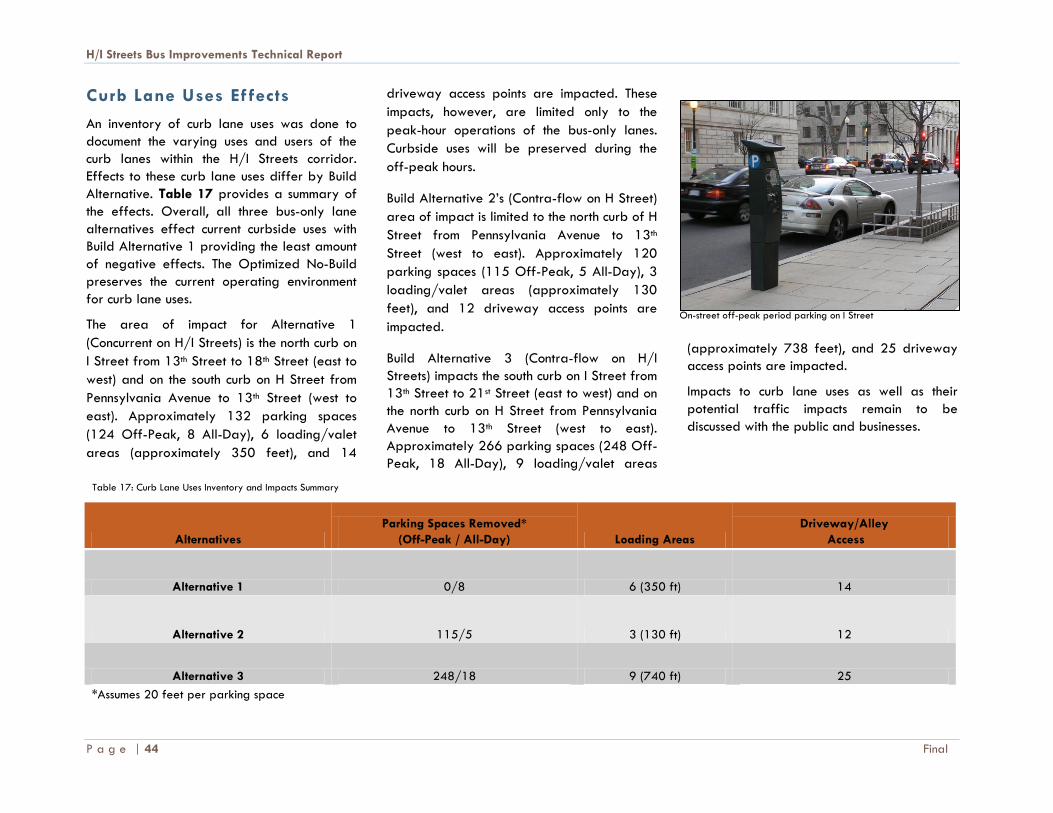
H/I Streets Bus Improvements Technical Report
P a g e | 44 Final
Curb Lane Uses Ef fects
An inventory of curb lane uses was done to
document the varying uses and users of the
curb lanes within the H/I Streets corridor.
Effects to these curb lane uses differ by Build
Alternative. Table 17 provides a summary of
the effects. Overall, all three bus-only lane
alternatives effect current curbside uses with
Build Alternative 1 providing the least amount
of negative effects. The Optimized No-Build
preserves the current operating environment
for curb lane uses.
The area of impact for Alternative 1
(Concurrent on H/I Streets) is the north curb on
I Street from 13th Street to 18th Street (east to
west) and on the south curb on H Street from
Pennsylvania Avenue to 13th Street (west to
east). Approximately 132 parking spaces
(124 Off-Peak, 8 All-Day), 6 loading/valet
areas (approximately 350 feet), and 14
driveway access points are impacted. These
impacts, however, are limited only to the
peak-hour operations of the bus-only lanes.
Curbside uses will be preserved during the
off-peak hours.
Build Alternative 2’s (Contra-flow on H Street)
area of impact is limited to the north curb of H
Street from Pennsylvania Avenue to 13th
Street (west to east). Approximately 120
parking spaces (115 Off-Peak, 5 All-Day), 3
loading/valet areas (approximately 130
feet), and 12 driveway access points are
impacted.
Build Alternative 3 (Contra-flow on H/I
Streets) impacts the south curb on I Street from
13th Street to 21st Street (east to west) and on
the north curb on H Street from Pennsylvania
Avenue to 13th Street (west to east).
Approximately 266 parking spaces (248 Off-
Peak, 18 All-Day), 9 loading/valet areas
(approximately 738 feet), and 25 driveway
access points are impacted.
Impacts to curb lane uses as well as their
potential traffic impacts remain to be
discussed with the public and businesses.
Table 17: Curb Lane Uses Inventory and Impacts Summary
Alternatives
Parking Spaces Removed*
(Off-Peak / All-Day) Loading Areas
Driveway/Alley
Access
Alternative 1 0/8 6 (350 ft) 14
Alternative 2 115/5 3 (130 ft) 12
Alternative 3 248/18 9 (740 ft) 25
*Assumes 20 feet per parking space
On-street off-peak period parking on I Street
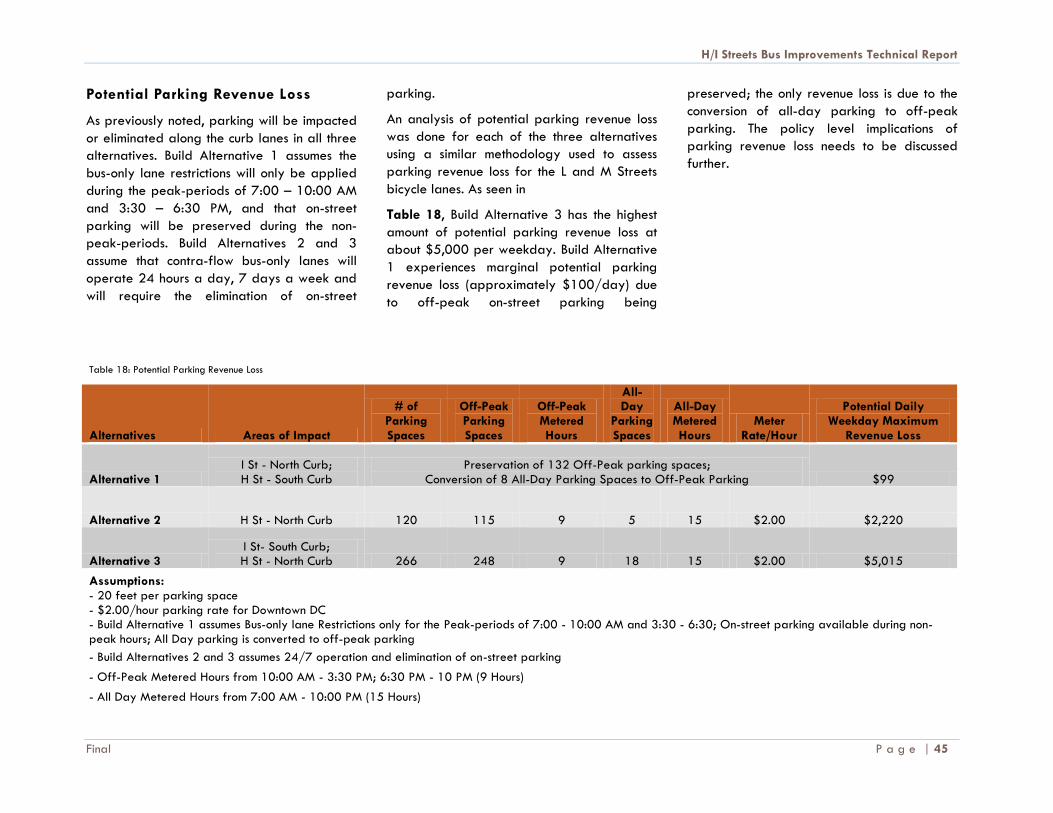
H/I Streets Bus Improvements Technical Report
Final P a g e | 45
Potential Parking Revenue Loss
As previously noted, parking will be impacted
or eliminated along the curb lanes in all three
alternatives. Build Alternative 1 assumes the
bus-only lane restrictions will only be applied
during the peak-periods of 7:00 – 10:00 AM
and 3:30 – 6:30 PM, and that on-street
parking will be preserved during the non-
peak-periods. Build Alternatives 2 and 3
assume that contra-flow bus-only lanes will
operate 24 hours a day, 7 days a week and
will require the elimination of on-street
parking.
An analysis of potential parking revenue loss
was done for each of the three alternatives
using a similar methodology used to assess
parking revenue loss for the L and M Streets
bicycle lanes. As seen in
Table 18, Build Alternative 3 has the highest
amount of potential parking revenue loss at
about $5,000 per weekday. Build Alternative
1 experiences marginal potential parking
revenue loss (approximately $100/day) due
to off-peak on-street parking being
preserved; the only revenue loss is due to the
conversion of all-day parking to off-peak
parking. The policy level implications of
parking revenue loss needs to be discussed
further.
Table 18: Potential Parking Revenue Loss
Alternatives Areas of Impact
# of Parking Spaces
Off-Peak Parking Spaces
Off-Peak Metered Hours
All-Day
Parking Spaces
All-Day Metered Hours
Meter Rate/Hour
Potential Daily Weekday Maximum
Revenue Loss
Alternative 1 I St - North Curb; H St - South Curb
Preservation of 132 Off-Peak parking spaces; Conversion of 8 All-Day Parking Spaces to Off-Peak Parking $99
Alternative 2 H St - North Curb 120 115 9 5 15 $2.00 $2,220
Alternative 3 I St- South Curb; H St - North Curb 266 248 9 18 15 $2.00 $5,015
Assumptions: - 20 feet per parking space
- $2.00/hour parking rate for Downtown DC - Build Alternative 1 assumes Bus-only lane Restrictions only for the Peak-periods of 7:00 - 10:00 AM and 3:30 - 6:30; On-street parking available during non-peak hours; All Day parking is converted to off-peak parking
- Build Alternatives 2 and 3 assumes 24/7 operation and elimination of on-street parking
- Off-Peak Metered Hours from 10:00 AM - 3:30 PM; 6:30 PM - 10 PM (9 Hours)
- All Day Metered Hours from 7:00 AM - 10:00 PM (15 Hours)
H/I Streets Bus Improvements Technical Report
P a g e | 46 Final
Mitigation Strategies
Loss of On-Street Parking: Loss of on-street
parking can be mitigated by promoting the
use of existing parking garages in the study
area. According to the Downtown BID and
Golden Triangle BID, there are
approximately 4,000 – 5,000 existing daily
parking spaces in an inventory of 199
garages. DDOT can post more signs directing
cars to off-street parking facilities or
negotiate with downtown businesses to
provide inexpensive parking validation. The
District can also mitigate the potential parking
revenue loss and decreased parking supply
by implementing a performance parking
strategy. Performance based parking works
by adjusting the rates and/or the time
restrictions on metered blocks as to balance
the parking supply. Performance based meter
rates and time limits are designed to
encourage brief curbside parking with high
turnover while discouraging long-term
parking. Visitors that require longer-term
parking are encouraged by the higher meter
rates to utilize off-street parking facilities.
Performance-based parking is currently used
in two District neighborhoods: Columbia
Heights and the Capitol Hill/Ballpark District.
Loading Activity: The delivery of goods and
services are essential to the District economy
and the H/I Street corridors, along with K
Street, are among the most important
commercial areas in the entire city. Currently,
illegal parking, both double parking and
parking during peak hours, for delivery and
loading activity causes traffic congestion and
bus delay on these corridors. Implementation
of any of the three bus-only lane alternatives
will have impacts to current loading activities,
including the elimination of loading zones.
Build Alternative 1 preserves off-peak
loading zones as the curb uses will remain
open to existing uses during the off-peak
hours. Build Alternatives 2 and 3, however,
will result in the elimination of 3 (130 feet)
and 9 (740 feet) loading zones, respectively. I
Street has more loading zones and a higher
daily level of loading activity due to more
street level retail and office uses than H
Street.
To mitigate the loss of loading zones in
Alternatives 2 and 3, loading activities may
be relocated to adjacent cross streets or
along the opposite curb of the bus-only lane.
Relocating or expanding loading zones may
come at the expense of on-street parking or
increase delay for delivery vehicles. Any
relocation of loading activities should be
coordinated with the Downtown and Golden
Triangle BIDs, and may require additional
analysis. Relocation and potential
consolidation of loading areas to adjacent
streets as well as their potential traffic
impacts remain to be discussed with public
stakeholders.
Rigorous enforcement for bus-only lane
violations by freight delivery carriers is also
required; Alternative 1 would more heavily
rely on enforcement than Alternatives 2 and 3
as contra-flow is generally self-enforcing.
Freight delivery carriers are often willing to
risk paying fines for parking violations in
order to conduct their business. Fines must be
high enough to discourage illegal parking
behavior. Additional details on enforcement
policy is discussed a later section.
Metered loading zones and performance
parking strategies may also be a strategy
that will encourage turnover of loading zones
or the use of off-street loading docks.

H/I Streets Bus Improvements Technical Report
Final P a g e | 47
Driveway Access: Preliminary designs for all
three bus-only lane alternatives do not create
any physical barriers between general traffic
and bus-only lanes, allowing vehicles to
continue to access driveway entrance points
under current driving norms and traffic laws.
Low-impact curbs or flex posts may offer
additional enforcement, but would be
designed to allow for driveway access. For
the concurrent flow alternative, drivers will be
able to enter into the bus-only lane to access
driveways. For contra-flow, drivers will have
to yield to oncoming bus traffic before
crossing over the bus-only lane to access
driveways. For drivers exiting driveways,
signage or other visual or audible warning
devices will be necessary to alert drivers of
the bus-only lanes and to exercise caution
when entering into general traffic.
Pedestrian and Bicycle Crossing Safety: Due
to the unfamiliarity of bus-only lanes,
particularly contra-flow lanes, pedestrians,
bicyclist, and drivers may require behavioral
adjustments during the early stages of
implementation. During this time, it is
recommended that a public education
campaign introduce the concept of the bus-
only lanes as well as raise awareness of the
potential safety issues. The use of design
elements may also be incorporated to reduce
pedestrian or bicycle conflicts. Design
elements, such as fencing or other barriers,
can discourage dangerous behavior, such as
jay-walking, and encourage more predictable
behavior at intersections. Crosswalks can also
be signed or equipped with visual or audible
warnings to remind pedestrians to look both
ways.
Examples of signage for drivers, bicyclists, and pedestrians to increase safety for bus-only lanes. New York City has stenciled pedestrian warnings at 110 of the most dangerous intersections in
the city (right); photo credit The Associated Press.
Prominent displays along the street remind pedestrians
of oncoming buses in Wellington, New Zealand.

H/I Streets Bus Improvements Technical Report
P a g e | 48 Final
ENFORCEMENT ISSUES AND STRATEGIES
Dedicated Lane Enforcement Best Practices
This section presents a summary of best
practices in bus-only lane enforcement based
on a literature review of the following sources:
Shared-Use Bus Priority Lanes on City
Streets: Case Studies in Design and
Management;
TCRP Report 90 – Bus Rapid Transit
Volume 2: Implementation Guidelines;
TCRP Synthesis 38: Electronic Surveillance
Technology on Transit Vehicles; and
TCRP Synthesis 83: Bus and Rail Transit
Preferential Treatments in Mixed Traffic.
Enforcement can be classified as either
passive or active. Signage, markings, or other
design-based designations are considered as
passive. Employing enforcement personnel
patrols or camera technology is considered as
active.
Signage and Markings Enforcement
Signage and markings play an important role
in communicating bus-only lanes rules and
regulations. Comprehensible, bold, and
consistent markings all help provide a clear
message to drivers that bus-only lane
restrictions are meant to be taken seriously.
Distinctive lane separation lines designate
bus-only lanes from general traffic lanes.
Most cities use a solid white line for this
separation with dashed lines to indicate where
other traffic may enter or exit the lanes, for
example for right-turns. The length of marking
allowing passage into the bus-only lane
should reflect queuing conditions at the
intersection. In addition to bus-only lane line
separation, colored pavement is also used to
raise the lane’s visibility as well as “BUS” or
“BUS-ONLY” text painted on the pavement to
clarify the lane’s purpose.
Signage is used to complement the pavement
markings in order to clearly communicate the
bus-only lane restrictions. Most cities place at
least one sign alerting drivers of the bus-only
lane on every block. Los Angeles and San
Francisco also use warning signs a block
before to alert drivers (“BUS-ONLY LANE
AHEAD”). Typically, signage indicates the bus
priority lanes hours of operation and may
also include fine amounts, other types of
vehicles permitted in the lanes, or
loading/unloading activity windows.
“BUS-ONLY” lane markings in New York City.
Typical bus-only lanes signage indicating hours
of restriction and permissible users.
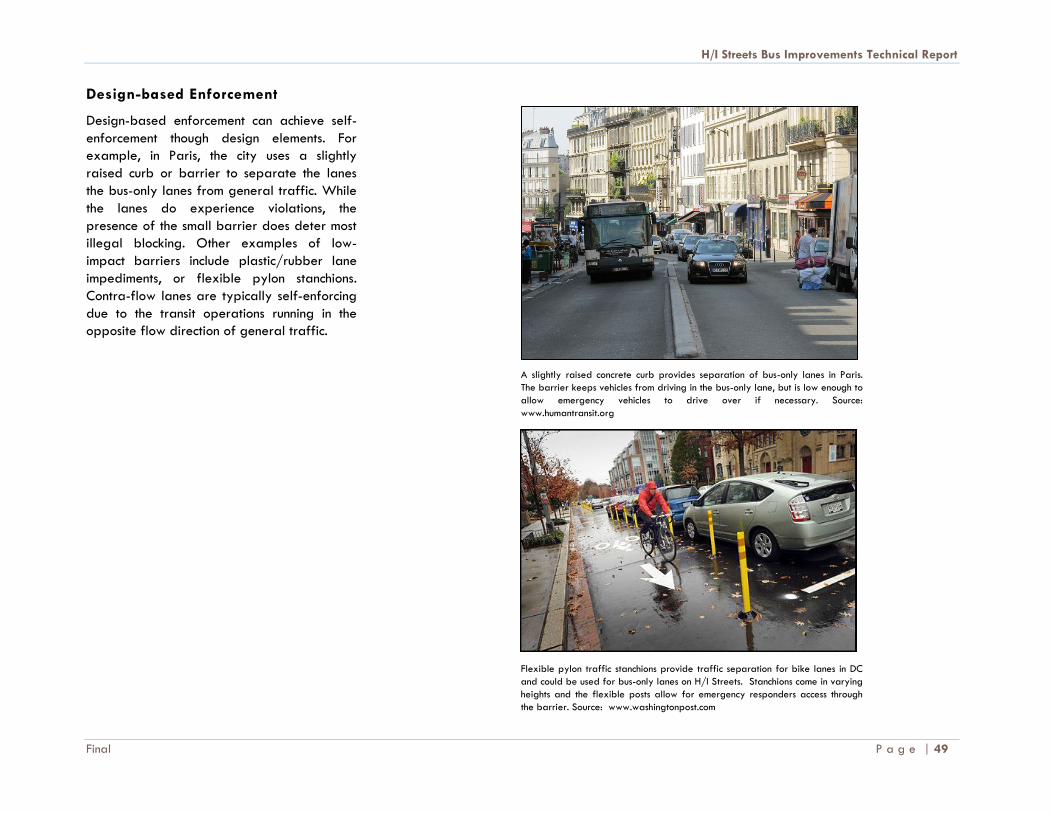
H/I Streets Bus Improvements Technical Report
Final P a g e | 49
Design-based Enforcement
Design-based enforcement can achieve self-
enforcement though design elements. For
example, in Paris, the city uses a slightly
raised curb or barrier to separate the lanes
the bus-only lanes from general traffic. While
the lanes do experience violations, the
presence of the small barrier does deter most
illegal blocking. Other examples of low-
impact barriers include plastic/rubber lane
impediments, or flexible pylon stanchions.
Contra-flow lanes are typically self-enforcing
due to the transit operations running in the
opposite flow direction of general traffic.
A slightly raised concrete curb provides separation of bus-only lanes in Paris.
The barrier keeps vehicles from driving in the bus-only lane, but is low enough to
allow emergency vehicles to drive over if necessary. Source:
www.humantransit.org
Flexible pylon traffic stanchions provide traffic separation for bike lanes in DC
and could be used for bus-only lanes on H/I Streets. Stanchions come in varying
heights and the flexible posts allow for emergency responders access through
the barrier. Source: www.washingtonpost.com
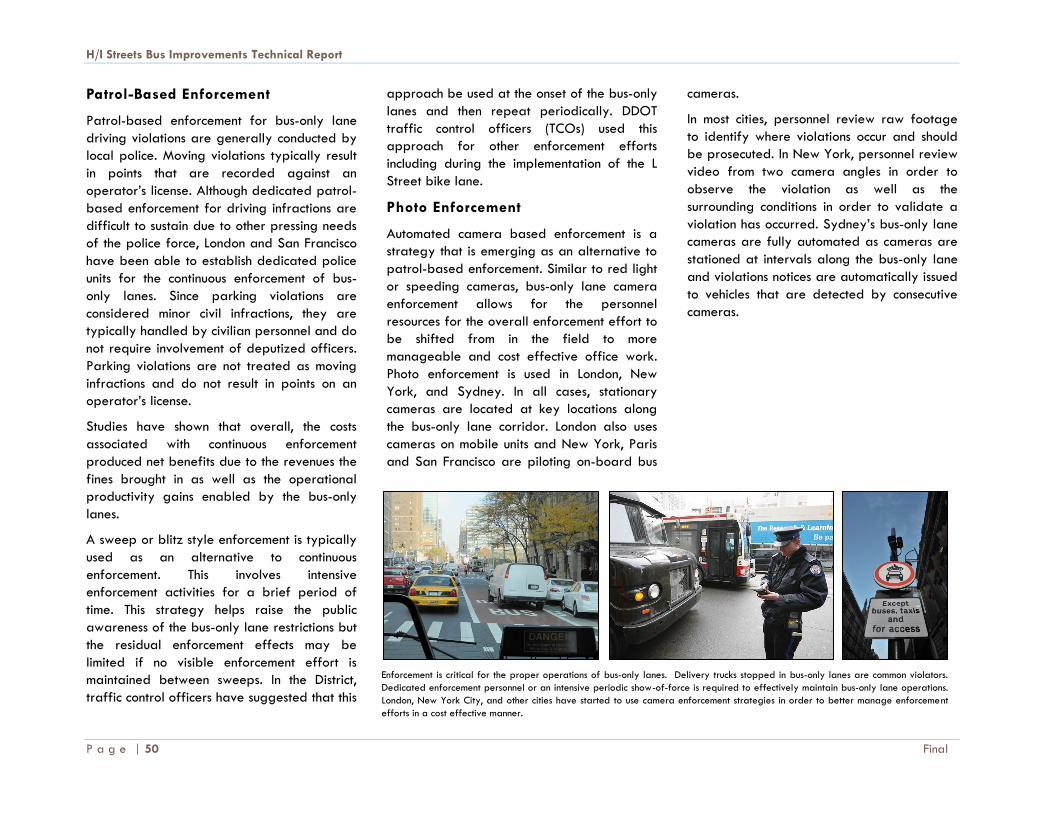
H/I Streets Bus Improvements Technical Report
P a g e | 50 Final
Patrol-Based Enforcement
Patrol-based enforcement for bus-only lane
driving violations are generally conducted by
local police. Moving violations typically result
in points that are recorded against an
operator’s license. Although dedicated patrol-
based enforcement for driving infractions are
difficult to sustain due to other pressing needs
of the police force, London and San Francisco
have been able to establish dedicated police
units for the continuous enforcement of bus-
only lanes. Since parking violations are
considered minor civil infractions, they are
typically handled by civilian personnel and do
not require involvement of deputized officers.
Parking violations are not treated as moving
infractions and do not result in points on an
operator’s license.
Studies have shown that overall, the costs
associated with continuous enforcement
produced net benefits due to the revenues the
fines brought in as well as the operational
productivity gains enabled by the bus-only
lanes.
A sweep or blitz style enforcement is typically
used as an alternative to continuous
enforcement. This involves intensive
enforcement activities for a brief period of
time. This strategy helps raise the public
awareness of the bus-only lane restrictions but
the residual enforcement effects may be
limited if no visible enforcement effort is
maintained between sweeps. In the District,
traffic control officers have suggested that this
approach be used at the onset of the bus-only
lanes and then repeat periodically. DDOT
traffic control officers (TCOs) used this
approach for other enforcement efforts
including during the implementation of the L
Street bike lane.
Photo Enforcement
Automated camera based enforcement is a
strategy that is emerging as an alternative to
patrol-based enforcement. Similar to red light
or speeding cameras, bus-only lane camera
enforcement allows for the personnel
resources for the overall enforcement effort to
be shifted from in the field to more
manageable and cost effective office work.
Photo enforcement is used in London, New
York, and Sydney. In all cases, stationary
cameras are located at key locations along
the bus-only lane corridor. London also uses
cameras on mobile units and New York, Paris
and San Francisco are piloting on-board bus
cameras.
In most cities, personnel review raw footage
to identify where violations occur and should
be prosecuted. In New York, personnel review
video from two camera angles in order to
observe the violation as well as the
surrounding conditions in order to validate a
violation has occurred. Sydney’s bus-only lane
cameras are fully automated as cameras are
stationed at intervals along the bus-only lane
and violations notices are automatically issued
to vehicles that are detected by consecutive
cameras.
Enforcement is critical for the proper operations of bus-only lanes. Delivery trucks stopped in bus-only lanes are common violators.
Dedicated enforcement personnel or an intensive periodic show-of-force is required to effectively maintain bus-only lane operations.
London, New York City, and other cities have started to use camera enforcement strategies in order to better manage enforcement
efforts in a cost effective manner.

H/I Streets Bus Improvements Technical Report
Final P a g e | 51
Administrative Issues and Penalties
In general, the enforcement of bus-only lanes
is governed by laws concerning the operation
of motor vehicles. The enforcement of such
laws is a police responsibility, and the civilian
transportation agency does not have the
authority to regulate or enforce these laws.
Cities have dealt with this challenge in various
ways. Some have passed laws reclassifying
bus-only lane violations as civil infractions that
can be enforced by civilian agents and/or by
automated cameras. Others have developed
contractual or supervisory relationships
between police and transportation agencies
to ensure that there are personnel directly
responsible for bus-only lane enforcement.
Fine amounts vary depending on whether the
bus-only lane infraction was a parking or
moving violation. Fines for unauthorized
vehicles should be high enough to discourage
illegal use and should also be advertised to
act as a deterrent. Fines for bus-only lane
violations range from $50 - $214, with
parking/stopping in a bus-only lane being
slightly higher than traveling in the bus-only
lane (see Table 19 for examples from other
cities).
Additionally, there should be an aggressive
towing program for illegally parked vehicles
in bus-only lanes. Immediately towing and
impounding violating vehicles has proven
effective.
Table 19: Penalties for Bus-only lane Violations
Penalty London Los Angeles New York City Paris San Francisco Sydney
Fine for parking/stopping
in bus-only lane $90-180 $88+ $115 $176 $103 $173
Fine for driving in bus-only
lane $90-180 $50+ $115-150 $176 $60 $214
Points against driving
license
Towing of illegally parked
cars
- Additional enforcement penalties besides fines
Source: Shared-Use Bus Priority Lanes on City Streets: Case Studies in Design and Management. Mineta Transportation Institute. 2012.

H/I Streets Bus Improvements Technical Report
P a g e | 52 Final
Summary of Current District of Columbia Enforcement
Current District of Columbia Traffic
Enforcement and Management
Responsibilities
The Transportation Operations Division within
the Transportation Operations Administration
(TOA) is responsible for the management of
the day-to-day traffic operations for the
District of Columbia, including the deployment
of traffic control officers and roadway
operations patrols. The traffic control officers
(TCOs) prevent congestion through
enforcement and traffic control services at
intersections throughout the District. Roadway
operations patrols respond to traffic incidents,
emergencies and roadway activity in the city.
The Department of Public Works (DPW)
provides parking enforcement, including the
removal of abandoned and dangerous
vehicles, ticketing, towing, and booting and
impoundment of vehicles that are in violation
of parking regulations.
The Metropolitan Police Department (MPD) is
the primary law enforcement agency for the
District of Columbia with duties including
improving the safety on the streets for
pedestrians, bicyclists, and drivers. MPD
operates automated cameras for traffic, red
light, and speed enforcement. The automated
photo enforcement program uses technology
to enforce the law fairly and consistently, with
the goal of reducing violations, preventing
crashes and injuries, and saving lives.
Intersection safety cameras catch red light
runners and photo radar cameras, both
stationary and in police vehicles, focus on
aggressive speeders. Locations for stationary
cameras are selected by MPD based on crash
statistics, officer observations, and citizen
complaints. Cameras automatically
photograph vehicles that violate the law and
no photos are taken of the driver or
passengers. Photos are reviewed and citations
are verified by a MPD officer and the ticket is
mailed to the registered owner of the vehicle.
No points are assessed for photo-enforced
tickets.
The Department of Motor Vehicles (DMV)
provides adjudication services, including
administrative hearings and payment services
for parking, minor traffic, and photo
enforcement tickets issued in the District of
Columbia. The current fine amount in DC for
parking in a bus zone or bus-only lane is
$100. There is no current law against driving
in bus-only lanes. See Appendix H for current
District traffic laws and fines related to
operating/parking in restricted lanes or
areas.
Lessons Learned from Enforcement
Programs
In coordination with DDOT TCO personnel, it
was noted that TCOs have difficulty with
enforcement of right-turn restrictions in other
areas of the city. The problem arises as it is
difficult to pull violators over to issue citations
during the peak hours. There is often limited
or no room for cars to stop without
interrupting traffic.
The MPD photo enforcement programed has
shown to improve traffic safety and change
driver behavior in the District. At intersections
equipped with automated cameras, red light
running has been reduced by two-thirds or
more. Aggressive speeding has also been
reduced from 1 in 3 drivers at the beginning
of the program to 1 in 40 today. Additionally,
average speeds for all vehicles traveling in
the District have been reduced significantly.
Fines collected from violators have been able
to pay for all program expenses.3
3 DC Photo Enforcement, MPD, Traffic Safety and Special Enforcement Branch. http://mpdc.dc.gov/sites/default/files/dc/sites/mpdc/publication/attachments/dcphoto_english.pdf
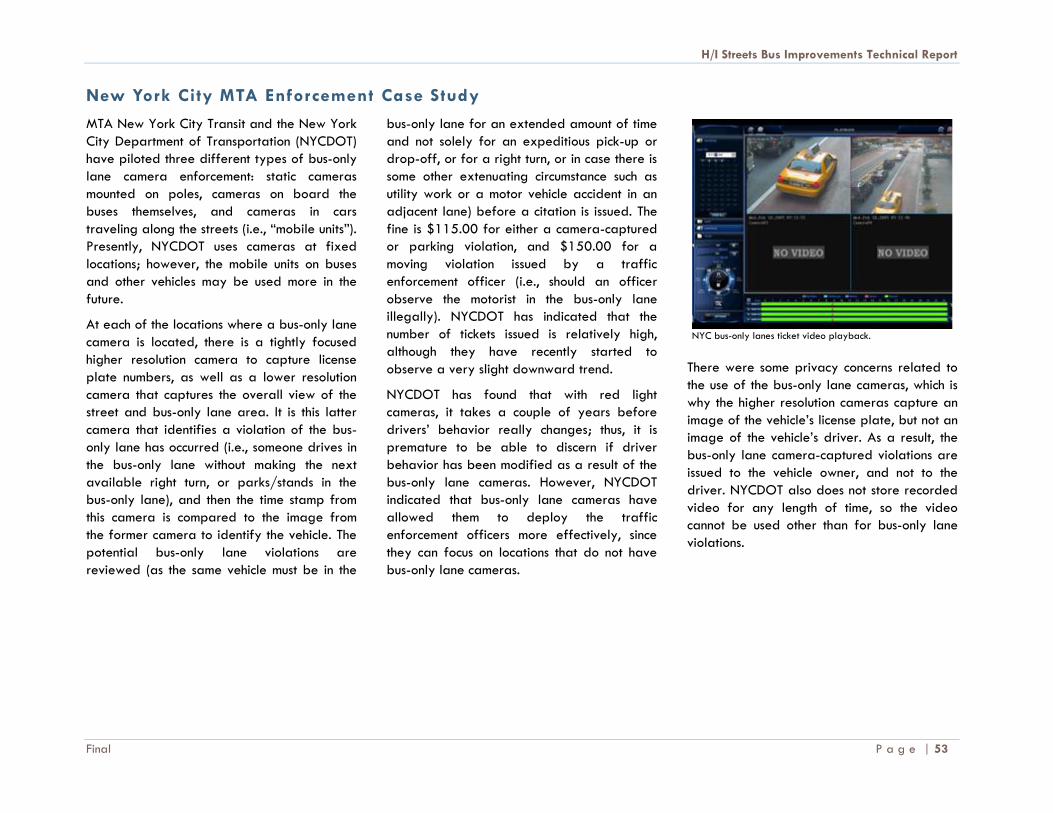
H/I Streets Bus Improvements Technical Report
Final P a g e | 53
New York City MTA Enforcement Case Study
MTA New York City Transit and the New York
City Department of Transportation (NYCDOT)
have piloted three different types of bus-only
lane camera enforcement: static cameras
mounted on poles, cameras on board the
buses themselves, and cameras in cars
traveling along the streets (i.e., “mobile units”).
Presently, NYCDOT uses cameras at fixed
locations; however, the mobile units on buses
and other vehicles may be used more in the
future.
At each of the locations where a bus-only lane
camera is located, there is a tightly focused
higher resolution camera to capture license
plate numbers, as well as a lower resolution
camera that captures the overall view of the
street and bus-only lane area. It is this latter
camera that identifies a violation of the bus-
only lane has occurred (i.e., someone drives in
the bus-only lane without making the next
available right turn, or parks/stands in the
bus-only lane), and then the time stamp from
this camera is compared to the image from
the former camera to identify the vehicle. The
potential bus-only lane violations are
reviewed (as the same vehicle must be in the
bus-only lane for an extended amount of time
and not solely for an expeditious pick-up or
drop-off, or for a right turn, or in case there is
some other extenuating circumstance such as
utility work or a motor vehicle accident in an
adjacent lane) before a citation is issued. The
fine is $115.00 for either a camera-captured
or parking violation, and $150.00 for a
moving violation issued by a traffic
enforcement officer (i.e., should an officer
observe the motorist in the bus-only lane
illegally). NYCDOT has indicated that the
number of tickets issued is relatively high,
although they have recently started to
observe a very slight downward trend.
NYCDOT has found that with red light
cameras, it takes a couple of years before
drivers’ behavior really changes; thus, it is
premature to be able to discern if driver
behavior has been modified as a result of the
bus-only lane cameras. However, NYCDOT
indicated that bus-only lane cameras have
allowed them to deploy the traffic
enforcement officers more effectively, since
they can focus on locations that do not have
bus-only lane cameras.
There were some privacy concerns related to
the use of the bus-only lane cameras, which is
why the higher resolution cameras capture an
image of the vehicle’s license plate, but not an
image of the vehicle’s driver. As a result, the
bus-only lane camera-captured violations are
issued to the vehicle owner, and not to the
driver. NYCDOT also does not store recorded
video for any length of time, so the video
cannot be used other than for bus-only lane
violations.
NYC bus-only lanes ticket video playback.
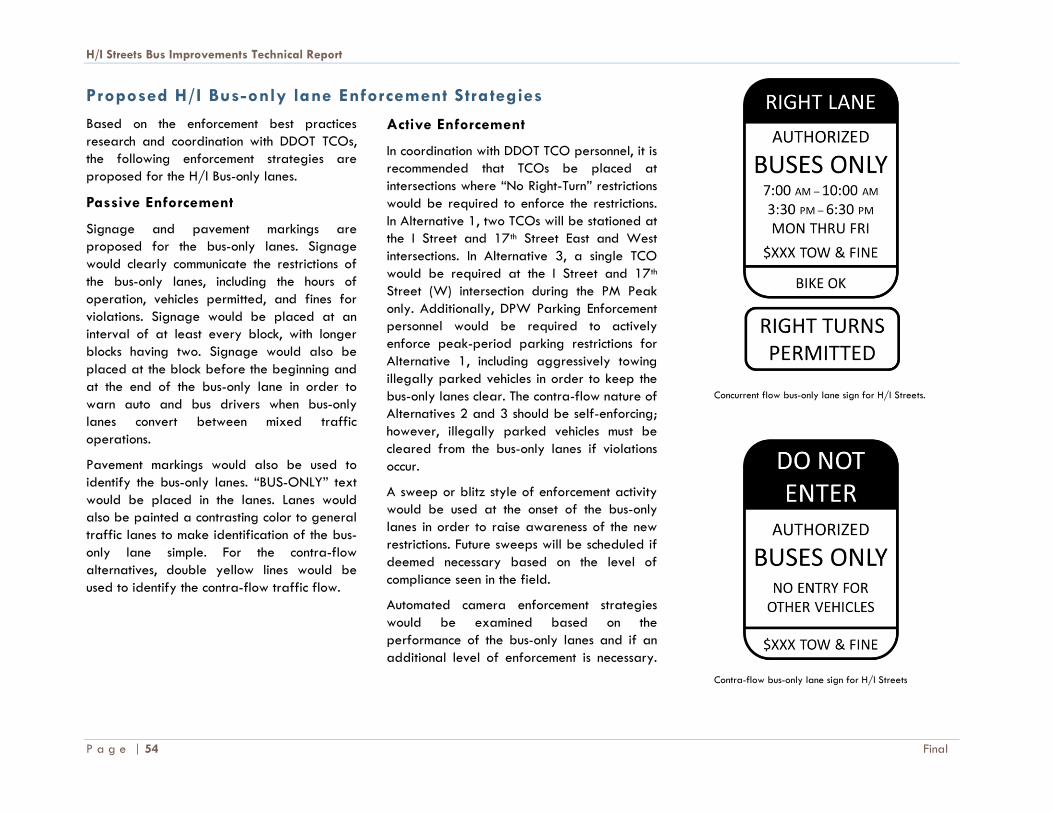
H/I Streets Bus Improvements Technical Report
P a g e | 54 Final
Proposed H/I Bus-only lane Enforcement Strategies
Based on the enforcement best practices
research and coordination with DDOT TCOs,
the following enforcement strategies are
proposed for the H/I Bus-only lanes.
Passive Enforcement
Signage and pavement markings are
proposed for the bus-only lanes. Signage
would clearly communicate the restrictions of
the bus-only lanes, including the hours of
operation, vehicles permitted, and fines for
violations. Signage would be placed at an
interval of at least every block, with longer
blocks having two. Signage would also be
placed at the block before the beginning and
at the end of the bus-only lane in order to
warn auto and bus drivers when bus-only
lanes convert between mixed traffic
operations.
Pavement markings would also be used to
identify the bus-only lanes. “BUS-ONLY” text
would be placed in the lanes. Lanes would
also be painted a contrasting color to general
traffic lanes to make identification of the bus-
only lane simple. For the contra-flow
alternatives, double yellow lines would be
used to identify the contra-flow traffic flow.
Active Enforcement
In coordination with DDOT TCO personnel, it is
recommended that TCOs be placed at
intersections where “No Right-Turn” restrictions
would be required to enforce the restrictions.
In Alternative 1, two TCOs will be stationed at
the I Street and 17th Street East and West
intersections. In Alternative 3, a single TCO
would be required at the I Street and 17th
Street (W) intersection during the PM Peak
only. Additionally, DPW Parking Enforcement
personnel would be required to actively
enforce peak-period parking restrictions for
Alternative 1, including aggressively towing
illegally parked vehicles in order to keep the
bus-only lanes clear. The contra-flow nature of
Alternatives 2 and 3 should be self-enforcing;
however, illegally parked vehicles must be
cleared from the bus-only lanes if violations
occur.
A sweep or blitz style of enforcement activity
would be used at the onset of the bus-only
lanes in order to raise awareness of the new
restrictions. Future sweeps will be scheduled if
deemed necessary based on the level of
compliance seen in the field.
Automated camera enforcement strategies
would be examined based on the
performance of the bus-only lanes and if an
additional level of enforcement is necessary.
Concurrent flow bus-only lane sign for H/I Streets.
Contra-flow bus-only lane sign for H/I Streets
H/I Streets Bus Improvements Technical Report
Final P a g e | 55
COORDINATION WITH OTHER DDOT OFFICES
The joint project team, led by WMATA and
DDOT, established early coordination
between the two agencies. Specific
coordination efforts included internal DDOT
stakeholders involved in the Union Station to
Georgetown Waterfront AA, Bicycle
program, Traffic Control Officers, and
Commuter bus operators. Below is a summary
of the key findings and coordination
discussions of these internal stakeholders.
Union Station to Georgetown
Waterfront AA:
The project team met with the Union Station to
Georgetown Waterfront AA team with the
purpose of coordinating between the two
projects. The H/I bus-only lanes project shares
a similar study area with the AA project in
Downtown DC. The H/I team gave an update
of the progress and results of the simulation
runs.
It was discussed how the H/I project will affect
the AA project. Concerns over the “taking of
lanes” within the greater downtown area (H/I
Streets, K Street, L and M Streets) for
multimodal purposes are valid, however, the
project teams believe that any decreases in
lane capacity will be offset by the
segregation of modes and the reduced
“friction factor” that is seen today between
the modes. All alternatives will be able to
accommodate transfer of bus routes off K
Street if necessary and will also be able to
help offset negative effects on K Street bus
routes during construction on the K Street
transitway.
DDOT Bicycle Program:
The purpose of the coordination meeting with
the DDOT bicycle program planners was to
provide an update of the project as well as to
obtain feedback on issues regarding bicycle
interaction and the lessons learned from the L
and M Bicycle Lanes project. The bicycle
planners believed that the concurrent flow
(Build Alternative 1) will be best for bikes as
bicyclists can access the concurrent flow bus-
only lane. The bicycle planners did not see bus
and bike interaction as a problem in
concurrent bus-only lanes. Buses and bikes will
leap frog, but bikes will have the freedom to
weave in and out of the bus-only lane and
general traffic lanes. For the contra-flow bus-
only lanes alternatives (Build Alternatives 2
and 3), bicycles will not be permitted to
access bus-only lane.
Lessons learned from implementation of the L
Street bicycle lanes can be applied to the
bus-only lanes project, including curbside
management and impacts due to loss of
parking. The L Street bicycle lane project also
found new loading and parking locations to
replace those curbside uses.
DDOT Traffic Control
Officers:
The purpose of the coordination meeting with
the DDOT TCOs was to provide an update of
the project as well as to obtain feedback on
issues regarding enforcement of bus-only
lanes and turn restrictions. TCOs stated that to
be able to enforce the right-turn restrictions in
Alternatives 1 and 3 (I and 17th Streets), TCOs
would need to be stationed at those locations.
Additionally, it is difficult to pull people over
to hand out citations during peak hours, as
there is no room for cars to stop without
interrupting traffic. TCOs would provide a
“show of force” early on in the implementation
then decrease the level of enforcement
personnel with follow-up periods of increased
enforcement. Department of Public Works
(DPW) parking enforcement personnel will
need to enforce parking restrictions in the bus-
only lanes. Additionally, Metropolitan Police
Department (MPD) is currently responsible for
camera enforcement and speed camera. MPD
will need to be involved for camera
enforcement and a process will also need to
be developed to administer/check violations
like in New York City.
H/I Streets Bus Improvements Technical Report
P a g e | 56 Final
COORDINATION WITH COMMUTER BUS OPERATORS
The purpose of this coordination meeting was
to have an initial discussion with relevant
commuter bus operators including Loudoun
County Transit (LCT), PRTC (OmniRide), and
Maryland Transportation Authority (MTA). The
briefing was oriented towards describing the
study’s purpose, alternatives and the benefits
and trade-offs associated with each. The
meeting was intended to identify early
conflicts as well as areas of common ground
and begin a dialogue that leads to wide
spread support and understanding.
Overall, the commuter bus operators were in
favor of implementing bus-only lanes in the
District and see the benefits in all of the
Alternatives presented. Both Alternatives 1
and 2 were favored as the alternatives offer
benefits to commuter buses. A slightly higher
preference was given for Alternative 1 as it
allows commuter buses to remain on their
current routings in drop-off/pick-up mode.
Alternative 2 provides benefits to commuter
buses remaining on I Street as it moves the
majority of bus traffic off of I Street onto H
Street in the westbound direction. This allows
traffic to move more freely on I Street and
opens up the curb lane for commuter bus
operations without conflict with Metrobus
vehicles.
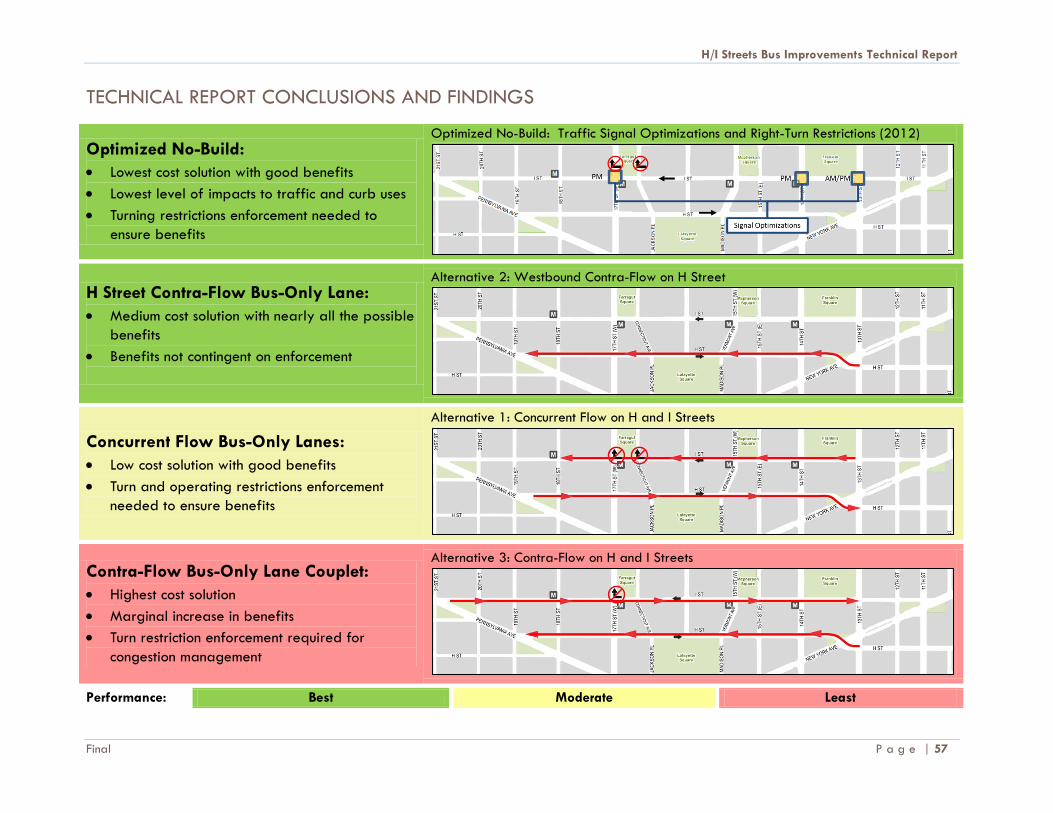
H/I Streets Bus Improvements Technical Report
Final P a g e | 57
TECHNICAL REPORT CONCLUSIONS AND FINDINGS
Optimized No-Build:
Lowest cost solution with good benefits
Lowest level of impacts to traffic and curb uses
Turning restrictions enforcement needed to
ensure benefits
Optimized No-Build: Traffic Signal Optimizations and Right-Turn Restrictions (2012)
H Street Contra-Flow Bus-Only Lane:
Medium cost solution with nearly all the possible
benefits
Benefits not contingent on enforcement
Alternative 2: Westbound Contra-Flow on H Street
Concurrent Flow Bus-Only Lanes:
Low cost solution with good benefits
Turn and operating restrictions enforcement
needed to ensure benefits
Alternative 1: Concurrent Flow on H and I Streets
Contra-Flow Bus-Only Lane Couplet:
Highest cost solution
Marginal increase in benefits
Turn restriction enforcement required for
congestion management
Alternative 3: Contra-Flow on H and I Streets
Performance: Best Moderate Least

H/I Streets Bus Improvements Technical Report
P a g e | 58 Final
Technical Report Conclusions (cont.)
Table 20 and the text below illustrate the
overall performance of each bus-only lane
alternative and the general conclusions of this
Technical Report.
Transit Performance: Alternative 3, the
contra-flow bus-only lanes couplet, provides
better travel times with exclusive bus lanes in
both travel directions, however when bus
person throughput is measured Alternative 2
performs the best.
Traffic Impacts: Alternative 2 provides the
best results in terms of traffic impacts
including improved automobile travel times
and no significant impacts to intersection
LOS.
Curb Lane Impacts: With the preservation of
off-peak on-street parking, Alternative 1
performs the best in terms of curb lane
impacts.
Capital and Enforcement Costs: Alternative
1 has low upfront capital costs compared to
the other two alternatives. However,
Alternative 1 has the highest enforcement
costs.
BCA Standard Benefits: Alternative 2
provides the most monetary benefits as
determined by the BCA in terms of travel
time savings (bus and automobile), bus
reliability savings, and bus emission savings.
All three alternatives provide good to
excellent returns on investment. Alternative 1
and 2 provide excellent returns on
investment, whereas Alternative 3 provides a
good return.
BCA Operating Cost Reduction Benefits:
Alternative 3 provides the most monetary
benefits as determined by the BCA in terms
of operating cost reduction benefits.
Other Major Findings:
Generally, both vehicular traffic and
buses gain benefits in the westbound
direction. Eastbound mixed traffic and
buses are marginally affected (both
positively and negatively varying on
alternative).
As a result of bus travel time savings and
bus reliability improvements, WMATA
would experience operational benefits in
terms of fleet savings under all three
alternatives by 2030.
Because bus service is cyclic, bus-only
lane improvements would benefit the
entire route under all alternatives.
Passengers would experience more
predicable travel times and uniform
headways, resulting in reduced waiting
time at bus stops.
Intersection LOS is not negatively
affected due to the addition of bus-only
lanes in any alternative. All alternatives
improve or maintain LOS at existing
failing intersections on H/I Streets.
Enforcement of right-turn restrictions are
needed to ensure the desired bus-only
lane performance as simulated (100%
compliance), with the recognition that
occasional violators could be tolerated
by the bus-only lane. Occasional
violations are highly likely to happen
even under diligent enforcement.
One potential benefit of Alternative 2 is
the removal of buses from busy I Street
without dedication of a general purpose
lane to bus operations. Bus route
modifications move 23 peak-hour bus
trips off of I Street onto the westbound
contra-flow bus-only lane on H Street
during the PM peak hour.
Signal timing optimizations and right-turn
restrictions improve westbound traffic
flow on I Street from the existing
condition.
Optimized No-Build:
Applying traffic management
improvements without bus lanes, such as
signal timing optimizations and right-turn
restrictions, can improve westbound
traffic flow on I Street from the existing
condition in the near-term.

H/I Streets Bus Improvements Technical Report
Final P a g e | 59
Table 20: Bus-Only Lanes Alternatives Performance Summary Matrix
Alternative
Transit
Performance Traffic Impacts
Curb Lane
Impacts
Capital and
Enforcement Costs
BCA Standard
Benefits
BCA Operating
Cost Reduction
Benefits
Alternative 1:
Concurrent Flow Bus-
Only Lanes on H/I
Streets
Alternative 2: Contra-
Flow Bus-Only Lane
on H Street
Alternative 3: Contra-
Flow Bus-Only Lanes
on H/I Streets
Performance: Least to Best
H/I Streets Bus Improvements Technical Report
P a g e | 60 Final
Technical Repor t Findings and Next Steps
The Technical Report analyzed and
evaluated bus operational improvements and
bus lane alternatives through a combination
of quantitative operational measures and
policy considerations, including travel time
savings, curb lane impacts, enforcement
strategies, and costs. This study found that
all bus improvement alternatives provide
good to excellent returns on transit
investment, and identified a technical
preference for the H Street contra-flow bus-
only lane (Alternative 2).
In consideration of the ongoing land use
development and transportation
improvement initiatives in Downtown, a short-
term traffic management option, as seen in
the Optimized No-Build scenario, could
provide immediate benefits to the existing
traffic and transit operations in the east-west
corridor of H/I and K Streets and allow
flexibility for a later determination of transit
investment.
This Technical Report recommends further
analysis of the bus-lane alternatives in order
to understand the overall benefits and
effects to the downtown transportation
network, including traffic diversion and
reroutings due to turn restrictions. While the
technical report assumed auto traffic would
remain on the H and I Streets, the proposed
operational changes including turning
restrictions could potentially induce traffic
diversion to other streets.
If a bus-lane alternative were selected for
implementation, DDOT would require NEPA
& Section 106 approval. Therefore,
subsequent studies could include the
recommendations and findings of this study,
which would also allow for the determination
of the benefits and impacts at the network
level.
Relocation and potential consolidation of
loading areas to adjacent streets as well as
their potential traffic impacts remain to be
discussed with public stakeholders.
Additionally, the policy level implications of
parking revenue loss needs to be discussed
further.


