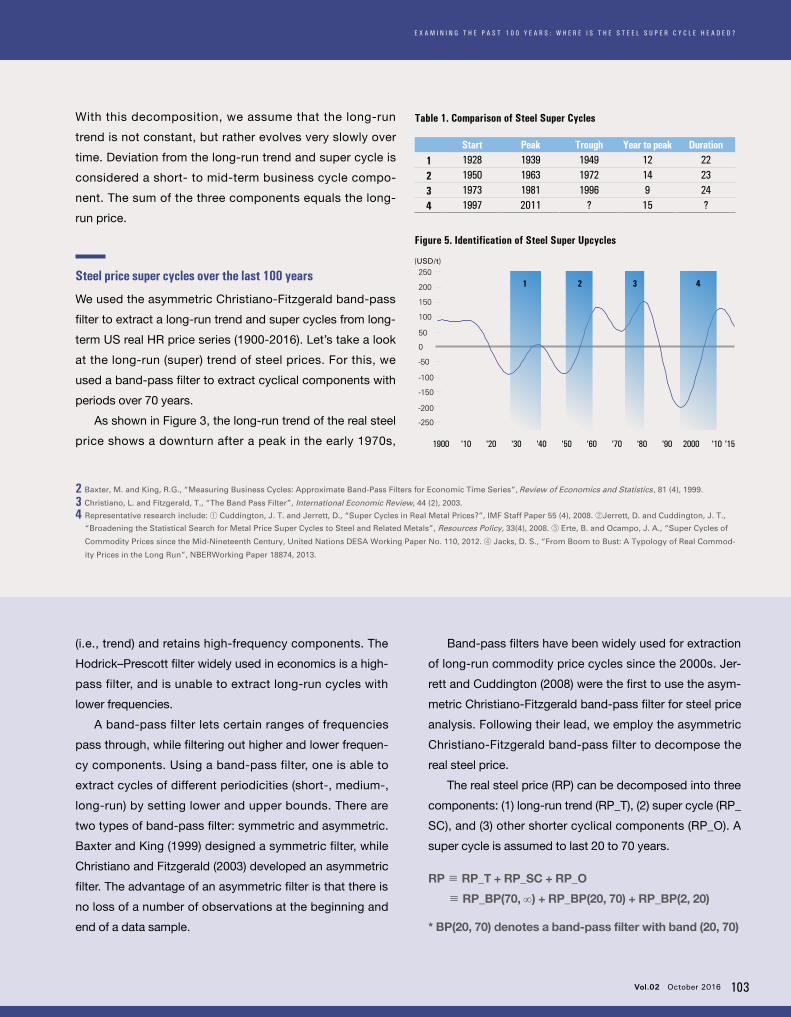
OCTOBER 2016 ASIAN STEEL WATCH 02 INDUSTRY 4.0 AND THE ASIAN STEEL INDUSTRY WINDS OF CHANGE ARE BLOWING INTERVIEW Ask the Guru: Roads Ahead for the Steel Industry Edwin Basson, Director General of worldsteel ON THE COVER Accelerating Digital Transformation with Smart Factory to Unlock New Value Jeong, Duk-Kyun, POSCO ICT FEATURED ARTICLES Restructuring of the Chinese Steel Industry: Retrospects and Prospects SPECIAL REPORT Global Competitiveness Through Hybridization of FINEX and CEM Processes Dong Joon MIN, Professor of Yonsei University MARKET TREND AND ANALYSIS Examining the Past 100 Years: Where is the Steel Super Cycle Headed?
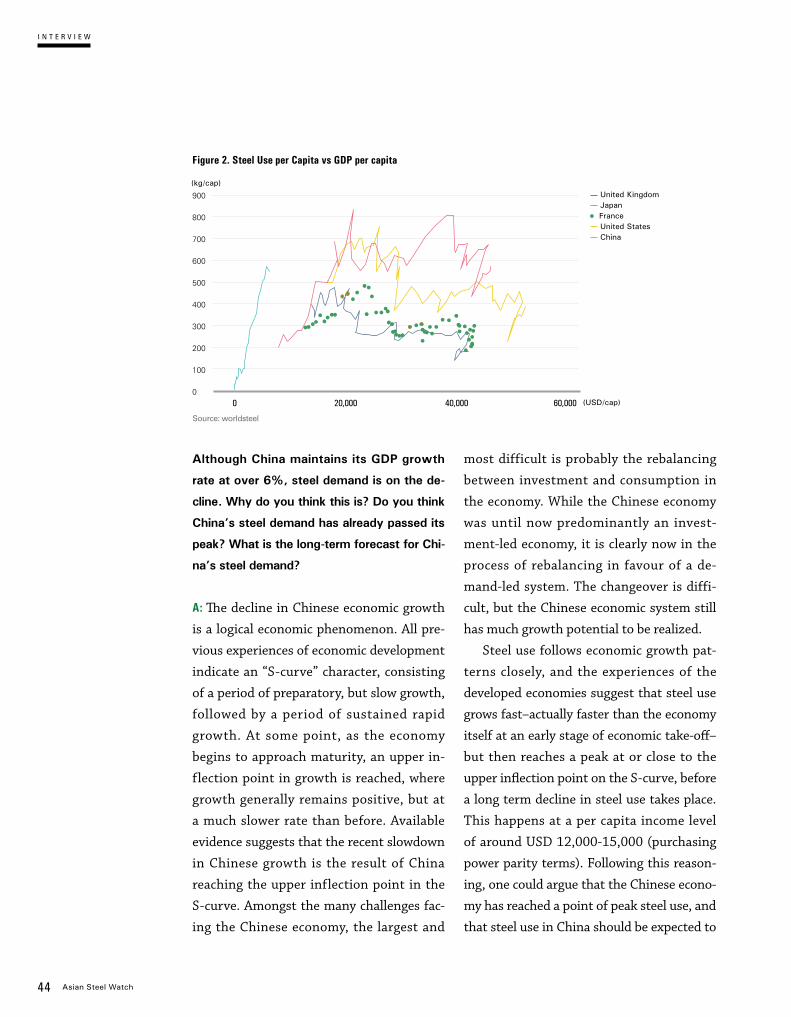
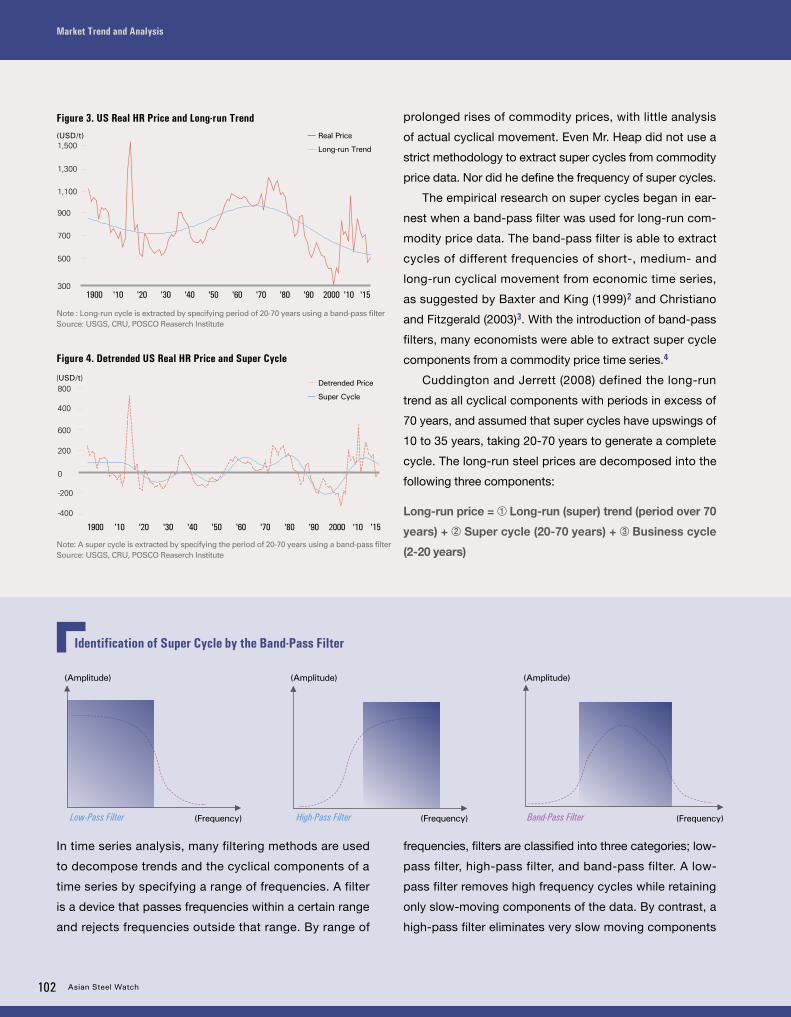
Transcript
O C TO B E R 2 01 6
ASIAN STEEL WATCH
02
INDUSTRY 4.0 AND THE ASIAN STEEL INDUSTRY
WINDS OF CHANGE ARE BLOWING
INTERVIEW
Ask the Guru: Roads Ahead for the Steel IndustryEdwin Basson, Director General of worldsteel
ON THE COVER
Accelerating Digital Transformation with Smart Factory to Unlock New ValueJeong, Duk-Kyun, POSCO ICT
FEATURED ARTICLES
Restructuring of the Chinese Steel Industry:Retrospects and ProspectsSPECIAL REPORT
Global Competitiveness Through Hybridization of FINEX and CEM ProcessesDong Joon MIN, Professor of Yonsei University
MARKET TREND AND ANALYSIS
Examining the Past 100 Years:Where is the Steel Super Cycle Headed?
O C T O B E R 2 0 1 6
ASIAN STEEL WATCH
02
On the Cover04
06 The Fourth Industrial Revolution: The Winds of Change Are Blowing in the Steel Industry
16 Accelerating Digital Transformation with Smart Factory to Unlock New Value: Case of POSCO
24 China is Shifting to the “Smart Factory of the World”
32 The Rise, Prospects, and Impact of China’s Steel E-Commerce
THE FOURTH WAVE OF MANUFACTURING: WHAT IT MEANS TO THE ASIAN STEEL INDUSTRY
Publisher Kwag, Changho
Published by POSCO Research lnstitute
Editor-in-chief Chung, Cheol-Ho
Editing Advisor
Jun H. Goh
Managing Editor
Sojin Yoon
Editorial Board
Moon-Kee Kong Dong-Cheol SaJi-mi ChuChang-do Kim
Designed by
Soluwin CorporationEun-jung YoonGo-woon SeoEun-yang Jo
Printed by
Shinsago Hightech
Date of lssue
October 11, 2016
Copyright 2016POSCO Research InsitituteAll rights reserved.Production in whole or in part without writtenpermission is strictly prohibited.
Registration number
Gangnam, Ba00170
Registration date
September 7, 2015
How to contact
asiansteel.w@ posri.re.kr
O C T O B E R 2 0 1 6
ASIAN STEEL WATCH
02
C O N T E N T S
Bi-annual
98Market Trend and Analysis
100 Examining the Past 100 Years: Where is the Steel Super Cycle Headed?
110 Statistical Review of the Steel Trade in Northeast Asia
40Ask the Guru: Roads Ahead for the Steel Industry
Edwin Basson, Director General of worldsteel
Interview
64 Featured Articles
50Global Competitiveness Through Hybridization of FINEX and CEM Processes
Dong Joon MIN, Professor of Yonsei University
Special Report
66 The Demographic Cliff: How It Will Impact Asia’s Steel Demand
78 Restructuring of the Chinese Steel Industry: Retrospects and Prospects
88 Myanmar, the Last Frontier in the ASEAN, Will See High Growth of its Steel Industry
4 Asian Steel Watch
On the Cover
06
16
24
32
The Fourth Industrial Revolution: The Winds of Change Are Blowing in the Steel Industry Cheong, Je-Ho
Accelerating Digital Transformation with Smart Factory to Unlock New Value: Case of POSCO Jeong, Duk-Kyoon
China is Shifting to the “Smart Factory of the World” Dr. Kim Chang-do
The Rise, Prospects, and Impact of China’s Steel E-Commerce Dr. Kim Kyeongchan
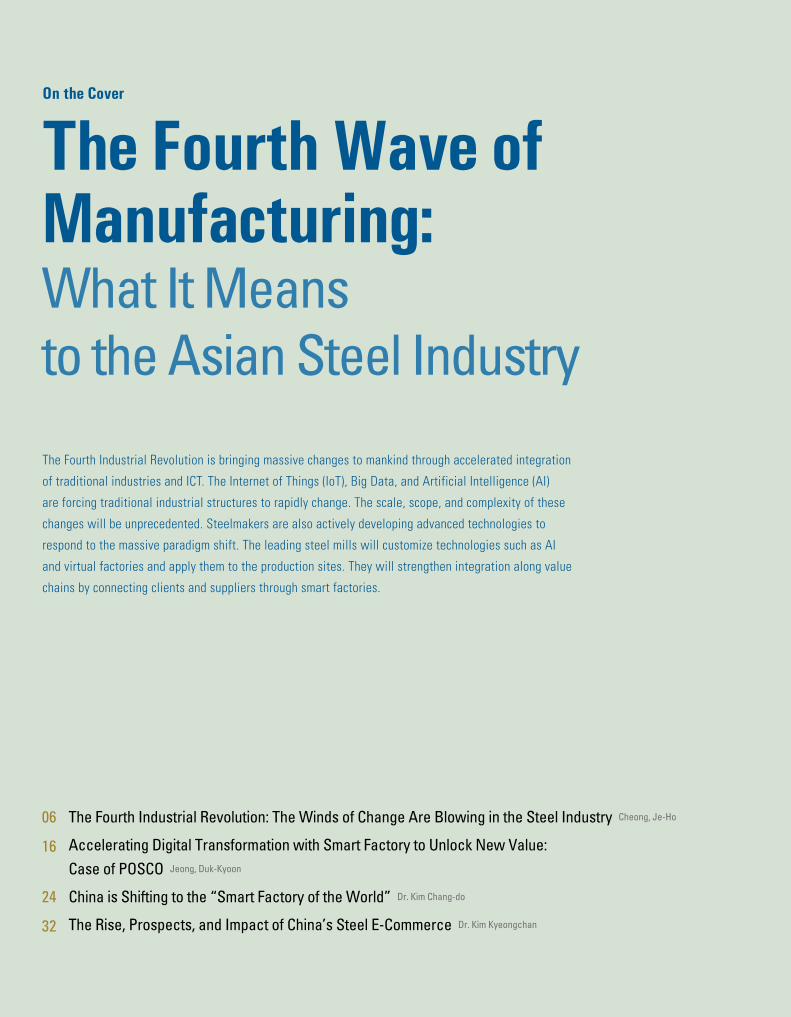
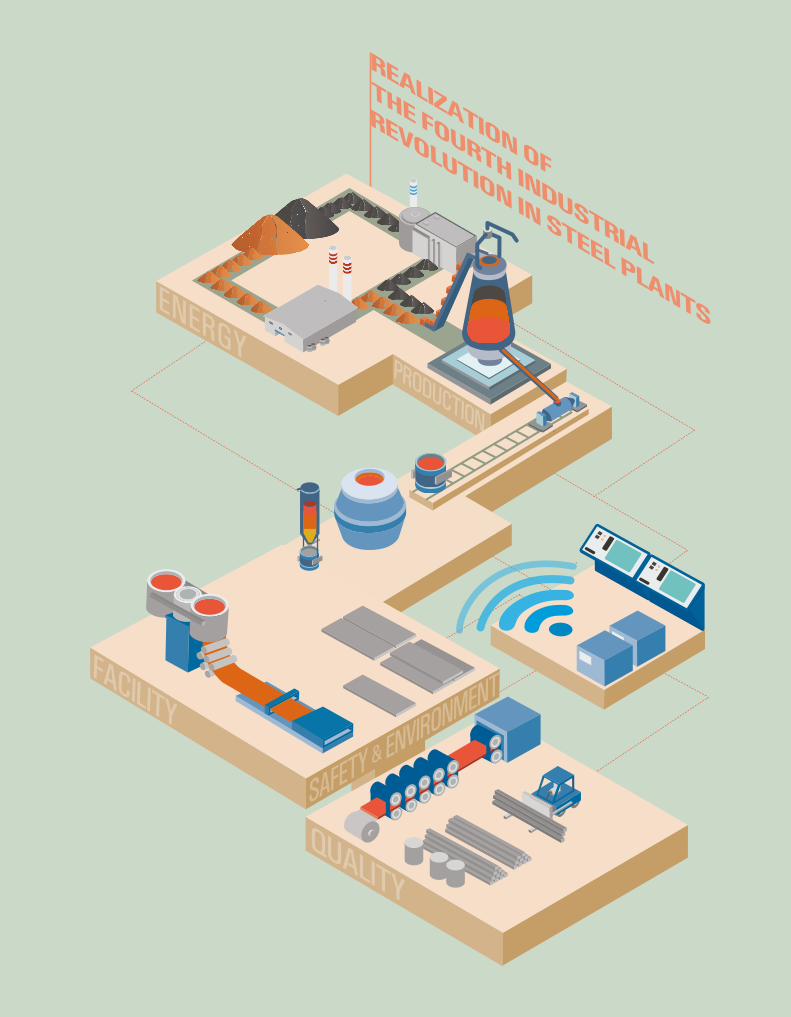
The Fourth Wave of Manufacturing: What It Means to the Asian Steel Industry
The Fourth Industrial Revolution is bringing massive changes to mankind through accelerated integration
of traditional industries and ICT. The Internet of Things (IoT), Big Data, and Artificial Intelligence (AI)
are forcing traditional industrial structures to rapidly change. The scale, scope, and complexity of these
changes will be unprecedented. Steelmakers are also actively developing advanced technologies to
respond to the massive paradigm shift. The leading steel mills will customize technologies such as AI
and virtual factories and apply them to the production sites. They will strengthen integration along value
chains by connecting clients and suppliers through smart factories.
Vol.02 October 2016 5
The Fourth Industrial Revolution: The Winds of Change Are Blowing in the Steel Industry
Vol.02 October 2016 5
The Fourth Industrial Revolution: The Winds of Change Are Blowing in the Steel Industry
6 Asian Steel Watch
The Fourth Industrial Revolution: The Winds of Change Are Blowing in the Steel Industry
“Mastering the Fourth Industrial Revolution” was
the official theme of the World Economic Forum,
held in Davos, Switzerland early this year. The
news from this forum was that boundaries be-
tween the digital, physical, and biological spheres
will disappear, and the convergence of technol-
ogies will be expedited, ushering in a new era of
unprecedented experiences for humanity.
We are already experiencing enormous chang-
es. With accelerating technological innovation
across industries, the landscape of traditional
industries is changing, as are the value chains
and market players of traditional industries. The
steel industry is no exception. What fundamental
changes can we anticipate? How will they affect
manufacturing, and what must the steel industry
do to prepare?
Traditional industries on the brink of collapse
Over 100 years elapsed between the First In-
dustrial Revolution, which was triggered by the
advent of steam engines, and the Second Indus-
trial Revolution, which was characterized by the
use of electricity and conveyor belts. Another 60
years passed before the Third Industrial Revolu-
tion, which was brought on by the invention of
personal computers and the Internet. Now, after
only 20-30 years, the world is facing the Fourth
Industrial Revolution.
Change is ever-accelerating and its impact is
ever-stronger. In the midst of the Fourth Indus-
trial Revolution, which is characterized by big
data, the Internet of Things (IoT), artificial intelli-
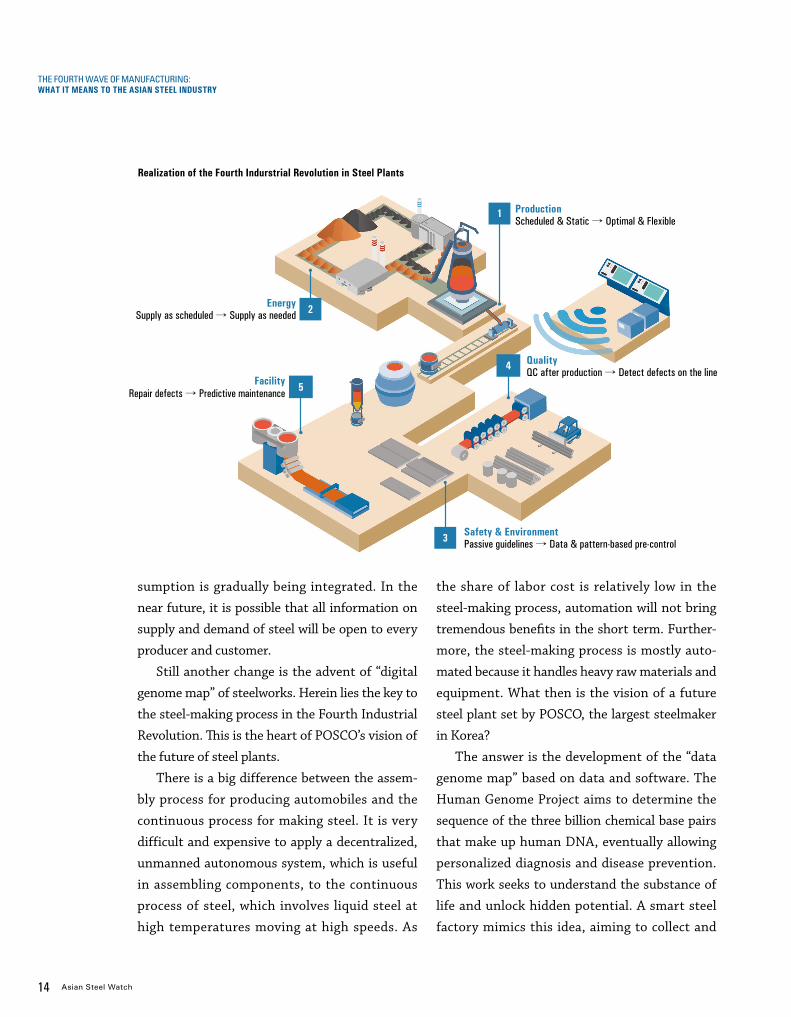
Operation Pre-scheduled production → Real-time adaptive production
QualityReactive average quality control → Real-time on-the-spot quality control
Safety Passive safety guidelines → Active preventive safety
Energy Fixed Allocation → Demand-based Allocation
Table 2. Changes Implemented by Smart Factory
22 Asian Steel Watch
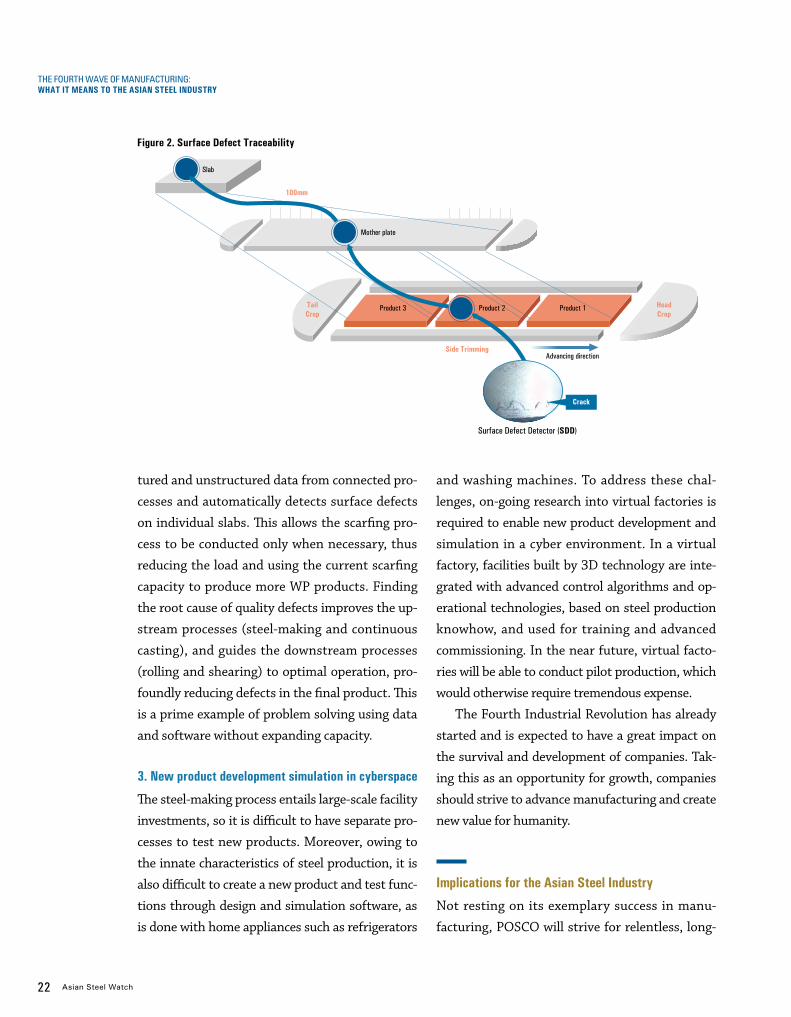
tured and unstructured data from connected pro-
cesses and automatically detects surface defects
on individual slabs. This allows the scarfing pro-
cess to be conducted only when necessary, thus
reducing the load and using the current scarfing
capacity to produce more WP products. Finding
the root cause of quality defects improves the up-
stream processes (steel-making and continuous
casting), and guides the downstream processes
(rolling and shearing) to optimal operation, pro-
foundly reducing defects in the final product. This
is a prime example of problem solving using data
and software without expanding capacity.
3. New product development simulation in cyberspace
The steel-making process entails large-scale facility
investments, so it is difficult to have separate pro-
cesses to test new products. Moreover, owing to
the innate characteristics of steel production, it is
also difficult to create a new product and test func-
tions through design and simulation software, as
is done with home appliances such as refrigerators
and washing machines. To address these chal-
lenges, on-going research into virtual factories is
required to enable new product development and
simulation in a cyber environment. In a virtual
factory, facilities built by 3D technology are inte-
grated with advanced control algorithms and op-
erational technologies, based on steel production
knowhow, and used for training and advanced
commissioning. In the near future, virtual facto-
ries will be able to conduct pilot production, which
would otherwise require tremendous expense.
The Fourth Industrial Revolution has already
started and is expected to have a great impact on
the survival and development of companies. Tak-
ing this as an opportunity for growth, companies
should strive to advance manufacturing and create
new value for humanity.
Implications for the Asian Steel Industry
Not resting on its exemplary success in manu-
facturing, POSCO will strive for relentless, long-
Slab
Figure 2. Surface Defect Traceability
Mother plate
Product 3 Product 2 Product 1TailCrop
HeadCrop
Side TrimmingAdvancing direction
100mm
Surface Defect Detector (SDD)
Crack
THE FOURTH WAVE OF MANUFACTURING:WHAT IT MEANS TO THE ASIAN STEEL INDUSTRY
Accelerating Digital Transformation with Smart Factory to Unlock New Value: Case of POSCO
Vol.02 October 2016 23
term innovation in order to become a role model
for the advancement of global manufacturing.
Many Asian steelmakers are also actively devel-
oping advanced technologies to respond to the
massive paradigm shift caused by the Fourth
Industrial Revolution. In cooperation with indus-
try, academia and research, the leading steel mills
will continue to develop technologies such as AI
and virtual factories and apply them to produc-
tion sites. They will strengthen integration along
value chains by connecting clients and suppliers
through smart factories.
Figure 3. Slab Quality Prediction Using Big Data Analytics
Quality Prediction Model
1) HCR: Hot Charge Rolling, 2) CCR: Cold Charge Rolling
Pass
Fail
Downstream process data
ScarfingCCR² Shift
Feed forward control (Work guidance)
Rolling/ShearingHCR¹ injection
Big data analysis(Data learning)
Quality prediction/determination
(Prediction model)
Operational guide(Smart Control)
Moltensteel
Slab
Feed back control (Remove root cause of defect)
Upstream process data
Steel-making Continuous castingSteel-making
Figure 4. Training and Commissioning in a Virtual Factory
Real Plant
Virtual Plant
PLC
24 Asian Steel Watch
Dr. Kim Chang-doSenior Principal Researcher, POSCO Research [email protected]
China is Shifting to the “Smart Factory of the World”
China’s manufacturing industry has maintained
high growth over the past thirty years, and China
became the world’s largest manufacturing nation
in 2010. In many industries, including steel, half
of global production comes from China. China
became the “factory of the world.” Grappling with
issues like rising labor costs, export slowdown,
and overcapacity, however, the growth of China’s
manufacturing slowed significantly in the last
several years. In some industries struggling with
overcapacity, including steel and shipbuilding,
operation rate is just 60-70% and profitability has
fallen. Some companies have massive profit loss-
es. Under these circumstances, the Chinese gov-
ernment and companies have taken great pains
to tackle the difficult situation, turning their eyes
to the Fourth Industrial Revolution and the rise
of smart factories in advanced manufacturing
countries.
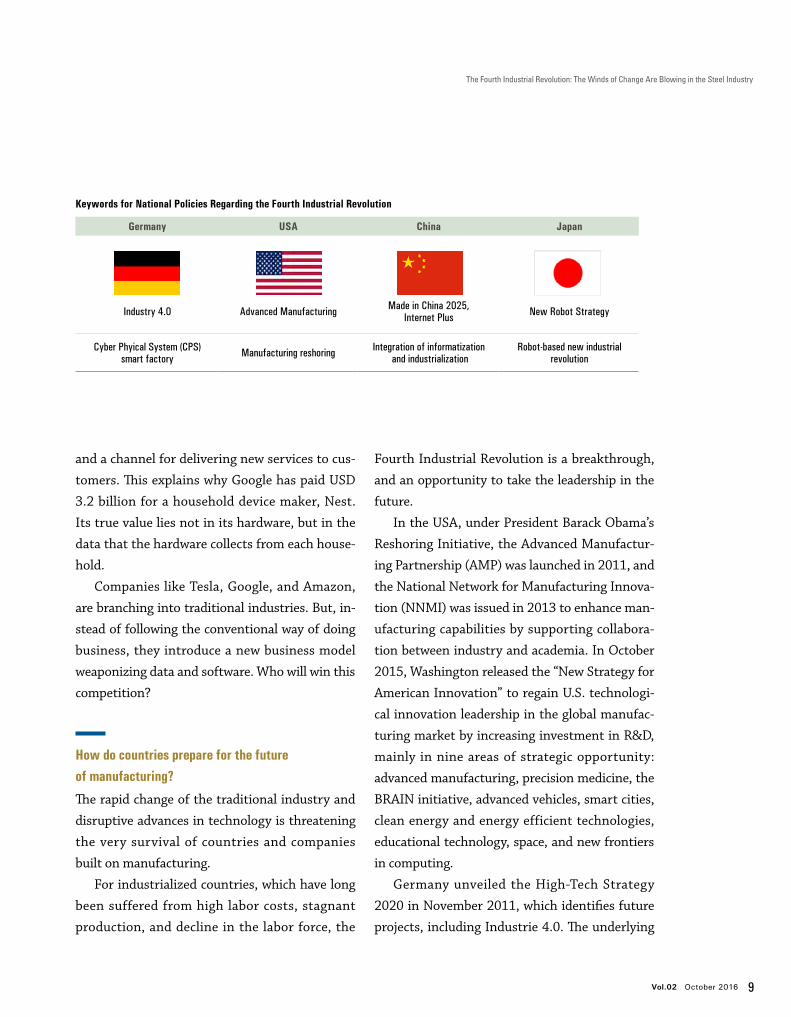
“Made in China 2025” and “Internet Plus”
To prepare for the Fourth Industrial Revolution,
represented by “Industry 4.0” in Germany and
“Industrial Internet” in the USA, the Chinese
government released the “Made in China 2025”
policy in May 2015 and the “Internet Plus” ac-
tion plan two months later. Chinese companies
have a growing interest in Industry 4.0, smart
factories, and cyber-physical systems (CPS) and
are following government policy directions.
The concept of “Internet Plus” was first pro-
posed by Premier Li Keqiang in his government
work report at the meeting of the National Peo-
ple’s Congress of the People’s Republic of China
on March 5, 2015. According to the Xinhua News,
the official press agency of China, the action plan
will integrate mobile Internet, cloud computing,
big data and the Internet of Things(IoT) with
modern manufacturing to encourage the healthy
development of e-commerce, industrial networks,
and Internet finance, and to help Internet com-
panies increase their international presence. This
means that China hopes to make the most of the
world’s largest population of Internet and mobile
phone users.
THE FOURTH WAVE OF MANUFACTURING:WHAT IT MEANS TO THE ASIAN STEEL INDUSTRY
Vol.02 October 2016 25
China is Shifting to the “Smart Factory of the World”
The “Made in China 2025” plan has five basic
directions: ▲ innovation-driven, ▲ emphasizing
quality over quantity, ▲ green development,
▲ optimizing the structure of Chinese industry,
and ▲ talent-oriented. Of these, the Chinese
government is putting the utmost emphasis on
innovation. The plan also suggests four guid-
ing principles: ▲ market-oriented and govern-
ment-guided, ▲ based on the present and having
a long-term perspective, ▲ comprehensively
pressing forward and making breakthroughs in
key areas, and ▲ independent development and
win-win cooperation. In addition, nine objectives
have been identified, including upgrading the
manufacturing sector to boost manufacturing
innovation, and deep integration of informatiza-
tion and industrialization.
The plan also sets forth implementation
guidelines for five key projects: ▲ construction
of a national manufacturing innovation center,
▲ smart manufacturing, ▲ strengthening indus-
trial base, ▲ green manufacturing, and ▲ high-
end equipment innovation. China has selected
ten priority sectors, including new advanced
information technology, high-end computer nu-
meric control (CNC) machine tools, and robotics.
To ensure the realization of the plan, the Chi-
nese government has announced eight actions
for policy improvement: ① deepening reform of
systems and mechanisms, ② creating a fair and
competitive market environment, ③ enhancing
financial support policies, ④ expanding the level
of support in fiscal and taxation policy, ⑤ devel-
oping a multi-tier personnel training system, ⑥ improving policies for small and medium-sized
enterprises, ⑦ further opening China’s man-
ufacturing sector to foreign investment, and ⑧ strengthening the mechanisms for organiza-
tion and implementation.
It is important to note that the “Made in
Areas Goals
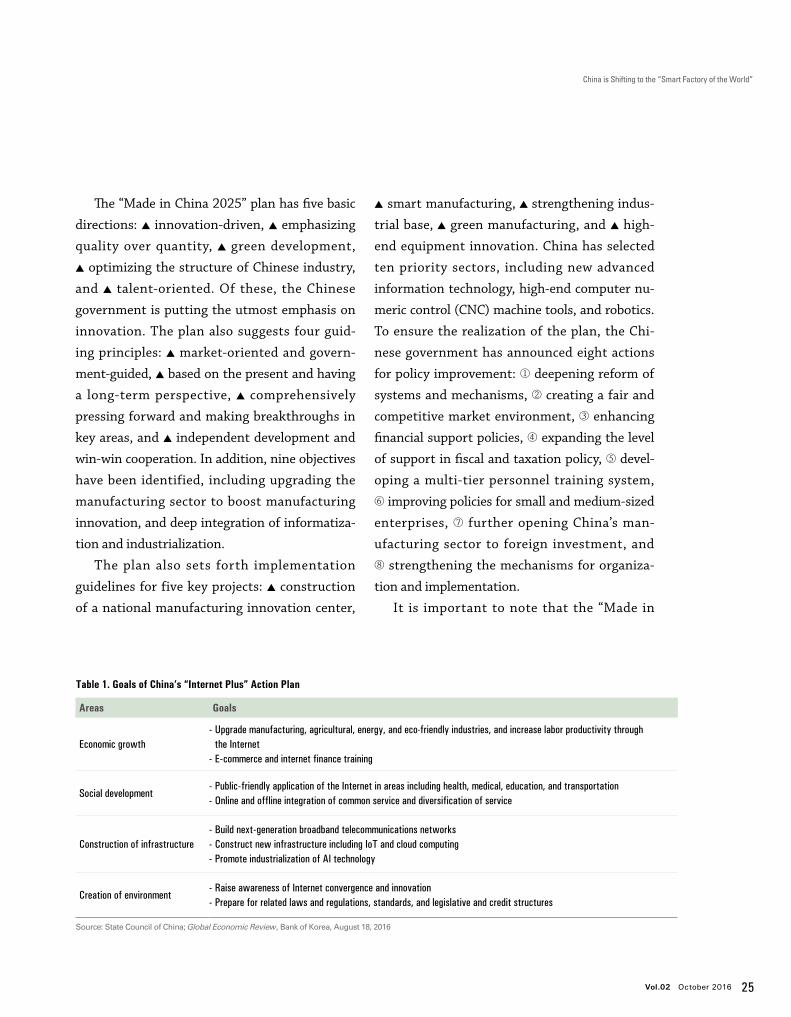
Economic growth- Upgrade manufacturing, agricultural, energy, and eco-friendly industries, and increase labor productivity through the Internet- E-commerce and internet finance training
Social development- Public-friendly application of the Internet in areas including health, medical, education, and transportation- Online and offline integration of common service and diversification of service
Construction of infrastructure- Build next-generation broadband telecommunications networks- Construct new infrastructure including IoT and cloud computing- Promote industrialization of AI technology
Creation of environment- Raise awareness of Internet convergence and innovation- Prepare for related laws and regulations, standards, and legislative and credit structures
Table 1. Goals of China’s “Internet Plus” Action Plan
Source: State Council of China; Global Economic Review, Bank of Korea, August 18, 2016
26 Asian Steel Watch
China 2025” plan is the first step in a three-
stage plan to make China a strong manufactur-
ing and innovation nation. China has classified
the world’s powerful manufacturing and innova-
tion nations into three tiers: the USA comprises
the first tier, Germany and Japan are in the sec-
ond tier, and the UK, France, Korea, and China
are in the third tier. China aims first to become
a second-tier nation by 2025. The second step is
to be able to compete with developed manufac-
turing powers like Germany and Japan to take
the lead in the second tier, by 2035. The third
step is for China to join the ranks of the world’s
top leading manufacturing powers, and be on
par with the USA, by 2049—the 100th anniver-
sary of the founding of the People’s Republic of
China.
Through the “Internet Plus” action plan and
“Made in China 2025” policy, China is trying to
climb on the bandwagon of the Fourth Indus-
trial Revolution, and even take the lead in this
global phenomenon. Taking the new industrial
revolution as an opportunity, China aims to
leverage its influence in neighboring countries
under the “One Belt, One Road” initiative un-
veiled in March 2015. In other words, the “Inter-
net Plus” action plan and “Made in China 2025”
policy encompass not only the concepts behind
Germany’s “Industry 4.0” and US-led “Industri-
al Internet,” but also China’s medium- to long-
Figure 1. Three-stage Plan for Becoming a Strong Manufacturing and Innovation Nation
*9 Tasks: ① Upgrading the manufacturing sector to boost the ability in manufacturing innovation, ② integrating informatization and industrialization, ③ strengthening the industrial base, ④ fostering Chinese brands, ⑤ enforcing green manufacturing, ⑥ promoting breakthroughs in 10 priority sectors, ⑦ advancing restructuring of the manufacturing sector, ⑧ promoting service-oriented manufacturing and manufacturing-related service industries, and ⑨ internationalizing manufacturing
*10 Priority Sectors:① New advanced information technology, ② High-end numeric control machine tools and robotics, ③ Aerospace equipment, ④ Ocean engineering and high-tech ships, ⑤ Modern rail transport equipment, ⑥ Energy saving and new energy vehicles, ⑦ Power equipment, ⑧ Agricultural machinery, ⑨ New materials, and ⑩ Biopharma and high performance medical devices
THE FOURTH WAVE OF MANUFACTURING:WHAT IT MEANS TO THE ASIAN STEEL INDUSTRY
Made in China 2025 (’15~’25) Developed manufacturing power (’26~’35)
Innovative leading manufacturer (’36~’49)
• Increase core competitiveness and labor productivity through integration of manufacturing and the Internet • Enter the world’s second-tier manufacturing group (Germany, Japan, and China) • 5 basic directions and 9 tasks* • 5 key projects and 10 priority sectors* • 4 guiding principles and strategic support in 8 areas
• Compete with developed manufacturing nations • Lead global markets in advantageous industries • Take the lead in the the second-tier manufacturing group (China, Germany, and Japan)
• Secure advanced competitiveness in key industries • Lead the global market innovatively • Enter the first-tier manufacturing group
Vol.02 October 2016 27
China is Shifting to the “Smart Factory of the World”
term strategies of boosting manufacturing and
innovation capabilities, achieving industrial
sophistication, and increasing China’s influence
overseas.
As the “factory of the world,” China has been
solidifying its position in manufacturing. If it
succeeds in integrating and utilizing the Inter-
net and artificial intelligence (AI) technology in
manufacturing, China will find new opportuni-
ties. In particular, smart factories, a key concept
of Industry 4.0, could alter the future of China’s
troubled manufacturing industry.
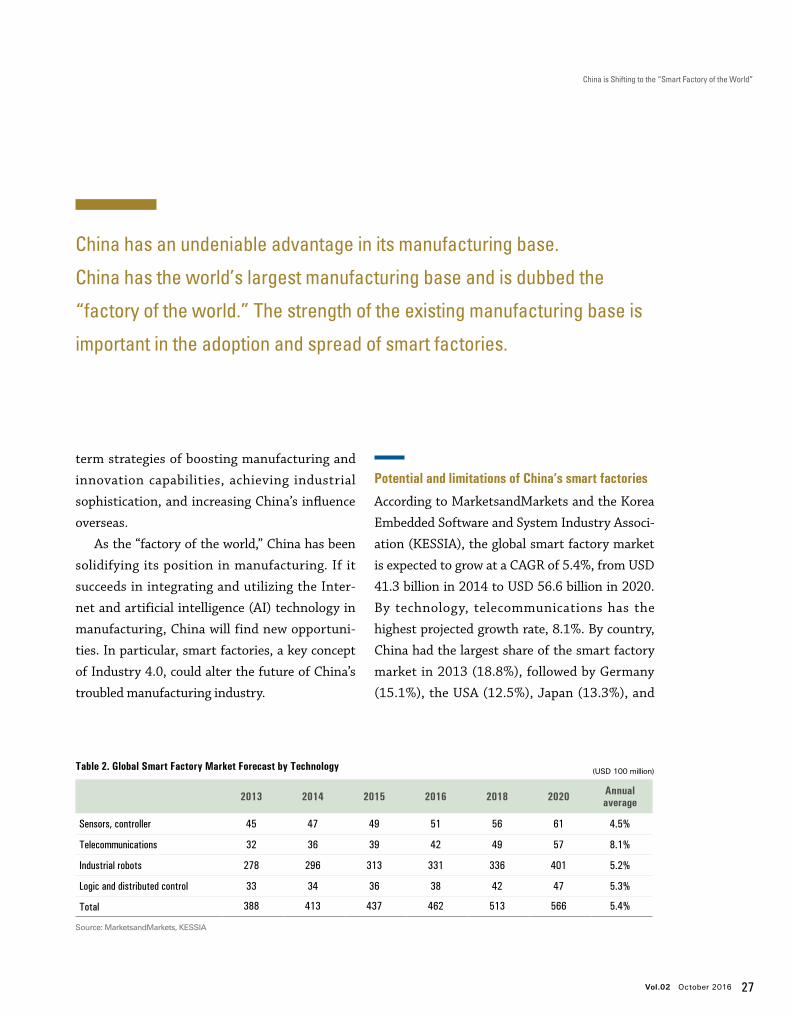
Potential and limitations of China’s smart factories
According to MarketsandMarkets and the Korea
Embedded Software and System Industry Associ-
ation (KESSIA), the global smart factory market
is expected to grow at a CAGR of 5.4%, from USD
41.3 billion in 2014 to USD 56.6 billion in 2020.
By technology, telecommunications has the
highest projected growth rate, 8.1%. By country,
China had the largest share of the smart factory
market in 2013 (18.8%), followed by Germany
(15.1%), the USA (12.5%), Japan (13.3%), and
2013 2014 2015 2016 2018 2020 Annual average
Sensors, controller 45 47 49 51 56 61 4.5%
Telecommunications 32 36 39 42 49 57 8.1%
Industrial robots 278 296 313 331 336 401 5.2%
Logic and distributed control 33 34 36 38 42 47 5.3%
Total 388 413 437 462 513 566 5.4%
Table 2. Global Smart Factory Market Forecast by Technology
Source: MarketsandMarkets, KESSIA
(USD 100 million)
China has an undeniable advantage in its manufacturing base.
China has the world’s largest manufacturing base and is dubbed the
“factory of the world.” The strength of the existing manufacturing base is
important in the adoption and spread of smart factories.
28 Asian Steel Watch
Korea (11.3%).
Smart factories involve various technologies:
control systems, such as sensors, programmable
logic controllers (PLC), and distributed control
systems (DCS), which monitor and conduct
manufacturing processes; and manufacturing
applications, including manufacturing execution
systems (MES), enterprise resource planning
(ERP), product lifecycle management (PLM),
and supply chain management (SCM). Sensors,
controllers, and manufacturing applications are
interconnected through big data, IoT, and cloud
platforms. The key aspect of a smart factory is
the construction of CPS, which integrate the
physical domain of manufacturing facilities and
the digital domain, including controlling and
communication.
In short, a smart factory is the integration of
existing manufacturing technologies and new
ICT. Therefore, the strength of the existing man-
ufacturing base is important in the adoption and
spread of smart factories. China has an undeni-
able advantage in its manufacturing base. China
has the world’s largest manufacturing base and
is dubbed the “factory of the world.” Therefore,
China has a bright future in the compilation of
big data, which is important in realizing smart
factories.
The Chinese government’s massive support
makes the prospect of smart factories even
brighter. It plans to designate two to three com-
panies in each industry to support the construc-
tion of smart factories. Government support in-
cludes subsidies, tax exemptions, and technology
development. The designated pilot companies
will receive support that will put them out ahead
of their global competitors.
Using its vast market as a bargaining chip in
summit diplomacy, China induces cooperation
from advanced global firms. As a result, China
can elicit technological support for smart facto-
ries from advanced countries. In March 2014,
Chinese President Xi Jingping held talks with
German Chancellor Angela Merkel in Berlin, and
they agreed to upgrade bilateral relations to an
all-round strategic partnership. After several
subsequent rounds of meetings, they agreed to
forge ahead with the advancement of the Fourth
Industrial Revolution. During his state visit to
Germany in November 2014, Chinese Premier Li
Keqiang announced the “Outlines for China-Ger-
many Cooperation: Joint Innovation,” and agreed
to promote China-Germany cooperation in In-
dustry 4.0.
Chinese companies are also seeking global
cooperation in Industry 4.0. In June 2016, in
the presence of Chinese Premier Li Keqiang and
German Chancellor Merkel, the presidents of
Baosteel Group Corporation and Siemens AG
signed “the strategic agreement of intelligent
manufacturing (Industry 4.0).” Furthermore,
Siemens employed the system of Amberg’s
smart factory in Siemens Electronic Works
Chengdu (SEWC), which began operation in
September 2013. SEWC is the first digital firm
that Siemens established outside Germany and
the USA.
Considering the experience and technology of
Chinese manufacturing, however, there is a long
way to go before smart factories gain ground in
THE FOURTH WAVE OF MANUFACTURING:WHAT IT MEANS TO THE ASIAN STEEL INDUSTRY
Vol.02 October 2016 29
China is Shifting to the “Smart Factory of the World”
China. First of all, Chinese manufacturers have
different degrees of advancement when it comes
to manufacturing bases. The level of most Chi-
nese firms falls between Industry 2.0 and Indus-
try 3.0. The prevailing opinion is that it is more
urgent to upgrade to Industry 3.0 than to adopt
smart factories.
Moreover, China still lags behind advanced
countries in terms of the technological ability
to build and analyze big data and CPS. Most im-
portantly, China lacks the experts necessary to
introduce and realize smart factories. For these
reasons, the Chinese government is emphasizing
innovation and the nurturing of talent.
Phased implementation of China’s smart factory
Considering this reality, Chinese experts have
suggested the concept of smart factory 1.0 and
insisted on phased implementation. Wang Jian,
Secretary General of the China Science & Tech-
nology Automation Alliance presented “smart
factory 1-2-3” as a development model for smart
factories. The “1” means to raise capability to ac-
cumulate and analyze big data, the key element
of smart factories. The “2” is to ① form an alliance
between smart equipment manufacturers and
consumer goods manufacturers and ② integrate
digital manufacturing and smart manufactur-
ing. The “3” refers to a threefold integration—
horizontal, vertical, and lifecycle integration,
ultimately building CPS through the integration
of the physical domain and the digital domain.
Based on these steps, Wang proposes that China
announce “smart factory 1.0” for the time being,
spend the next five years building the basis for
smart factories, and implement “smart factory 2.0
and 3.0” after 2020.
A comparison with advanced countries, in-
cluding the USA and Germany, illuminates Chi-
na’s need for phased implementation of smart
factories. In the USA, enterprises formed part-
nerships with the government to build the basis
for smart factories, focusing on the development
of new ICT, including big data, data analysis, vir-
tual reality systems, and IoT. In Germany, enter-
Due to the technology gap and varying levels of advancement among
the manufacturing bases of steelmakers, the Chinese steel industry needs
to employ selection and concentration, and phased implementation
of smart factories.
30 Asian Steel Watch
prises with strong manufacturing bases led the
introduction of smart factories in the early phase,
but soon faced limitations. Motived by the coop-
eration between enterprises and the government
in the USA, Germany now seeks private-public
implementation of smart factories. On the oth-
er hand, China’s policy direction dictates that
companies implement government initiatives
for smart factories. With the different levels of
advancement among companies, the Chinese
government has adopted the selection and con-
centration strategy, concentrating support on
leading companies in each industry.
Thanks to the Chinese government’s efforts,
leading companies in some industries seem to
be close to the realization of smart factories. If
these companies see tangible results, the spread
of smart factories will be expedited and leap sev-
eral stages. According to Chinese media, China’s
largest home appliance company, Haier, is the
first home appliance company to have a smart
factory. In 2015, Haier established four inter-
net-based smart factories, including the refrig-
erator factory at Shenyang in Liaoning province.
At this plant, the 100-meter production line was
replaced by four production lines of 18 meters
each. Hundreds of parts are automatically sorted
and grouped according to pre-set data. The facto-
ry enables mass production of various products
to meet customer needs in a timely manner. As
a result, the factory has reduced its workforce by
57%, increased production capacity by 80%, and
cut time-to-market and delivery lead time by
47%. Also in the automotive sector such leading
automakers as Changchun, Yiqi, and Shanghai
Volkswagen are gearing up to introduce smart
factories.
The response of Chinese steelmakers and upcoming challenges for the global steel industry
The spread of smart factories brings new wind
to the Chinese steel industry. In a mire of over-
capacity and strict environmental regulations,
steelmakers are losing profitability, and are
threatened by drastic restructuring. Under these
Just as the explosive growth of China’s steel industry has shocked the world in the early
21st century, the world might be shocked again by China, if it successfully adopts
Industry 4.0 and smart factories in the future.
THE FOURTH WAVE OF MANUFACTURING:WHAT IT MEANS TO THE ASIAN STEEL INDUSTRY
Vol.02 October 2016 31
China is Shifting to the “Smart Factory of the World”
circumstances, smart factories could bring new
momentum to the steel industry. Some leading
Chinese steelmakers have already automated
production facilities, because these are the con-
tinuous process. They will be able to realize smart
factories simply by integrating new ICT with
existing facilities to build CPS. This is why some
steelmakers are actively trying to adopt smart
factories.
Shanghai Meishan Iron and Steel (Meigang), a
subsidiary of Baosteel Group, has already includ-
ed smart manufacturing in its medium- to long-
term strategy, and is implementing this strategy
in phases. Baosteel is poised to move beyond
smart factories to lead smart manufacturing in
the steel industry. Baosteel’s ambitious e-com-
merce platform, Ouyeel, is not just for simple
online transactions, but a platform for collecting
and analyzing big data on customers and mar-
kets. In this sense, the steel e-commerce boom
that began in China last year linked to Industry
4.0. Shanxi-based private steelmaker Shanxi Ji-
anbang Group has adopted smart factories and is
implementing the “5+1+1” online model. The “5”
refers to smart inventory, smart logistics, smart
procurement, smart sales, and smart recycling,
and the two “1”s represent smart manufacturing
and smart finance.
Due to the technology gap and varying lev-
els of advancement among the manufacturing
bases of steelmakers, the Chinese steel industry
needs to employ selection and concentration, and
phased implementation of smart factories. The
level of development with regard to smart facto-
ries depends on the relative size and competitive-
ness of the company. Small and medium -sized
steelmakers will focus on the early stages of
automation and management of manufacturing
records and defect logs. Steelmakers of middle
standing will concentrate on facility management
using sensors, and collection and management
of real-time production information. Large steel-
makers will pursue real-time system connection
and real-time automation control of their smart
factories using PLC. In addition, some mega-sized
steelmakers will aim for multifunctional intelli-
gence, wired and wireless communication with
AI, and autonomous production of facilities and
systems. In particular, leading steelmakers with
well-established manufacturing bases will in-
crease investments in smart factory-related tech-
nologies, including big data, CPS, smart sensors,
IoT, cloud computing, and gear up to develop
these technologies.
In conclusion, the phased introduction of In-
dustry 4.0 and smart factories will revitalize Chi-
nese manufacturing and create an opportunity for
China to shift from the “factory of the world” to
the “smart factory of the world.”
However, it would take much time and energy
to fully realize smart factories in China’s manu-
facturing and steel industries. Despite mounting
difficulties, a promising path lies ahead for Chi-
na. Just as the explosive growth of China’s steel
industry has shocked the world in the early 21st
century, the world might be shocked again by
China, if it successfully adopts Industry 4.0 and
smart factories in the future. Now the global steel
industry should pay close attention to the rise of
Industry 4.0 and smart factories in China.
32 Asian Steel Watch
The Rise, Prospects, and Impact of China’s Steel E-Commerce
Dr. Kim Kyeongchan Vice President of Corporate Strategy Department POSCO
Steel e-commerce is gaining ground in China.
One might overlook this as part of the global
spread of e-commerce. However, much atten-
tion is being paid to the spread of China’s steel
e-commerce that could be a renowned trading
platform in Asia though advanced countries
have already experienced the rise and fall of
steel e-commerce.
In the late 1990s when “dot-com” fever
swept the world, the first steel e-commerce
boom began. Steelmakers, steel distributors,
and venture capitalists in major steel-producing
countries, including the USA, Japan, Europe-
an countries, and Korea, led the expansion of
e-commerce.
However, the boom was short-lived for sever-
al reasons. Profit models were inadequate given
the massive investments made, and the charac-
teristics of steel trade were not fully reflected
in online trade. Moreover, entry barriers were
raised for traditional offline distributors (See
Table 1).
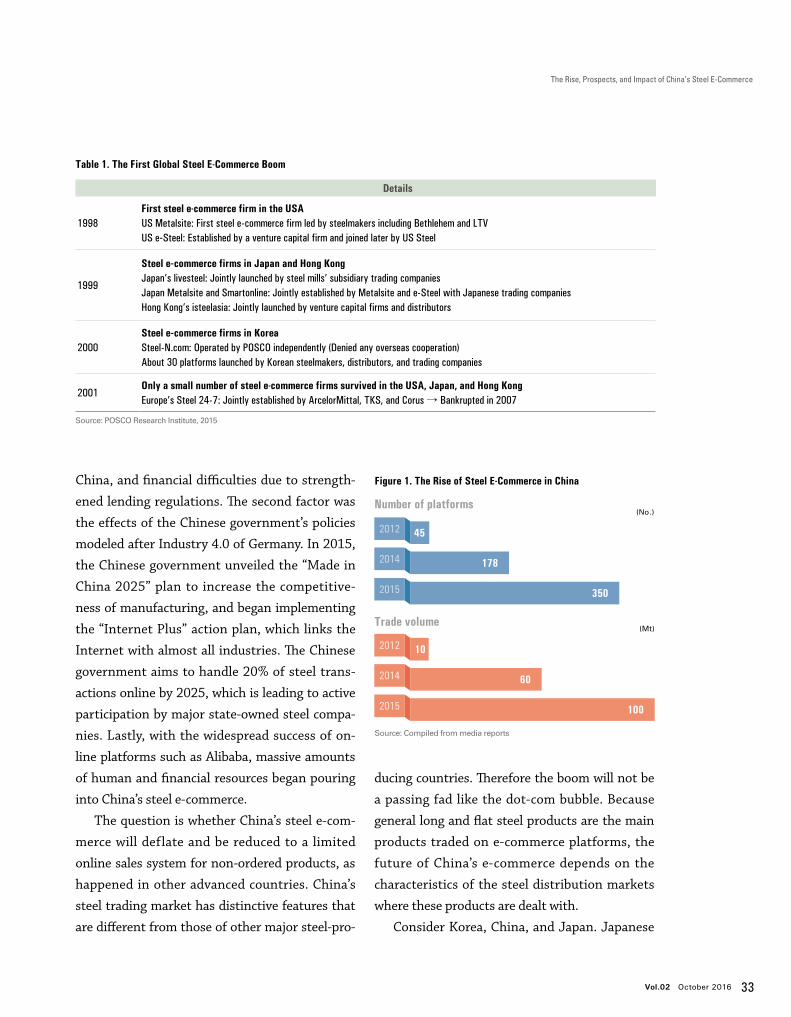
Background and sustainability of China’s steel e-commerce boom
Ten years later, a second steel e-commerce boom
began in China. The number of steel e-commerce
platforms increased eight-fold and the transac-
tion amount increased ten-fold from 2012 to
2015 (See Figure 1).
The rapid growth of China’s steel e-commerce
was caused by three factors that collectively in-
tensified competition in online platforms: the
changing landscape of the steel trading market
due to a slump in China’s steel industry; China’s
“Internet Plus” and other related policies; and an
online fever across the industry. The first factor
was the declining number of Chinese steel distrib-
utors giving rise to new business opportunities.
The number of Chinese steel distributors reached
200,000 in 2012, but fell by half to 100,000 in
2014. This is attributed to management difficul-
ties caused by sagging steel prices following a
decline in steel production and consumption in
THE FOURTH WAVE OF MANUFACTURING:WHAT IT MEANS TO THE ASIAN STEEL INDUSTRY
Vol.02 October 2016 33
The Rise, Prospects, and Impact of China’s Steel E-Commerce
Table 1. The First Global Steel E-Commerce Boom
Details
1998First steel e-commerce firm in the USAUS Metalsite: First steel e-commerce firm led by steelmakers including Bethlehem and LTVUS e-Steel: Established by a venture capital firm and joined later by US Steel
1999
Steel e-commerce firms in Japan and Hong KongJapan’s livesteel: Jointly launched by steel mills’ subsidiary trading companies Japan Metalsite and Smartonline: Jointly established by Metalsite and e-Steel with Japanese trading companiesHong Kong’s isteelasia: Jointly launched by venture capital firms and distributors
2000 Steel e-commerce firms in KoreaSteel-N.com: Operated by POSCO independently (Denied any overseas cooperation)About 30 platforms launched by Korean steelmakers, distributors, and trading companies
2001Only a small number of steel e-commerce firms survived in the USA, Japan, and Hong Kong Europe’s Steel 24-7: Jointly established by ArcelorMittal, TKS, and Corus → Bankrupted in 2007
Source: POSCO Research Institute, 2015
2012
2014
2015
Trade volume
10
60
100
(Mt)
Source: Compiled from media reports
Figure 1. The Rise of Steel E-Commerce in China
Number of platforms
350
2012
2014
2015
(No.)
45
178
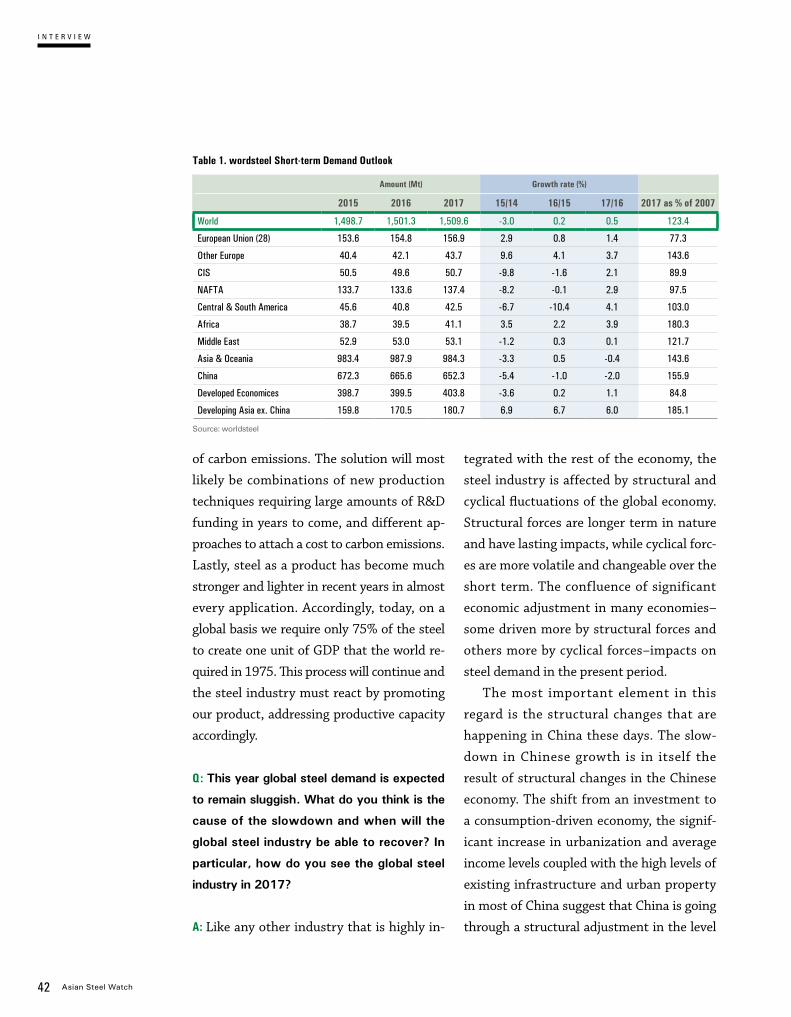
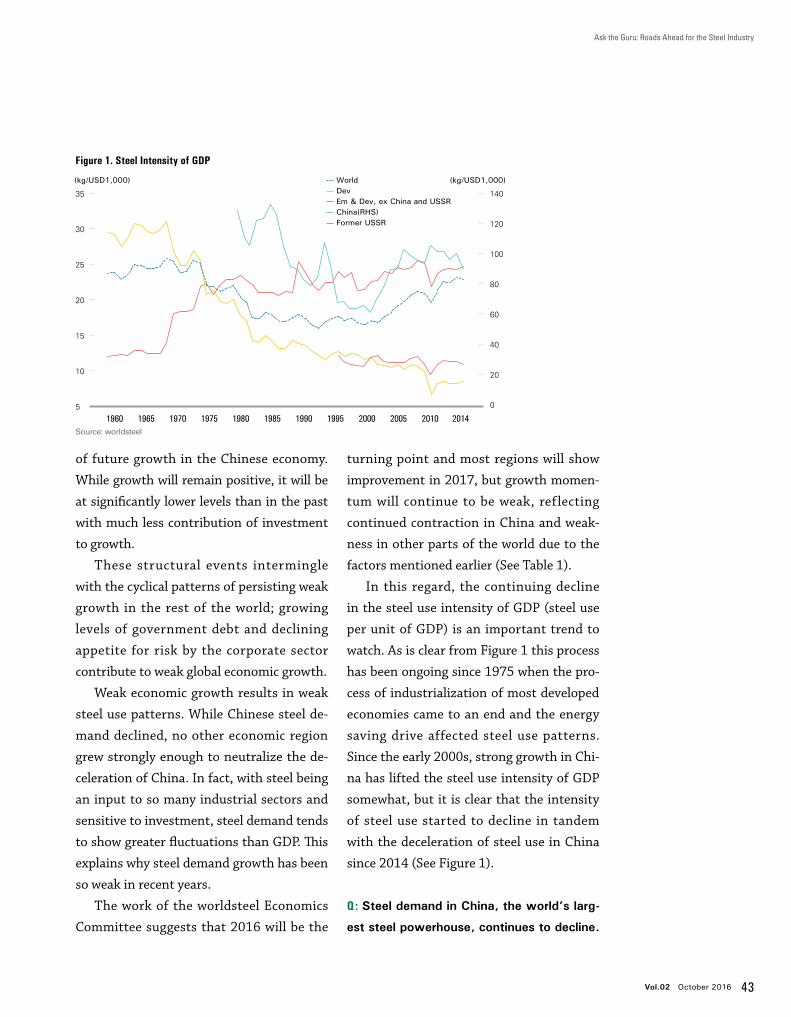
ducing countries. Therefore the boom will not be
a passing fad like the dot-com bubble. Because
general long and flat steel products are the main
products traded on e-commerce platforms, the
future of China’s e-commerce depends on the
characteristics of the steel distribution markets
where these products are dealt with.
Consider Korea, China, and Japan. Japanese
China, and financial difficulties due to strength-
ened lending regulations. The second factor was
the effects of the Chinese government’s policies
modeled after Industry 4.0 of Germany. In 2015,
the Chinese government unveiled the “Made in
China 2025” plan to increase the competitive-
ness of manufacturing, and began implementing
the “Internet Plus” action plan, which links the
Internet with almost all industries. The Chinese
government aims to handle 20% of steel trans-
actions online by 2025, which is leading to active
participation by major state-owned steel compa-
nies. Lastly, with the widespread success of on-
line platforms such as Alibaba, massive amounts
of human and financial resources began pouring
into China’s steel e-commerce.
The question is whether China’s steel e-com-
merce will deflate and be reduced to a limited
online sales system for non-ordered products, as
happened in other advanced countries. China’s
steel trading market has distinctive features that
are different from those of other major steel-pro-
34 Asian Steel Watch
so to strengthen their footholds, and venture
capital and information consulting firms branch
into e-commerce to take new business opportu-
nities. These are the four main market players in
competition. In terms of expertise in steel, steel-
makers have an advantage because they produce
steel products and hold processing and logistics
networks. Next are distributors, which have
processing and logistics capabilities and market
demand base. Venture capital and information
consulting firms are regarded as having less ex-
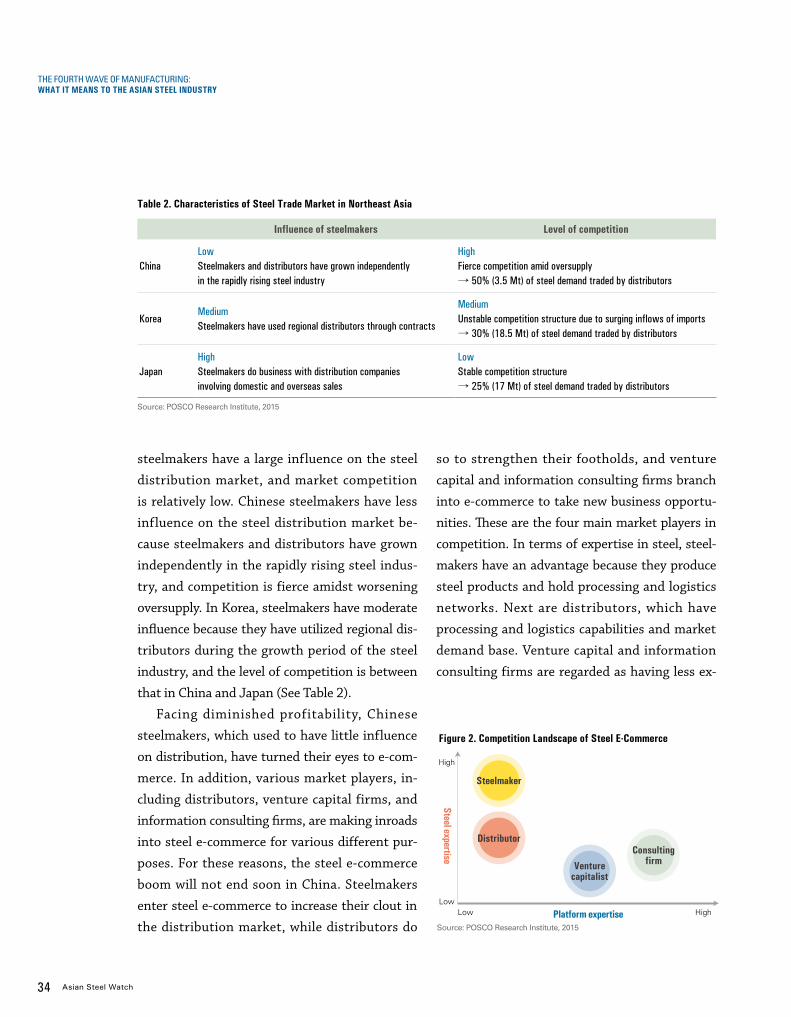
Figure 2. Competition Landscape of Steel E-Commerce
Source: POSCO Research Institute, 2015
Steel expertise
Platform expertise
High
HighLow
Low
Steelmaker
Distributor
Venturecapitalist
Consultingfirm
Table 2. Characteristics of Steel Trade Market in Northeast Asia
Influence of steelmakers Level of competition
ChinaLowSteelmakers and distributors have grown independently in the rapidly rising steel industry
HighFierce competition amid oversupply → 50% (3.5 Mt) of steel demand traded by distributors
KoreaMediumSteelmakers have used regional distributors through contracts
MediumUnstable competition structure due to surging inflows of imports → 30% (18.5 Mt) of steel demand traded by distributors
JapanHighSteelmakers do business with distribution companies involving domestic and overseas sales
LowStable competition structure → 25% (17 Mt) of steel demand traded by distributors
Source: POSCO Research Institute, 2015
steelmakers have a large influence on the steel
distribution market, and market competition
is relatively low. Chinese steelmakers have less
influence on the steel distribution market be-
cause steelmakers and distributors have grown
independently in the rapidly rising steel indus-
try, and competition is fierce amidst worsening
oversupply. In Korea, steelmakers have moderate
influence because they have utilized regional dis-
tributors during the growth period of the steel
industry, and the level of competition is between
that in China and Japan (See Table 2).
Facing diminished profitability, Chinese
steelmakers, which used to have little influence
on distribution, have turned their eyes to e-com-
merce. In addition, various market players, in-
cluding distributors, venture capital firms, and
information consulting firms, are making inroads
into steel e-commerce for various different pur-
poses. For these reasons, the steel e-commerce
boom will not end soon in China. Steelmakers
enter steel e-commerce to increase their clout in
the distribution market, while distributors do
THE FOURTH WAVE OF MANUFACTURING:WHAT IT MEANS TO THE ASIAN STEEL INDUSTRY
Vol.02 October 2016 35
The Rise, Prospects, and Impact of China’s Steel E-Commerce
pertise in steel. However, they have an advantage
in terms of expertise in e-commerce platforms,
while steelmakers and distributors have a relative
disadvantage. Notably, venture capital firms with
strong financing capabilities have an advantage,
as they can make intensive investments from the
beginning (See Figure 2).
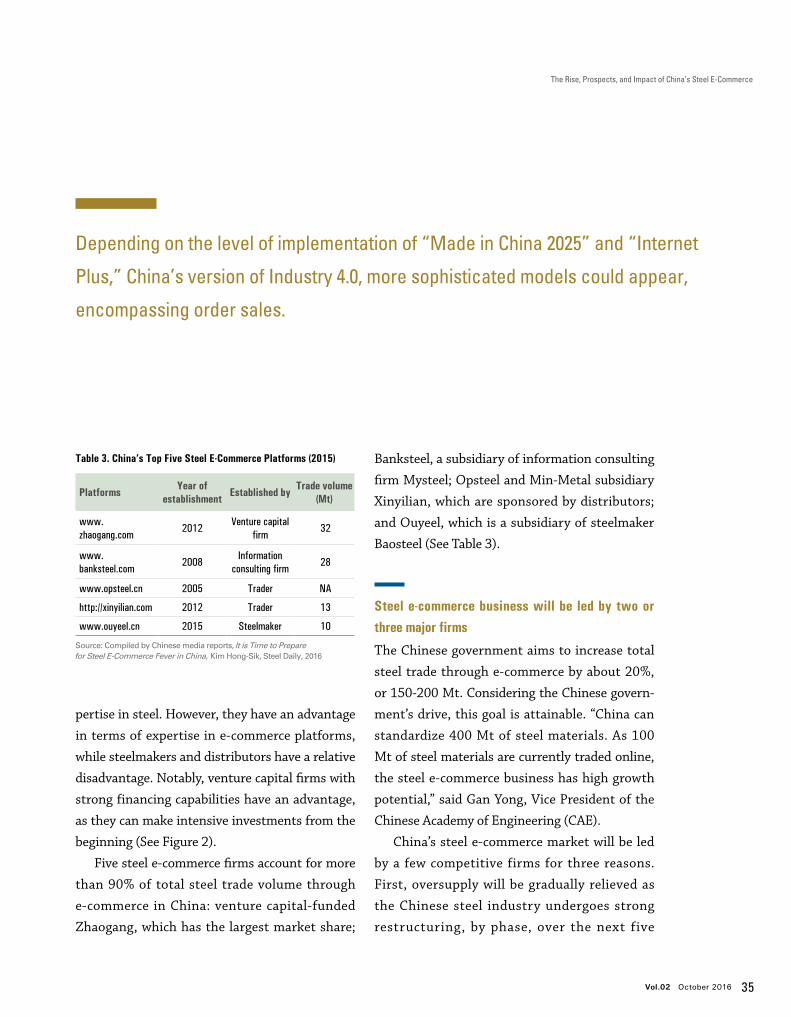
Five steel e-commerce firms account for more
than 90% of total steel trade volume through
e-commerce in China: venture capital-funded
Zhaogang, which has the largest market share;
Banksteel, a subsidiary of information consulting
firm Mysteel; Opsteel and Min-Metal subsidiary
Xinyilian, which are sponsored by distributors;
and Ouyeel, which is a subsidiary of steelmaker
Baosteel (See Table 3).
Steel e-commerce business will be led by two or three major firms
The Chinese government aims to increase total
steel trade through e-commerce by about 20%,
or 150-200 Mt. Considering the Chinese govern-
ment’s drive, this goal is attainable. “China can
standardize 400 Mt of steel materials. As 100
Mt of steel materials are currently traded online,
the steel e-commerce business has high growth
potential,” said Gan Yong, Vice President of the
Chinese Academy of Engineering (CAE).
China’s steel e-commerce market will be led
by a few competitive firms for three reasons.
First, oversupply will be gradually relieved as
the Chinese steel industry undergoes strong
restructuring, by phase, over the next five
Depending on the level of implementation of “Made in China 2025” and “Internet
Plus,” China’s version of Industry 4.0, more sophisticated models could appear,
encompassing order sales.
Table 3. China’s Top Five Steel E-Commerce Platforms (2015)
Platforms Year of establishment Established by Trade volume
(Mt)
www.zhaogang.com
2012Venture capital
firm 32
www.banksteel.com
2008Information
consulting firm 28
www.opsteel.cn 2005 Trader NA
http://xinyilian.com 2012 Trader 13
www.ouyeel.cn 2015 Steelmaker 10
Source: Compiled by Chinese media reports, It is Time to Prepare for Steel E-Commerce Fever in China, Kim Hong-Sik, Steel Daily, 2016
36 Asian Steel Watch
years. Second, due to the persistence of unsta-
ble profit models, many steel e-commerce firms
face mounting difficulties. Third, as overheated
venture investment cools as a result of China’s
economic growth stabilizing at a medium rate,
companies that fail to get listed on the stock
market will rapidly disappear or be merged with
other companies.
There are various forecasts on the reorga-
nization of China’s steel e-commerce industry.
The Chinese government, which currently sup-
ports around 30 platforms, predicts that 5-10
platforms will survive over the next five years.
Zhaogang, BankSteel, and Ouyeel will become
the first-tier group, leading the reorganization
of the steel e-commerce market. The second-tier
group, mainly led by large distributors, including
Opsteel, will be the first target to be merged, and
the third-tier group, consisting of the remaining
smaller companies, will disappear or be incorpo-
rated into large platforms. Another forecast pre-
dicts that the steel e-commerce market will be led
by two big powers, considering the characteristics
of e-commerce business. Just like the e-com-
merce business for consumer goods, which is
led by two big companies, Taobao and Jingdong,
there is a possibility that the steel e-commerce
market will be led by two major parties: the steel-
makers and an alliance of third-party platforms.
China’s steel e-commerce platforms are grap-
pling with profitability, just as businesses in ad-
vanced steel-producing countries did in the past.
Except for Ouyeel, which posted a slight surplus
in 2015, Chinese steel e-commerce firms are run-
ning deficits. Their model is not to charge trans-
action fees, but to find cash cows in advertising,
logistics, finance, and information. To take the
lead in the market, they also seek quantitative
growth and plan initial public offerings (IPOs) in
one or two years. China’s steel e-commerce plat-
forms generally handle ordered and non-ordered
products of flat and long steels; and these prod-
ucts are mostly general products. They plan to
expand the scope of business from general steel
to high-quality steel, and from inventory sales to
order sales, however, this will be difficult given
Considering the size of the market, business opportunities, and profitability,
China’s steel e-commerce will not be just a fad. This will be especially true if
Chinese-style Industry 4.0 is reflected in the steel industry.
THE FOURTH WAVE OF MANUFACTURING:WHAT IT MEANS TO THE ASIAN STEEL INDUSTRY
Vol.02 October 2016 37
The Rise, Prospects, and Impact of China’s Steel E-Commerce
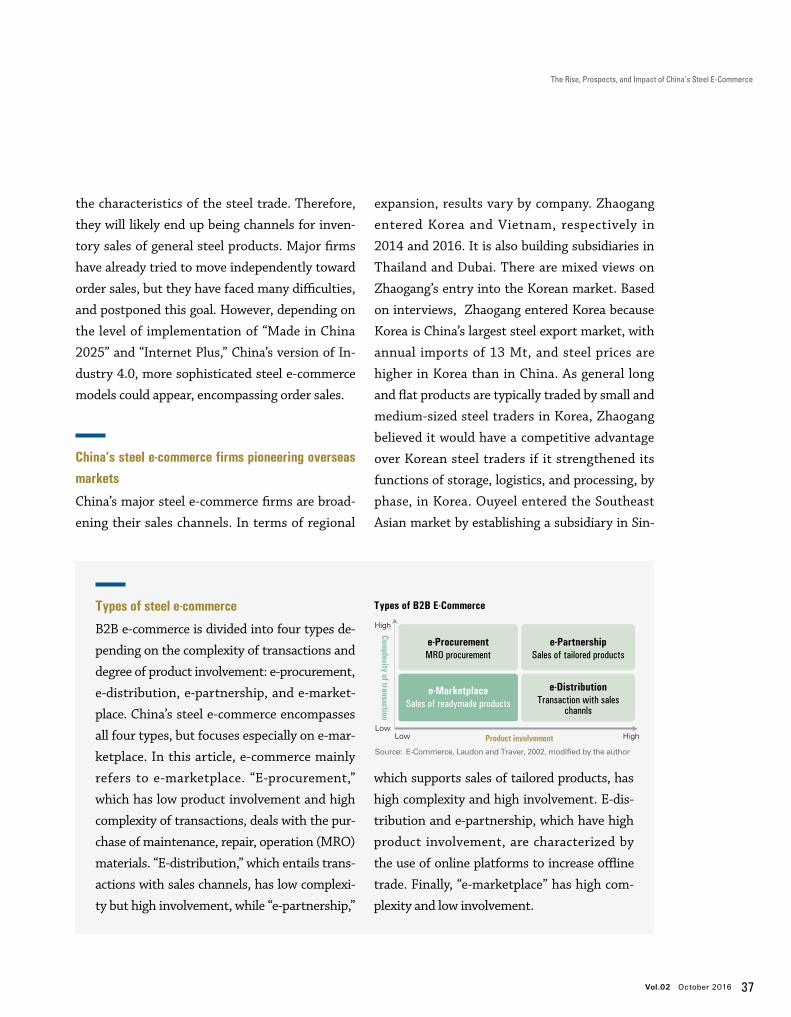
Types of steel e-commerce
B2B e-commerce is divided into four types de-
pending on the complexity of transactions and
degree of product involvement: e-procurement,
e-distribution, e-partnership, and e-market-
place. China’s steel e-commerce encompasses
all four types, but focuses especially on e-mar-
ketplace. In this article, e-commerce mainly
refers to e-marketplace. “E-procurement,”
which has low product involvement and high
complexity of transactions, deals with the pur-
chase of maintenance, repair, operation (MRO)
materials. “E-distribution,” which entails trans-
actions with sales channels, has low complexi-
ty but high involvement, while “e-partnership,”
which supports sales of tailored products, has
high complexity and high involvement. E-dis-
tribution and e-partnership, which have high
product involvement, are characterized by
the use of online platforms to increase offline
trade. Finally, “e-marketplace” has high com-
plexity and low involvement.
Types of B2B E-Commerce
Source: E-Commerce, Laudon and Traver, 2002, modified by the author
e-ProcurementMRO procurement
Complexity of transaction
Product involvement
e-PartnershipSales of tailored products
e-DistributionTransaction with sales
channls
High
LowLow High
e-MarketplaceSales of readymade products
the characteristics of the steel trade. Therefore,
they will likely end up being channels for inven-
tory sales of general steel products. Major firms
have already tried to move independently toward
order sales, but they have faced many difficulties,
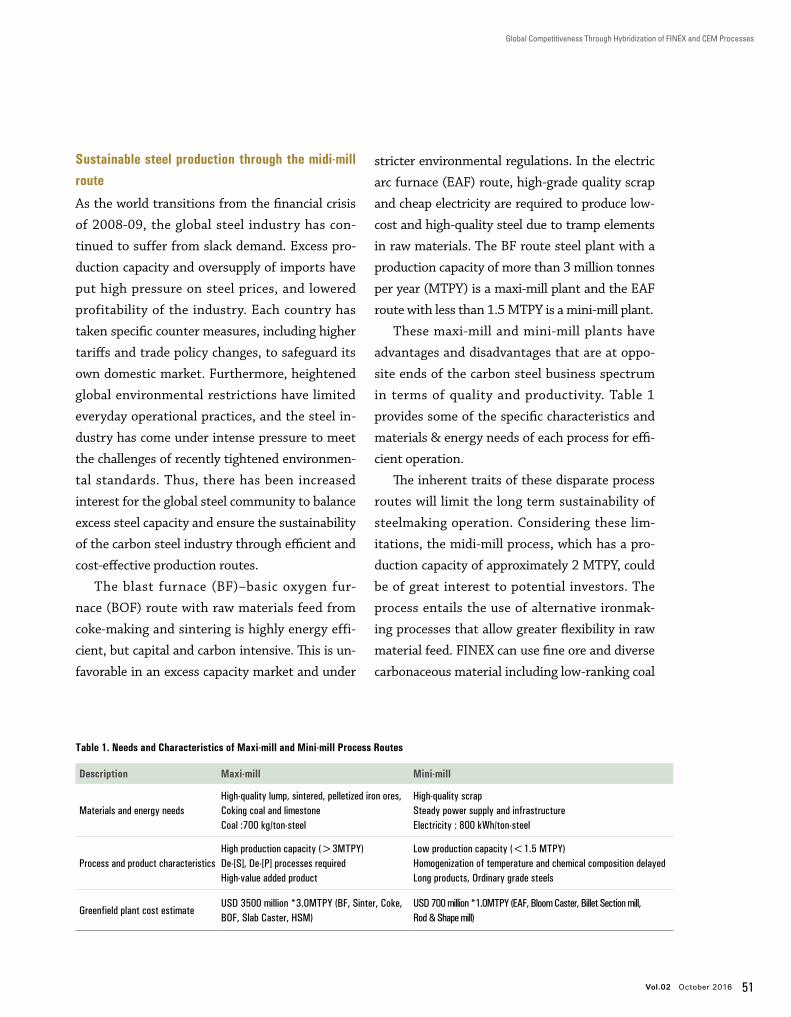
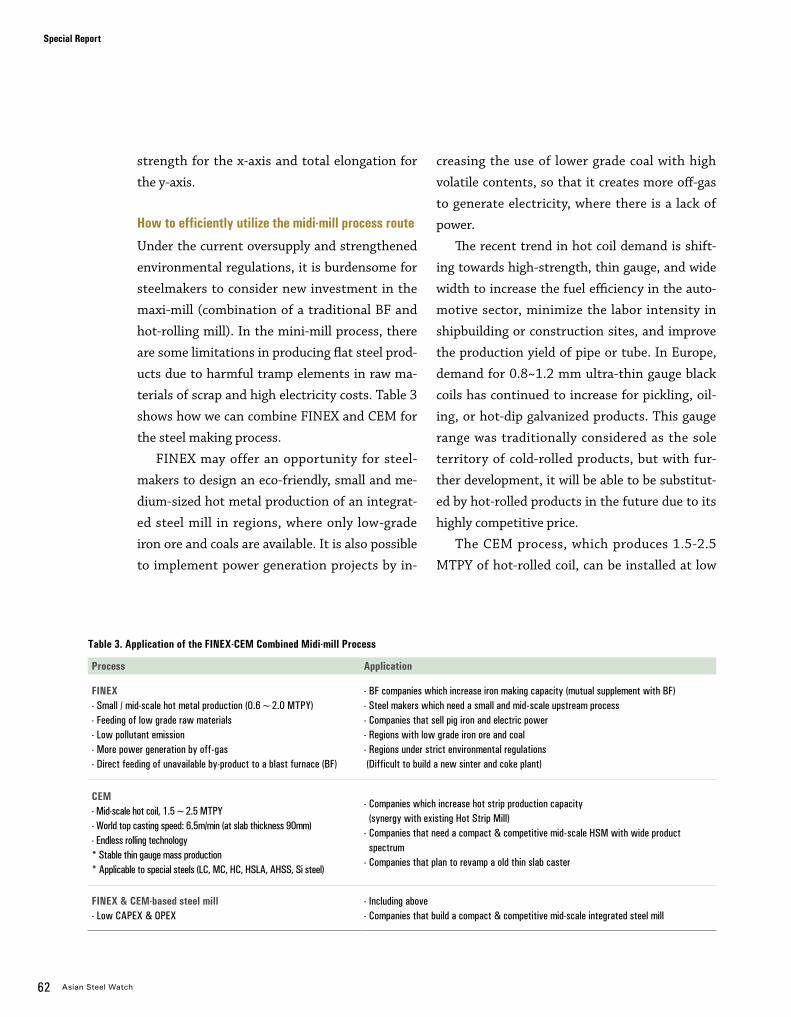
How to efficiently utilize the midi-mill process route
Under the current oversupply and strengthened
environmental regulations, it is burdensome for
steelmakers to consider new investment in the
maxi-mill (combination of a traditional BF and
hot-rolling mill). In the mini-mill process, there
are some limitations in producing flat steel prod-
ucts due to harmful tramp elements in raw ma-
terials of scrap and high electricity costs. Table 3
shows how we can combine FINEX and CEM for
the steel making process.
FINEX may offer an opportunity for steel-
makers to design an eco-friendly, small and me-
dium-sized hot metal production of an integrat-
ed steel mill in regions, where only low-grade
iron ore and coals are available. It is also possible
to implement power generation projects by in-
creasing the use of lower grade coal with high
volatile contents, so that it creates more off-gas
to generate electricity, where there is a lack of
power.
The recent trend in hot coil demand is shift-
ing towards high-strength, thin gauge, and wide
width to increase the fuel efficiency in the auto-
motive sector, minimize the labor intensity in
shipbuilding or construction sites, and improve
the production yield of pipe or tube. In Europe,
demand for 0.8~1.2 mm ultra-thin gauge black
coils has continued to increase for pickling, oil-
ing, or hot-dip galvanized products. This gauge
range was traditionally considered as the sole
territory of cold-rolled products, but with fur-
ther development, it will be able to be substitut-
ed by hot-rolled products in the future due to its
highly competitive price.
The CEM process, which produces 1.5-2.5
MTPY of hot-rolled coil, can be installed at low
Process Application
FINEX- Small / mid-scale hot metal production (0.6~2.0 MTPY)- Feeding of low grade raw materials - Low pollutant emission - More power generation by off-gas- Direct feeding of unavailable by-product to a blast furnace (BF)
- BF companies which increase iron making capacity (mutual supplement with BF) - Steel makers which need a small and mid-scale upstream process- Companies that sell pig iron and electric power - Regions with low grade iron ore and coal- Regions under strict environmental regulations (Difficult to build a new sinter and coke plant)
CEM- Mid-scale hot coil, 1.5~2.5 MTPY- World top casting speed: 6.5m/min (at slab thickness 90mm)- Endless rolling technology* Stable thin gauge mass production* Applicable to special steels (LC, MC, HC, HSLA, AHSS, Si steel)
- Companies which increase hot strip production capacity (synergy with existing Hot Strip Mill) - Companies that need a compact & competitive mid-scale HSM with wide product spectrum- Companies that plan to revamp a old thin slab caster
FINEX & CEM-based steel mill- Low CAPEX & OPEX
- Including above - Companies that build a compact & competitive mid-scale integrated steel mill
Table 3. Application of the FINEX-CEM Combined Midi-mill Process
Vol.02 October 2016 63
Global Competitiveness Through Hybridization of FINEX and CEM Processes
investment costs. It also has an advantage of
stable mass production in high-quality thin
gauge steel for various steel grades like LC, MC,
HC, HSLA, AHSS and even Si steel by the utili-
zation of high speed casting and endless rolling
technology. This is difficult for a conventional
hot-rolling mill, because of the sharp decline in
productivity, added operational troubles, and
poor quality in the head and tail portion of hot
coil.
If maxi-mills that operate only convention-
al hot-rolling mills in the CEM process adopts
FINEX, productivity can be remarkably in-
creased. Through the hybridization of the FINEX
and CEM processes, a midi-mill can have strong
competiveness by lowering capital expenditures
(CAPEX) and operating expenses (OPEX), and
can have a wide range of products in steel grades
and thickness. It will also allow significant flexi-
bility of raw material feeding.
The midi-mill process creating synergy with existingprocesses
Since 2008, the global steel industry has faced
unprecedented and unpredictable challenges
such as steel oversupply, protectionism, and
strict environmental regulations. In order to
overcome these barriers and ensure continued
steel sustainability, the existing maxi-mill and
mini-mill process routes cannot be a solution.
Instead, it is necessary to take advantage from
the individual maxi- and mini-mill processes and
minimize disadvantages to make a new sustain-
able process more agile to the dynamic business
surroundings. Thus, the 1.5-2 MTPY midi-mill
process route with disruptive technologies can
be an effective alternative, as it creates synergy
with existing processes.
FINEX and CEM are compact processes by
eliminating or combining the conventional
processes. They can reduce investment costs,
operational costs, and environmental emissions.
FINEX has more flexibility in raw materials and
operations than the blast furnace route and
higher productivity than the EAF route. CEM
can achieve high throughput and meet product
requirements by converting from batch rolling
to endless rolling. The midi-mill process route
of the FINEX and CEM combination can satisfy
the needs to build a steel plant which is medi-
um-scale, economically competitive, raw materi-
al and operational flexibility, and eco-friendly.
Acknowledgements
Special appreciation is warranted to Prof. Il
Sohn of the Department of Materials Science
and Engineering at Yonsei University for his
helpful comments and suggestions finalizing
this work.
The midi-mill process route of the FINEX and
CEM combination can satisfy the needs
to build a steel plant which is medium-scale,
economically competitive, raw material
and operational flexibility, and eco-friendly.
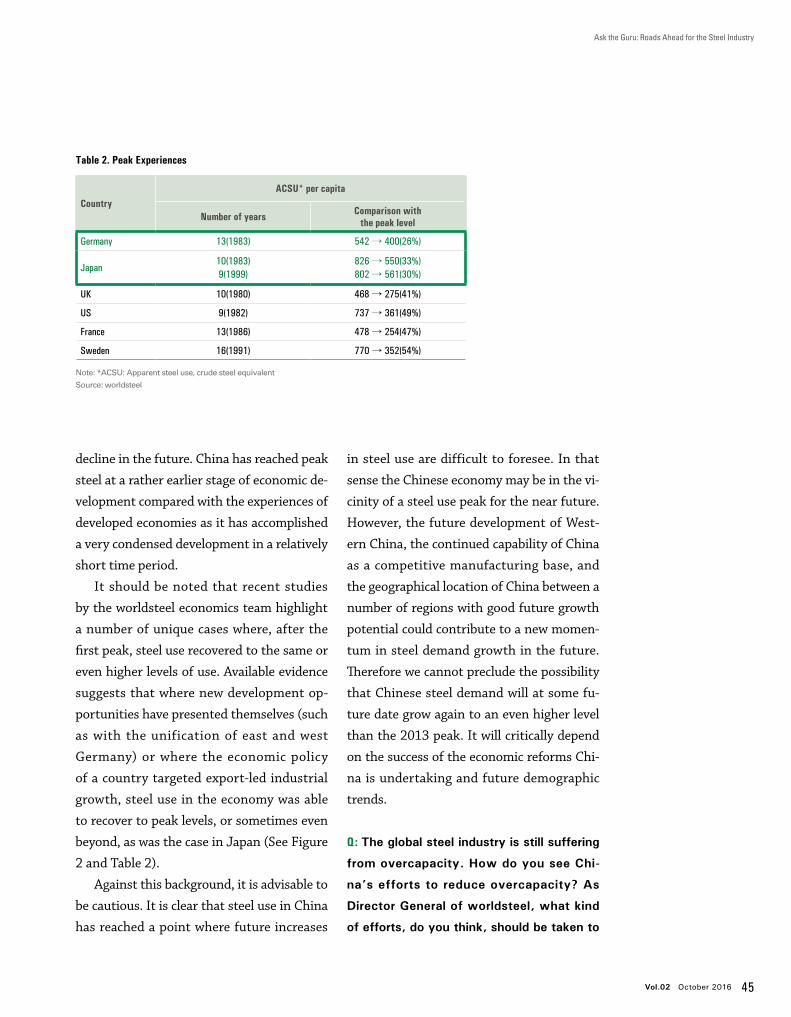
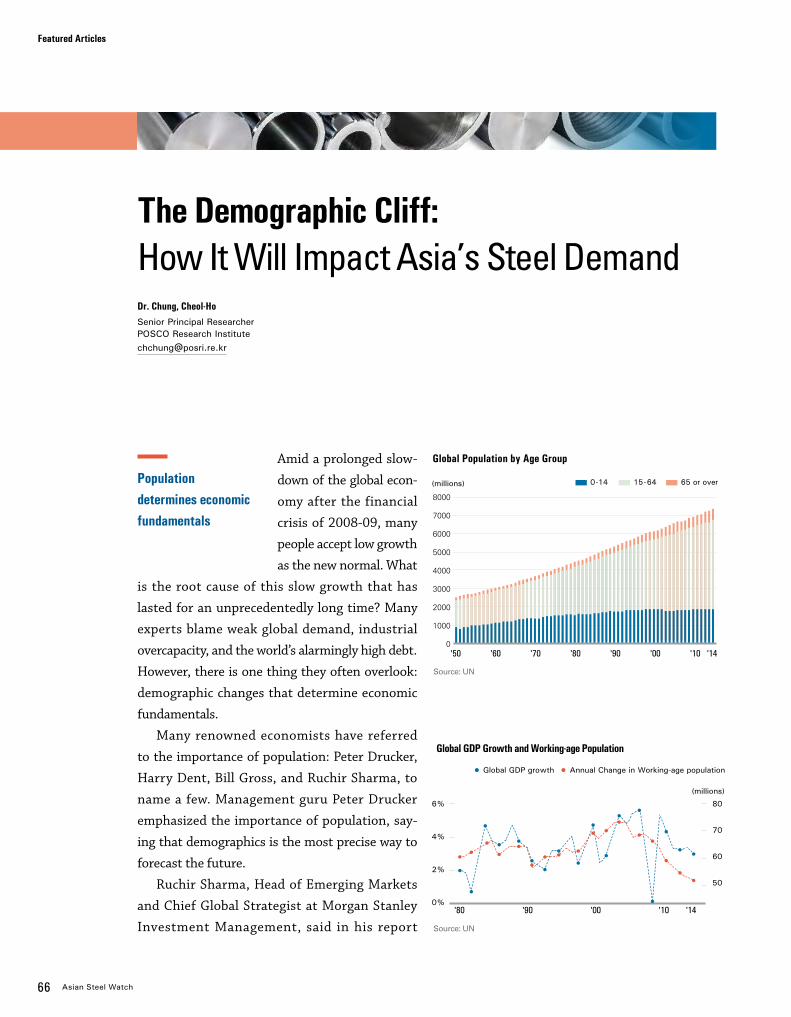
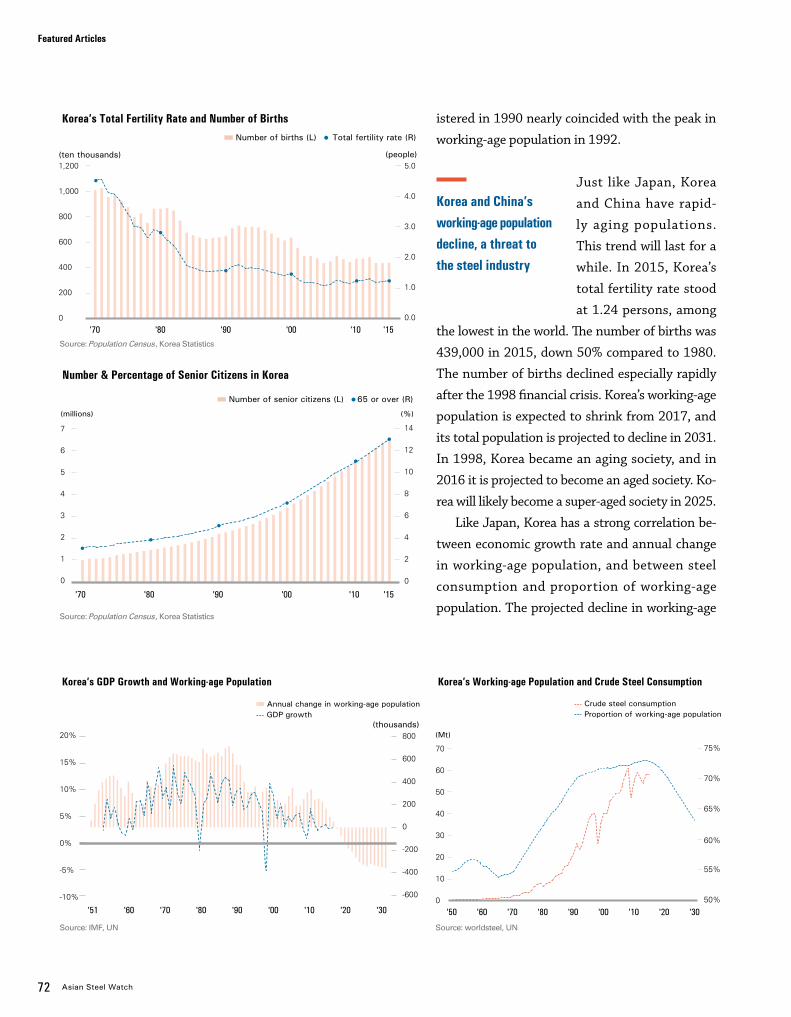
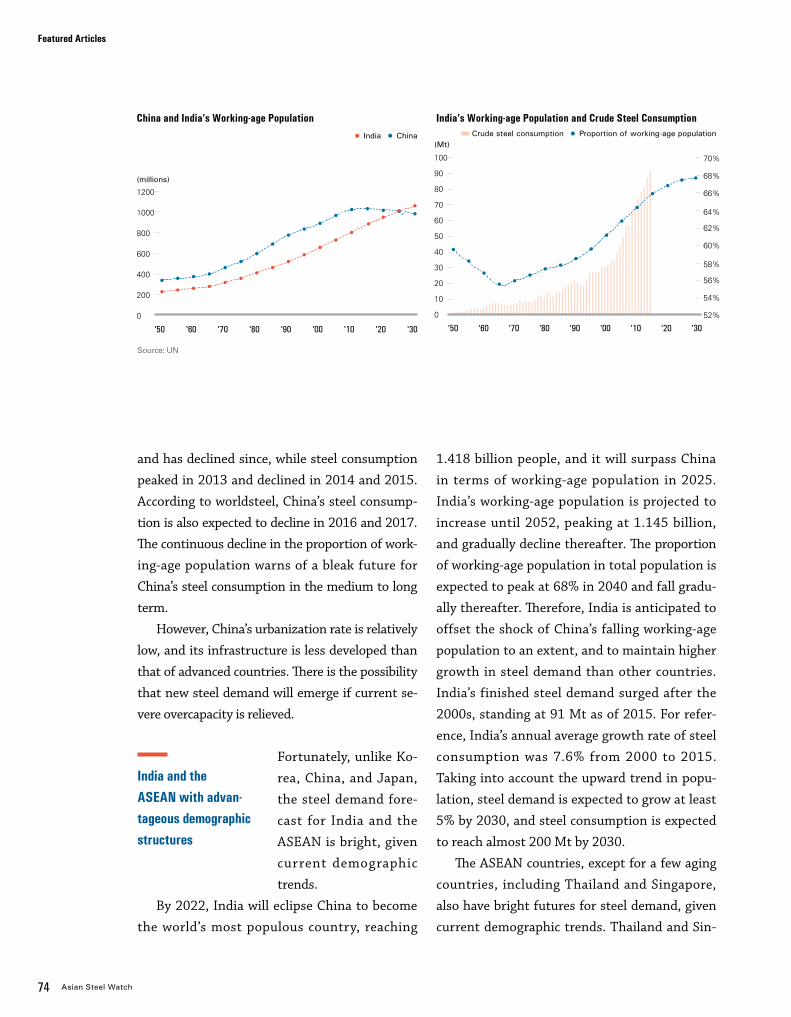
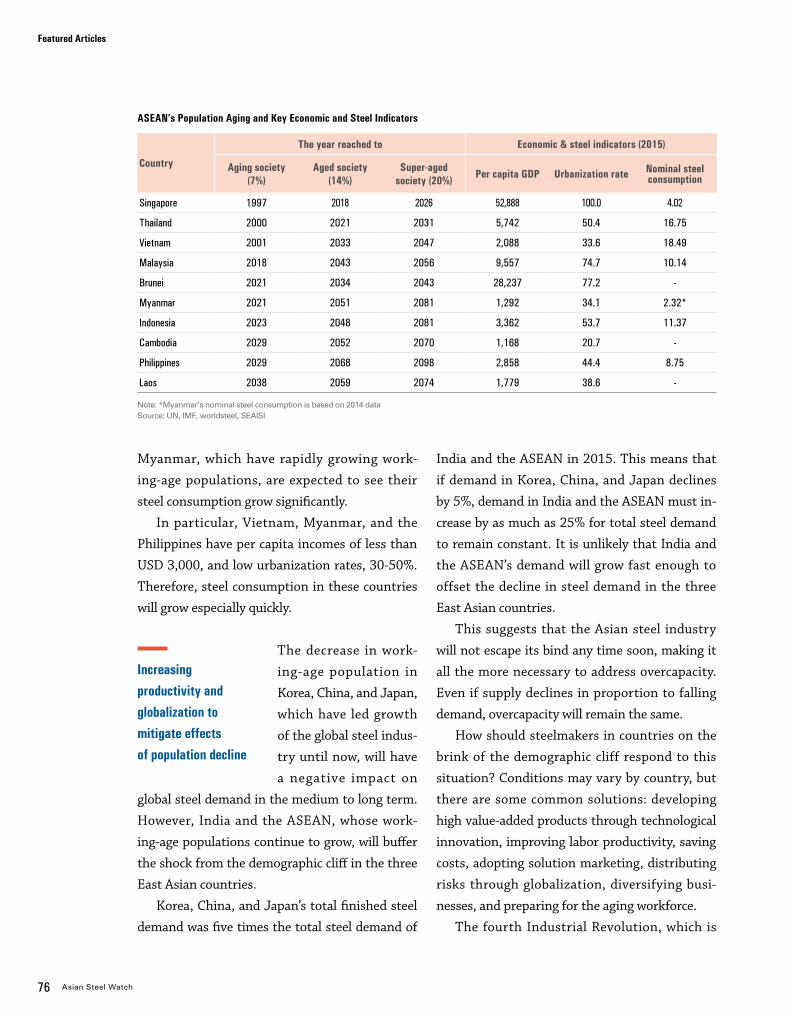
66 The Demographic Cliff: How It Will Impact Asia’s Steel Demand Dr. Chung, Cheol-Ho
78 Restructuring of the Chinese Steel Industry: Retrospects and Prospects Frank Zhong
88 Myanmar, the Last Frontier in the ASEAN, Will See High Growth of its Steel Industry Dr. Cho, Dae-Hyun
66 Asian Steel Watch
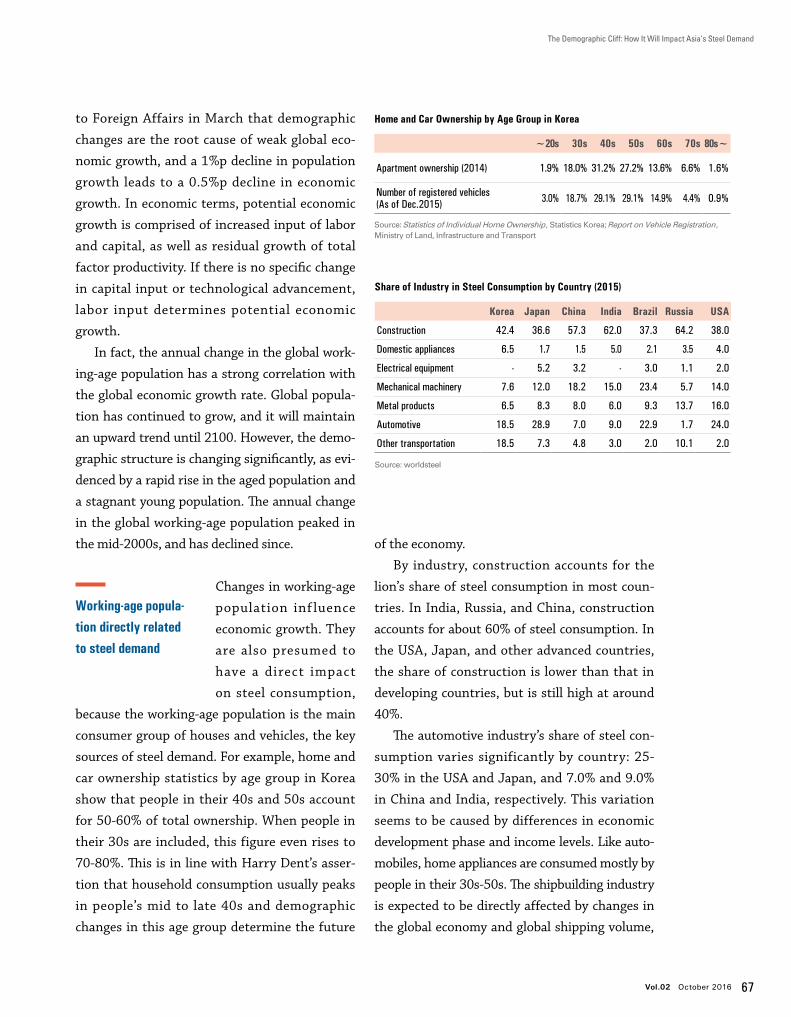
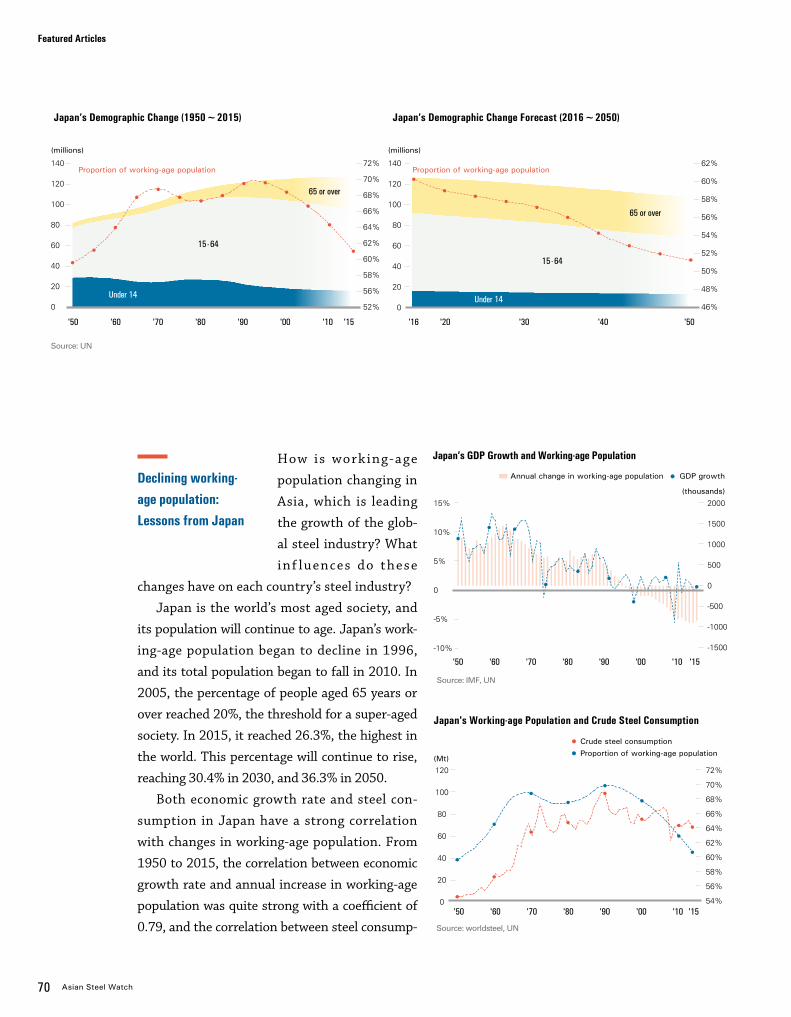
Amid a prolonged slow-
down of the global econ-
omy after the financial
crisis of 2008-09, many
people accept low growth
as the new normal. What
is the root cause of this slow growth that has
lasted for an unprecedentedly long time? Many
experts blame weak global demand, industrial
overcapacity, and the world’s alarmingly high debt.
However, there is one thing they often overlook:
demographic changes that determine economic
fundamentals.
Many renowned economists have referred
to the importance of population: Peter Drucker,
Harry Dent, Bill Gross, and Ruchir Sharma, to
name a few. Management guru Peter Drucker
emphasized the importance of population, say-
ing that demographics is the most precise way to
forecast the future.
Ruchir Sharma, Head of Emerging Markets
and Chief Global Strategist at Morgan Stanley
Investment Management, said in his report
Population determines economic fundamentals
The Demographic Cliff: How It Will Impact Asia’s Steel DemandDr. Chung, Cheol-HoSenior Principal Researcher POSCO Research [email protected]
Featured Articles
Source: UN
Source: UN
Global GDP Growth and Working-age Population
Global GDP growth Annual Change in Working-age population
(millions)
(millions)
6%
4%
2%
0%
80
70
60
50
Global Population by Age Group
0-14 15-64 65 or over
'50 '60 '70 '90'80 '00 '10 '14
8000
7000
6000
5000
4000
3000
2000
1000
0
'80 '90 '00 '10 '14
Vol.02 October 2016 67
The Demographic Cliff: How It Will Impact Asia’s Steel Demand
to Foreign Affairs in March that demographic
changes are the root cause of weak global eco-
nomic growth, and a 1%p decline in population
growth leads to a 0.5%p decline in economic
growth. In economic terms, potential economic
growth is comprised of increased input of labor
and capital, as well as residual growth of total
factor productivity. If there is no specific change
in capital input or technological advancement,
labor input determines potential economic
growth.
In fact, the annual change in the global work-
ing-age population has a strong correlation with
the global economic growth rate. Global popula-
tion has continued to grow, and it will maintain
an upward trend until 2100. However, the demo-
graphic structure is changing significantly, as evi-
denced by a rapid rise in the aged population and
a stagnant young population. The annual change
in the global working-age population peaked in
the mid-2000s, and has declined since.
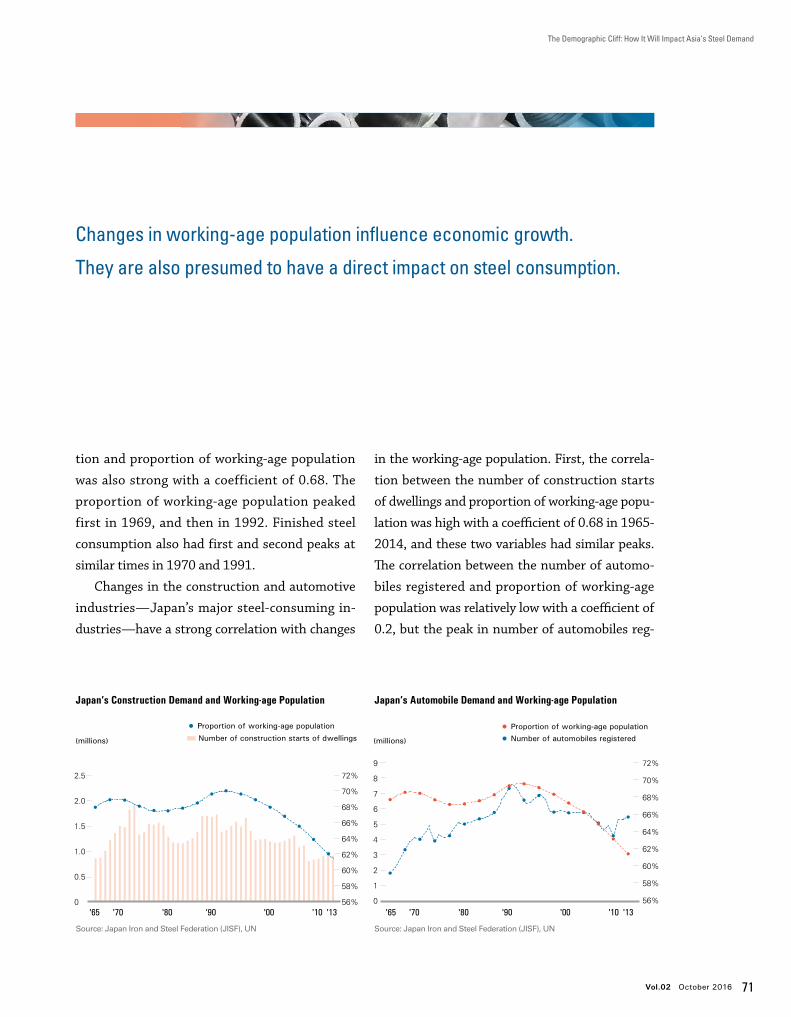
Changes in working-age
population inf luence
economic growth. They
are also presumed to
have a direct impact
on steel consumption,
because the working-age population is the main
consumer group of houses and vehicles, the key
sources of steel demand. For example, home and
car ownership statistics by age group in Korea
show that people in their 40s and 50s account
for 50-60% of total ownership. When people in
their 30s are included, this figure even rises to
70-80%. This is in line with Harry Dent’s asser-
tion that household consumption usually peaks
in people’s mid to late 40s and demographic
changes in this age group determine the future
of the economy.
By industry, construction accounts for the
lion’s share of steel consumption in most coun-
tries. In India, Russia, and China, construction
accounts for about 60% of steel consumption. In
the USA, Japan, and other advanced countries,
the share of construction is lower than that in
developing countries, but is still high at around
40%.
The automotive industry’s share of steel con-
sumption varies significantly by country: 25-
30% in the USA and Japan, and 7.0% and 9.0%
in China and India, respectively. This variation
seems to be caused by differences in economic
development phase and income levels. Like auto-
mobiles, home appliances are consumed mostly by
people in their 30s-50s. The shipbuilding industry
is expected to be directly affected by changes in
the global economy and global shipping volume,
Global GDP Growth and Working-age Population
Working-age popula-tion directly related to steel demand
Home and Car Ownership by Age Group in Korea
Source: Statistics of Individual Home Ownership, Statistics Korea; Report on Vehicle Registration, Ministry of Land, Infrastructure and Transport
Figure 3. Change of Focus of Steel Industry Policies
'80 '90 '00 '10 '15'85 '95 '05
❶ June, 1997
First list of outdated technologies & facilities to be phased out
❷ November, 2000
First list of small mills to be closed
❸ December, 2003
Guidance for restraining overinvestment in steel industry
❹ July, 2005
Steel Industry Development Policy
❺ March, 2009
Regeneration Planfor Steel Industry
❻ April, 2013
First list of qualified steelmakers
❼ February, 2016
Action plan to close 100-150 Mt/a
❶ ❷ ❸ ❺ ❻ ❼
Boom is over…
Capacity closure, environment, M&A
Steel became abundant, world No.1 producer
Closure of small producers Capacity control,industry access, M&A, raw materials, environment
Self-sufficiency was top priority
Capacity expansion, quality improvement
Expanded too fast, too many new entrants,
emissions
China's annual crude steel production
❹
82 Asian Steel Watch
Featured Articles
As the Chinese economy
is transforming from an
investment-intensive
development model to a
more consumption-driv-
en model, more and
more people believe that China’s domestic steel
demand may have reached its peak (or first peak)
in 2013. During the “post-peak” years, the Chi-
nese steel industry is facing various challenges,
in particular overcapacity. “Restructuring” has
been a frequently used keyword among people
associated with the steel industry. However, peo-
ple seem to have different views on how the Chi-
nese steel industry could evolve in the post-peak
period, and most people are not able to expose
their views to the public. To better understand
the different opinions on some important topics
regarding the future of the Chinese steel indus-
try, worldsteel organized a survey in July 2015 to
Age Profile of Respondents Nationality Distribution of Respondents
60%
20%
40%
0%
70%
30%
50%
10%
1. ≤25 years 2. 25-45 years 3. 45-65 years 4. ≥65 years
4.0%
59.0%
35.0%
2.0%
60%
20%
40%
0%
70%
30%
50%
10%
1. Chinese 2. Other Asian 3. European 4. American(North & South)
63.5%
10.7%16.7%
5.4% 3.7%
5. Others
Profession of Respondents
1. Economists, analysts, consultant
29.5%
2. Engineer
29.5%
3. Medium-high management
31.2%
4. Professor, student1.3%
5. Media, journalist
3.0%
6. Government official
0.3%
7. Others8.1%
0% 10% 20% 30% 40%
Employer of Respondents
1. Steel producer
55.0%
2. Trading company
3.4%
3. Supplier
3.4%
4. Steel using sector
2.0%
5. Consulting firm, etc.
20.8%
6. Industry association
9.4%
7. University, research institute5.0%
8. Financial institution
1.0%
9. Government, NGO
0.0%
10. Others
2.0%
0% 10% 20% 30% 60%50%40%
Profile of Respondents
Survey results on the future of the Chinese steel industry
Restructuring of the Chinese Steel Industry: Retrospects and Prospects
Vol.02 October 2016 83
collect independent views from people of diverse
backgrounds around the world. The interviewees
included economists, analysts, consultants, en-
gineers, middle management, university profes-
sors, members of the media, etc.
The 17-question questionnaire was sent to
a variety of interviewees around the world, and
covered both people working in the steel industry
and those outside the industry. All major steel
producing and steel using regions were covered.
In total, 311 useful feedback samples were re-
ceived, and some additional remarks on a few
questions were collected. According to the feed-
back, 59% of the respondents were between 25
and 45 years old, and 64% of them were Chinese.
Respondents from steel producing companies ac-
counted for 55%, and economists, analysts, and
middle-top management, who are supposed to be
knowledgeable about the steel industry, account-
ed for 60% of total respondents. Answers to some
of the key questions are summarized below.
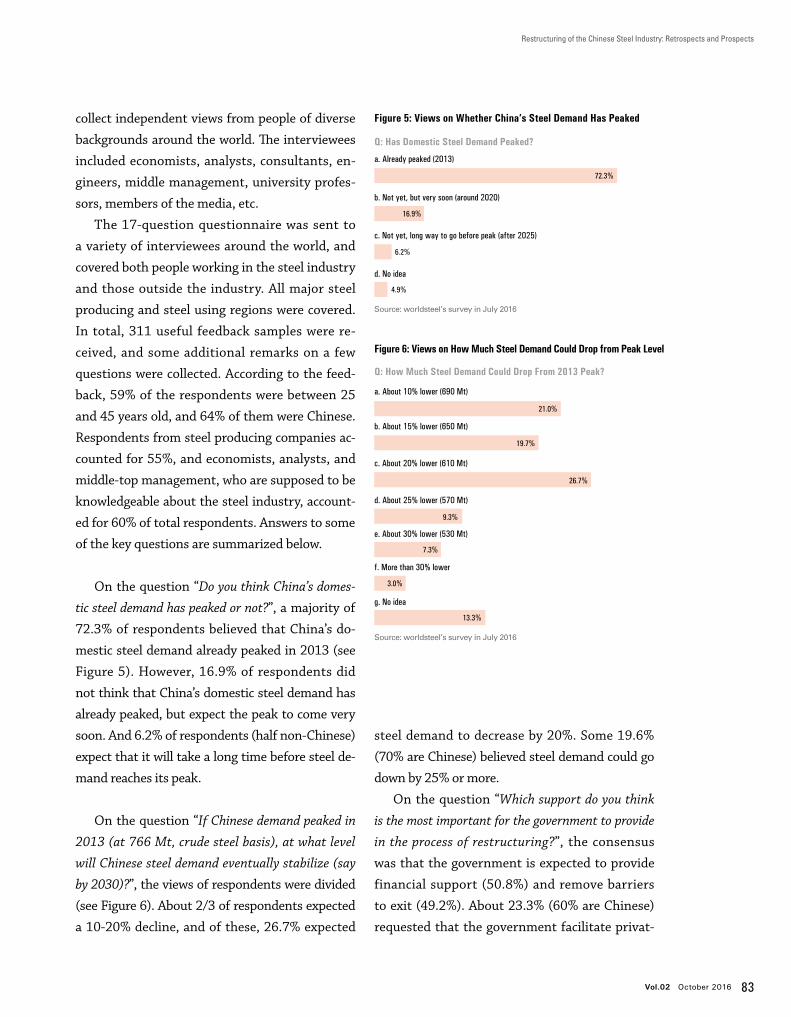
On the question “Do you think China’s domes-
tic steel demand has peaked or not?”, a majority of
72.3% of respondents believed that China’s do-
mestic steel demand already peaked in 2013 (see
Figure 5). However, 16.9% of respondents did
not think that China’s domestic steel demand has
already peaked, but expect the peak to come very
soon. And 6.2% of respondents (half non-Chinese)
expect that it will take a long time before steel de-
mand reaches its peak.
On the question “If Chinese demand peaked in
2013 (at 766 Mt, crude steel basis), at what level
will Chinese steel demand eventually stabilize (say
by 2030)?”, the views of respondents were divided
(see Figure 6). About 2/3 of respondents expected
a 10-20% decline, and of these, 26.7% expected
steel demand to decrease by 20%. Some 19.6%
(70% are Chinese) believed steel demand could go
down by 25% or more.
On the question “Which support do you think
is the most important for the government to provide
in the process of restructuring?”, the consensus
was that the government is expected to provide
financial support (50.8%) and remove barriers
to exit (49.2%). About 23.3% (60% are Chinese)
requested that the government facilitate privat-
Figure 5: Views on Whether China’s Steel Demand Has Peaked
Figure 6: Views on How Much Steel Demand Could Drop from Peak Level
e. About 30% lower (530 Mt)
7.3%
a. About 10% lower (690 Mt)
21.0%
b. About 15% lower (650 Mt)
19.7%
c. About 20% lower (610 Mt)
26.7%
d. About 25% lower (570 Mt)
9.3%
f. More than 30% lower
3.0%
13.3%
g. No idea
Source: worldsteel’s survey in July 2016
a. Already peaked (2013)
72.3%
16.9%
b. Not yet, but very soon (around 2020)
6.2%
c. Not yet, long way to go before peak (after 2025)
4.9%
d. No idea
Source: worldsteel’s survey in July 2016
Q: Has Domestic Steel Demand Peaked?
Q: How Much Steel Demand Could Drop From 2013 Peak?
84 Asian Steel Watch
Featured Articles
ization of SOE’s.
On the question “Which area do you think
Chinese steel companies should improve the most
in order to become globally competitive players?”,
views were divided, but the answer “Business
administration skills of top management” got the
highest response (43.4%), followed by the answer
“Operational technology, equipment” (27.9%)
and “Improving environmental performance”
(26.6%). Some respondents provided additional
remarks that Chinese steel companies are already
globally competitive.
On the question “If you know the history of
restructuring in other countries, which model do you
think the Chinese steel industry should follow?”,
answers were extremely divided. About 20.4%
of respondents said that they have no idea or
knowledge to answer the question. Out of the
remaining 79.6%, 31.3% believed the Japanese
model is most suitable for the restructuring of
the Chinese steel industry, and 16.4% thought
the EU model is most appropriate. However,
26.6% of respondents chose the answer “None of
the above (Japan, US, EU).” Additional remarks
suggest that China will find its own way of re-
structuring its steel industry.
To summarize the findings, the feedback from
the survey suggests that China’s domestic steel
demand peaked in 2013, and will decline 10-20%
before stabilizing. The government should lead
the restructuring process, remove barriers to exit,
provide financial support, and facilitate M&A’s
and privatization of SOE’s. There is no clear view
of which restructuring model China should follow
from among the cases of Japan, the US and the
EU. China has entered a post-peak era, but how
the steel industry should be better restructured
remains a question mark.
The Chinese steel in-
dustry is now at a crit-
ical turning point in
its development, with
“restructuring” being a
high priority for sustain-
able development in the long term. The analysis
The feedback from the survey suggests that China’s domestic steel
demand peaked in 2013, and will decline 10-20% before stabilizing.
China has entered a post-peak era, but how the steel industry should
be better restructured remains a question mark.
Suggestions for future restructuring
Restructuring of the Chinese Steel Industry: Retrospects and Prospects
Vol.02 October 2016 85
above suggests that the Chinese government,
as well as the steel industry, has achieved much
and made great progress in both economic
and environmental areas in the past decades
en route to a better-structured steel industry.
However, the analysis also indicates that what
has been done in the past may not have been
sufficient, or that the measures in place have
not been implemented in the way policy makers
expected. In light of the new environment fac-
ing the Chinese steel industry, below are some
suggestions for the Chinese government and
the steel industry for the restructuring of the
industry.
1. First and foremost, the government’s role
should be gradually overtaken by market forces.
The experience of the steel industry in
developed economies (EU, US, Japan) sug-
gests that there is a critical role for the
government to play during the process of
steel industry restructuring. Without any
intervention by the government, restruc-
turing would have gone nowhere, as indus-
try players could hardly coordinate due to
fierce competition immediately after the
demand peak. It is also valid for the Chinese
steel industry that the government should
play a leading role in facilitating industry
restructuring, as the industry is too frag-
mented to coordinate at the corporate level.
However, the government should only play
a leading role in the early stage of restruc-
turing, providing financial support to help
reduce excess capacity, resettling redundant
employees, and reducing barriers to exit for
loss-making companies. Once the barriers
to exit are removed, it should be market
forces that decide which steel producers
remain in the market, rather than the gov-
ernment making a list of producers that are
identified by certain criteria to be “qualified”
to operate. This is even more important for
industry consolidation. It should be the
steelmakers who decide whether an M&A
is commercially viable, rather than the
1990s 2000s 2010s 2020s 2030s
Government Market force
Figure 7. Shift of Power from Government to Market Force
86 Asian Steel Watch
Featured Articles
government forcing mergers that it feels
are workable. Figure 7 demonstrates how
government influence should be replaced by
the market forces in the future.
2. The steel industry should be consolidated to
generate better synergy in the industry, in partic-
ular in market development and R&D.
A reasonably consolidated industrial struc-
ture enables the most players to allocate the
best resources to improve the efficiency of
the supply chain and R&D. The Chinese steel
industry is currently too fragmented for pro-
ducers to generate synergy. Survival is the
top priority of nearly all producers, including
those that used to be leading players in the
market. But structural reorganization should
be conducted in a proper way. Market forces
or producers should be the decision maker
on whether a merger proposal is commer-
cially feasible or not. The government should
not force any producer to merge, or stop any
producer from being taken over by another.
Cross-regional combination of producers
usually brings better synergy and creates
new market opportunities. Industry consoli-
dation should be careful of the notion of “the
bigger, the better, the stronger.” A bigger
company means stronger bargaining power,
but the value can be significantly offset by
the huge costs of integration and inefficiency
in operation management.
3. A joint fund should be initiated to support the
restructuring.
In early 2016, the Chinese central govern-
ment committed to devoting a total budget
of RMB100 billion to deal with issues re-
lated to the capacity reduction campaign in
the coal and steel industries. According to a
statement from the government, the budget
will be mainly assigned for resettlement of
1.3 million redundant employees in the coal
industry and 0.5 million in the steel industry.
In the longer term, the government, as the controlling shareholder
of the steel companies, should guide the SOE’s in making a long-term
business plan, and importantly, the plan should not just be politically right,
but commercially viable.
Restructuring of the Chinese Steel Industry: Retrospects and Prospects
Vol.02 October 2016 87
This budget is viewed as an excellent start
that demonstrates the central government’s
determination to help the industry address
the core challenges of labor force treatment.
It is expected that the provincial govern-
ments will come up with additional money to
supplement the central government’s budget.
However, the overall budget is rather limited
compared to the magnitude of the capacity
reduction and the resettling of redundant
employees. An additional fund, which could
be jointly established by the government and
private sectors, could definitely fill the gap
between the huge demand and the limited
government budget. Such a public-private
fund could help address not only employ-
ment issues, but also help resolve bad debts,
facilitate M&A, and even be used in R&D ini-
tiatives.
4. Reform of state-owned steel enterprises (SOE’s)
should be accelerated, the sooner the better.
The Chinese steel industry was dominated
by state-owned steel companies for more
than four decades, until the late 1990s, when
private players started to emerge and grow
rapidly. However, state-owned companies nor-
mally respond to changing market conditions
at a slower pace, and the fast-growing private
steel producers have taken over a large share
of steel production. State-owned companies
urgently need to reform the way they man-
age their businesses, as well as their people.
In the longer term, the government, as the
controlling shareholder of the steel compa-
nies, should guide the SOE’s in making a long-
term business plan, and importantly, the plan
should not just be politically right, but com-
mercially viable.
5. Steel companies should be more integrated into
the global steel industry.
Integration, both internally and externally,
has become one of the most difficult problems
of nearly all Chinese steel companies. Inte-
gration into the global steel industry does not
only mean trading steel products and building
facilities in other countries, but also having
the openness to work with industry peers to
share industry-wide responsibilities, impose
influence on future industry development,
and advocate for the image of the industry.
The most critical determinant of successful
integration is the mentality of the top man-
agement, in particular CEO’s. This means that
CEO’s should be exposed to more global orga-
nizations and international events.
6. Steel companies’ human resources system
should be more open.
In contrast to the industries in other steel pro-
ducing regions, the human resources system
of Chinese steel companies is quite closed,
especially that of state-owned companies. Al-
most all Chinese steel companies recruit new-
ly graduated students from universities every
year to comply with the instructions of the
government. It is very rare that Chinese steel
companies recruit talent from the outside
when there are vacant positions. Instead, they
mostly recruit from inside the company to fill
vacancies. The exception is that many private
steel companies open their system to recruit
both fresh graduates and mature talent from
outside. This system makes it very difficult for
Chinese steel companies, in particular state-
owned companies, to attract young talent,
especially internationally competitive special-
ists.
88 Asian Steel Watch
Featured Articles
Myanmar, the Last Frontier in the ASEAN, Will See High Growth of its Steel IndustryDr. Cho, Dae-HyunSenior Principal ResearcherPOSCO Research [email protected]
A new chapter opened in Myanmar in April 2016
when the country’s first non-military govern-
ment in 54 years took office. As Aung San Suu
Kyi’s National League for Democracy (NLD) won
a landslide victory in the country’s parliamenta-
ry elections held in November 2015, Myanmar
drew global attention. Even before the landmark
elections, Myanmar has become a focus of global
attention for its geopolitical and geo-economic
importance since the Thein Sein administration,
launched in 2011, pursued active reform and
opening-up, followed by the lifting of economic
sanctions against Myanmar by the EU in 2013
and the later easing of some U.S. sanctions.
Today, Myanmar is dubbed the “last frontier”
in the ASEAN because of its high growth poten-
tial and high investment attractiveness as fol-
lows.
First, from the geopolitical perspective,
Myanmar borders three important economic re-
gions: China, India, and the ASEAN. Myanmar is
China’s gateway to the Indian Ocean and India’s
gateway to Southeast Asia. It is a strategic hub
that connects massive consumer markets. For
these reasons, Myanmar has high efficiency as a
production base and high potential as a logistics
base for these countries. Roads and ports directly
linking mainland China and the Indian Ocean,
the China-Myanmar-India Highway, and the
Thailand-Myanmar-India Highway are under con-
struction.
Second, Myanmar is a resource-rich country.
Thanks to its complex geology, Myanmar has
abundant natural resources: energy resources,
including natural gas and oil; minerals, including
copper, zinc, tin, tungsten, nickel, and lead; and
gemstones, including rubies and sapphires. How-
ever, except for some natural gas and other re-
sources, no mineral resources have been explored
since the introduction of the Burmese Way to So-
cialism in the late 1960s. Myanmar, the so-called
last bastion of natural resources, has much room
for resources exploration.
Third, Myanmar has low labor costs and high
quality labor, making it an ideal investment desti-
nation for labor-intensive industries. The average
Vol.02 October 2016 89
Myanmar, the Last Frontier in the ASEAN, Will See High Growth of its Steel Industry
monthly wage of factory workers in Myanmar
ranges from USD 90 to 110 as of 2014, which
is lower than that of neighboring Southeast
Asian countries, such as Vietnam and Indonesia.
However, Myanmar’s labor productivity is quite
high compared to its wages. According to a local
sewing factory, Myanmar’s wages are half of Viet-
nam’s, but its labor productivity is about 80% of
Vietnam’s. The ratio of labor productivity to wag-
es in Myanmar is 1.6 times higher than that in
Vietnam.
Finally, Myanmar has high potential as a
domestic market. According to an IMF report
in April 2016, Myanmar with a population of
51.48 million people (according to the census in
May 2015) had a per capita GDP of USD 1,292
in 2015, and Yangon, the country’s largest city,
had a per capita GDP of USD 1,700, surpassing
the 1,000-dollar threshold that gives rise to the
consumption of durable goods and a middle class.
Notably, purchasing power per capita in Myanmar
has increased at a greater rate than in Vietnam
since 2011. It is projected to reach USD 5,953 in
2016 and USD 8,399 in 2020. In 2021, Myanmar’s
purchasing power per capita is expected to reach
USD 9,173, surpassing Vietnam’s USD 9,065.
Foreign direct invest-
ment (FDI) in Myanmar
has continued to rise
since it peaked in FY
2010 (April 1, 2010 to
March 31, 2011) under
reform and opening-up policies. In FY 2015,
Mineral Iron ore Coal Nickel Zinc Copper Tungsten Uranium
Reserve 720 400 42 14 21 1 0.4
Table 1. Myanmar’s Mineral Reserves
Source: KORES, UNDP
Figure 1. Myanmar’s Geopolitical Location
(Mt)
THAILAND
BANGLADESH
INDIA
CHINA
LAOS
MYANMAR
Diversifying FDI in Myanmar by country and industry
90 Asian Steel Watch
Featured Articles
FY 2010 FY 2011 FY 2012 FY 2013 FY 2014 FY 2015
Agriculture 139 10 20 40 7
Mining 1,396 20 15 33 6 29
Electricity 8,219 4,344 364 47 40 360
Oil & gas 10,179 248 309 3,220 4,818
Manufacturing 66 32 401 1,837 1,502 1,065
Transportation& communication 1 1,190 1,679 1,931
Hospitality & tourism 300 435 358 288
Realestate 441 781 729
Others 15 16 357 236
Note: Statistics as of March 2016Source: Myanmar Investment Commission (MIC)
Table 2. Foreign Investment in Myanmar by Country and Industry
FY 2010 FY 2011 FY 2012 FY 2013 FY 2014 FY 2015
China 8,269 4,346 232 56 511 3,224
Hongkong 5,798 85 107 626 225
Korea 2,676 26 38 81 300 128
Thailand 2,146 1 529 166 236
Singapore 226 418 2,300 4,297 4,247
Netherland 10 302 438
India 73 12 26 209 224
Japan 7 4 54 56 86 218
UK 799 100 233 157 857 75
(USD million)
FDI in Myanmar grew by 8% year on year, to
USD 9.5 billion. China's FDI in Myanmar stood
at USD 3.22 billion in FY 2015, and it had the
lion’s share (USD 18.67 billion, 29.3%) of the
accumulated investment amount (USD 63.72
billion) in the same year. China continues to in-
crease investment this year. Singapore, in which
the Asian headquarters of many global firms
are located, has remained the top investor since
FY 2012. The Netherlands, India, and other
countries are also actively making inroads into
Myanmar.
In the past, the oil and natural gas industry
received the largest investment, but recently, in-
vestment has diversified into industries such as
transportation and communication, real estate,
and manufacturing (in particular, labor-intensive
manufacturing, e.g. apparal and shoes). In FY
2015, the oil and natural gas industry received
USD 4.82 billion of investment, transportation
and communication USD 1.93 billion, manu-
facturing USD 1.07 billion, and real estate USD
729 million. These four industries account for
more than 90% of total investment. FDI in power
generation has decreased substantially, but it is
expected to rise again due to rising demand for
electricity following economic growth, and the
development of manufacturing, transportation,
and communication.
New government’s “people-friendly” and “infrastructure-oriented” economic policies
The new administration has announced an eco-
nomic blueprint, but no
detail policies. However,
during election cam-
paigns, the ruling NLD
party laid out policy directions under the slogan
“Time for Change”: ▲ fiscal prudence, revitalizing
agriculture and other industries closely linked to
the livelihood of the people, ▲ stable supply of
energy, ▲ improving the environment for foreign
investors, ▲ refurbishing infrastructure, such as
transportation, communication, and electricity,
and ▲ improving the labor environment. Internal-
ly, the new administration will implement peo-
ple-friendly policies, and externally, it will develop
infrastructure through FDI and the support of in-
ternational institutions.
These policy directions will provide foreign
investors with various opportunities.
First, various reformative legislation, in-
cluding the Foreign Investment Law, the Motor
Vehicle Law, and the Central Bank of Myanmar
Vol.02 October 2016 91
Myanmar, the Last Frontier in the ASEAN, Will See High Growth of its Steel Industry
Law, are expected to take effect within this
year. As a result, barriers to investment, such as
land lease and local hiring requirements, will be
lowered. Greater independence for the Central
Bank of Myanmar, and open financial policies,
will increase transparency in the financial sec-
tor.
Second, new business opportunities will arise
for medium-to-large infrastructure projects.
Rather than one-off projects, demand for long-
term large-scale projects will likely increase based
on plans: ▲ Yangon New City Project, ▲ transpor-
tation, oil refining, mining, power transmission
and distribution, and road construction projects,
▲ new opportunities for development of special
economic zones.
Third, Myanmar is expected to receive more
economic support and investment thanks to the
US lifting economic sanctions. Myanmar compa-
nies and individuals are being taken off the sanc-
tion list, and will be provided with US loans and
support. In particular, the generalized system of
preference (GSP), the US trade preference pro-
gram, will be applied on November 13, 2016, and
dollar-denominated transactions will be possible
as early as in 2016.
Lastly, the new administration considers
lack of transparency in the government to be an
obstacle to attracting foreign investment. There-
fore, the new government is expected to be more
transparent and fair in decision-making and poli-
cy implementation, for example in the allocation
of business rights.
Meanwhile, “people-friendly” policies will put
new pressures on companies. As the government
has reduced the number of goods exempt from
commercial taxes and increased public utility
rates to boost state coffers for a better labor en-
vironment, companies may need more funds to
enter Myanmar, and are highly likely to suffer
from increased corporate taxes and income taxes.
Moreover, wages are expected to rise due to some
reformative measures in the labor environment,
such as the introduction of a minimum wage,
allowing workers to form unions, and improving
labor standards. With the increased influence
With its growing geopolitical and geo-economic importance, and improved
conditions for foreign investment, Myanmar is expected to maintain
high economic growth until 2020.
92 Asian Steel Watch
Featured Articles
of NGOs, there will be more lawsuits and delays
in major infrastructure development projects,
arising from conflicts involving compensation for
land expropriation, relocation, and environmen-
tal issues.
Highest growth rate in Southeast Asia
According to an IMF re-port released in 2016,
Myanmar’s GDP growth
rate was 8.5% in 2015,
higher than that of Chi-
na, India , and other
ASEAN countries. Since former President Thein
Sein adopted reform and opening-up policies to
attract investment for economic
growth, Myanmar has recorded high
GDP growth rates, 7-9%, each year.
With its growing geopolitical and
geo-economic importance, and im-
proved conditions for foreign invest-
1Due to insufficient statistics on
Myanmar’s steel industry, this
figure was estimated based on
market research by Myanmar-
POSCO and POSCO Research
Institute.
ment, Myanmar is expected to maintain high
economic growth until 2020.
After Myanmar’s transi-
tion to a market economy
in 1989, its finished steel
consumption mainly for
construction1, such as
billets and steel bars, sub-
stantially increased, sur-
passing 500,000 tonnes in 2000. Steel consump-
tion declined as the economy slowed following the
strengthening of U.S. economic sanctions in 2003,
but began to demonstrate an upward trend after
steel consumption overtook its previous peak in
the late 2000s thanks to a prosperous construction
market backed by increased natural gas production.
In addition, foreign investment inflows following
reform and opening-up policies in 2011 have con-
tributed to the upsurge in steel demand.
(%)
Figure 2. GDP Growth Rates in Southeast Asia
Source: IMF, World Economic Outlook, January 2016
8.0
5.0
7.0
6.0
9.0
3.0
4.0
'10 '11 '12 '13 '14 '16(f) '20(f)'15
5.3
5.6
7.3
8.4 8.5 8.5 8.4
7.7
Myanmar Vietnam
Laos Philippines
Cambodia Indonesia
Fast growing steeldemand in Myanmar, mainly for long products
Vol.02 October 2016 93
Myanmar, the Last Frontier in the ASEAN, Will See High Growth of its Steel Industry
ProductionConsumption
Figure 3. Steel Supply and Demand in Myanmar
Table 3. Supply and Demand by Product, 2014
(1,000 tonnes)
(1,000 tonnes)
Long products HR/Plate CR (Full Hard) GI Color Total
Total demand 1,090 200 24 198 103 1,615
Total supply
Domestic production 110 20 - 23 - 153
Imports 980 180 24 175 103 1,462
Share of imports (%) 89.9 90.0 100 88.4 100 90.5
Myanmar’s finished steel demand was 1.62 Mt
in 2014, showing a CAGR of 13.4% after 2003.
Without a solid foundation of steel-consuming
industries, such as automotive, home appliance,
and shipbuilding, demand for long products and
galvanized and color-coated sheet used for con-
struction is 1.09 Mt (68%) and 0.3 Mt (19%),
respectively, accounting for nearly 90% of total
steel demand.
Among flat products, demand for galvanized
and color-coated sheet is surging. Demand for
galvanized sheet has risen 30% each year for the
last five years, reaching 200,000 tonnes in 2014.
Since reform and opening-up, demand for resi-
dential roofing materials has increased, and re-
cently, demand for commercial construction ma-
terials has surged. Demand for color-coated sheet
reached about 100,000 tonnes in 2014. Its use in
factory exteriors and roofing, and in roofing for
middle-to-upper class homes in cities, is rising.
In the meantime, the hot-rolled sheet and
plate market remains at only 200,000 tonnes.
1991 2000 2007 2011 20131995 2003 2009 2012 2014
44 8
15865
530
40 40
405
625
20
860
50
1,045
1,200
1,370
1,615
155153
170155
Source: Myanmar POSCO, POSCO Research Institute
Note: MPCC, the first color-coated sheet manufacturer in Myanmar, began operation in November 2014.Source: Myanmar POSCO, POSCO Research Institute
94 Asian Steel Watch
Featured Articles
There is no cold-rolled sheet market in Myanmar
as it imports only full hard used for galvanized
sheet.
Due to poor competitiveness in steel produc-
tion, caused by power shortages, substandard oper-
ational skills, and inadequate facility management,
finished steel production was only 153,000 tonnes
in 2014, out of a capacity of 650,000 tonnes (in-
cluding suspended facilities). This translates to a
capacity utilization rate of just above 20%.
With the import market wide open after reform
and opening-up policies, Myanmar’s import duty
rate is only 1%. Increasing demand for steel is most-
ly satisfied by imports. The share of imports rose
continuously from 85% in 2011 to 91% in 2014.
Myanmar’s five state-owned mills and four private mills
In Myanmar, there are
currently five state-
owned steel mills: two
steel mills under the
Ministry of Industry
(No. 4 and No.5) and
three steel mills (No.1 - No.3) under Myanmar
NO.1 NO.2 NO.3 NO.4 NO.5
Businessoperator MEC(Under Ministry of Defense) Ministry of Industry
(Changed from MEC in 2012)
Start of operation 1998 1995 1957 2009 2008
Location PyayeMyaungdagar
(Yangon)Insein
(Yangon)Myingyan Pinpet
Supplier Danieli (Italy) NKK (Japan) DEMAG(Germany) Danieli (Italy) Russia
Capacity(1,000 tonne/y)
Bar & wire: 200 Plate: 150 Billet & wire:
40Slab & billet:
200 Pig Iron: 200
Production 2014(1,000 tonnes)
Bar: 100 Plate: 20 - Billet: 20~30 Suspended
MANDALAY
SAGAING
BAGO
KAYAH
KACHIN
CHIN
RAKHAINGMAGWE
SHAN
No.2 MyaungdagarPlate (0.15Mt)
No.1 Kyaukswekyo Bar & wire (0.2Mt)
No.3 Ywama Billet & wire (50,000 tpnnes)
No.5 PinpetPig Iron (0.2Mt)No.4 Myingyan
Slab & billet (0.2Mt)
Table 4. Status and Location of Myanmar’s State-owned Mills
Source: Myanmar POSCO, POSCO Research Institute
Economic Cooperation (MEC), a state-owned
company that is part of the Ministry of Defense.
There are also three galvanized steelmakers and
one color-coated sheet manufacturer.
The five state-owned mills are called No.1
through No.5, mainly based on size. In the past,
MEC operated all state-owned mills. Because
No.4 and No.5 had low operation rates and over-
spending of investment funds placed a financial
burden on the Ministry of Defense, their oper-
ator was changed from the Ministry of Defense
to the Ministry of Industry in late 2012. The
Ministry of Industry is investing in the No.4 mill
to expand its capacity from 200,000 tonnes to
400,000 tonnes, making it the largest steel plant
in Myanmar. However, due to poor construction
management and insufficient funds, construction
has been delayed for over two years. Completion
is projected for 2018, but further delays are like-
ly. The No.5 steel mill with a pig iron capacity
of 200,000 tonnes is located on Mount Pinpet,
which has iron ore deposits. Its operation is cur-
rently suspended.
Yangon
Vol.02 October 2016 95
Myanmar, the Last Frontier in the ASEAN, Will See High Growth of its Steel Industry
Table 5. Galvanized and Color-coated Sheet Manufacturers in Myanmar
Source: Myanmar POSCO, POSCO Research Institute
MEGA Steel MEC MPSC MPCC
Product GI Color
Operation started November 1997 August 1998 January 1999 December 2014
Location Yangon
Major shareholder Mega Group (Singapore) Myanmar POSCO+MEHL POSCO+ MEHL
2 Baxter, M. and King, R.G., “Measuring Business Cycles: Approximate Band-Pass Filters for Economic Time Series”, Review of Economics and Statistics, 81 (4), 1999.
3 Christiano, L. and Fitzgerald, T., “The Band Pass Filter”, International Economic Review, 44 (2), 2003.
4 Representative research include: ① Cuddington, J. T. and Jerrett, D., “Super Cycles in Real Metal Prices?”, IMF Staff Paper 55 (4), 2008. ②Jerrett, D. and Cuddington, J. T.,
“Broadening the Statistical Search for Metal Price Super Cycles to Steel and Related Metals”, Resources Policy, 33(4), 2008. ③ Erte, B. and Ocampo, J. A., “Super Cycles of
Commodity Prices since the Mid-Nineteenth Century, United Nations DESA Working Paper No. 110, 2012. ④ Jacks, D. S., “From Boom to Bust: A Typology of Real Commod-
ity Prices in the Long Run”, NBERWorking Paper 18874, 2013.
With this decomposition, we assume that the long-run
trend is not constant, but rather evolves very slowly over
time. Deviation from the long-run trend and super cycle is
considered a short- to mid-term business cycle compo-
nent. The sum of the three components equals the long-
run price.
Steel price super cycles over the last 100 years
We used the asymmetric Christiano-Fitzgerald band-pass
filter to extract a long-run trend and super cycles from long-
term US real HR price series (1900-2016). Let’s take a look
at the long-run (super) trend of steel prices. For this, we
used a band-pass filter to extract cyclical components with
periods over 70 years.
As shown in Figure 3, the long-run trend of the real steel
price shows a downturn after a peak in the early 1970s,
(i.e., trend) and retains high-frequency components. The
Hodrick–Prescott filter widely used in economics is a high-
pass filter, and is unable to extract long-run cycles with
lower frequencies.
A band-pass filter lets certain ranges of frequencies
pass through, while filtering out higher and lower frequen-
cy components. Using a band-pass filter, one is able to
extract cycles of different periodicities (short-, medium-,
long-run) by setting lower and upper bounds. There are
two types of band-pass filter: symmetric and asymmetric.
Baxter and King (1999) designed a symmetric filter, while
Christiano and Fitzgerald (2003) developed an asymmetric
filter. The advantage of an asymmetric filter is that there is
no loss of a number of observations at the beginning and
end of a data sample.
Band-pass filters have been widely used for extraction
of long-run commodity price cycles since the 2000s. Jer-
rett and Cuddington (2008) were the first to use the asym-
metric Christiano-Fitzgerald band-pass filter for steel price
analysis. Following their lead, we employ the asymmetric
Christiano-Fitzgerald band-pass filter to decompose the
real steel price.
The real steel price (RP) can be decomposed into three
components: (1) long-run trend (RP_T), (2) super cycle (RP_
SC), and (3) other shorter cyclical components (RP_O). A
super cycle is assumed to last 20 to 70 years.
RP ≡ RP_T + RP_SC + RP_O
≡ RP_BP(70, ∞) + RP_BP(20, 70) + RP_BP(2, 20)
* BP(20, 70) denotes a band-pass filter with band (20, 70)
Vol.02 October 2016 103
104 Asian Steel Watch
Market Trend and Analysis
and the real steel price repeats a decade-long fluctuation
throughout the long-run trend. However, with this graph
alone, it is not easy to judge whether the long-run trend
has already hit bottom or will continue to fall. Therefore, in
order to more precisely predict the future direction of the
real steel price, it is necessary to see the super cycle mov-
ing along with the long-run trend.
From the detrended real steel prices (difference be-
tween actual price data and the long-run trend), we can
extract super cycles with a period of 20-70 years by using
a band-pass filter. The super cycles of the detrended real
steel prices are shown in Figure 4.
There is strong evidence of super cycles in the real
steel prices. The length of a steel price super cycle is about
20-25 years, similar to many other commodity super cy-
cles as shown later. The upward phase of past steel price
super cycles lasted for 10-15 years. Decomposition of the
real steel prices suggests that there were four long upcycle
periods from 1900 to 2016 (1928-1939, 1950-1963, 1973-
1981, 1997-2011). (see Figure 4 and Table 1).
Our results show that the current steel price super
cycle is the fourth over the past 100 years, after peaking
in 2011. The results are not sufficient to determine when
the fourth super cycle will hit bottom, but there is a strong
possibility that the downcycle will continue for the next
several years.
How does a super cycle begin?
In order to forecast the direction of a super cycle, it is
important to identify which mechanism past super cy-
cles are generated from. Alan Heap (2005) argued that
commodity super cycles are demand-driven, and highly
materials-intensive economic activity is the cause of super
cycles. However, commodity prices are decided by the
demand-supply equilibrium. For this reason, emphasizing
only demand side factors can lead to the misjudgment
of a super cycle. In keeping with Cuddington and Jerrett
(2009),5 there are three conditions necessary for the occur-
5 Cuddington, J. T. and Jerrett, D., “The Recent Metals Price Retreat: So Long Super Cycle?”, Presentation for the International Pig Iron Association, March 4, 2009
rence of a super cycle:
① Continuous high demand: Past super cycles were
driven by exponential increases in demand (e.g., US eco-
nomic growth in the early 1900s, around World War II
(1940s), post-war reconstruction after 1950s)
② Short-term supply constraints: Short-term supply
shortages trigger price increases (A short-term demand
surge in steel and non-ferrous metals is very likely to cause
supply shortages.)
③ Slow capacity adjustment in response to demand,
driving continuous price increase (The speed of long-run
supply response is critical for sustained demand expansion
to give rise to a super cycle. In the steel industry, capacity
expansion lags behind surging demand.)
The global steel market in the 2000s satisfied the three
conditions to see another super cycle. First, steel demand
in China grew explosively following industrialization and ur-
banization in the 2000s. Second, the sudden disruption in
raw materials supplies caused by natural disasters in 2005
and 2008 constrained steel production in the short term.
Third, new capacity increased only slightly until the early
2000s. Considering the demand rise in China, the supply
glut was smaller than expected in the early 2000s. After
the global financial crisis, China’s overcapacity emerged
as a serious issue in the global steel industry. Clearly, steel
prices in the fourth super cycle, which is still underway, are
affected primarily by the ups and downs of the so-called
“China effect.”
Co-movement with other commodity super cycles
How does the steel price super cycle differ from other
commodity super cycles? To answer this question, we ex-
tracted super cycles of iron ore, which is most relevant to
steel, and other commodities, including crude oil, copper,
and aluminum, using the same band-pass filter.
As shown in Figure 6, other commodity super cycles
are quite similar to steel super cycles after 2000, because
they share the same cause, the “China effect.”
E X A M I N I N G T H E P A S T 1 0 0 Y E A R S : W H E R E I S T H E S T E E L S U P E R C Y C L E H E A D E D ?
Vol.02 October 2016 105
In particular, the super cycles of iron ore price, which
has high correlation to steel price, have moved in sync
with steel price super cycles. Real iron ore price is highly
likely to stand at pre-1970s levels. The iron ore super cycle
recently entered a downward phase after 2013. However,
despite its gradual fall, the long-run trend of iron ore price
remains relatively high, unlike that of steel price as shown
in Figure 1.
Although the super cycles of steel price and other com-
modity prices have moved in close correlation, there is no
guarantee that this pattern will continue, because the steel
industry has characteristics that are distinct from other
commodity industries. In the case of other commodities,
the downturn of a super cycle is caused primarily by tech-
nological advancement and an increase in new supply fol-
lowing high prices. One example is shale gas. In contrast,
steel (iron) has vast reserves and a high recycling rate com-
pared to other commodities. Therefore, it is practically free
from resource constraints. Moreover, due to overcapacity,
steel supply can be expanded at any time without techno-
logical advancement. For these reasons, one should not
rule out the possibility that the steel price super cycle will
have a different pattern from other commodity price super
cycles.
Factors that influenced steel price super cycles
Although most commodity price super cycles, including
steel, turned downward around 2010-2012, the debate
over commodity price super cycles is still going on.6
Note: A super cycle is extracted by specifying the period of 20-70 years using a band-pass filter Source: USGS, Bloomberg, POSCO Research Institute
Aluminum→
← Steel
(USD/t) (USD/t)
1900 ‘10 ‘50‘30 ‘70 2000‘20 ‘60 ‘90‘40 ‘80 ‘10‘15
Copper →
← Steel
(USD/t) (USD/t)
1900 ‘10 ‘50‘30 ‘70 2000‘20 ‘60 ‘90‘40 ‘80 ‘10‘15
Figure 6. Comparison with Other Commodity Super Cycles
6 Refer to these reports for various views on super cycles: “China: Is the Commodity Super-Cycle Over?”, CreditSuisse, March 19, 2012, “Commodities Super-Cycle is ‘Taking a Break’”, South China Morning Post, July 10, 2013, “Why the Commodities Super Cycle was a Myth”, Financial Times, September 1, 2015., “So long, Super-Cycle”,
Financial Times, December 10, 2008.
106 Asian Steel Watch
Market Trend and Analysis
Table 2. Causes of Steel Price Super Cycle in the 2000s
2000-2011 (Upcycle) 2012- (Downcycle)
Demand• Surging steel demand following industrialization and urbanization in China• High demand in non-China BRICs nations
• Steel demand growth turns negative as China’s economic growth slows• Demand of emerging countries (India, MENA, Southeast Asia) is anticipated to grow but is not expected to take off before 2020
Supply
• Short-term supply disruption of iron ore, cokes, and other raw materials due to natural disasters• Despite overcapacity in China, obsolete facilities in advanced countries limit capacity expansion
• Global-level discussion just started to address overcapacity • China’s “supply-side reform” is anticipated to progress, but it will take time and energy to implement policies
Some people may mistakenly conclude that the current
downcycle is ending and another price boom is com-
ing. On the contrary, it is time to worry about an ongoing
super downcycle. As seen in Table 2, the supply and
demand side factors in the global steel market will deter-
mine the length and amplitude of the downcycle in the
future.
Ironically, the most important determinant of the cur-
rent super downcycle might be the previous super upcy-
cle. Since Alan Heap (2005), many super cycle believers
Note: Real Price is monthly US domestic HR price discounted by US CPI (2015=100). A business cycle is extracted by specifying a period of 8-40 quarters using a band-pass filterSource: CRU, POSCO Reaserch Institute
middle of an ongoing super cycle.
With great uncertainty about the future, we could posit
three or four scenarios. However, we intend to close this
article by sketching a predictable future for steel price
cycles based on the movement of steel and iron ore price
cycles over the last 100 years. Repeating cycles in the past
can better predict future cycles than scenario analysis, and
provide lessons and implications for the global steel com-
munity.
In terms of long-run cycles, assuming an extension of
the graph of long-run super trendand cycle decomposi-
tion in Figure 1, cycles lasting over the next 10 to 15 years
are highly likely to have similar patterns to Figure 11.
In terms of the super trend, questions remain whether
the downtrend will continue or an uptrend will begin within
a few years. Taking into account of global overcapacity,
post-peak controversy in China, and delayed growth in
emerging markets after the financial crisis, the argument
that the low price trend will continue is gaining ground.
Amidst the prolonged low growth of the global steel indus-
try in the next decade, long-run marginal cost of iron ore
may also see a downward trend, owing to the continuous
increase of iron ore supply and abundant scrap generation
especially in China.
The recent super downcycle reflects the price decline
after 2010, and may suggest further decline from the per-
'80 '90 '00 '10 '16
E X A M I N I N G T H E P A S T 1 0 0 Y E A R S : W H E R E I S T H E S T E E L S U P E R C Y C L E H E A D E D ?
Vol.02 October 2016 109
The critical factor to shortening the super downtrend and downcycle is how fast excessive capacity can be reduced in the next five to ten years. It is also important how fast the economic growth of emerging markets, especially India and the ASEAN, will offset the steel demand slowdown in China.
2000 2005 2000 2005
Steel Price
Down Cycle
Overcapacity Reduction
Emerging Market Growth
Super Cycle
Super Trend
Figure 11. Super Trend and Super Cycle Forecast
Steel Price
China’s Scrap Generation
Consolidation Movement
Overcapacity Concern
Volatile business Cycles
Figure 12. Business Cycle Forecast
Emerging Markets’Fast Recovery
spective of long-run cycle. The critical factor to shortening
the super downtrend and downcycle is how fast excessive
capacity can be reduced in the next five to ten years. It is
also important how fast the economic growth of emerging
markets, especially India and the ASEAN, will offset the
steel demand slowdown in China.
Short-run business cycles have demonstrated high
volatility in recent years, and this volatility may last for a
considerable time. As shown in Figure 12, the amplitude
of short-run upcycles and downcycles will be determined
by facility reduction announcement and consolidation
policies in major steel-producing countries such as Chi-
na. Short-run cycles also depend on the sustainability of
China’s growth and the recovery speed of emerging mar-
kets.
Therefore, even in the overall downtrend, short-run
business cycles will show volatility, which will surely have
a massive impact on steelmakers’ strategic decision-mak-
ing. For this reason, the steel industry should pay close
attention to short-run business cycles in order to keep
cash flows maintained. Precise forecasting and insight into
short-run cycles are necessary to maximize short-run prof-
its in the downcycle.
110 Asian Steel Watch
Market Trend and Analysis
The global steel export market is riding a wave of change
in the face of surprisingly high growth in the Chinese steel
industry. Japan used to be the world’s top steel exporting
country, but it was overtaken by China in 2006. Other major
steel exporting countries, including Russia, Germany, and
Ukraine, are continuously losing ground. While China has
poured massive amounts of steel products into overseas
markets for a couple of years in order to overcome slug-
gish domestic demand and oversupply, Korea, Japan, and
other steel exporting countries have been threatened by
worsening profitability of their major steelmakers caused
by China’s encroachment into the global steel market, and
plunging steel prices. With competition for steel exports
becoming fierce and the center of the global steel structure
shifting to China, major global steel mills are focusing on
trade markets. Therefore, it is all the more necessary to
take a long look at the landscape of the steel exports strat-
egies of Korea, China, and Japan—a key factor of change
in the global trade market—and to determine whether
changes to the trade market landscape will be sustainable.
Korea, China, and Japan, the world’s top three steel exporters
Following the rise of China, the global steel trade market
entered a period of structural transition in the 2000s. China
used to be a net importer of steel and a “key market” for
global steelmakers. However, as its steel production has
2000 2005 2010 2014
1 Japan Japan Japan China
2 Russia Russia China Japan
3 Germany China Russia Korea
4 Ukraine Ukraine Germany Russia
5 Belgium-Luxembourg Germany Ukraine Germany
6 France Belgium-Luxembourg Korea Ukraine
7 Korea France France Italy
8 Italy Korea Belgium-Luxembourg Belgium
9 China Italy Italy Turkey
10 Brazil Brazil France France
Source: worldsteel
'00 '03 '06 '09 '12 '15
9.5
4.5
10.4
4.3
2.1
10.58.4
4.3
10.3
10.3 8.8
6.7
24.1
Source: worldsteel
Statistical Review of the Steel Trade in Northeast AsiaChu, Ji-miResearcherPOSCO Research [email protected]
operations, including TENIGAL in Mexico, NSGT in Thai-
land, and NSBS in Singapore, in order to meet demand for
and secure supply of high-quality cold rolled sheets exclu-
sively for the automotive industry. It plans to produce high
strength steel and advanced high-strength steel (AHSS) at
JCAPCPL, a joint venture with India. NSSMC is expanding
facilities in the USA. This shows that NSSMC has moved
Source: JISF, NSSMC
EU
Brazil
-12.8%
0.30.7
China
India Mexico
-6.1%
5.47.6
Korea6.6
10.6
-8.9%
15.7%
2.5 1.2
6.2%
1.9 1.4
Middle East
ASEAN
1.5%
12.4 11.5
12.0%
1.7 0.9
17.6%
0.2 0.1
Japan’s Steel Export Growth and Overseas Investment Japan
USA
7.4%
256 171
CAGR ‘2015 ‘2010(Mt) Automotive
Infrastructure Construction
Energy
2014 2015 20162011
VSB
2013
NSBS CSVC AW/NSTENIGAL JCAPCPLNSGT StandardSteel
NSCh BNA ICI VAMBRN
NSSMC Overseas Downstream Investment
114 Asian Steel Watch
Market Trend and Analysis
Korea’s Steel Export Growth and Location of Downstream Facilities
Brazil
0.00.1
-24.6%
EU
13.9%
2.4 1.3
2.5%
6.3 5.6
ASEAN
Turkey
36.1%
1.1 0.2
Source: KOSIS, POSCO
Japan
4.6%3.5 2.8
Assan TST
P-VietnamP-VSTP-MalaysiaP-Thainox
2.2%
2.3 2.1
Middle East
India
12.6%
3.0 1.7
USA13.6%
4.0 2.1
Mexico
10.7%1.7 1.0
Korea
POSCO-Mexico
QingdaoSTS
China
-1.7%
4.14.5
Maharashtra
UPI/USP
beyond exporting steel materials and high-quality steel
products, toward local production of high-strength steel,
solidifying its footing in overseas markets.
Korea gears up to meet demand for steel materials through overseas downstream investment
Influenced by sluggish domestic demand due to mature
industries and the market dominance of Chinese products,
the Korean market became saturated. Desperate for new
markets, Korea followed in the footsteps of China, simply
exporting products overseas and diversifying export desti-
nations. As a result, Korea ended up in a difficult situation,
between China’s heavy exports of cheap products and
Japan’s steel materials and high-quality steel. Korea began
investing in downstream facilities in overseas markets,
including Turkey, Mexico, and India. Following the suc-
cessive completion of these downstream facilities in the
mid-2000s, Korea gradually opened routes for the supply
of steel materials. Korea’s steel exports increased a re-
cord-breaking 10.5% in 2014.
Once production of galvanized sheets and stainless steel
cold-rolled (STS CR) began in Mexico and Turkey, where
Korea has made investments in downstream facilities, Ko-
rea achieved real results. Korea’s steel exports to Turkey
and Mexico increased at CAGR of 36.1% and 10.7%, re-
spectively, from 2010 to 2015. P-Mexico began operation
of a 900,000-tonne galvanized sheet facility for automo-
tive, home appliances, and construction, in two phases,
in 2009 and 2013. Accordingly, the share of its key steel
material, cold-rolled (CR) coil, increased to 35% in 2014.
Vietnam-based P-VIETNAM and P-VST and Thailand-based
P-Thainox began producing CR, STS CR, and electrolytic
galvanized sheets (EG). Related steel materials, such as HR
and STS HR coil, account for 53% of steel exports. Despite
the new downstream operations in Vietnam, Korea’s exports
to Vietnam rose only 2.6% from 2010 to 2015, owing largely
to heavy inflows of cheap Chinese products. Considering
Vietnam’s high economic growth, there is much room for
exports to increase. All in all, Korea is gearing up to increase
the supply of steel materials through strengthened local
strategies in order to increase steel exports.
CAGR(Mt)
‘2015 ‘2010
Downstream facilities
Vol.02 October 2016 115
S T A T I S T I C A L R E V I E W O F T H E S T E E L T R A D E I N N O R T H E A S T A S I A
High Export Similarity Index in Northeast Asia
This article has reviewed the change of the steel trading
landscape among Korea, China, and Japan. Has competi-
tion for exports intensified among the three countries follow-
ing the transition of the trading patterns? Taking a look at the
Export Similarity Index (ESI), Korea and Japan have been
in competition for the last ten years, and China’s rapid rise
has intensified competition between Korea and China, and
Galvanized 5%
CR 3%Pipe 47%
HR 20%
Others 11% Plate 6%Long 8%
USA
Pipe 3% Others 12%
Long 9%
Plate 4%
HR 17%
Galvanized 20% 3%
Mexico
CR 35%
Source: KOSIS, POSCO
CR 41%
Long 3% Plate 5%
India
Galvanized 7%
HR 29%Others 15%
STS HR 6%
CR 5%
Galvanized 3%
Pipe 6%Others 7% Long 13%
HR 47%
Plate 13%
China
countries is more similar. Export and import data of Korea, China, and Japan are those from the World Steel Export
(ISSB) on 27 steel products in 80 countries.
ESIab = �𝑀𝑀𝑀𝑀𝑀𝑀𝑀𝑀𝑀𝑀𝑀𝑀[𝑋𝑋𝑋𝑋𝑖𝑖𝑖𝑖𝑖𝑖𝑖𝑖
(a)/ X(a), 𝑋𝑋𝑋𝑋𝑖𝑖𝑖𝑖(b)/X(b)]
Xi(a): country a’s total export value of product i,
X(a): country a’s total export value
𝑋𝑋𝑋𝑋𝑖𝑖𝑖𝑖(b): country b’s total export value of product i,
𝑋𝑋𝑋𝑋(b): country b’s total export value
< ESI for steel of Korea, China, and Japan in world
market >
2005 2007 2009 2011 2013 2014
Korea
-
Japan
0.70 0.73 0.71 0.76 0.72 0.71
Korea
-
China
0.55 0.63 0.61 0.69 0.67 0.68
China
-
Japan
0.68 0.75 0.65 0.70 0.65 0.70
Xi(a): country a’s total export value of product i,
X(a): country a’s total export value
Xi(b): country b’s total export value of product i,
X(b): country b’s total export value
Breakdown of Korea’s Steel Exports by Country (’14)
China and Japan. Korea and Japan’s ESI is high, over 0.7
between 2005 and 2014. Korea and China’s ESI increased
from 0.55 in 2005 to 0.68 in 2014, and China and Japan’s
ESI increased from 0.68 in 2005 to 0.7 in 2014.
Competition for steel exports among Korea, China, and
Japan has intensified. As the USA, EU, and the ASEAN
strengthen protectionist measures for their steel industries,
global steel trade will contract and heighten the rivalry among
the three countries.
ESI for steel of Korea, China, and Japan in world market
2005 2007 2009 2011 2013 2014
Korea-Japan 0.70 0.73 0.71 0.76 0.72 0.71
Korea-China 0.55 0.63 0.61 0.69 0.67 0.68
China-Japan 0.68 0.75 0.65 0.70 0.65 0.70
The Export Similarity Index (ESI) measures the extent to which two countries compete by exporting the same products in a
certain market. The index ranges from 0 to 1 and a higher value denotes that the composition of exports between the countries
is more similar. Export and import data of Korea, China, and Japan are those from the World Steel Export (ISSB) on 27 steel
products in 80 countries.
The information, opinions, and analyses herein belong to the authors and do not necessarily represent the official views of POSCO Research Institute
(POSRI). To the best of our knowledge, the information contained herein is accurate and reliable as of the date of publication; however, we do not as-
sume any liability whatsoever for the accuracy and completeness of the information, opinions, or analysis.
We believe the information used in the preparation of this publication to be reliable; however, the reliability of this information cannot be guaranteed.
Although this publication has been made with all possible care and diligence, POSRI cannot guarantee the accuracy, completeness, or correctness of
any information included. This publication is intended for general information and is not intended to be relied upon by readers in making any specific
investment or decision.
POSRI shall not be responsible for any errors or omissions, or any loss, damage, or expenses incurred by reliance on any information or statement
contained herein. For more information, please contact POSCO Research Institute at [email protected], or 1 82 2 3457 8000.