146
October 2016 Groundwater and Surface Water Sampling at the Old and New Rifle, Colorado, Processing Sites January 2017 LMS/RFN/RFO/S01016

October 2016 Groundwater and Surface Water Sampling at the Old and New Rifle, Colorado, Processing Sites January 2017
LMS/RFN/RFO/S01016

This page intentionally left blank

U.S. Department of Energy DVP—October 2016, Rifle, Colorado January 2017 RINs 16108114 and 16108115 Page i
Contents Sampling Event Summary ...............................................................................................................1 Data Assessment Summary..............................................................................................................3
Water Sampling Field Activities Verification Checklist .............................................................5 Laboratory Performance Assessment ..........................................................................................7 Sampling Quality Control Assessment ......................................................................................23 Certification ...............................................................................................................................26
New Rifle, Colorado, Processing Site, Planned Sampling Map ....................................................31 Old Rifle, Colorado, Processing Site, Planned Sampling Map......................................................32 Attachment 1—Sampling and Analysis Work Order Attachment 2—Trip Report Attachment 3—Data Presentation Groundwater Quality Data New Rifle Surface Water Quality Data New Rifle Groundwater Quality Data Old Rifle Surface Water Quality Data Old Rifle Static Water Level Data Time-Concentration Graphs New Rifle Groundwater Time-Concentration Graphs Old Rifle Groundwater Attachment 4—Assessment of Anomalous Data Potential Outliers Report

DVP—October 2016, Rifle, Colorado U.S. Department of Energy RINs 16108114 and 16108115 January 2017 Page ii
This page intentionally left blank

U.S. Department of Energy DVP—October 2016, Rifle, Colorado January 2017 RINs 16108114 and 16108115 Page 1
Sampling Event Summary Site: Old and New Rifle, Colorado, Processing Sites Sampling Period: October 31–November 2, 2016 Water samples were collected from 38 locations at New Rifle and Old Rifle, Colorado, Processing Sites. Planned monitoring locations are shown in Attachment 1, Sampling and Analysis Work Order. Duplicate samples were collected from New Rifle (RFN) locations 0201 and 0216, and Old Rifle (RFO) location 0310. See Attachment 2, Trip Report, for additional details. Sampling and analyses were conducted as specified in Sampling and Analysis Plan for U.S. Department of Energy Office of Legacy Management Sites (LMS/PRO/S04351, continually updated, http://energy.gov/lm/downloads/sampling-and-analysis-plan-us-department-energy-office-legacy-management-sites). New Rifle Site Samples were collected at the New Rifle site from 17 monitoring wells and 8 surface locations in compliance with the December 2008 Groundwater Compliance Action Plan [GCAP] for the New Rifle, Colorado, Processing Site (LMS/RFN/S01920). Analytes measured at the New Rifle site included contaminants of concern (COCs) arsenic, molybdenum, nitrate + nitrite as nitrogen, selenium, uranium, and vanadium, ammonia as nitrogen, major cations, and major anions. Field measurements of total alkalinity, oxidation-reduction potential, pH, specific conductance, turbidity, and temperature were made at each location, and the water level was measured at each sampled well. A proposed alternate concentration limit (ACL) for vanadium of 50 milligrams per liter (mg/L), specific to the point-of-compliance wells (RFN-0217, 0659, 0664, and 0669) is included in the New Rifle GCAP. Vanadium concentrations in the wells were below the proposed ACL as shown in the time-concentration graphs in Attachment 3, Data Presentation. The surface water locations were sampled to monitor the impact of groundwater discharge. COC concentrations at Colorado River surface water locations RFN-0324 and RFN-0326, downgradient of the site, remained low and were consistent with historical results, indicating no impact to the river due to groundwater discharge. In many cases, elevated COC concentrations at the New Rifle site pond locations were observed. As noted in the GCAP, this indicates impacts from groundwater discharge to the ponds. Old Rifle Site Samples were collected at the Old Rifle site from eight monitoring wells and five surface locations in compliance with the December 2001 Groundwater Compliance Action Plan for the Old Rifle, Colorado, UMTRA Project Site (GJO-2000-177-TAR). Analytes measured at the Old Rifle site included COCs selenium, uranium, and vanadium, major cations, and major anions. Field measurements of total alkalinity, oxidation-reduction potential,

U.S. Department of Energy DVP—October 2016, Rifle, Colorado January 2017 RINs 16108114 and 16108115 Page 3
Data Assessment Summary

DVP—October 2016, Rifle, Colorado U.S. Department of Energy RINs 16108114 and 16108115 January 2017 Page 4
This page intentionally left blank

U.S. D
epartment of Energy
D
VP—
October 2016, R
ifle, Colorado
January 2017
RIN
s 16108114 and 16108115
Page 5
Water Sampling Field Activities Verification Checklist
Project Rifle, Colorado Date(s) of Water Sampling October 31–November 2, 2016
Date(s) of Verification December 15 and 16, 2016 Name of Verifier Samantha Tigar
Response
(Yes, No, NA) Comments
1. Is the Sampling and Analysis Plan (SAP) the primary document directing field
procedures? Yes
List any Program Directives or other documents, SOPs, instructions. Work Order letter dated October 4, 2016. 2. Were the sampling locations specified in the planning documents sampled? Yes
3. Were field equipment calibrations conducted as specified in the above-named documents? No
Calibrations were performed October 28 and 31, 2016. The specific conductance cell constant for sonde “E” was out of range. Associated results have been qualified.
4. Was an operational check of the field equipment conducted daily? Yes On October 31, 2016, sonde “A” was calibrated and no operational check was performed, which is acceptable.
Did the operational checks meet criteria? No
The daily check for sonde “E” on November 2, 2016 was out of range for specific conductance. Associated results were previously qualified.
5. Were the number and types (alkalinity, temperature, specific conductance,
pH, turbidity, DO, ORP) of field measurements taken as specified? Yes 6. Were wells categorized correctly? Yes 7. Were the following conditions met when purging a Category I well:
Was one pump/tubing volume purged prior to sampling? Yes
Did the water level stabilize prior to sampling? Yes
Did pH, specific conductance, and turbidity measurements meet criteria prior to sampling? No
RFN-0195 did not meet Category I turbidity criteria and was filtered as required in the SAP. The pH did not stabilize at location RFO-0292A. The associated result has been qualified.
Was the flow rate less than 500 mL/min? Yes

DV
P—O
ctober 2016, Rifle, C
olorado
U.S. D
epartment of Energy
RIN
s 16108114 and 16108115
January 2017 Page 6
Water Sampling Field Activities Verification Checklist (continued)
Response
(Yes, No, NA) Comments
8. Were the following conditions met when purging a Category II well:
Was the flow rate less than 500 mL/min? Yes
Was one pump/tubing volume removed prior to sampling? Yes
9. Were duplicates taken at a frequency of one per 20 samples? Yes Duplicate samples were collected from RFN-0201, RFN-0216, and RFO-0310.
10. Were equipment blanks taken at a frequency of one per 20 samples that were
collected with non-dedicated equipment? NA 11. Were trip blanks prepared and included with each shipment of VOC samples? NA 12. Were the true identities of the QC samples documented? Yes 13. Were samples collected in the containers specified? Yes
14. Were samples filtered and preserved as specified? Yes
The anion and nitrate + nitrite as N labels had been switched on the containers for location RFO-0741. The laboratory identified the switch and corrected the labels before analysis.
15. Were the number and types of samples collected as specified? Yes
16. Were chain of custody records completed and was sample custody maintained? No
Several anion and nitrate + nitrite as N samples were inadvertently not included in the original shipment, but were listed on the Chain of Custody form.
17. Was all pertinent information documented on the field data sheets? Yes 18. Was the presence or absence of ice in the cooler documented at every sample
location? Yes 19. Were water levels measured at the locations specified in the planning
documents? Yes

U.S. Department of Energy DVP—October 2016, Rifle, Colorado January 2017 RINs 16108114 and 16108115 Page 7
Laboratory Performance Assessment General Information
Report Number (RIN): 16108114 Sample Event: October 31–November 2, 2016 Site(s): New Rifle, Colorado, Processing Site Laboratory: ALS Laboratory Group, Fort Collins, Colorado Work Order No.: 1611102 Analysis: Metals and Wet Chemistry Validator: Samantha Tigar Review Date: December 15, 2016
This validation was performed according to the “Standard Practice for Validation of Environmental Data” found in Appendix A of the Sampling and Analysis Plan for U.S. Department of Energy Office of Legacy Management Sites (LMS/PRO/S04351, continually updated, http://energy.gov/lm/downloads/sampling-and-analysis-plan-us-department-energy-office-legacy-management-sites). The procedure was applied at Level 3, Data Validation. This validation includes the evaluation of data quality indicators (DQIs) associated with the data. DQIs are the quantitative and qualitative descriptors that are used to interpret the degree of acceptability or utility of data. Indicators of data quality include the analysis of laboratory control samples to assess accuracy; duplicates and replicates to assess precision; and interference check samples to assess bias (see attached Data Validation Worksheets). The DQIs comparability, completeness, and sensitivity are also evaluated in the sections to follow. All analyses were successfully completed. The samples were prepared and analyzed using accepted procedures based on methods specified by line item code, which are listed in Table 1.
Table 1. Analytes and Methods
Analyte Line Item Code Prep Method Analytical Method Ammonia as N WCH-A-005 EPA 350.1 EPA 350.1 Arsenic, Molybdenum, Selenium, Uranium, Vanadium LMM-02 SW-846 3005A SW-846 6020A
Calcium, Magnesium, Potassium, Sodium LMM-01 SW-846 3005A SW-846 6010B
Chloride, Sulfate MIS-A-045 SW-846 9056 SW-846 9056
Nitrate + Nitrite as N WCH-A-022 EPA 353.2 EPA 353.2
Data Qualifier Summary Analytical results were qualified as listed in Table 2. Refer to the sections below for an explanation of the data qualifiers applied.

DVP—October 2016, Rifle, Colorado U.S. Department of Energy RINs 16108114 and 16108115 January 2017 Page 8
Table 2. Data Qualifier Summary
Sample Number Location Analyte(s) Flag Reason
1611102-1 0169 Molybdenum U Less than 5x the continuing calibration blank
1611102-5 0201 Nitrate + nitrite as N J Field duplicate difference > practical quantitation limit
1611102-27 0201 Duplicate Nitrate + nitrite as N J Field duplicate difference > practical quantitation limit
All All Specific conductance J Calibration out of range
Sample Shipping/Receiving ALS Laboratory Group in Fort Collins, Colorado, received 27 water samples on November 4, 2016, accompanied by Chain of Custody forms. Copies of the air bills were included in the receiving documentation. The Chain of Custody forms were checked to confirm that all of the samples were listed and that signatures and dates were present indicating sample relinquishment and receipt. The sample submittal documents including the Chain of Custody forms had no errors or omissions. Preservation and Holding Times The sample shipment was received intact with the temperature inside the iced cooler at 5.6 °C, which complies with requirements. All samples were received in the correct container types and had been preserved correctly for the requested analyses. All samples were analyzed within the applicable holding times. Detection and Quantitation Limits A method detection limit (MDL) is defined in 40 CFR 136 as the minimum concentration of an analyte that can be measured and reported with 99% confidence that the analyte concentration is greater than zero. The MDLs reported by the laboratory were compared to the required MDLs to assess the sensitivity of the analyses and found to be in compliance with contractual requirements. The practical quantitation limit (PQL) for an analyte, defined as 5 times the MDL, is the lowest concentration that can be quantitatively measured, and is used when evaluating laboratory method performance in the sections below. Laboratory Instrument Calibration Method requirements for satisfactory instrument calibration are established to ensure that the instrument is capable of producing acceptable qualitative and quantitative data for the analytes of interest. Initial Calibration Verification (ICV) demonstrates that the instrument is capable of acceptable performance at the beginning of the analytical run. Continuing Calibration Verification (CCV) demonstrates that the initial calibration is still valid by checking the performance of the instrument on a continuing basis. Initial and continuing calibration standards must be prepared from independent sources to ensure the validity of the calibration. All

U.S. Department of Energy DVP—October 2016, Rifle, Colorado January 2017 RINs 16108114 and 16108115 Page 9
laboratory instrument calibrations and calibration verifications were performed correctly in accordance with the cited methods. Method EPA 350.1 Ammonia as N Calibrations were performed on November 23, 2016, using six calibration standards. The calibration curve correlation coefficient values were greater than 0.995 and the absolute values of the intercepts were less than 3 times the MDL as required by the cited method. The ICV and CCV checks were made at the required frequency. All calibration checks met the acceptance criteria. Method EPA 353.2 Nitrate + Nitrite as N Calibrations were performed using seven calibration standards on November 22, 2016. The calibration curve correlation coefficient values were greater than 0.995 and the absolute values of the intercepts were less than 3 times the MDL as required by the cited method. The ICV and CCV checks were made at the required frequency. All calibration checks met the acceptance criteria. Method SW-846 6010B Ca, Mg, K, Na Calibrations were performed on November 18, 2016, using three calibration standards. The calibration curve correlation coefficient values were greater than 0.995 and the absolute values of the intercepts were less than 3 times the MDL as required by the cited method. The ICV and CCV checks were made at the required frequency. All calibration checks met the acceptance criteria. Reporting limit verification checks were made at the required frequency to verify the linearity of the calibration curve near the PQL and all results were within the acceptance range. Method SW-846 6020A As, Mo, Se, U, V Calibrations were performed using four calibration standards on November 18 and 19, 2016. The calibration curve correlation coefficient values were greater than 0.995 and the absolute values of the intercepts were less than 3 times the MDL as required by the cited method. The ICV and CCV checks were made at the required frequency. All calibration checks met the acceptance criteria. Reporting limit verification checks were made at the required frequency to verify the linearity of the calibration curve near the PQL. Mass calibration and resolution verifications were performed at the beginning of each analytical run in accordance with the analytical procedure. Internal standard recoveries associated with requested analytes were stable and within acceptable ranges. Method SW-846 9056 Chloride, Sulfate Calibrations were performed on November 14, 2016, using six calibration standards. The calibration curve correlation coefficient values were greater than 0.995 and the absolute values of the intercepts were less than 3 times the MDL as required by the cited method. The ICV and CCV checks were made at the required frequency. All calibration checks met the acceptance criteria. Method and Calibration Blanks Method blanks are analyzed to assess any contamination that may have occurred during sample preparation. Calibration blanks are analyzed to assess instrument contamination prior to and during sample analysis. All method blank and calibration blank results associated with the samples were below the PQLs for all analytes. In cases where the blank concentration exceeds

DVP—October 2016, Rifle, Colorado U.S. Department of Energy RINs 16108114 and 16108115 January 2017 Page 10
the MDL, associated sample results that are greater than the MDL but less than 5 times the blank concentration are qualified with a “U” flag as not detected. Inductively Coupled Plasma Interference Check Sample Analysis Interference check samples are analyzed to verify the instrumental interelement and background correction factors and assess any bias due to interelement interferences. Interference check samples were analyzed at the required frequency with all results meeting the acceptance criteria. Matrix Spike Analysis Matrix spikes are aliquots of environmental samples to which a known concentration of an analyte has been added before analysis. Matrix spike and matrix-spike duplicate (MS/MSD) analysis is used to assess the performance of the method by measuring the effects of interferences caused by the sample matrix and reflects the bias of the method for the particular matrix in question. The MS/MSD data are not evaluated when the concentration of the unspiked sample is greater than 4 times the spike concentration. The spikes met the recovery and precision criteria for all analytes. Laboratory Replicate Analysis Laboratory replicate analyses are used to determine laboratory precision for each sample matrix. The relative percent difference for replicate results that are greater than 5 times the PQL should be less than 20%. For results that are less than 5 times the PQL, the range should be no greater than the PQL. All replicate results met these criteria, demonstrating acceptable precision. Laboratory Control Samples Laboratory control samples (LCS) were analyzed at the correct frequency to provide information on the accuracy of the analytical method and the overall laboratory performance, including sample preparation. The LCS results were acceptable for all analyses. Metals Serial Dilution Serial dilutions were prepared and analyzed for the metals analyses to monitor chemical or physical interferences in the sample matrix. Serial dilution data are evaluated when the concentration of the undiluted sample is greater than 50 times the MDL. All evaluated serial dilution data were acceptable. Completeness Results were reported in the correct units for all analytes requested using contract-required laboratory qualifiers.

U.S. Department of Energy DVP—October 2016, Rifle, Colorado January 2017 RINs 16108114 and 16108115 Page 11
Electronic Data Deliverable (EDD) File The EDD file arrived on December 3, 2016. The Sample Management System EDD validation module was used to verify that the EDD files were complete and in compliance with requirements. The module compares the contents of the file to the requested analyses to ensure all and only the requested data are delivered. The contents of the EDD were manually examined to verify that the sample results accurately reflect the data contained in the sample data package. Anion/Cation Balance Environmental water should be electrically neutral. Expressed in milliequivalents per liter (meq/L), the sum of the anions should equal the sum of the cations. The anion/cation balance is calculated as the difference between the anions and cations, divided by the sum of the anions and cations. The anion/cation balance can be used to identify potential errors in the analytical results. Typically, a charge balance of less than 10% is considered acceptable. When a charge balance is greater than 10%, the associated data are closely examined for error. If no errors are found, the results are considered to be acceptable. Table 3 shows the total anion and cation results from this event and the charge balance.
Table 3. Comparison of Major Anions and Cations
Location Location Type Cations (meq/L)
Anions (meq/L)
Charge Balance (%)
0169 Groundwater 23.7 24.1 0.9 0170 Groundwater 39.1 39.3 0.2 0172 Groundwater 137.5 155.6 6.2 0195 Groundwater 13.2 13.1 0.3 0201 Groundwater 46.6 47.1 0.5 0215 Groundwater 17.2 18.0 2.3 0216 Groundwater 13.9 14.7 2.8 0217 Groundwater 43.9 46.1 2.4 0320 Surface water 69.9 72.3 1.7 0322 Surface water 10.3 10.6 1.5 0323 Surface water 85.1 86.6 0.9 0324 Surface water 10.5 10.5 0.2 0326 Surface water 10.5 11.2 3.1 0452 Surface water 81.2 84.1 1.8 0453 Surface water 57.2 59.6 2.0 0575 Surface water 112.6 121.1 3.6 0590 Groundwater 60.3 64.2 3.1 0620 Groundwater 93.5 104.8 5.7 0635 Groundwater 28.9 30.7 2.9 0658 Groundwater 41.1 42.1 1.2 0659 Groundwater 43.4 41.0 2.8 0664 Groundwater 23.6 22.6 2.0 0669 Groundwater 25.6 30.3 8.3 0670 Groundwater 23.4 23.2 0.6 0855 Groundwater 24.3 23.9 0.8
All charge balance values were below 10%.

DVP—October 2016, Rifle, Colorado U.S. Department of Energy RINs 16108114 and 16108115 January 2017 Page 12
Figure 1. General Validation Worksheet

U.S. D
epartment of Energy
D
VP—
October 2016, R
ifle, Colorado
January 2017
RIN
s 16108114 and 16108115
Page 13
Figure 2. Wet Chemistry Validation Worksheet

DV
P—O
ctober 2016, Rifle, C
olorado
U.S. D
epartment of Energy
RIN
s 16108114 and 16108115
January 2017 Page 14
Figure 3. Metals Validation Worksheet

U.S. Department of Energy DVP—October 2016, Rifle, Colorado January 2017 RINs 16108114 and 16108115 Page 15
General Information
Report Number (RIN): 16108115 Sample Event: October 31–November 2, 2016 Site(s): Old Rifle, Colorado, Processing Site Laboratory: ALS Laboratory Group, Fort Collins, Colorado Work Order No.: 1611103 Analysis: Metals and Wet Chemistry Validator: Samantha Tigar Review Date: December 16, 2016
This validation was performed according to the “Standard Practice for Validation of Environmental Data” found in Appendix A of the Sampling and Analysis Plan for U.S. Department of Energy Office of Legacy Management Sites (LMS/PRO/S04351, continually updated, http://energy.gov/lm/downloads/sampling-and-analysis-plan-us-department-energy-office-legacy-management-sites). The procedure was applied at Level 3, Data Validation. This validation includes the evaluation of data quality indicators (DQIs) associated with the data. DQIs are the quantitative and qualitative descriptors that are used to interpret the degree of acceptability or utility of data. Indicators of data quality include the analysis of laboratory control samples to assess accuracy; duplicates and replicates to assess precision; and interference check samples to assess bias (see attached Data Validation Worksheets). The DQIs comparability, completeness, and sensitivity are also evaluated in the sections to follow. All analyses were successfully completed. The samples were prepared and analyzed using accepted procedures based on methods specified by line item code, which are listed in Table 4.
Table 4. Analytes and Methods
Analyte Line Item Code Prep Method Analytical Method Selenium, Uranium, Vanadium LMM-02 SW-846 3005A SW-846 6020A Calcium, Magnesium, Potassium, Sodium LMM-01 SW-846 3005A SW-846 6010B
Chloride, Sulfate MIS-A-045 SW-846 9056 SW-846 9056
Nitrate + Nitrite as N WCH-A-022 EPA 353.2 EPA 353.2
Data Qualifier Summary Analytical results were qualified as listed in Table 5. Refer to the sections below for an explanation of the data qualifiers applied.

DVP—October 2016, Rifle, Colorado U.S. Department of Energy RINs 16108114 and 16108115 January 2017 Page 16
Table 5. Data Qualifier Summary
Sample Number Location Analyte(s) Flag Reason
1611103-1 0292A pH J Stability criteria not met 1611103-8 0396 Specific conductance J Calibration did not meet criteria 1611103-13 0741 Specific conductance J Calibration did not meet criteria
Sample Shipping/Receiving ALS Laboratory Group in Fort Collins, Colorado, received 14 water samples on November 4 and 9, 2016, accompanied by Chain of Custody forms. Copies of the air bills were included in the receiving documentation. The Chain of Custody forms were checked to confirm that all of the samples were listed and that signatures and dates were present indicating sample relinquishment and receipt. The sample submittal documents including the Chain of Custody forms contained the following errors. Due to an oversight, the sample containers for anions and nitrate + nitrite as N at several locations were not included in the first shipment but were listed on the Chain of Custody forms. For location RFO-0741, the labels were switched on the sample containers for anions and nitrate + nitrite as N. The laboratory discovered the error upon receipt and corrected the labels before analysis. Preservation and Holding Times The sample shipment was received intact with the temperature inside the iced coolers at 3.8 °C and 5.6 °C, which complies with requirements. All samples were received in the correct container types and had been preserved correctly for the requested analyses. All samples were analyzed within the applicable holding times. Detection and Quantitation Limits A method detection limit (MDL) is defined in 40 CFR 136 as the minimum concentration of an analyte that can be measured and reported with 99% confidence that the analyte concentration is greater than zero. The MDLs reported by the laboratory were compared to the required MDLs to assess the sensitivity of the analyses and found to be in compliance with contractual requirements. The practical quantitation limit (PQL) for an analyte, defined as 5 times the MDL, is the lowest concentration that can be quantitatively measured, and is used when evaluating laboratory method performance in the sections below. Laboratory Instrument Calibration Method requirements for satisfactory instrument calibration are established to ensure that the instrument is capable of producing acceptable qualitative and quantitative data for the analytes of interest. Initial Calibration Verification (ICV) demonstrates that the instrument is capable of acceptable performance at the beginning of the analytical run. Continuing Calibration Verification (CCV) demonstrates that the initial calibration is still valid by checking the

U.S. Department of Energy DVP—October 2016, Rifle, Colorado January 2017 RINs 16108114 and 16108115 Page 17
performance of the instrument on a continuing basis. Initial and continuing calibration standards must be prepared from independent sources to ensure the validity of the calibration. All laboratory instrument calibrations and calibration verifications were performed correctly in accordance with the cited methods. Method EPA 353.2 Nitrate + Nitrite as N Calibrations were performed using seven calibration standards on November 21, 2016. The calibration curve correlation coefficient values were greater than 0.995 and the absolute values of the intercepts were less than 3 times the MDL as required by the cited method. The ICV and CCV checks were made at the required frequency. All calibration checks met the acceptance criteria. Method SW-846 6010B Ca, Mg, K, Na Calibrations were performed on November 18, 2016, using three calibration standards. The calibration curve correlation coefficient values were greater than 0.995 and the absolute values of the intercepts were less than 3 times the MDL as required by the cited method. The ICV and CCV checks were made at the required frequency. All calibration checks met the acceptance criteria. Reporting limit verification checks were made at the required frequency to verify the linearity of the calibration curve near the PQL and all results were within the acceptance range. Method SW-846 6020A Se, U, V Calibrations were performed on November 18, 2016, using four calibration standards. The calibration curve correlation coefficient values were greater than 0.995 and the absolute values of the intercepts were less than 3 times the MDL as required by the cited method. The ICV and CCV checks were made at the required frequency. All calibration checks met the acceptance criteria. Reporting limit verification checks were made at the required frequency to verify the linearity of the calibration curve near the PQL. Mass calibration and resolution verifications were performed at the beginning of each analytical run in accordance with the analytical procedure. Internal standard recoveries associated with requested analytes were stable and within acceptable ranges. Method SW-846 9056 Chloride, Sulfate Calibrations were performed on November 14, 2016, using six calibration standards. The calibration curve correlation coefficient values were greater than 0.995 and the absolute values of the intercepts were less than 3 times the MDL as required by the cited method. The ICV and CCV checks were made at the required frequency. All calibration checks met the acceptance criteria. Method and Calibration Blanks Method blanks are analyzed to assess any contamination that may have occurred during sample preparation. Calibration blanks are analyzed to assess instrument contamination prior to and during sample analysis. All method blank and calibration blank results associated with the samples were below the PQLs for all analytes. In cases where the blank concentration exceeds the MDL, associated sample results that are greater than the MDL but less than 5 times the blank concentration are qualified with a “U” flag as not detected.

DVP—October 2016, Rifle, Colorado U.S. Department of Energy RINs 16108114 and 16108115 January 2017 Page 18
Inductively Coupled Plasma Interference Check Sample Analysis Interference check samples are analyzed to verify the instrumental interelement and background correction factors and assess any bias due to interelement interferences. Interference check samples were analyzed at the required frequency with all results meeting the acceptance criteria. Matrix Spike Analysis Matrix spikes are aliquots of environmental samples to which a known concentration of an analyte has been added before analysis. Matrix spike and matrix-spike duplicate (MS/MSD) analysis is used to assess the performance of the method by measuring the effects of interferences caused by the sample matrix and reflects the bias of the method for the particular matrix in question. The MS/MSD data are not evaluated when the concentration of the unspiked sample is greater than 4 times the spike concentration. The spikes met the recovery and precision criteria for all analytes. Laboratory Replicate Analysis Laboratory replicate analyses are used to determine laboratory precision for each sample matrix. The relative percent difference for replicate results that are greater than 5 times the PQL should be less than 20%. For results that are less than 5 times the PQL, the range should be no greater than the PQL. All replicate results met these criteria, demonstrating acceptable precision. Laboratory Control Samples Laboratory control samples (LCS) were analyzed at the correct frequency to provide information on the accuracy of the analytical method and the overall laboratory performance, including sample preparation. The LCS results were acceptable for all analyses. Metals Serial Dilution Serial dilutions were prepared and analyzed for the metals analyses to monitor chemical or physical interferences in the sample matrix. Serial dilution data are evaluated when the concentration of the undiluted sample is greater than 50 times the MDL. All evaluated serial dilution data were acceptable. Completeness Results were reported in the correct units for all analytes requested using contract-required laboratory qualifiers. Electronic Data Deliverable (EDD) File The EDD file arrived on December 3, 2016. The Sample Management System EDD validation module was used to verify that the EDD files were complete and in compliance with requirements. The module compares the contents of the file to the requested analyses to ensure

U.S. Department of Energy DVP—October 2016, Rifle, Colorado January 2017 RINs 16108114 and 16108115 Page 19
all and only the requested data are delivered. The contents of the EDD were manually examined to verify that the sample results accurately reflect the data contained in the sample data package. Anion/Cation Balance Environmental water should be electrically neutral. Expressed in milliequivalents per liter (meq/L), the sum of the anions should equal the sum of the cations. The anion/cation balance is calculated as the difference between the anions and cations, divided by the sum of the anions and cations. The anion/cation balance can be used to identify potential errors in the analytical results. Typically, a charge balance of less than 10% is considered acceptable. When a charge balance is greater than 10%, the associated data are closely examined for error. If no errors are found, the results are considered to be acceptable. Table 6 shows the total anion and cation results from this event and the charge balance.
Table 6. Comparison of Major Anions and Cations
Location Location Type Cations (meq/L)
Anions (meq/L)
Charge Balance (%)
0292A Groundwater 29.1 32.2 4.9 0294 Surface water 10.4 9.6 3.9 0304 Groundwater 29.2 23.8 10.2 0305 Groundwater 24.6 30.5 10.7 0309 Groundwater 27.2 27.9 1.2 0310 Groundwater 31.2 32.1 1.4 0395 Surface water 20.6 20.2 1.1 0396 Surface water 10.5 10.6 0.2 0398 Surface water 15.5 14.5 3.5 0655 Groundwater 31.8 31.1 1.2 0656 Groundwater 26.7 27.2 0.9 0658 Groundwater 18.6 20.2 4.1 0741 Surface water 10.4 10.3 0.5
Locations RFO-0304 and RFO-0305 had charge balances slightly greater than 10%. There were no analytical errors identified during the review of the laboratory data. All other charge balances were below 10%.

DVP—October 2016, Rifle, Colorado U.S. Department of Energy RINs 16108114 and 16108115 January 2017 Page 20
Figure 4. General Validation Worksheet

U.S. D
epartment of Energy
D
VP—
October 2016, R
ifle, Colorado
January 2017
RIN
s 16108114 and 16108115
Page 21
Figure 5. Wet Chemistry Validation Worksheet

DV
P—O
ctober 2016, Rifle, C
olorado
U.S. D
epartment of Energy
RIN
s 16108114 and 16108115
January 2017 Page 22
Figure 6. Metals Validation Worksheet

U.S. Department of Energy DVP—October 2016, Rifle, Colorado January 2017 RINs 16108114 and 16108115 Page 23
Sampling Quality Control Assessment The following information summarizes and assesses quality control for this sampling event. Sampling Protocol Sample results for all monitoring wells were qualified with an “F” flag, indicating the wells were purged and sampled using the low-flow method. At all monitoring well locations, purging and sampling met the Category I criteria with the following exceptions. Wells RFN-0669 and RFN-0670 were classified as Category II because they produced water at a rate less than the minimum low-flow purging rate. The sample results for these wells were qualified with a “Q” flag (qualitative), indicating the samples were not collected under the optimal conditions of the Category I stability criteria. During calibration of sonde “E,” the cell constant for specific conductance was out of range. All associated readings were qualified with a “J” flag as an estimated value. On November 2, 2016, the specific conductance was out of range for sonde “E.” Associated results were previously qualified. At location RFO-0292A, pH stability was not achieved and the associated reading was qualified with a “J” flag as an estimated value. Field Duplicate Assessment Field duplicate samples are collected and analyzed as an indication of overall precision of the measurement process. The precision observed includes both field and laboratory precision and has more variability than laboratory duplicates, which measure only laboratory performance. Duplicate samples were collected from locations RFN-0201, RFN-0216, and RFO-0310. The relative percent difference for duplicate results that are greater than 5 times the PQL should be less than 20%. For results that are less than 5 times the PQL, the range should be no greater than the PQL. The duplicate results met the criteria, demonstrating acceptable overall precision with the following exception. Nitrate + nitrite as N at location RFN-0201 exceeded acceptance criteria and the associated results were qualified with a “J” flag as an estimated value.

DVP—October 2016, Rifle, Colorado U.S. Department of Energy RINs 16108114 and 16108115 January 2017 Page 24
Figure 7. Field Duplicates Validation Worksheet, RIN 16108114

U.S. Department of Energy DVP—October 2016, Rifle, Colorado January 2017 RINs 16108114 and 16108115 Page 25
Figure 8. Field Duplicate Validation Worksheet, RIN 16108115


Page 27
Attachment 1
Sampling and Analysis Work Order

Page 28
This page intentionally left blank

Page 29

Page 30

Page 31
New Rifle, Colorado, Processing Site, Planned Sampling Map

Page 32
Old Rifle, Colorado, Processing Site, Planned Sampling Map

Page 33

Page 34

Page 35
Attachment 2
Trip Report

Page 36
This page intentionally left blank

Page 37

Page 38

Page 39
Attachment 3
Data Presentation

Page 40
This page intentionally left blank

Page 41
Groundwater Quality Data
New Rifle

Page 42
This page intentionally left blank

Page 43
Groundwater Quality Data by Location (USEE100) FOR SITE RFN01, Rifle New Processing Site REPORT DATE: 12/19/2016 Location: 0169 WELL
Parameter Units Sample Date ID
Depth Range (Ft BLS) Result Qualifiers
Lab Data QA Detection
Limit Uncertainty
Alkalinity, Total (as CaCO3) mg/L 10/31/2016 N001 3.13 - 18.13 464 F #
Ammonia Total as N mg/L 10/31/2016 N001 3.13 - 18.13 0.1 U F # 0.1
Arsenic mg/L 10/31/2016 N001 3.13 - 18.13 0.00046 J F # 0.00012
Calcium mg/L 10/31/2016 N001 3.13 - 18.13 170 F # 0.024
Chloride mg/L 10/31/2016 N001 3.13 - 18.13 60 F # 2
Magnesium mg/L 10/31/2016 N001 3.13 - 18.13 98 F # 0.03
Molybdenum mg/L 10/31/2016 N001 3.13 - 18.13 0.0046 UF # 0.00032
Nitrate + Nitrite as Nitrogen mg/L 10/31/2016 N001 3.13 - 18.13 0.13 F # 0.01
Oxidation Reduction Potential mV 10/31/2016 N001 3.13 - 18.13 103.3 F #
pH s.u. 10/31/2016 N001 3.13 - 18.13 6.98 F #
Potassium mg/L 10/31/2016 N001 3.13 - 18.13 5.5 F # 0.052
Selenium mg/L 10/31/2016 N001 3.13 - 18.13 0.0047 F # 0.00066
Sodium mg/L 10/31/2016 N001 3.13 - 18.13 160 F # 0.047
Specific Conductance umhos/cm 10/31/2016 N001 3.13 - 18.13 1776 JF #
Sulfate mg/L 10/31/2016 N001 3.13 - 18.13 630 F # 5
Temperature C 10/31/2016 N001 3.13 - 18.13 16.81 F #
Turbidity NTU 10/31/2016 N001 3.13 - 18.13 0.74 F #
Uranium mg/L 10/31/2016 N001 3.13 - 18.13 0.02 F # 0.000012
Vanadium mg/L 10/31/2016 N001 3.13 - 18.13 0.0009 J F # 0.00058

Page 44
Groundwater Quality Data by Location (USEE100) FOR SITE RFN01, Rifle New Processing Site REPORT DATE: 12/19/2016 Location: 0170 WELL Ground elevation was calculated as surveyed TOC elevation minus stick up height reported in the Borehole Summary
Parameter Units Sample Date ID
Depth Range (Ft BLS) Result Qualifiers
Lab Data QA Detection
Limit Uncertainty
Alkalinity, Total (as CaCO3) mg/L 11/02/2016 N001 92.23 - 112.23 512 F #
Ammonia Total as N mg/L 11/02/2016 N001 92.23 - 112.23 0.64 F # 0.1
Arsenic mg/L 11/02/2016 N001 92.23 - 112.23 0.00033 J F # 0.00012
Calcium mg/L 11/02/2016 N001 92.23 - 112.23 180 F # 0.12
Chloride mg/L 11/02/2016 N001 92.23 - 112.23 190 F # 8
Magnesium mg/L 11/02/2016 N001 92.23 - 112.23 110 F # 0.15
Molybdenum mg/L 11/02/2016 N001 92.23 - 112.23 0.0026 F # 0.00032
Nitrate + Nitrite as Nitrogen mg/L 11/02/2016 N001 92.23 - 112.23 11 F # 0.5
Oxidation Reduction Potential mV 11/02/2016 N001 92.23 - 112.23 89.1 F #
pH s.u. 11/02/2016 N001 92.23 - 112.23 7 F #
Potassium mg/L 11/02/2016 N001 92.23 - 112.23 6.7 F # 0.26
Selenium mg/L 11/02/2016 N001 92.23 - 112.23 0.023 F # 0.00066
Sodium mg/L 11/02/2016 N001 92.23 - 112.23 480 F # 0.23
Specific Conductance umhos/cm 11/02/2016 N001 92.23 - 112.23 2943 JF #
Sulfate mg/L 11/02/2016 N001 92.23 - 112.23 1100 F # 20
Temperature C 11/02/2016 N001 92.23 - 112.23 15.89 F #
Turbidity NTU 11/02/2016 N001 92.23 - 112.23 5.34 F #
Uranium mg/L 11/02/2016 N001 92.23 - 112.23 0.062 F # 0.000012
Vanadium mg/L 11/02/2016 N001 92.23 - 112.23 0.00082 J F # 0.00058
Page 45
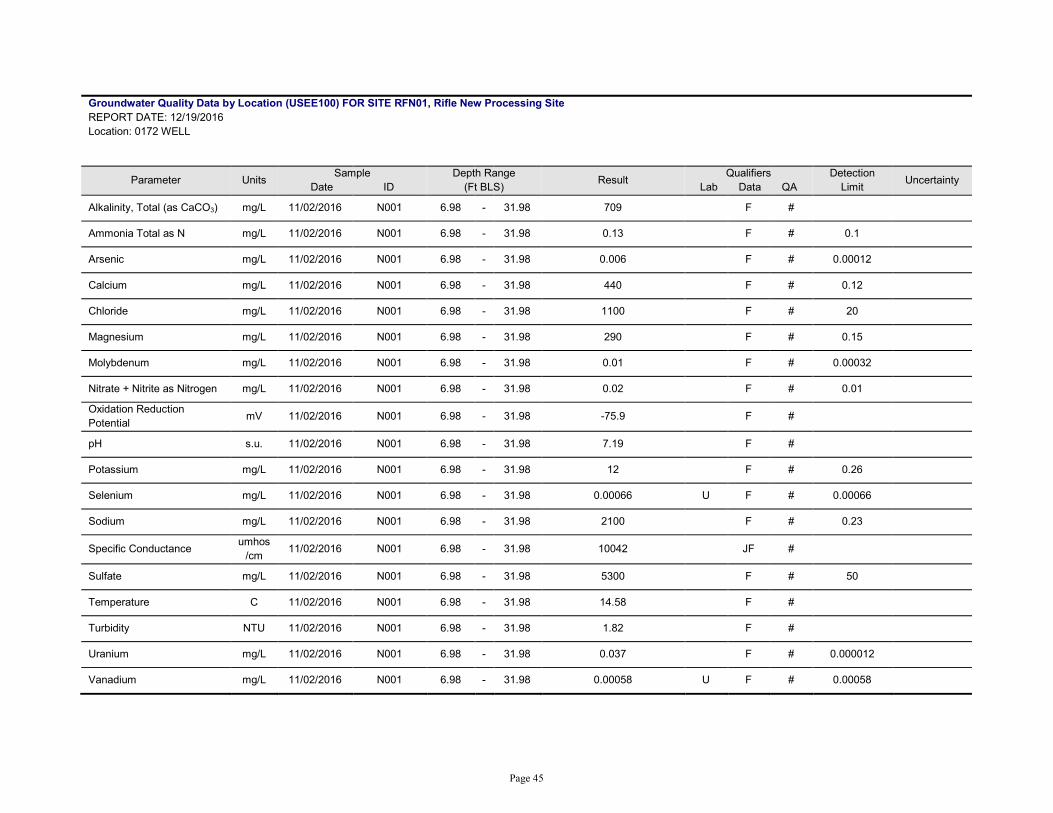
Groundwater Quality Data by Location (USEE100) FOR SITE RFN01, Rifle New Processing Site REPORT DATE: 12/19/2016 Location: 0172 WELL
Parameter Units Sample Date ID
Depth Range (Ft BLS) Result Qualifiers
Lab Data QA Detection
Limit Uncertainty
Alkalinity, Total (as CaCO3) mg/L 11/02/2016 N001 6.98 - 31.98 709 F #
Ammonia Total as N mg/L 11/02/2016 N001 6.98 - 31.98 0.13 F # 0.1
Arsenic mg/L 11/02/2016 N001 6.98 - 31.98 0.006 F # 0.00012
Calcium mg/L 11/02/2016 N001 6.98 - 31.98 440 F # 0.12
Chloride mg/L 11/02/2016 N001 6.98 - 31.98 1100 F # 20
Magnesium mg/L 11/02/2016 N001 6.98 - 31.98 290 F # 0.15
Molybdenum mg/L 11/02/2016 N001 6.98 - 31.98 0.01 F # 0.00032
Nitrate + Nitrite as Nitrogen mg/L 11/02/2016 N001 6.98 - 31.98 0.02 F # 0.01
Oxidation Reduction Potential mV 11/02/2016 N001 6.98 - 31.98 -75.9 F #
pH s.u. 11/02/2016 N001 6.98 - 31.98 7.19 F #
Potassium mg/L 11/02/2016 N001 6.98 - 31.98 12 F # 0.26
Selenium mg/L 11/02/2016 N001 6.98 - 31.98 0.00066 U F # 0.00066
Sodium mg/L 11/02/2016 N001 6.98 - 31.98 2100 F # 0.23
Specific Conductance umhos/cm 11/02/2016 N001 6.98 - 31.98 10042 JF #
Sulfate mg/L 11/02/2016 N001 6.98 - 31.98 5300 F # 50
Temperature C 11/02/2016 N001 6.98 - 31.98 14.58 F #
Turbidity NTU 11/02/2016 N001 6.98 - 31.98 1.82 F #
Uranium mg/L 11/02/2016 N001 6.98 - 31.98 0.037 F # 0.000012
Vanadium mg/L 11/02/2016 N001 6.98 - 31.98 0.00058 U F # 0.00058

Page 46
Groundwater Quality Data by Location (USEE100) FOR SITE RFN01, Rifle New Processing Site REPORT DATE: 12/19/2016 Location: 0195 WELL Ground elevation was calculated as surveyed TOC elevation minus stick up height reported in the Borehole Summary
Parameter Units Sample Date ID
Depth Range (Ft BLS) Result Qualifiers
Lab Data QA Detection
Limit Uncertainty
Alkalinity, Total (as CaCO3) mg/L 11/02/2016 N001 5.29 - 25.29 459 F #
Ammonia Total as N mg/L 11/02/2016 0001 5.29 - 25.29 0.1 U F # 0.1
Arsenic mg/L 11/02/2016 0001 5.29 - 25.29 0.00094 J F # 0.00012
Calcium mg/L 11/02/2016 0001 5.29 - 25.29 85 F # 0.024
Chloride mg/L 11/02/2016 0001 5.29 - 25.29 20 F # 1
Magnesium mg/L 11/02/2016 0001 5.29 - 25.29 48 F # 0.03
Molybdenum mg/L 11/02/2016 0001 5.29 - 25.29 0.013 F # 0.00032
Nitrate + Nitrite as Nitrogen mg/L 11/02/2016 0001 5.29 - 25.29 0.01 U F # 0.01
Oxidation Reduction Potential mV 11/02/2016 N001 5.29 - 25.29 1.9 F #
pH s.u. 11/02/2016 N001 5.29 - 25.29 7.11 F #
Potassium mg/L 11/02/2016 0001 5.29 - 25.29 6.5 F # 0.052
Selenium mg/L 11/02/2016 0001 5.29 - 25.29 0.00066 U F # 0.00066
Sodium mg/L 11/02/2016 0001 5.29 - 25.29 110 F # 0.047
Specific Conductance umhos/cm 11/02/2016 N001 5.29 - 25.29 1022 JF #
Sulfate mg/L 11/02/2016 0001 5.29 - 25.29 160 F # 2.5
Temperature C 11/02/2016 N001 5.29 - 25.29 15.64 F #
Turbidity NTU 11/02/2016 N001 5.29 - 25.29 27.4 F #
Uranium mg/L 11/02/2016 0001 5.29 - 25.29 0.01 F # 0.000012
Vanadium mg/L 11/02/2016 0001 5.29 - 25.29 0.00058 U F # 0.00058

Page 47
Groundwater Quality Data by Location (USEE100) FOR SITE RFN01, Rifle New Processing Site REPORT DATE: 12/19/2016 Location: 0201 WELL Ground elevation was calculated as surveyed TOC elevation minus stick up height reported in the Borehole Summary
Parameter Units Sample Date ID
Depth Range (Ft BLS) Result Qualifiers
Lab Data QA Detection
Limit Uncertainty
Alkalinity, Total (as CaCO3) mg/L 11/02/2016 N001 7.35 - 22.35 300 F #
Ammonia Total as N mg/L 11/02/2016 N001 7.35 - 22.35 62 F # 2.5
Ammonia Total as N mg/L 11/02/2016 N002 7.35 - 22.35 61 F # 2.5
Arsenic mg/L 11/02/2016 N001 7.35 - 22.35 0.00039 J F # 0.00012
Arsenic mg/L 11/02/2016 N002 7.35 - 22.35 0.00051 J F # 0.00012
Calcium mg/L 11/02/2016 N001 7.35 - 22.35 520 F # 0.12
Calcium mg/L 11/02/2016 N002 7.35 - 22.35 510 F # 0.12
Chloride mg/L 11/02/2016 N001 7.35 - 22.35 170 F # 8
Chloride mg/L 11/02/2016 N002 7.35 - 22.35 160 F # 8
Magnesium mg/L 11/02/2016 N001 7.35 - 22.35 46 F # 0.15
Magnesium mg/L 11/02/2016 N002 7.35 - 22.35 45 F # 0.15
Molybdenum mg/L 11/02/2016 N001 7.35 - 22.35 1.5 F # 0.00032
Molybdenum mg/L 11/02/2016 N002 7.35 - 22.35 1.5 F # 0.00032
Nitrate + Nitrite as Nitrogen mg/L 11/02/2016 N001 7.35 - 22.35 12 JF # 0.5
Nitrate + Nitrite as Nitrogen mg/L 11/02/2016 N002 7.35 - 22.35 18 JF # 0.5
Oxidation Reduction Potential mV 11/02/2016 N001 7.35 - 22.35 92.5 F #
pH s.u. 11/02/2016 N001 7.35 - 22.35 6.87 F #
Potassium mg/L 11/02/2016 N001 7.35 - 22.35 11 F # 0.26
Page 48
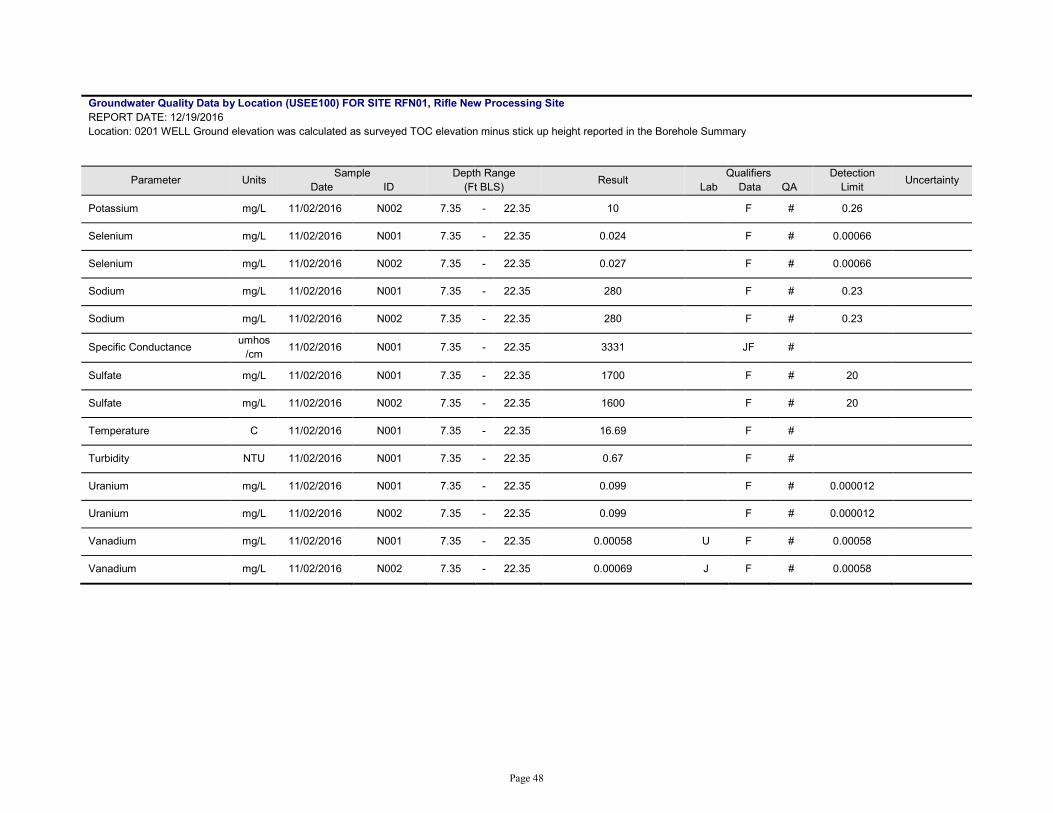
Groundwater Quality Data by Location (USEE100) FOR SITE RFN01, Rifle New Processing Site REPORT DATE: 12/19/2016 Location: 0201 WELL Ground elevation was calculated as surveyed TOC elevation minus stick up height reported in the Borehole Summary
Parameter Units Sample Date ID
Depth Range (Ft BLS) Result Qualifiers
Lab Data QA Detection
Limit Uncertainty
Potassium mg/L 11/02/2016 N002 7.35 - 22.35 10 F # 0.26
Selenium mg/L 11/02/2016 N001 7.35 - 22.35 0.024 F # 0.00066
Selenium mg/L 11/02/2016 N002 7.35 - 22.35 0.027 F # 0.00066
Sodium mg/L 11/02/2016 N001 7.35 - 22.35 280 F # 0.23
Sodium mg/L 11/02/2016 N002 7.35 - 22.35 280 F # 0.23
Specific Conductance umhos/cm 11/02/2016 N001 7.35 - 22.35 3331 JF #
Sulfate mg/L 11/02/2016 N001 7.35 - 22.35 1700 F # 20
Sulfate mg/L 11/02/2016 N002 7.35 - 22.35 1600 F # 20
Temperature C 11/02/2016 N001 7.35 - 22.35 16.69 F #
Turbidity NTU 11/02/2016 N001 7.35 - 22.35 0.67 F #
Uranium mg/L 11/02/2016 N001 7.35 - 22.35 0.099 F # 0.000012
Uranium mg/L 11/02/2016 N002 7.35 - 22.35 0.099 F # 0.000012
Vanadium mg/L 11/02/2016 N001 7.35 - 22.35 0.00058 U F # 0.00058
Vanadium mg/L 11/02/2016 N002 7.35 - 22.35 0.00069 J F # 0.00058

Page 49
Groundwater Quality Data by Location (USEE100) FOR SITE RFN01, Rifle New Processing Site REPORT DATE: 12/19/2016 Location: 0215 WELL Ground elevation was calculated as surveyed TOC elevation minus stick up height reported in the Borehole Summary
Parameter Units Sample Date ID
Depth Range (Ft BLS) Result Qualifiers
Lab Data QA Detection
Limit Uncertainty
Alkalinity, Total (as CaCO3) mg/L 11/02/2016 N001 6.84 - 21.84 240 F #
Ammonia Total as N mg/L 11/02/2016 N001 6.84 - 21.84 1.5 F # 0.1
Arsenic mg/L 11/02/2016 N001 6.84 - 21.84 0.00047 J F # 0.00012
Calcium mg/L 11/02/2016 N001 6.84 - 21.84 95 F # 0.024
Chloride mg/L 11/02/2016 N001 6.84 - 21.84 200 F # 4
Magnesium mg/L 11/02/2016 N001 6.84 - 21.84 37 F # 0.03
Molybdenum mg/L 11/02/2016 N001 6.84 - 21.84 0.021 F # 0.00032
Nitrate + Nitrite as Nitrogen mg/L 11/02/2016 N001 6.84 - 21.84 7.1 F # 0.1
Oxidation Reduction Potential mV 11/02/2016 N001 6.84 - 21.84 30.4 F #
pH s.u. 11/02/2016 N001 6.84 - 21.84 7.42 F #
Potassium mg/L 11/02/2016 N001 6.84 - 21.84 7.3 F # 0.052
Selenium mg/L 11/02/2016 N001 6.84 - 21.84 0.0022 F # 0.00066
Sodium mg/L 11/02/2016 N001 6.84 - 21.84 210 F # 0.047
Specific Conductance umhos/cm 11/02/2016 N001 6.84 - 21.84 1533 JF #
Sulfate mg/L 11/02/2016 N001 6.84 - 21.84 340 F # 10
Temperature C 11/02/2016 N001 6.84 - 21.84 19.19 F #
Turbidity NTU 11/02/2016 N001 6.84 - 21.84 0.87 F #
Uranium mg/L 11/02/2016 N001 6.84 - 21.84 0.013 F # 0.000012
Vanadium mg/L 11/02/2016 N001 6.84 - 21.84 0.0018 J F # 0.00058

Page 50
Groundwater Quality Data by Location (USEE100) FOR SITE RFN01, Rifle New Processing Site REPORT DATE: 12/19/2016 Location: 0216 WELL
Parameter Units Sample Date ID
Depth Range (Ft BLS) Result Qualifiers
Lab Data QA Detection
Limit Uncertainty
Alkalinity, Total (as CaCO3) mg/L 10/31/2016 N001 5.5 - 20.5 244 F #
Ammonia Total as N mg/L 10/31/2016 N001 5.5 - 20.5 7.1 F # 2.5
Ammonia Total as N mg/L 10/31/2016 N002 5.5 - 20.5 6.8 F # 2.5
Arsenic mg/L 10/31/2016 N001 5.5 - 20.5 0.028 F # 0.00012
Arsenic mg/L 10/31/2016 N002 5.5 - 20.5 0.027 F # 0.00012
Calcium mg/L 10/31/2016 N001 5.5 - 20.5 94 F # 0.024
Calcium mg/L 10/31/2016 N002 5.5 - 20.5 93 F # 0.024
Chloride mg/L 10/31/2016 N001 5.5 - 20.5 150 F # 4
Chloride mg/L 10/31/2016 N002 5.5 - 20.5 150 F # 4
Magnesium mg/L 10/31/2016 N001 5.5 - 20.5 19 F # 0.03
Magnesium mg/L 10/31/2016 N002 5.5 - 20.5 19 F # 0.03
Molybdenum mg/L 10/31/2016 N001 5.5 - 20.5 0.053 F # 0.00032
Molybdenum mg/L 10/31/2016 N002 5.5 - 20.5 0.054 F # 0.00032
Nitrate + Nitrite as Nitrogen mg/L 10/31/2016 N001 5.5 - 20.5 0.01 U F # 0.01
Nitrate + Nitrite as Nitrogen mg/L 10/31/2016 N002 5.5 - 20.5 0.01 U F # 0.01
Oxidation Reduction Potential mV 10/31/2016 N001 5.5 - 20.5 -26.3 F #
pH s.u. 10/31/2016 N001 5.5 - 20.5 7.46 F #
Potassium mg/L 10/31/2016 N001 5.5 - 20.5 8.3 F # 0.052
Page 51
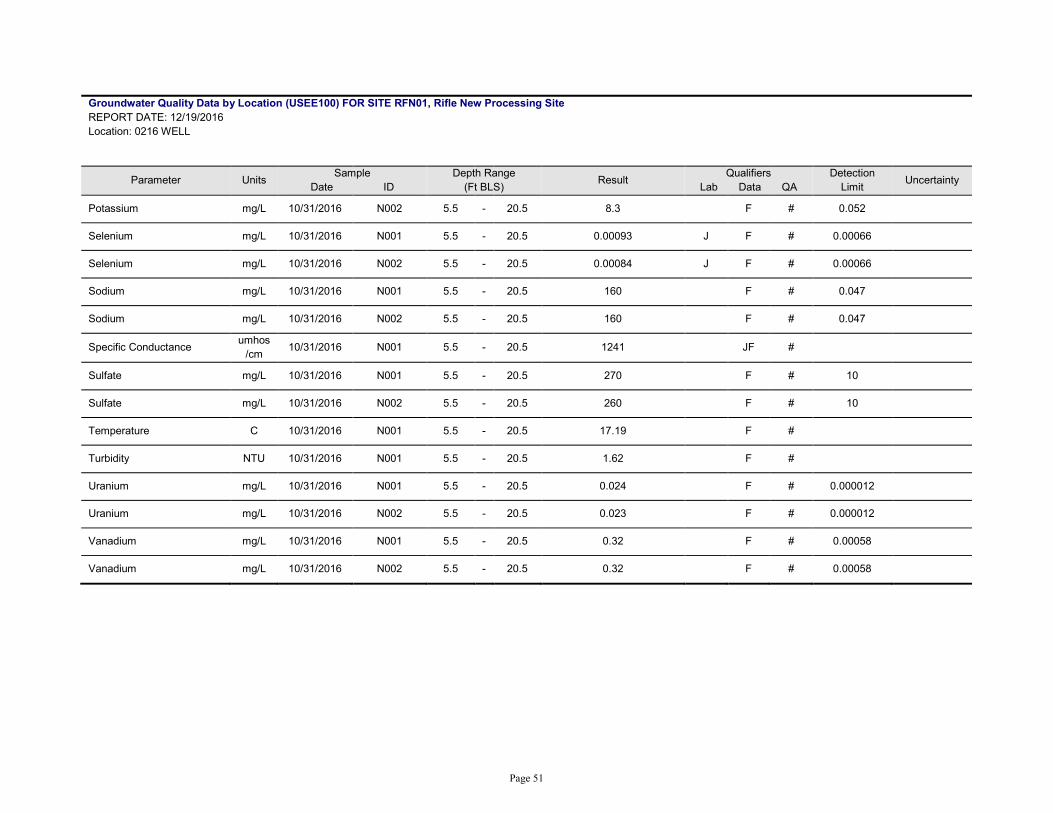
Groundwater Quality Data by Location (USEE100) FOR SITE RFN01, Rifle New Processing Site REPORT DATE: 12/19/2016 Location: 0216 WELL
Parameter Units Sample Date ID
Depth Range (Ft BLS) Result Qualifiers
Lab Data QA Detection
Limit Uncertainty
Potassium mg/L 10/31/2016 N002 5.5 - 20.5 8.3 F # 0.052
Selenium mg/L 10/31/2016 N001 5.5 - 20.5 0.00093 J F # 0.00066
Selenium mg/L 10/31/2016 N002 5.5 - 20.5 0.00084 J F # 0.00066
Sodium mg/L 10/31/2016 N001 5.5 - 20.5 160 F # 0.047
Sodium mg/L 10/31/2016 N002 5.5 - 20.5 160 F # 0.047
Specific Conductance umhos/cm 10/31/2016 N001 5.5 - 20.5 1241 JF #
Sulfate mg/L 10/31/2016 N001 5.5 - 20.5 270 F # 10
Sulfate mg/L 10/31/2016 N002 5.5 - 20.5 260 F # 10
Temperature C 10/31/2016 N001 5.5 - 20.5 17.19 F #
Turbidity NTU 10/31/2016 N001 5.5 - 20.5 1.62 F #
Uranium mg/L 10/31/2016 N001 5.5 - 20.5 0.024 F # 0.000012
Uranium mg/L 10/31/2016 N002 5.5 - 20.5 0.023 F # 0.000012
Vanadium mg/L 10/31/2016 N001 5.5 - 20.5 0.32 F # 0.00058
Vanadium mg/L 10/31/2016 N002 5.5 - 20.5 0.32 F # 0.00058

Page 52
Groundwater Quality Data by Location (USEE100) FOR SITE RFN01, Rifle New Processing Site REPORT DATE: 12/19/2016 Location: 0217 WELL Ground elevation was calculated as surveyed TOC elevation minus stick up height reported in the Borehole Summary
Parameter Units Sample Date ID
Depth Range (Ft BLS) Result Qualifiers
Lab Data QA Detection
Limit Uncertainty
Alkalinity, Total (as CaCO3) mg/L 11/02/2016 N001 7.4 - 22.4 237 F #
Ammonia Total as N mg/L 11/02/2016 N001 7.4 - 22.4 37 F # 2.5
Arsenic mg/L 11/02/2016 N001 7.4 - 22.4 0.00053 J F # 0.00012
Calcium mg/L 11/02/2016 N001 7.4 - 22.4 600 F # 0.12
Chloride mg/L 11/02/2016 N001 7.4 - 22.4 210 F # 8
Magnesium mg/L 11/02/2016 N001 7.4 - 22.4 22 F # 0.15
Molybdenum mg/L 11/02/2016 N001 7.4 - 22.4 1.4 F # 0.00032
Nitrate + Nitrite as Nitrogen mg/L 11/02/2016 N001 7.4 - 22.4 0.01 U F # 0.01
Oxidation Reduction Potential mV 11/02/2016 N001 7.4 - 22.4 100.5 F #
pH s.u. 11/02/2016 N001 7.4 - 22.4 6.9 F #
Potassium mg/L 11/02/2016 N001 7.4 - 22.4 15 F # 0.26
Selenium mg/L 11/02/2016 N001 7.4 - 22.4 0.0042 F # 0.00066
Sodium mg/L 11/02/2016 N001 7.4 - 22.4 210 F # 0.23
Specific Conductance umhos/cm 11/02/2016 N001 7.4 - 22.4 3099 JF #
Sulfate mg/L 11/02/2016 N001 7.4 - 22.4 1700 F # 20
Temperature C 11/02/2016 N001 7.4 - 22.4 13.3 F #
Turbidity NTU 11/02/2016 N001 7.4 - 22.4 0.83 F #
Uranium mg/L 11/02/2016 N001 7.4 - 22.4 0.13 F # 0.000012
Vanadium mg/L 11/02/2016 N001 7.4 - 22.4 1.9 F # 0.00058

Page 53
Groundwater Quality Data by Location (USEE100) FOR SITE RFN01, Rifle New Processing Site REPORT DATE: 12/19/2016 Location: 0590 WELL
Parameter Units Sample Date ID
Depth Range (Ft BLS) Result Qualifiers
Lab Data QA Detection
Limit Uncertainty
Alkalinity, Total (as CaCO3) mg/L 11/01/2016 N001 5.21 - 19.21 277 F #
Ammonia Total as N mg/L 11/01/2016 N001 5.21 - 19.21 140 F # 2.5
Arsenic mg/L 11/01/2016 N001 5.21 - 19.21 0.00091 J F # 0.00012
Calcium mg/L 11/01/2016 N001 5.21 - 19.21 550 F # 0.12
Chloride mg/L 11/01/2016 N001 5.21 - 19.21 300 F # 8
Magnesium mg/L 11/01/2016 N001 5.21 - 19.21 53 F # 0.15
Molybdenum mg/L 11/01/2016 N001 5.21 - 19.21 1.1 F # 0.00032
Nitrate + Nitrite as Nitrogen mg/L 11/01/2016 N001 5.21 - 19.21 2.5 F # 0.1
Oxidation Reduction Potential mV 11/01/2016 N001 5.21 - 19.21 197.6 F #
pH s.u. 11/01/2016 N001 5.21 - 19.21 6.77 F #
Potassium mg/L 11/01/2016 N001 5.21 - 19.21 25 F # 0.26
Selenium mg/L 11/01/2016 N001 5.21 - 19.21 0.016 F # 0.00066
Sodium mg/L 11/01/2016 N001 5.21 - 19.21 410 F # 0.23
Specific Conductance umhos/cm 11/01/2016 N001 5.21 - 19.21 4360 JF #
Sulfate mg/L 11/01/2016 N001 5.21 - 19.21 2400 F # 20
Temperature C 11/01/2016 N001 5.21 - 19.21 15.22 F #
Turbidity NTU 11/01/2016 N001 5.21 - 19.21 2 F #
Uranium mg/L 11/01/2016 N001 5.21 - 19.21 0.079 F # 0.000012
Vanadium mg/L 11/01/2016 N001 5.21 - 19.21 0.39 F # 0.00058
Page 54
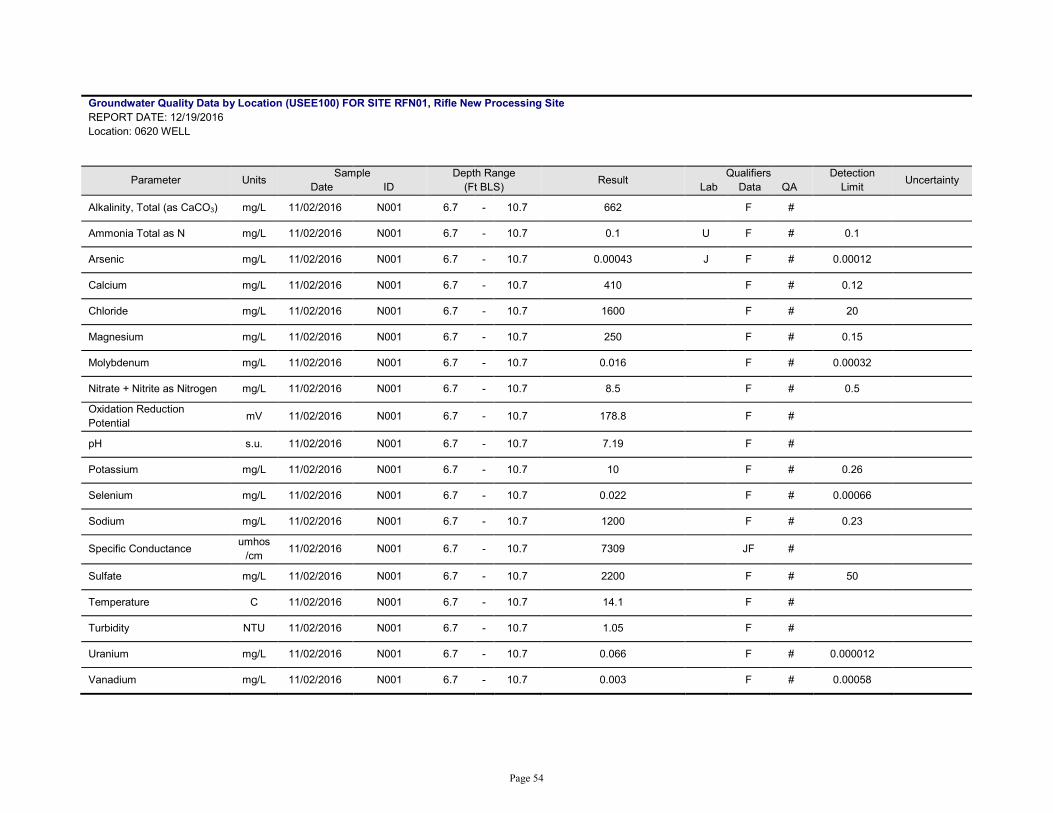
Groundwater Quality Data by Location (USEE100) FOR SITE RFN01, Rifle New Processing Site REPORT DATE: 12/19/2016 Location: 0620 WELL
Parameter Units Sample Date ID
Depth Range (Ft BLS) Result Qualifiers
Lab Data QA Detection
Limit Uncertainty
Alkalinity, Total (as CaCO3) mg/L 11/02/2016 N001 6.7 - 10.7 662 F #
Ammonia Total as N mg/L 11/02/2016 N001 6.7 - 10.7 0.1 U F # 0.1
Arsenic mg/L 11/02/2016 N001 6.7 - 10.7 0.00043 J F # 0.00012
Calcium mg/L 11/02/2016 N001 6.7 - 10.7 410 F # 0.12
Chloride mg/L 11/02/2016 N001 6.7 - 10.7 1600 F # 20
Magnesium mg/L 11/02/2016 N001 6.7 - 10.7 250 F # 0.15
Molybdenum mg/L 11/02/2016 N001 6.7 - 10.7 0.016 F # 0.00032
Nitrate + Nitrite as Nitrogen mg/L 11/02/2016 N001 6.7 - 10.7 8.5 F # 0.5
Oxidation Reduction Potential mV 11/02/2016 N001 6.7 - 10.7 178.8 F #
pH s.u. 11/02/2016 N001 6.7 - 10.7 7.19 F #
Potassium mg/L 11/02/2016 N001 6.7 - 10.7 10 F # 0.26
Selenium mg/L 11/02/2016 N001 6.7 - 10.7 0.022 F # 0.00066
Sodium mg/L 11/02/2016 N001 6.7 - 10.7 1200 F # 0.23
Specific Conductance umhos/cm 11/02/2016 N001 6.7 - 10.7 7309 JF #
Sulfate mg/L 11/02/2016 N001 6.7 - 10.7 2200 F # 50
Temperature C 11/02/2016 N001 6.7 - 10.7 14.1 F #
Turbidity NTU 11/02/2016 N001 6.7 - 10.7 1.05 F #
Uranium mg/L 11/02/2016 N001 6.7 - 10.7 0.066 F # 0.000012
Vanadium mg/L 11/02/2016 N001 6.7 - 10.7 0.003 F # 0.00058

Page 55
Groundwater Quality Data by Location (USEE100) FOR SITE RFN01, Rifle New Processing Site REPORT DATE: 12/19/2016 Location: 0635 WELL
Parameter Units Sample Date ID
Depth Range (Ft BLS) Result Qualifiers
Lab Data QA Detection
Limit Uncertainty
Alkalinity, Total (as CaCO3) mg/L 11/01/2016 N001 12 - 17 254 F #
Ammonia Total as N mg/L 11/01/2016 N001 12 - 17 54 F # 2.5
Arsenic mg/L 11/01/2016 N001 12 - 17 0.00018 J F # 0.00012
Calcium mg/L 11/01/2016 N001 12 - 17 310 F # 0.024
Chloride mg/L 11/01/2016 N001 12 - 17 160 F # 4
Magnesium mg/L 11/01/2016 N001 12 - 17 23 F # 0.03
Molybdenum mg/L 11/01/2016 N001 12 - 17 0.38 F # 0.00032
Nitrate + Nitrite as Nitrogen mg/L 11/01/2016 N001 12 - 17 3.3 F # 0.1
Oxidation Reduction Potential mV 11/01/2016 N001 12 - 17 112.7 F #
pH s.u. 11/01/2016 N001 12 - 17 7.01 F #
Potassium mg/L 11/01/2016 N001 12 - 17 28 F # 0.052
Selenium mg/L 11/01/2016 N001 12 - 17 0.0056 F # 0.00066
Sodium mg/L 11/01/2016 N001 12 - 17 160 F # 0.047
Specific Conductance umhos/cm 11/01/2016 N001 12 - 17 2327 JF #
Sulfate mg/L 11/01/2016 N001 12 - 17 1000 F # 10
Temperature C 11/01/2016 N001 12 - 17 13.92 F #
Turbidity NTU 11/01/2016 N001 12 - 17 0.8 F #
Uranium mg/L 11/01/2016 N001 12 - 17 0.051 F # 0.000012
Vanadium mg/L 11/01/2016 N001 12 - 17 0.00058 U F # 0.00058

Page 56
Groundwater Quality Data by Location (USEE100) FOR SITE RFN01, Rifle New Processing Site REPORT DATE: 12/19/2016 Location: 0658 WELL
Parameter Units Sample Date ID
Depth Range (Ft BLS) Result Qualifiers
Lab Data QA Detection
Limit Uncertainty
Alkalinity, Total (as CaCO3) mg/L 11/01/2016 N001 .5 - 5.5 256 F #
Ammonia Total as N mg/L 11/01/2016 N001 .5 - 5.5 47 F # 2.5
Arsenic mg/L 11/01/2016 N001 .5 - 5.5 0.12 F # 0.00012
Calcium mg/L 11/01/2016 N001 .5 - 5.5 520 F # 0.12
Chloride mg/L 11/01/2016 N001 .5 - 5.5 200 F # 8
Magnesium mg/L 11/01/2016 N001 .5 - 5.5 35 F # 0.15
Molybdenum mg/L 11/01/2016 N001 .5 - 5.5 2.6 F # 0.00032
Nitrate + Nitrite as Nitrogen mg/L 11/01/2016 N001 .5 - 5.5 1.5 F # 0.1
Oxidation Reduction Potential mV 11/01/2016 N001 .5 - 5.5 191.7 F #
pH s.u. 11/01/2016 N001 .5 - 5.5 6.81 F #
Potassium mg/L 11/01/2016 N001 .5 - 5.5 8.6 F # 0.26
Selenium mg/L 11/01/2016 N001 .5 - 5.5 0.99 F # 0.00066
Sodium mg/L 11/01/2016 N001 .5 - 5.5 200 F # 0.23
Specific Conductance umhos/cm 11/01/2016 N001 .5 - 5.5 2970 JF #
Sulfate mg/L 11/01/2016 N001 .5 - 5.5 1500 F # 20
Temperature C 11/01/2016 N001 .5 - 5.5 14.42 F #
Turbidity NTU 11/01/2016 N001 .5 - 5.5 7.1 F #
Uranium mg/L 11/01/2016 N001 .5 - 5.5 0.052 F # 0.000012
Vanadium mg/L 11/01/2016 N001 .5 - 5.5 31 F # 0.0058
Page 57
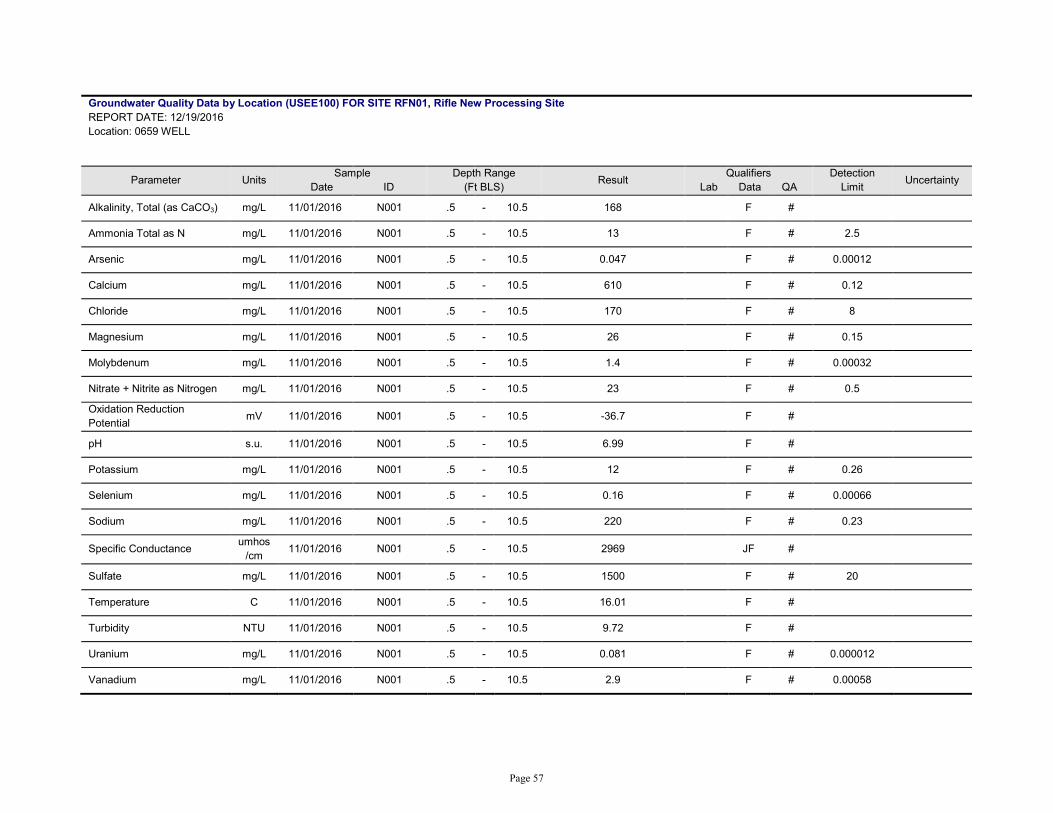
Groundwater Quality Data by Location (USEE100) FOR SITE RFN01, Rifle New Processing Site REPORT DATE: 12/19/2016 Location: 0659 WELL
Parameter Units Sample Date ID
Depth Range (Ft BLS) Result Qualifiers
Lab Data QA Detection
Limit Uncertainty
Alkalinity, Total (as CaCO3) mg/L 11/01/2016 N001 .5 - 10.5 168 F #
Ammonia Total as N mg/L 11/01/2016 N001 .5 - 10.5 13 F # 2.5
Arsenic mg/L 11/01/2016 N001 .5 - 10.5 0.047 F # 0.00012
Calcium mg/L 11/01/2016 N001 .5 - 10.5 610 F # 0.12
Chloride mg/L 11/01/2016 N001 .5 - 10.5 170 F # 8
Magnesium mg/L 11/01/2016 N001 .5 - 10.5 26 F # 0.15
Molybdenum mg/L 11/01/2016 N001 .5 - 10.5 1.4 F # 0.00032
Nitrate + Nitrite as Nitrogen mg/L 11/01/2016 N001 .5 - 10.5 23 F # 0.5
Oxidation Reduction Potential mV 11/01/2016 N001 .5 - 10.5 -36.7 F #
pH s.u. 11/01/2016 N001 .5 - 10.5 6.99 F #
Potassium mg/L 11/01/2016 N001 .5 - 10.5 12 F # 0.26
Selenium mg/L 11/01/2016 N001 .5 - 10.5 0.16 F # 0.00066
Sodium mg/L 11/01/2016 N001 .5 - 10.5 220 F # 0.23
Specific Conductance umhos/cm 11/01/2016 N001 .5 - 10.5 2969 JF #
Sulfate mg/L 11/01/2016 N001 .5 - 10.5 1500 F # 20
Temperature C 11/01/2016 N001 .5 - 10.5 16.01 F #
Turbidity NTU 11/01/2016 N001 .5 - 10.5 9.72 F #
Uranium mg/L 11/01/2016 N001 .5 - 10.5 0.081 F # 0.000012
Vanadium mg/L 11/01/2016 N001 .5 - 10.5 2.9 F # 0.00058

Page 58
Groundwater Quality Data by Location (USEE100) FOR SITE RFN01, Rifle New Processing Site REPORT DATE: 12/19/2016 Location: 0664 WELL
Parameter Units Sample Date ID
Depth Range (Ft BLS) Result Qualifiers
Lab Data QA Detection
Limit Uncertainty
Alkalinity, Total (as CaCO3) mg/L 10/31/2016 N001 7.7 - 14.7 326 F #
Ammonia Total as N mg/L 10/31/2016 N001 7.7 - 14.7 25 F # 2.5
Arsenic mg/L 10/31/2016 N001 7.7 - 14.7 0.0041 F # 0.00012
Calcium mg/L 10/31/2016 N001 7.7 - 14.7 140 F # 0.024
Chloride mg/L 10/31/2016 N001 7.7 - 14.7 140 F # 2
Magnesium mg/L 10/31/2016 N001 7.7 - 14.7 71 F # 0.03
Molybdenum mg/L 10/31/2016 N001 7.7 - 14.7 0.24 F # 0.00032
Nitrate + Nitrite as Nitrogen mg/L 10/31/2016 N001 7.7 - 14.7 4.2 F # 0.1
Oxidation Reduction Potential mV 10/31/2016 N001 7.7 - 14.7 95.9 F #
pH s.u. 10/31/2016 N001 7.7 - 14.7 7.06 F #
Potassium mg/L 10/31/2016 N001 7.7 - 14.7 9.6 F # 0.052
Selenium mg/L 10/31/2016 N001 7.7 - 14.7 0.19 F # 0.00066
Sodium mg/L 10/31/2016 N001 7.7 - 14.7 200 F # 0.047
Specific Conductance umhos/cm 10/31/2016 N001 7.7 - 14.7 1908 JF #
Sulfate mg/L 10/31/2016 N001 7.7 - 14.7 570 F # 5
Temperature C 10/31/2016 N001 7.7 - 14.7 16.88 F #
Turbidity NTU 10/31/2016 N001 7.7 - 14.7 9.42 F #
Uranium mg/L 10/31/2016 N001 7.7 - 14.7 0.047 F # 0.000012
Vanadium mg/L 10/31/2016 N001 7.7 - 14.7 2.3 F # 0.00058

Page 59
Groundwater Quality Data by Location (USEE100) FOR SITE RFN01, Rifle New Processing Site REPORT DATE: 12/19/2016 Location: 0669 WELL
Parameter Units Sample Date ID
Depth Range (Ft BLS) Result Qualifiers
Lab Data QA Detection
Limit Uncertainty
Alkalinity, Total (as CaCO3) mg/L 11/01/2016 N001 4 - 10.6 563 QF #
Ammonia Total as N mg/L 11/01/2016 N001 4 - 10.6 49 QF # 2.5
Arsenic mg/L 11/01/2016 N001 4 - 10.6 0.0096 QF # 0.00012
Calcium mg/L 11/01/2016 N001 4 - 10.6 210 QF # 0.024
Chloride mg/L 11/01/2016 N001 4 - 10.6 160 QF # 2
Magnesium mg/L 11/01/2016 N001 4 - 10.6 39 QF # 0.03
Molybdenum mg/L 11/01/2016 N001 4 - 10.6 0.52 QF # 0.00032
Nitrate + Nitrite as Nitrogen mg/L 11/01/2016 N001 4 - 10.6 1.7 QF # 0.1
Oxidation Reduction Potential mV 11/01/2016 N001 4 - 10.6 148.4 QF #
pH s.u. 11/01/2016 N001 4 - 10.6 7.02 QF #
Potassium mg/L 11/01/2016 N001 4 - 10.6 6.7 QF # 0.052
Selenium mg/L 11/01/2016 N001 4 - 10.6 0.048 QF # 0.00066
Sodium mg/L 11/01/2016 N001 4 - 10.6 190 QF # 0.047
Specific Conductance umhos/cm 11/01/2016 N001 4 - 10.6 2102 JQF #
Sulfate mg/L 11/01/2016 N001 4 - 10.6 690 QF # 5
Temperature C 11/01/2016 N001 4 - 10.6 16 QF #
Turbidity NTU 11/01/2016 N001 4 - 10.6 3.71 QF #
Uranium mg/L 11/01/2016 N001 4 - 10.6 0.061 QF # 0.000012
Vanadium mg/L 11/01/2016 N001 4 - 10.6 3.9 QF # 0.00058

Page 60
Groundwater Quality Data by Location (USEE100) FOR SITE RFN01, Rifle New Processing Site REPORT DATE: 12/19/2016 Location: 0670 WELL For Organics Study.
Parameter Units Sample Date ID
Depth Range (Ft BLS) Result Qualifiers
Lab Data QA Detection
Limit Uncertainty
Alkalinity, Total (as CaCO3) mg/L 10/31/2016 N001 5.2 - 12.2 321 QF #
Ammonia Total as N mg/L 10/31/2016 N001 5.2 - 12.2 14 QF # 2.5
Arsenic mg/L 10/31/2016 N001 5.2 - 12.2 0.0041 QF # 0.00012
Calcium mg/L 10/31/2016 N001 5.2 - 12.2 140 QF # 0.024
Chloride mg/L 10/31/2016 N001 5.2 - 12.2 150 QF # 2
Magnesium mg/L 10/31/2016 N001 5.2 - 12.2 79 QF # 0.03
Molybdenum mg/L 10/31/2016 N001 5.2 - 12.2 0.2 QF # 0.00032
Nitrate + Nitrite as Nitrogen mg/L 10/31/2016 N001 5.2 - 12.2 5.9 QF # 0.1
Oxidation Reduction Potential mV 10/31/2016 N001 5.2 - 12.2 69.3 QF #
pH s.u. 10/31/2016 N001 5.2 - 12.2 7.04 QF #
Potassium mg/L 10/31/2016 N001 5.2 - 12.2 9.3 QF # 0.052
Selenium mg/L 10/31/2016 N001 5.2 - 12.2 0.41 QF # 0.00066
Sodium mg/L 10/31/2016 N001 5.2 - 12.2 200 QF # 0.047
Specific Conductance umhos/cm 10/31/2016 N001 5.2 - 12.2 1896 JQF #
Sulfate mg/L 10/31/2016 N001 5.2 - 12.2 580 QF # 5
Temperature C 10/31/2016 N001 5.2 - 12.2 17.08 QF #
Turbidity NTU 10/31/2016 N001 5.2 - 12.2 2.58 QF #
Uranium mg/L 10/31/2016 N001 5.2 - 12.2 0.053 QF # 0.000012
Vanadium mg/L 10/31/2016 N001 5.2 - 12.2 1.8 QF # 0.00058

Page 61
Groundwater Quality Data by Location (USEE100) FOR SITE RFN01, Rifle New Processing Site REPORT DATE: 12/19/2016 Location: 0855 WELL
Parameter Units Sample Date ID
Depth Range (Ft BLS) Result Qualifiers
Lab Data QA Detection
Limit Uncertainty
Alkalinity, Total (as CaCO3) mg/L 11/01/2016 N001 6 - 11 240 F #
Ammonia Total as N mg/L 11/01/2016 N001 6 - 11 23 F # 2.5
Arsenic mg/L 11/01/2016 N001 6 - 11 0.14 F # 0.00012
Calcium mg/L 11/01/2016 N001 6 - 11 190 F # 0.024
Chloride mg/L 11/01/2016 N001 6 - 11 190 F # 2
Magnesium mg/L 11/01/2016 N001 6 - 11 40 F # 0.03
Molybdenum mg/L 11/01/2016 N001 6 - 11 0.33 F # 0.00032
Nitrate + Nitrite as Nitrogen mg/L 11/01/2016 N001 6 - 11 8.5 F # 0.1
Oxidation Reduction Potential mV 11/01/2016 N001 6 - 11 173.1 F #
pH s.u. 11/01/2016 N001 6 - 11 7.04 F #
Potassium mg/L 11/01/2016 N001 6 - 11 11 F # 0.052
Selenium mg/L 11/01/2016 N001 6 - 11 0.67 F # 0.00066
Sodium mg/L 11/01/2016 N001 6 - 11 220 F # 0.047
Specific Conductance umhos/cm 11/01/2016 N001 6 - 11 2027 JF #
Sulfate mg/L 11/01/2016 N001 6 - 11 630 F # 5
Temperature C 11/01/2016 N001 6 - 11 15.87 F #
Turbidity NTU 11/01/2016 N001 6 - 11 1.8 F #
Uranium mg/L 11/01/2016 N001 6 - 11 0.029 F # 0.000012
Vanadium mg/L 11/01/2016 N001 6 - 11 9 F # 0.00058

Page 62
SAMPLE ID CODES: 000X = Filtered sample (0.45 µm). N00X = Unfiltered sample. X = replicate number. LAB QUALIFIERS: * Replicate analysis not within control limits. > Result above upper detection limit. A TIC is a suspected aldol-condensation product. B Inorganic: Result is between the IDL and CRDL. Organic: Analyte also found in method blank. C Pesticide result confirmed by GC-MS. D Analyte determined in diluted sample. E Inorganic: Estimate value because of interference, see case narrative. Organic: Analyte exceeded calibration range of the GC-MS. H Holding time expired, value suspect. I Increased detection limit due to required dilution. J Estimated N Inorganic or radiochemical: Spike sample recovery not within control limits. Organic: Tentatively identified compound (TIC). P > 25% difference in detected pesticide or Aroclor concentrations between 2 columns. U Analytical result below detection limit. W Post-digestion spike outside control limits while sample absorbance < 50% of analytical spike absorbance. X,Y,Z Laboratory defined qualifier, see case narrative. DATA QUALIFIERS: F Low flow sampling method used. G Possible grout contamination, pH > 9. J Estimated value. L Less than 3 bore volumes purged prior to sampling. Q Qualitative result due to sampling technique. R Unusable result. U Parameter analyzed for but was not detected. X Location is undefined. QA QUALIFIER: # Validated according to quality assurance guidelines.

Page 63
Surface Water Quality Data
New Rifle

Page 64
This page intentionally left blank

Page 65
Surface Water Quality Data by Location (USEE102) FOR SITE RFN01, Rifle New Processing Site REPORT DATE: 12/19/2016 Location: 0320 SURFACE LOCATION
Parameter Units Sample Date ID Result Qualifiers
Lab Data QA Detection
Limit Uncertainty
Alkalinity, Total (as CaCO3) mg/L 11/01/2016 N001 86 #
Ammonia Total as N mg/L 11/01/2016 N001 17 # 2.5
Arsenic mg/L 11/01/2016 N001 0.0027 # 0.00012
Calcium mg/L 11/01/2016 N001 640 # 0.12
Chloride mg/L 11/01/2016 N001 510 # 10
Magnesium mg/L 11/01/2016 N001 100 # 0.15
Molybdenum mg/L 11/01/2016 N001 0.69 # 0.00032
Nitrate + Nitrite as Nitrogen mg/L 11/01/2016 N001 0.13 # 0.01
Oxidation Reduction Potential mV 11/01/2016 N001 180.8 #
pH s.u. 11/01/2016 N001 7.77 #
Potassium mg/L 11/01/2016 N001 45 # 0.26
Selenium mg/L 11/01/2016 N001 0.002 # 0.00066
Sodium mg/L 11/01/2016 N001 630 # 0.23
Specific Conductance umhos/cm 11/01/2016 N001 4860 J #
Sulfate mg/L 11/01/2016 N001 2700 # 25
Temperature C 11/01/2016 N001 15.96 #
Turbidity NTU 11/01/2016 N001 8.42 #
Uranium mg/L 11/01/2016 N001 0.12 # 0.000012
Vanadium mg/L 11/01/2016 N001 0.033 # 0.00058

Page 66
Surface Water Quality Data by Location (USEE102) FOR SITE RFN01, Rifle New Processing Site REPORT DATE: 12/19/2016 Location: 0322 SURFACE LOCATION
Parameter Units Sample Date ID Result Qualifiers
Lab Data QA Detection
Limit Uncertainty
Alkalinity, Total (as CaCO3) mg/L 11/01/2016 N001 124 #
Ammonia Total as N mg/L 11/01/2016 N001 0.14 # 0.1
Arsenic mg/L 11/01/2016 N001 0.00035 J # 0.00012
Calcium mg/L 11/01/2016 N001 68 # 0.024
Chloride mg/L 11/01/2016 N001 200 # 4
Magnesium mg/L 11/01/2016 N001 14 # 0.03
Molybdenum mg/L 11/01/2016 N001 0.011 # 0.00032
Nitrate + Nitrite as Nitrogen mg/L 11/01/2016 N001 0.01 U # 0.01
Oxidation Reduction Potential mV 11/01/2016 N001 146 #
pH s.u. 11/01/2016 N001 8.36 #
Potassium mg/L 11/01/2016 N001 4.1 # 0.052
Selenium mg/L 11/01/2016 N001 0.00066 U # 0.00066
Sodium mg/L 11/01/2016 N001 130 # 0.047
Specific Conductance umhos/cm 11/01/2016 N001 956 J #
Sulfate mg/L 11/01/2016 N001 120 # 10
Temperature C 11/01/2016 N001 11.14 #
Turbidity NTU 11/01/2016 N001 5.57 #
Uranium mg/L 11/01/2016 N001 0.0022 # 0.000012
Vanadium mg/L 11/01/2016 N001 0.00091 J # 0.00058

Page 67
Surface Water Quality Data by Location (USEE102) FOR SITE RFN01, Rifle New Processing Site REPORT DATE: 12/19/2016 Location: 0323 SURFACE LOCATION
Parameter Units Sample Date ID Result Qualifiers
Lab Data QA Detection
Limit Uncertainty
Alkalinity, Total (as CaCO3) mg/L 11/01/2016 N001 112 #
Ammonia Total as N mg/L 11/01/2016 N001 14 # 2.5
Arsenic mg/L 11/01/2016 N001 0.00069 J # 0.00012
Calcium mg/L 11/01/2016 N001 640 # 0.12
Chloride mg/L 11/01/2016 N001 470 # 10
Magnesium mg/L 11/01/2016 N001 140 # 0.15
Molybdenum mg/L 11/01/2016 N001 2 # 0.00032
Nitrate + Nitrite as Nitrogen mg/L 11/01/2016 N001 5 # 0.1
Oxidation Reduction Potential mV 11/01/2016 N001 222.3 #
pH s.u. 11/01/2016 N001 7.54 #
Potassium mg/L 11/01/2016 N001 60 # 0.26
Selenium mg/L 11/01/2016 N001 0.0085 # 0.00066
Sodium mg/L 11/01/2016 N001 900 # 0.23
Specific Conductance umhos/cm 11/01/2016 N001 5404 J #
Sulfate mg/L 11/01/2016 N001 3400 # 25
Temperature C 11/01/2016 N001 14.89 #
Turbidity NTU 11/01/2016 N001 2.53 #
Uranium mg/L 11/01/2016 N001 0.22 # 0.000012
Vanadium mg/L 11/01/2016 N001 0.0024 J # 0.00058

Page 68
Surface Water Quality Data by Location (USEE102) FOR SITE RFN01, Rifle New Processing Site REPORT DATE: 12/19/2016 Location: 0324 SURFACE LOCATION
Parameter Units Sample Date ID Result Qualifiers
Lab Data QA Detection
Limit Uncertainty
Alkalinity, Total (as CaCO3) mg/L 11/02/2016 N001 116 #
Ammonia Total as N mg/L 11/02/2016 N001 0.1 U # 0.1
Arsenic mg/L 11/02/2016 N001 0.0004 J # 0.00012
Calcium mg/L 11/02/2016 N001 70 # 0.024
Chloride mg/L 11/02/2016 N001 200 # 4
Magnesium mg/L 11/02/2016 N001 15 # 0.03
Molybdenum mg/L 11/02/2016 N001 0.011 # 0.00032
Nitrate + Nitrite as Nitrogen mg/L 11/02/2016 N001 0.01 U # 0.01
Oxidation Reduction Potential mV 11/02/2016 N001 163.1 #
pH s.u. 11/02/2016 N001 8.42 #
Potassium mg/L 11/02/2016 N001 4.2 # 0.052
Selenium mg/L 11/02/2016 N001 0.00066 U # 0.00066
Sodium mg/L 11/02/2016 N001 130 # 0.047
Specific Conductance umhos/cm 11/02/2016 N001 1138 J #
Sulfate mg/L 11/02/2016 N001 120 # 10
Temperature C 11/02/2016 N001 9.9 #
Turbidity NTU 11/02/2016 N001 2.19 #
Uranium mg/L 11/02/2016 N001 0.0024 # 0.000012
Vanadium mg/L 11/02/2016 N001 0.00058 U # 0.00058

Page 69
Surface Water Quality Data by Location (USEE102) FOR SITE RFN01, Rifle New Processing Site REPORT DATE: 12/19/2016 Location: 0326 SURFACE LOCATION
Parameter Units Sample Date ID Result Qualifiers
Lab Data QA Detection
Limit Uncertainty
Alkalinity, Total (as CaCO3) mg/L 11/02/2016 N001 140 #
Ammonia Total as N mg/L 11/02/2016 N001 0.1 U # 0.1
Arsenic mg/L 11/02/2016 N001 0.00038 J # 0.00012
Calcium mg/L 11/02/2016 N001 70 # 0.024
Chloride mg/L 11/02/2016 N001 200 # 4
Magnesium mg/L 11/02/2016 N001 15 # 0.03
Molybdenum mg/L 11/02/2016 N001 0.009 # 0.00032
Nitrate + Nitrite as Nitrogen mg/L 11/02/2016 N001 0.01 U # 0.01
Oxidation Reduction Potential mV 11/02/2016 N001 -22 #
pH s.u. 11/02/2016 N001 8.36 #
Potassium mg/L 11/02/2016 N001 4 # 0.052
Selenium mg/L 11/02/2016 N001 0.00066 U # 0.00066
Sodium mg/L 11/02/2016 N001 130 # 0.047
Specific Conductance umhos/cm 11/02/2016 N001 1170 J #
Sulfate mg/L 11/02/2016 N001 130 # 1
Temperature C 11/02/2016 N001 10.56 #
Turbidity NTU 11/02/2016 N001 3.29 #
Uranium mg/L 11/02/2016 N001 0.0021 # 0.000012
Vanadium mg/L 11/02/2016 N001 0.00071 J # 0.00058

Page 70
Surface Water Quality Data by Location (USEE102) FOR SITE RFN01, Rifle New Processing Site REPORT DATE: 12/19/2016 Location: 0452 SURFACE LOCATION
Parameter Units Sample Date ID Result Qualifiers
Lab Data QA Detection
Limit Uncertainty
Alkalinity, Total (as CaCO3) mg/L 11/01/2016 N001 80 #
Ammonia Total as N mg/L 11/01/2016 N001 1.3 # 0.1
Arsenic mg/L 11/01/2016 N001 0.0093 # 0.00012
Calcium mg/L 11/01/2016 N001 690 # 0.12
Chloride mg/L 11/01/2016 N001 770 # 10
Magnesium mg/L 11/01/2016 N001 110 # 0.15
Molybdenum mg/L 11/01/2016 N001 5.2 # 0.00032
Nitrate + Nitrite as Nitrogen mg/L 11/01/2016 N001 5.6 # 0.5
Oxidation Reduction Potential mV 11/01/2016 N001 172.1 #
pH s.u. 11/01/2016 N001 7.64 #
Potassium mg/L 11/01/2016 N001 58 # 0.26
Selenium mg/L 11/01/2016 N001 0.0082 # 0.00066
Sodium mg/L 11/01/2016 N001 830 # 0.23
Specific Conductance umhos/cm 11/01/2016 N001 5621 J #
Sulfate mg/L 11/01/2016 N001 2900 # 25
Temperature C 11/01/2016 N001 15.13 #
Turbidity NTU 11/01/2016 N001 9.67 #
Uranium mg/L 11/01/2016 N001 0.13 # 0.000012
Vanadium mg/L 11/01/2016 N001 0.58 # 0.00058
Page 71
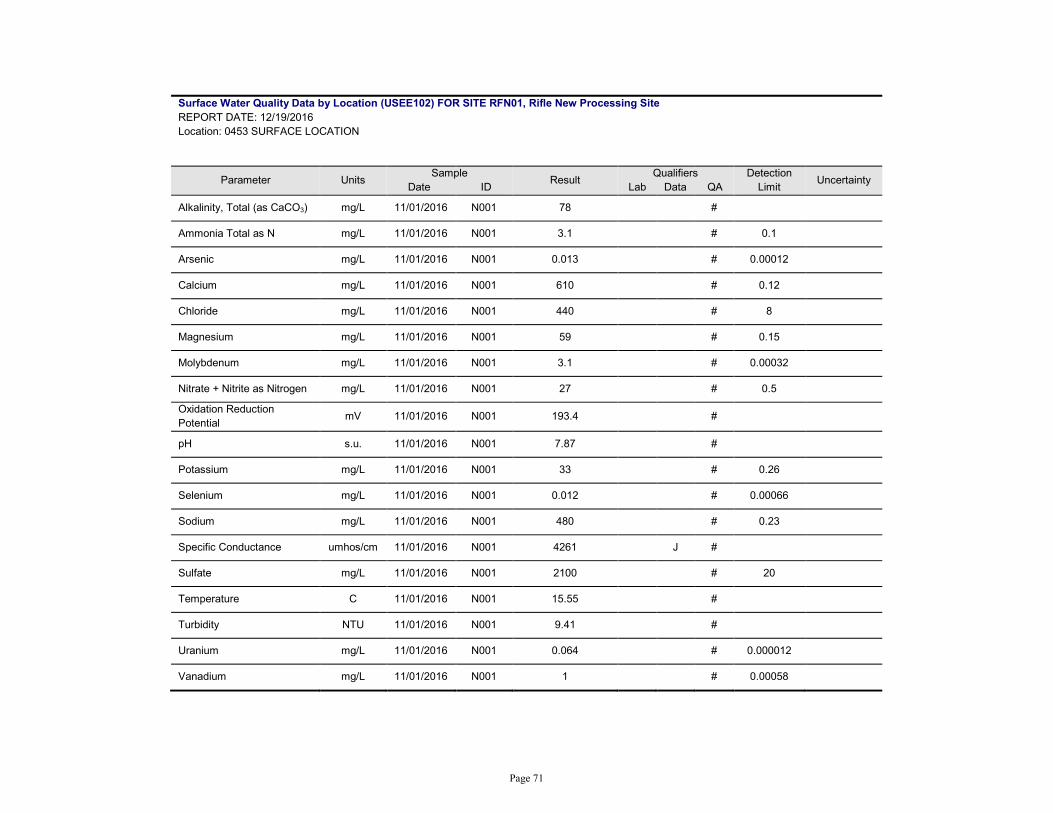
Surface Water Quality Data by Location (USEE102) FOR SITE RFN01, Rifle New Processing Site REPORT DATE: 12/19/2016 Location: 0453 SURFACE LOCATION
Parameter Units Sample Date ID Result Qualifiers
Lab Data QA Detection
Limit Uncertainty
Alkalinity, Total (as CaCO3) mg/L 11/01/2016 N001 78 #
Ammonia Total as N mg/L 11/01/2016 N001 3.1 # 0.1
Arsenic mg/L 11/01/2016 N001 0.013 # 0.00012
Calcium mg/L 11/01/2016 N001 610 # 0.12
Chloride mg/L 11/01/2016 N001 440 # 8
Magnesium mg/L 11/01/2016 N001 59 # 0.15
Molybdenum mg/L 11/01/2016 N001 3.1 # 0.00032
Nitrate + Nitrite as Nitrogen mg/L 11/01/2016 N001 27 # 0.5
Oxidation Reduction Potential mV 11/01/2016 N001 193.4 #
pH s.u. 11/01/2016 N001 7.87 #
Potassium mg/L 11/01/2016 N001 33 # 0.26
Selenium mg/L 11/01/2016 N001 0.012 # 0.00066
Sodium mg/L 11/01/2016 N001 480 # 0.23
Specific Conductance umhos/cm 11/01/2016 N001 4261 J #
Sulfate mg/L 11/01/2016 N001 2100 # 20
Temperature C 11/01/2016 N001 15.55 #
Turbidity NTU 11/01/2016 N001 9.41 #
Uranium mg/L 11/01/2016 N001 0.064 # 0.000012
Vanadium mg/L 11/01/2016 N001 1 # 0.00058

Page 72
Surface Water Quality Data by Location (USEE102) FOR SITE RFN01, Rifle New Processing Site REPORT DATE: 12/19/2016 Location: 0575 SURFACE LOCATION
Parameter Units Sample Date ID Result Qualifiers
Lab Data QA Detection
Limit Uncertainty
Alkalinity, Total (as CaCO3) mg/L 11/01/2016 N001 96 #
Ammonia Total as N mg/L 11/01/2016 N001 1.1 # 0.1
Arsenic mg/L 11/01/2016 N001 0.0019 # 0.00012
Calcium mg/L 11/01/2016 N001 500 # 0.12
Chloride mg/L 11/01/2016 N001 680 # 20
Magnesium mg/L 11/01/2016 N001 300 # 0.15
Molybdenum mg/L 11/01/2016 N001 0.97 # 0.00032
Nitrate + Nitrite as Nitrogen mg/L 11/01/2016 N001 0.12 # 0.01
Oxidation Reduction Potential mV 11/01/2016 N001 110.5 #
pH s.u. 11/01/2016 N001 8.56 #
Potassium mg/L 11/01/2016 N001 80 # 0.26
Selenium mg/L 11/01/2016 N001 0.00066 U # 0.00066
Sodium mg/L 11/01/2016 N001 1400 # 0.23
Specific Conductance umhos/cm 11/01/2016 N001 7674 J #
Sulfate mg/L 11/01/2016 N001 4800 # 50
Temperature C 11/01/2016 N001 17.34 #
Turbidity NTU 11/01/2016 N001 8.08 #
Uranium mg/L 11/01/2016 N001 0.15 # 0.000012
Vanadium mg/L 11/01/2016 N001 0.0022 J # 0.00058

Page 73
SAMPLE ID CODES: 000X = Filtered sample (0.45 µm). N00X = Unfiltered sample. X = replicate number. LAB QUALIFIERS: * Replicate analysis not within control limits. > Result above upper detection limit. A TIC is a suspected aldol-condensation product. B Inorganic: Result is between the IDL and CRDL. Organic: Analyte also found in method blank. C Pesticide result confirmed by GC-MS. D Analyte determined in diluted sample. E Inorganic: Estimate value because of interference, see case narrative. Organic: Analyte exceeded calibration range of the GC-MS. H Holding time expired, value suspect. I Increased detection limit due to required dilution. J Estimated N Inorganic or radiochemical: Spike sample recovery not within control limits. Organic: Tentatively identified compound (TIC). P > 25% difference in detected pesticide or Aroclor concentrations between 2 columns. U Analytical result below detection limit. W Post-digestion spike outside control limits while sample absorbance < 50% of analytical spike absorbance. X,Y,Z Laboratory defined qualifier, see case narrative. DATA QUALIFIERS: F Low flow sampling method used. G Possible grout contamination, pH > 9. J Estimated value. L Less than 3 bore volumes purged prior to sampling. Q Qualitative result due to sampling technique. R Unusable result. U Parameter analyzed for but was not detected. X Location is undefined. QA QUALIFIER: # Validated according to quality assurance guidelines.

Page 74
This page intentionally left blank

Page 75
Groundwater Quality Data
Old Rifle

Page 76
This page intentionally left blank

Page 77
Groundwater Quality Data by Location (USEE100) FOR SITE RFO01, Rifle Old Processing Site REPORT DATE: 12/19/2016 Location: 0292A WELL
Parameter Units Sample Date ID
Depth Range (Ft BLS) Result Qualifiers
Lab Data QA Detection
Limit Uncertainty
Alkalinity, Total (as CaCO3) mg/L 11/01/2016 N001 10.5 - 20.5 498 F #
Calcium mg/L 11/01/2016 N001 10.5 - 20.5 190 F # 0.024
Chloride mg/L 11/01/2016 N001 10.5 - 20.5 100 F # 2
Magnesium mg/L 11/01/2016 N001 10.5 - 20.5 110 F # 0.03
Nitrate + Nitrite as Nitrogen mg/L 11/01/2016 N001 10.5 - 20.5 0.01 U F # 0.01
Oxidation Reduction Potential mV 11/01/2016 N001 10.5 - 20.5 -73 F #
pH s.u. 11/01/2016 N001 10.5 - 20.5 7.37 JF #
Potassium mg/L 11/01/2016 N001 10.5 - 20.5 5.9 F # 0.052
Selenium mg/L 11/01/2016 N001 10.5 - 20.5 0.00066 U F # 0.00066
Sodium mg/L 11/01/2016 N001 10.5 - 20.5 240 F # 0.047
Specific Conductance umhos/cm 11/01/2016 N001 10.5 - 20.5 2440 F #
Sulfate mg/L 11/01/2016 N001 10.5 - 20.5 930 F # 5
Temperature C 11/01/2016 N001 10.5 - 20.5 14.23 F #
Turbidity NTU 11/01/2016 N001 10.5 - 20.5 1.49 F #
Uranium mg/L 11/01/2016 N001 10.5 - 20.5 0.037 F # 0.000012
Vanadium mg/L 11/01/2016 N001 10.5 - 20.5 0.00058 U F # 0.00058

Page 78
Groundwater Quality Data by Location (USEE100) FOR SITE RFO01, Rifle Old Processing Site REPORT DATE: 12/19/2016 Location: 0304 WELL
Parameter Units Sample Date ID
Depth Range (Ft BLS) Result Qualifiers
Lab Data QA Detection
Limit Uncertainty
Alkalinity, Total (as CaCO3) mg/L 10/31/2016 N001 13.2 - 18.2 364 F #
Calcium mg/L 10/31/2016 N001 13.2 - 18.2 260 F # 0.024
Chloride mg/L 10/31/2016 N001 13.2 - 18.2 240 F # 4
Magnesium mg/L 10/31/2016 N001 13.2 - 18.2 100 F # 0.03
Nitrate + Nitrite as Nitrogen mg/L 10/31/2016 N001 13.2 - 18.2 0.01 U F # 0.01
Oxidation Reduction Potential mV 10/31/2016 N001 13.2 - 18.2 -6 F #
pH s.u. 10/31/2016 N001 13.2 - 18.2 7.07 F #
Potassium mg/L 10/31/2016 N001 13.2 - 18.2 7.7 F # 0.052
Selenium mg/L 10/31/2016 N001 13.2 - 18.2 0.0018 F # 0.00066
Sodium mg/L 10/31/2016 N001 13.2 - 18.2 180 F # 0.047
Specific Conductance umhos/cm 10/31/2016 N001 13.2 - 18.2 2533 F #
Sulfate mg/L 10/31/2016 N001 13.2 - 18.2 470 F # 10
Temperature C 10/31/2016 N001 13.2 - 18.2 15.41 F #
Turbidity NTU 10/31/2016 N001 13.2 - 18.2 8.8 F #
Uranium mg/L 10/31/2016 N001 13.2 - 18.2 0.058 F # 0.000012
Vanadium mg/L 10/31/2016 N001 13.2 - 18.2 0.032 F # 0.00058

Page 79
Groundwater Quality Data by Location (USEE100) FOR SITE RFO01, Rifle Old Processing Site REPORT DATE: 12/19/2016 Location: 0305 WELL
Parameter Units Sample Date ID
Depth Range (Ft BLS) Result Qualifiers
Lab Data QA Detection
Limit Uncertainty
Alkalinity, Total (as CaCO3) mg/L 10/31/2016 N001 13.76 - 18.76 380 F #
Calcium mg/L 10/31/2016 N001 13.76 - 18.76 190 F # 0.024
Chloride mg/L 10/31/2016 N001 13.76 - 18.76 340 F # 5
Magnesium mg/L 10/31/2016 N001 13.76 - 18.76 76 F # 0.03
Nitrate + Nitrite as Nitrogen mg/L 10/31/2016 N001 13.76 - 18.76 0.01 U F # 0.01
Oxidation Reduction Potential mV 10/31/2016 N001 13.76 - 18.76 29.4 F #
pH s.u. 10/31/2016 N001 13.76 - 18.76 7.06 F #
Potassium mg/L 10/31/2016 N001 13.76 - 18.76 7.7 F # 0.052
Selenium mg/L 10/31/2016 N001 13.76 - 18.76 0.016 F # 0.00066
Sodium mg/L 10/31/2016 N001 13.76 - 18.76 200 F # 0.047
Specific Conductance umhos/cm 10/31/2016 N001 13.76 - 18.76 2182 F #
Sulfate mg/L 10/31/2016 N001 13.76 - 18.76 640 F # 12
Temperature C 10/31/2016 N001 13.76 - 18.76 16.29 F #
Turbidity NTU 10/31/2016 N001 13.76 - 18.76 2.62 F #
Uranium mg/L 10/31/2016 N001 13.76 - 18.76 0.074 F # 0.000012
Vanadium mg/L 10/31/2016 N001 13.76 - 18.76 0.3 F # 0.00058

Page 80
Groundwater Quality Data by Location (USEE100) FOR SITE RFO01, Rifle Old Processing Site REPORT DATE: 12/19/2016 Location: 0309 WELL
Parameter Units Sample Date ID
Depth Range (Ft BLS) Result Qualifiers
Lab Data QA Detection
Limit Uncertainty
Alkalinity, Total (as CaCO3) mg/L 10/31/2016 N001 16.93 - 21.93 376 F #
Calcium mg/L 10/31/2016 N001 16.93 - 21.93 170 F # 0.024
Chloride mg/L 10/31/2016 N001 16.93 - 21.93 140 F # 5
Magnesium mg/L 10/31/2016 N001 16.93 - 21.93 120 F # 0.03
Nitrate + Nitrite as Nitrogen mg/L 10/31/2016 N001 16.93 - 21.93 0.01 U F # 0.01
Oxidation Reduction Potential mV 10/31/2016 N001 16.93 - 21.93 -53 F #
pH s.u. 10/31/2016 N001 16.93 - 21.93 7.14 F #
Potassium mg/L 10/31/2016 N001 16.93 - 21.93 7.1 F # 0.052
Selenium mg/L 10/31/2016 N001 16.93 - 21.93 0.00066 U F # 0.00066
Sodium mg/L 10/31/2016 N001 16.93 - 21.93 200 F # 0.047
Specific Conductance umhos/cm 10/31/2016 N001 16.93 - 21.93 2310 F #
Sulfate mg/L 10/31/2016 N001 16.93 - 21.93 790 F # 12
Temperature C 10/31/2016 N001 16.93 - 21.93 16.3 F #
Turbidity NTU 10/31/2016 N001 16.93 - 21.93 4.22 F #
Uranium mg/L 10/31/2016 N001 16.93 - 21.93 0.02 F # 0.000012
Vanadium mg/L 10/31/2016 N001 16.93 - 21.93 0.00058 U F # 0.00058

Page 81
Groundwater Quality Data by Location (USEE100) FOR SITE RFO01, Rifle Old Processing Site REPORT DATE: 12/19/2016 Location: 0310 WELL
Parameter Units Sample Date ID
Depth Range (Ft BLS) Result Qualifiers
Lab Data QA Detection
Limit Uncertainty
Alkalinity, Total (as CaCO3) mg/L 10/31/2016 N001 17.93 - 22.93 465 F #
Calcium mg/L 10/31/2016 N001 17.93 - 22.93 230 F # 0.024
Calcium mg/L 10/31/2016 N002 17.93 - 22.93 230 F # 0.024
Chloride mg/L 10/31/2016 N001 17.93 - 22.93 210 F # 5
Chloride mg/L 10/31/2016 N002 17.93 - 22.93 200 F # 5
Magnesium mg/L 10/31/2016 N001 17.93 - 22.93 110 F # 0.03
Magnesium mg/L 10/31/2016 N002 17.93 - 22.93 110 F # 0.03
Nitrate + Nitrite as Nitrogen mg/L 10/31/2016 N001 17.93 - 22.93 0.01 U F # 0.01
Nitrate + Nitrite as Nitrogen mg/L 10/31/2016 N002 17.93 - 22.93 0.01 U F # 0.01
Oxidation Reduction Potential mV 10/31/2016 N001 17.93 - 22.93 -55 F #
pH s.u. 10/31/2016 N001 17.93 - 22.93 7.15 F #
Potassium mg/L 10/31/2016 N001 17.93 - 22.93 9.7 F # 0.052
Potassium mg/L 10/31/2016 N002 17.93 - 22.93 9.7 F # 0.052
Selenium mg/L 10/31/2016 N001 17.93 - 22.93 0.00066 U F # 0.00066
Selenium mg/L 10/31/2016 N002 17.93 - 22.93 0.00066 U F # 0.00066
Sodium mg/L 10/31/2016 N001 17.93 - 22.93 240 F # 0.047
Sodium mg/L 10/31/2016 N002 17.93 - 22.93 240 F # 0.047
Specific Conductance umhos/cm 10/31/2016 N001 17.93 - 22.93 2668 F #

Page 82
Groundwater Quality Data by Location (USEE100) FOR SITE RFO01, Rifle Old Processing Site REPORT DATE: 12/19/2016 Location: 0310 WELL
Parameter Units Sample Date ID
Depth Range (Ft BLS) Result Qualifiers
Lab Data QA Detection
Limit Uncertainty
Sulfate mg/L 10/31/2016 N001 17.93 - 22.93 810 F # 12
Sulfate mg/L 10/31/2016 N002 17.93 - 22.93 780 F # 12
Temperature C 10/31/2016 N001 17.93 - 22.93 16.2 F #
Turbidity NTU 10/31/2016 N001 17.93 - 22.93 1.3 F #
Uranium mg/L 10/31/2016 N001 17.93 - 22.93 0.15 F # 0.000012
Uranium mg/L 10/31/2016 N002 17.93 - 22.93 0.15 F # 0.000012
Vanadium mg/L 10/31/2016 N001 17.93 - 22.93 0.0079 F # 0.00058
Vanadium mg/L 10/31/2016 N002 17.93 - 22.93 0.008 F # 0.00058

Page 83
Groundwater Quality Data by Location (USEE100) FOR SITE RFO01, Rifle Old Processing Site REPORT DATE: 12/19/2016 Location: 0655 WELL
Parameter Units Sample Date ID
Depth Range (Ft BLS) Result Qualifiers
Lab Data QA Detection
Limit Uncertainty
Alkalinity, Total (as CaCO3) mg/L 10/31/2016 N001 13.6 - 23.6 476 F #
Calcium mg/L 10/31/2016 N001 13.6 - 23.6 210 F # 0.024
Chloride mg/L 10/31/2016 N001 13.6 - 23.6 160 F # 5
Magnesium mg/L 10/31/2016 N001 13.6 - 23.6 140 F # 0.03
Nitrate + Nitrite as Nitrogen mg/L 10/31/2016 N001 13.6 - 23.6 2.2 F # 0.1
Oxidation Reduction Potential mV 10/31/2016 N001 13.6 - 23.6 -65 F #
pH s.u. 10/31/2016 N001 13.6 - 23.6 7.03 F #
Potassium mg/L 10/31/2016 N001 13.6 - 23.6 8.6 F # 0.052
Selenium mg/L 10/31/2016 N001 13.6 - 23.6 0.059 F # 0.00066
Sodium mg/L 10/31/2016 N001 13.6 - 23.6 220 F # 0.047
Specific Conductance umhos/cm 10/31/2016 N001 13.6 - 23.6 2603 F #
Sulfate mg/L 10/31/2016 N001 13.6 - 23.6 810 F # 12
Temperature C 10/31/2016 N001 13.6 - 23.6 15.23 F #
Turbidity NTU 10/31/2016 N001 13.6 - 23.6 1.09 F #
Uranium mg/L 10/31/2016 N001 13.6 - 23.6 0.11 F # 0.000012
Vanadium mg/L 10/31/2016 N001 13.6 - 23.6 0.3 F # 0.00058

Page 84
Groundwater Quality Data by Location (USEE100) FOR SITE RFO01, Rifle Old Processing Site REPORT DATE: 12/19/2016 Location: 0656 WELL
Parameter Units Sample Date ID
Depth Range (Ft BLS) Result Qualifiers
Lab Data QA Detection
Limit Uncertainty
Alkalinity, Total (as CaCO3) mg/L 10/31/2016 N001 6.35 - 21.35 320 F #
Calcium mg/L 10/31/2016 N001 6.35 - 21.35 170 F # 0.024
Chloride mg/L 10/31/2016 N001 6.35 - 21.35 360 F # 4
Magnesium mg/L 10/31/2016 N001 6.35 - 21.35 86 F # 0.03
Nitrate + Nitrite as Nitrogen mg/L 10/31/2016 N001 6.35 - 21.35 0.29 F # 0.01
Oxidation Reduction Potential mV 10/31/2016 N001 6.35 - 21.35 22 F #
pH s.u. 10/31/2016 N001 6.35 - 21.35 7.12 F #
Potassium mg/L 10/31/2016 N001 6.35 - 21.35 10 F # 0.052
Selenium mg/L 10/31/2016 N001 6.35 - 21.35 0.0087 F # 0.00066
Sodium mg/L 10/31/2016 N001 6.35 - 21.35 250 F # 0.047
Specific Conductance umhos/cm 10/31/2016 N001 6.35 - 21.35 2486 F #
Sulfate mg/L 10/31/2016 N001 6.35 - 21.35 510 F # 10
Temperature C 10/31/2016 N001 6.35 - 21.35 19.4 F #
Turbidity NTU 10/31/2016 N001 6.35 - 21.35 3.86 F #
Uranium mg/L 10/31/2016 N001 6.35 - 21.35 0.22 F # 0.000012
Vanadium mg/L 10/31/2016 N001 6.35 - 21.35 0.026 F # 0.00058

Page 85
Groundwater Quality Data by Location (USEE100) FOR SITE RFO01, Rifle Old Processing Site REPORT DATE: 12/19/2016 Location: 0658 WELL
Parameter Units Sample Date ID
Depth Range (Ft BLS) Result Qualifiers
Lab Data QA Detection
Limit Uncertainty
Alkalinity, Total (as CaCO3) mg/L 11/01/2016 N001 2.3 - 17.3 575 F #
Calcium mg/L 11/01/2016 N001 2.3 - 17.3 160 F # 0.024
Chloride mg/L 11/01/2016 N001 2.3 - 17.3 27 F # 2.5
Magnesium mg/L 11/01/2016 N001 2.3 - 17.3 89 F # 0.03
Nitrate + Nitrite as Nitrogen mg/L 11/01/2016 N001 2.3 - 17.3 0.01 U F # 0.01
Oxidation Reduction Potential mV 11/01/2016 N001 2.3 - 17.3 -62 F #
pH s.u. 11/01/2016 N001 2.3 - 17.3 7.29 F #
Potassium mg/L 11/01/2016 N001 2.3 - 17.3 3.2 F # 0.052
Selenium mg/L 11/01/2016 N001 2.3 - 17.3 0.00066 U F # 0.00066
Sodium mg/L 11/01/2016 N001 2.3 - 17.3 74 F # 0.047
Specific Conductance umhos/cm 11/01/2016 N001 2.3 - 17.3 1510 F #
Sulfate mg/L 11/01/2016 N001 2.3 - 17.3 380 F # 6.2
Temperature C 11/01/2016 N001 2.3 - 17.3 12.4 F #
Turbidity NTU 11/01/2016 N001 2.3 - 17.3 2.98 F #
Uranium mg/L 11/01/2016 N001 2.3 - 17.3 0.0088 F # 0.000012
Vanadium mg/L 11/01/2016 N001 2.3 - 17.3 0.00065 J F # 0.00058

Page 86
SAMPLE ID CODES: 000X = Filtered sample (0.45 µm). N00X = Unfiltered sample. X = replicate number. LAB QUALIFIERS: * Replicate analysis not within control limits. > Result above upper detection limit. A TIC is a suspected aldol-condensation product. B Inorganic: Result is between the IDL and CRDL. Organic: Analyte also found in method blank. C Pesticide result confirmed by GC-MS. D Analyte determined in diluted sample. E Inorganic: Estimate value because of interference, see case narrative. Organic: Analyte exceeded calibration range of the GC-MS. H Holding time expired, value suspect. I Increased detection limit due to required dilution. J Estimated N Inorganic or radiochemical: Spike sample recovery not within control limits. Organic: Tentatively identified compound (TIC). P > 25% difference in detected pesticide or Aroclor concentrations between 2 columns. U Analytical result below detection limit. W Post-digestion spike outside control limits while sample absorbance < 50% of analytical spike absorbance. X,Y,Z Laboratory defined qualifier, see case narrative. DATA QUALIFIERS: F Low flow sampling method used. G Possible grout contamination, pH > 9. J Estimated value. L Less than 3 bore volumes purged prior to sampling. Q Qualitative result due to sampling technique. R Unusable result. U Parameter analyzed for but was not detected. X Location is undefined. QA QUALIFIER: # Validated according to quality assurance guidelines.

Page 87
Surface Water Quality Data
Old Rifle

Page 88
This page intentionally left blank

Page 89
Surface Water Quality Data by Location (USEE102) FOR SITE RFO01, Rifle Old Processing Site REPORT DATE: 12/19/2016 Location: 0294 SURFACE LOCATION
Parameter Units Sample Date ID Result Qualifiers
Lab Data QA Detection
Limit Uncertainty
Alkalinity, Total (as CaCO3) mg/L 10/31/2016 N001 110 #
Calcium mg/L 10/31/2016 N001 69 # 0.024
Chloride mg/L 10/31/2016 N001 180 # 2
Magnesium mg/L 10/31/2016 N001 14 # 0.03
Nitrate + Nitrite as Nitrogen mg/L 10/31/2016 N001 0.01 U # 0.01
Oxidation Reduction Potential mV 10/31/2016 N001 56 #
pH s.u. 10/31/2016 N001 7.67 #
Potassium mg/L 10/31/2016 N001 4.1 # 0.052
Selenium mg/L 10/31/2016 N001 0.00066 U # 0.00066
Sodium mg/L 10/31/2016 N001 130 # 0.047
Specific Conductance umhos/cm 10/31/2016 N001 1010 #
Sulfate mg/L 10/31/2016 N001 110 # 5
Temperature C 10/31/2016 N001 16.3 #
Turbidity NTU 10/31/2016 N001 2.45 #
Uranium mg/L 10/31/2016 N001 0.0021 # 0.000012
Vanadium mg/L 10/31/2016 N001 0.00061 J # 0.00058

Page 90
Surface Water Quality Data by Location (USEE102) FOR SITE RFO01, Rifle Old Processing Site REPORT DATE: 12/19/2016 Location: 0395 SURFACE LOCATION
Parameter Units Sample Date ID Result Qualifiers
Lab Data QA Detection
Limit Uncertainty
Alkalinity, Total (as CaCO3) mg/L 11/01/2016 N001 325 #
Calcium mg/L 11/01/2016 N001 150 # 0.024
Chloride mg/L 11/01/2016 N001 78 # 4
Magnesium mg/L 11/01/2016 N001 110 # 0.03
Nitrate + Nitrite as Nitrogen mg/L 11/01/2016 N001 0.01 U # 0.01
Oxidation Reduction Potential mV 11/01/2016 N001 43 #
pH s.u. 11/01/2016 N001 7.92 #
Potassium mg/L 11/01/2016 N001 5.4 # 0.052
Selenium mg/L 11/01/2016 N001 0.00066 U # 0.00066
Sodium mg/L 11/01/2016 N001 90 # 0.047
Specific Conductance umhos/cm 11/01/2016 N001 1710 #
Sulfate mg/L 11/01/2016 N001 550 # 10
Temperature C 11/01/2016 N001 12.48 #
Turbidity NTU 11/01/2016 N001 5.34 #
Uranium mg/L 11/01/2016 N001 0.015 # 0.000012
Vanadium mg/L 11/01/2016 N001 0.00083 J # 0.00058

Page 91
Surface Water Quality Data by Location (USEE102) FOR SITE RFO01, Rifle Old Processing Site REPORT DATE: 12/19/2016 Location: 0396 SURFACE LOCATION
Parameter Units Sample Date ID Result Qualifiers
Lab Data QA Detection
Limit Uncertainty
Alkalinity, Total (as CaCO3) mg/L 11/02/2016 N001 146 #
Calcium mg/L 11/02/2016 N001 71 # 0.024
Chloride mg/L 11/02/2016 N001 190 # 2
Magnesium mg/L 11/02/2016 N001 15 # 0.03
Nitrate + Nitrite as Nitrogen mg/L 11/02/2016 N001 0.01 U # 0.01
Oxidation Reduction Potential mV 11/02/2016 N001 183.2 #
pH s.u. 11/02/2016 N001 6.86 #
Potassium mg/L 11/02/2016 N001 4.1 # 0.052
Selenium mg/L 11/02/2016 N001 0.00066 U # 0.00066
Sodium mg/L 11/02/2016 N001 130 # 0.047
Specific Conductance umhos/cm 11/02/2016 N001 1018 J #
Sulfate mg/L 11/02/2016 N001 110 # 5
Temperature C 11/02/2016 N001 9.63 #
Turbidity NTU 11/02/2016 N001 4.81 #
Uranium mg/L 11/02/2016 N001 0.0022 # 0.000012
Vanadium mg/L 11/02/2016 N001 0.00058 U # 0.00058

Page 92
Surface Water Quality Data by Location (USEE102) FOR SITE RFO01, Rifle Old Processing Site REPORT DATE: 12/19/2016 Location: 0398 SURFACE LOCATION
Parameter Units Sample Date ID Result Qualifiers
Lab Data QA Detection
Limit Uncertainty
Alkalinity, Total (as CaCO3) mg/L 10/31/2016 N001 226 #
Calcium mg/L 10/31/2016 N001 120 # 0.024
Chloride mg/L 10/31/2016 N001 130 # 2.5
Magnesium mg/L 10/31/2016 N001 46 # 0.03
Nitrate + Nitrite as Nitrogen mg/L 10/31/2016 N001 0.34 # 0.01
Oxidation Reduction Potential mV 10/31/2016 N001 -17 #
pH s.u. 10/31/2016 N001 8.04 #
Potassium mg/L 10/31/2016 N001 3.6 # 0.052
Selenium mg/L 10/31/2016 N001 0.0019 # 0.00066
Sodium mg/L 10/31/2016 N001 130 # 0.047
Specific Conductance umhos/cm 10/31/2016 N001 1428 #
Sulfate mg/L 10/31/2016 N001 300 # 6.2
Temperature C 10/31/2016 N001 15.15 #
Turbidity NTU 10/31/2016 N001 2.26 #
Uranium mg/L 10/31/2016 N001 0.013 # 0.000012
Vanadium mg/L 10/31/2016 N001 0.0025 J # 0.00058

Page 93
Surface Water Quality Data by Location (USEE102) FOR SITE RFO01, Rifle Old Processing Site REPORT DATE: 12/19/2016 Location: 0741 SURFACE LOCATION
Parameter Units Sample Date ID Result Qualifiers
Lab Data QA Detection
Limit Uncertainty
Alkalinity, Total (as CaCO3) mg/L 11/02/2016 N001 130 #
Calcium mg/L 11/02/2016 N001 69 # 0.024
Chloride mg/L 11/02/2016 N001 190 # 4
Magnesium mg/L 11/02/2016 N001 14 # 0.03
Nitrate + Nitrite as Nitrogen mg/L 11/02/2016 N001 0.01 U # 0.01
Oxidation Reduction Potential mV 11/02/2016 N001 176.6 #
pH s.u. 11/02/2016 N001 7.65 #
Potassium mg/L 11/02/2016 N001 4 # 0.052
Selenium mg/L 11/02/2016 N001 0.00066 U # 0.00066
Sodium mg/L 11/02/2016 N001 130 # 0.047
Specific Conductance umhos/cm 11/02/2016 N001 971 J #
Sulfate mg/L 11/02/2016 N001 110 # 10
Temperature C 11/02/2016 N001 9.65 #
Turbidity NTU 11/02/2016 N001 2.35 #
Uranium mg/L 11/02/2016 N001 0.002 # 0.000012
Vanadium mg/L 11/02/2016 N001 0.00058 U # 0.00058

Page 94
SAMPLE ID CODES: 000X = Filtered sample (0.45 µm). N00X = Unfiltered sample. X = replicate number. LAB QUALIFIERS: * Replicate analysis not within control limits. > Result above upper detection limit. A TIC is a suspected aldol-condensation product. B Inorganic: Result is between the IDL and CRDL. Organic: Analyte also found in method blank. C Pesticide result confirmed by GC-MS. D Analyte determined in diluted sample. E Inorganic: Estimate value because of interference, see case narrative. Organic: Analyte exceeded calibration range of the GC-MS. H Holding time expired, value suspect. I Increased detection limit due to required dilution. J Estimated N Inorganic or radiochemical: Spike sample recovery not within control limits. Organic: Tentatively identified compound (TIC). P > 25% difference in detected pesticide or Aroclor concentrations between 2 columns. U Analytical result below detection limit. W Post-digestion spike outside control limits while sample absorbance < 50% of analytical spike absorbance. X,Y,Z Laboratory defined qualifier, see case narrative. DATA QUALIFIERS: F Low flow sampling method used. G Possible grout contamination, pH > 9. J Estimated value. L Less than 3 bore volumes purged prior to sampling. Q Qualitative result due to sampling technique. R Unusable result. U Parameter analyzed for but was not detected. X Location is undefined. QA QUALIFIER: # Validated according to quality assurance guidelines.

Page 95
Static Water Level Data

Page 96
This page intentionally left blank

Page 97
STATIC WATER LEVELS (USEE700) FOR SITE RFN01, Rifle New Processing Site REPORT DATE: 12/19/2016
Location Code
Flow Code
Top of Casing
Elevation (Ft)
Measurement Date Time
Depth From Top of
Casing (Ft)
Water Elevation
(Ft)
Water Level Flag
0169 U 5275.47 10/31/2016 12:15:48 8.9 5266.57
0170 D 5332.97 11/02/2016 15:45:37 94.8 5238.17
0172 D 5229.45 11/02/2016 10:30:09 17.07 5212.38
0195 D 5253.1 11/02/2016 14:55:48 10.52 5242.58
0201 D 5261.07 11/02/2016 10:56:00 13.6 5247.47
0215 O 5271.42 11/02/2016 14:15:29 10.38 5261.04
0216 O 5265.41 10/31/2016 13:30:15 6.61 5258.8
0217 D 5256.98 11/02/2016 13:35:18 4.7 5252.28
0590 D 5256.37 11/01/2016 15:15:21 7.13 5249.24
0620 D 5231.22 11/02/2016 09:40:25 10.79 5220.43
0635 D 5256.12 11/01/2016 12:50:07 8.66 5247.46
0658 O 5265.91 11/01/2016 10:55:23 6.33 5259.58
0659 O 5261.33 11/01/2016 14:15:50 6.76 5254.57
0664 O 5270.17 10/31/2016 14:45:15 12.89 5257.28
0669 O 5266.56 11/01/2016 13:15:54 9.65 5256.91
0670 O 5270.94 10/31/2016 13:55:24 12.43 5258.51
0855 O 5267.24 11/01/2016 11:30:16 7.53 5259.71
FLOW CODES: B BACKGROUND C CROSS GRADIENT D DOWNGRADIENT F OFF SITE N UNKNOWN O ONSITE U UPGRADIENT WATER LEVEL FLAGS: D Dry F Flowing B Below top of pump

Page 98
STATIC WATER LEVELS (USEE700) FOR SITE RFO01, Rifle Old Processing Site REPORT DATE: 12/19/2016
Location Code
Flow Code
Top of Casing
Elevation (Ft)
Measurement Date Time
Depth From Top of
Casing (Ft)
Water Elevation
(Ft)
Water Level Flag
0292A 5323.08 11/01/2016 11:05:51 11.32 5311.76
0304 O 5310.63 10/31/2016 12:40:51 11.66 5298.97
0305 O 5312.08 10/31/2016 12:20:04 12.48 5299.6
0309 O 5313.37 10/31/2016 13:30:01 16.3 5297.07
0310 O 5311.64 10/31/2016 13:00:16 14.02 5297.62
0655 O 5312.87 10/31/2016 13:55:38 14.02 5298.85
0656 O 5313.28 10/31/2016 14:40:54 13.71 5299.57
0658 U 5323.07 11/01/2016 11:30:36 6.94 5316.13
FLOW CODES: B BACKGROUND C CROSS GRADIENT D DOWNGRADIENT F OFFSITE N UNKNOWN O ONSITE U UPGRADIENT

Page 99
Time-Concentration Graphs
New Rifle Groundwater

Page 100
This page intentionally left blank

Page 101
0
20
40
60
80
100
120
140
160
180
200
2004
2005
2006
2007
2008
2009
2010
2011
2012
2013
2014
2015
2016
2017
Amm
onia
Tot
al a
s N
(mg/
L)
Date
Rifle New Processing Site Ammonia Total as N Concentration
On-Site Wells
0215
0216
0658
0659
0664
0669
0670
Location

Page 102
0
0.05
0.1
0.15
0.2
0.25
0.3
0.35
1998
1999
2000
2001
2002
2003
2004
2005
2006
2007
2008
2009
2010
2011
2012
2013
2014
2015
2016
2017
Arse
nic
(mg/
L)
Date
Rifle New Processing Site Arsenic Concentration
On-Site Wells Remediation Goal = 0.05 mg/L
0215
0216
0658
0659
0664
0669
0670
Goal
Location

Page 103
0
1
2
3
4
5
6
7
8
1998
1999
2000
2001
2002
2003
2004
2005
2006
2007
2008
2009
2010
2011
2012
2013
2014
2015
2016
2017
Mol
ybde
num
(mg/
L)
Date
Rifle New Processing Site Molybdenum Concentration
On-Site Wells Remediation Goal = 0.1 mg/L
0215
0216
0658
0659
0664
0669
0670
Goal
Location

Page 104
0
10
20
30
40
50
60
70
80
2004
2005
2006
2007
2008
2009
2010
2011
2012
2013
2014
2015
2016
2017
Nitr
ate
+ N
itrite
as
Nitr
ogen
(mg/
L)
Date
Rifle New Processing Site Nitrate + Nitrite as Nitrogen Concentration
On-Site Wells Remediation Goal = 10 mg/L
0215
0216
0658
0659
0664
0669
0670
Goal
Location

Page 105
0
0.2
0.4
0.6
0.8
1
1.2
1.4
1.6
1998
1999
2000
2001
2002
2003
2004
2005
2006
2007
2008
2009
2010
2011
2012
2013
2014
2015
2016
2017
Sele
nium
(mg/
L)
Date
Rifle New Processing Site Selenium Concentration
On-Site Wells Remediation Goal = 0.036 mg/L
0215
0216
0658
0659
0664
0669
0670
Goal
Location

Page 106
0
0.05
0.1
0.15
0.2
0.25
0.3
0.35
0.4
1998
1999
2000
2001
2002
2003
2004
2005
2006
2007
2008
2009
2010
2011
2012
2013
2014
2015
2016
2017
Ura
nium
(mg/
L)
Date
Rifle New Processing Site Uranium Concentration
On-Site Wells Remediation Goal = 0.067 mg/L
0215
0216
0658
0659
0664
0669
0670
Goal
Location

Page 107
0
10
20
30
40
50
60
1998
1999
2000
2001
2002
2003
2004
2005
2006
2007
2008
2009
2010
2011
2012
2013
2014
2015
2016
2017
Vana
dium
(mg/
L)
Date
Rifle New Processing Site Vanadium Concentration
On-Site Wells Alternate Concentration Limit = 50 mg/L
0215
0216
0658
0659
0664
0669
0670
Limit
Location

Page 108
0
50
100
150
200
250
300
2004
2005
2006
2007
2008
2009
2010
2011
2012
2013
2014
2015
2016
2017
Amm
onia
Tot
al a
s N
(mg/
L)
Date
Rifle New Processing Site Ammonia Total as N Concentration
Adjacent to Site Wells
0201
0217
0590
0635
Location

Page 109
0
0.01
0.02
0.03
0.04
0.05
0.06
1998
1999
2000
2001
2002
2003
2004
2005
2006
2007
2008
2009
2010
2011
2012
2013
2014
2015
2016
2017
Arse
nic
(mg/
L)
Date
Rifle New Processing Site Arsenic Concentration Adjacent to Site Wells
Remediation Goal = 0.05 mg/L
0201
0217
0590
0635
Goal
Location

Page 110
0
0.5
1
1.5
2
2.5
3
3.5
1998
1999
2000
2001
2002
2003
2004
2005
2006
2007
2008
2009
2010
2011
2012
2013
2014
2015
2016
2017
Mol
ybde
num
(mg/
L)
Date
Rifle New Processing Site Molybdenum Concentration
Adjacent to Site Wells Remediation Goal = 0.1 mg/L
0201
0217
0590
0635
Goal
Location

Page 111
0
20
40
60
80
100
120
140
160
2004
2005
2006
2007
2008
2009
2010
2011
2012
2013
2014
2015
2016
2017
Nitr
ate
+ N
itrite
as
Nitr
ogen
(mg/
L)
Date
Rifle New Processing Site Nitrate + Nitrite as Nitrogen Concentration
Adjacent to Site Wells Remediation Goal = 10 mg/L
0201
0217
0590
0635
Goal
Location

Page 112
0
0.05
0.1
0.15
0.2
0.25
1998
1999
2000
2001
2002
2003
2004
2005
2006
2007
2008
2009
2010
2011
2012
2013
2014
2015
2016
2017
Sele
nium
(mg/
L)
Date
Rifle New Processing Site Selenium Concentration Adjacent to Site Wells
Remediation Goal = 0.036 mg/L
0201
0217
0590
0635
Goal
Location

Page 113
0
0.02
0.04
0.06
0.08
0.1
0.12
0.14
0.16
0.18
0.2
1998
1999
2000
2001
2002
2003
2004
2005
2006
2007
2008
2009
2010
2011
2012
2013
2014
2015
2016
2017
Ura
nium
(mg/
L)
Date
Rifle New Processing Site Uranium Concentration Adjacent to Site Wells
Remediation Goal = 0.067 mg/L
0201
0217
0590
0635
Goal
Location

Page 114
0
0.5
1
1.5
2
2.5
3
3.5
4
4.5
5
1998
1999
2000
2001
2002
2003
2004
2005
2006
2007
2008
2009
2010
2011
2012
2013
2014
2015
2016
2017
Vana
dium
(mg/
L)
Date
Rifle New Processing Site Vanadium Concentration
Adjacent to Site Wells Alternate Concentration Limit = 50 mg/L
0201
0217
0590
0635
Limit
Location

Page 115
0
5
10
15
20
25
30
35
40
45
50
2004
2005
2006
2007
2008
2009
2010
2011
2012
2013
2014
2015
2016
2017
Amm
onia
Tot
al a
s N
(mg/
L)
Date
Rifle New Processing Site Ammonia Total as N Concentration
Downgradient Wells
0170
0172
0195
0620
Location

Page 116
0
0.01
0.02
0.03
0.04
0.05
0.06
1998
1999
2000
2001
2002
2003
2004
2005
2006
2007
2008
2009
2010
2011
2012
2013
2014
2015
2016
2017
Arse
nic
(mg/
L)
Date
Rifle New Processing Site Arsenic Concentration
Downgradient Wells Remediation Goal = 0.05 mg/L
0170
0172
0195
0620
Goal
Location
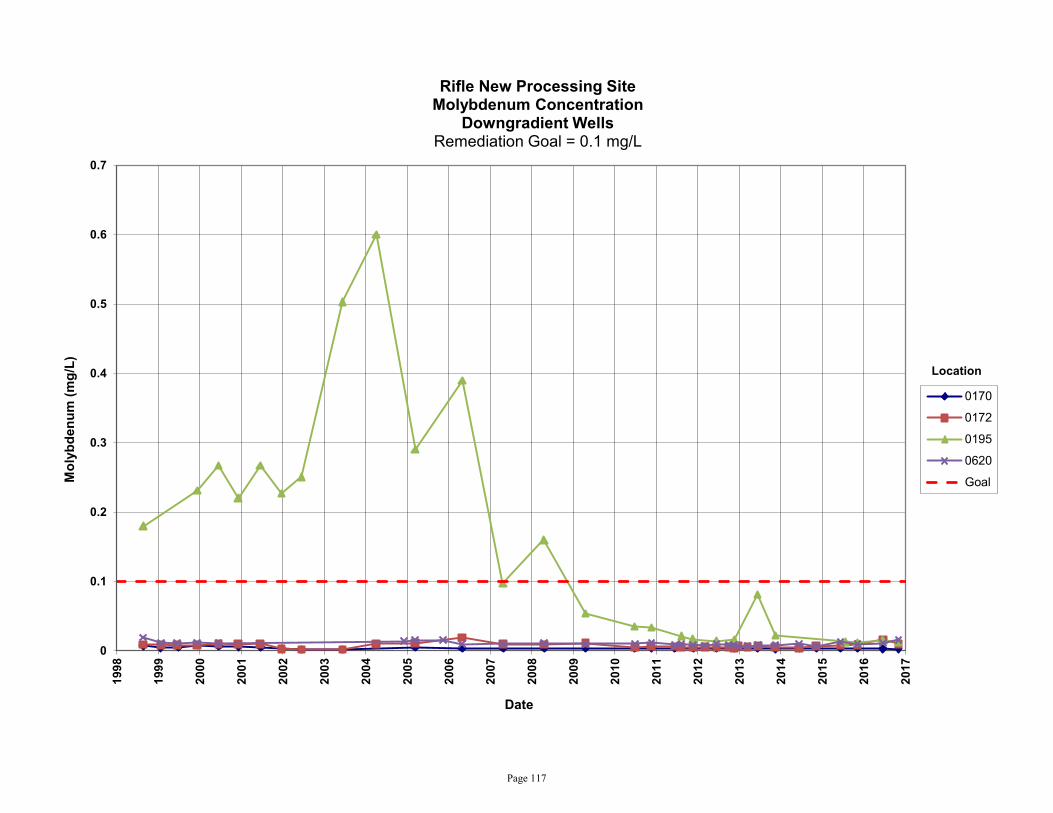
Page 117
0
0.1
0.2
0.3
0.4
0.5
0.6
0.7
1998
1999
2000
2001
2002
2003
2004
2005
2006
2007
2008
2009
2010
2011
2012
2013
2014
2015
2016
2017
Mol
ybde
num
(mg/
L)
Date
Rifle New Processing Site Molybdenum Concentration
Downgradient Wells Remediation Goal = 0.1 mg/L
0170
0172
0195
0620
Goal
Location

Page 118
0
10
20
30
40
50
60
70
80
2004
2005
2006
2007
2008
2009
2010
2011
2012
2013
2014
2015
2016
2017
Nitr
ate
+ N
itrite
as
Nitr
ogen
(mg/
L)
Date
Rifle New Processing Site Nitrate + Nitrite as Nitrogen Concentration
Downgradient Wells Remediation Goal = 10 mg/L
0170
0172
0195
0620
Goal
Location

Page 119
0
0.01
0.02
0.03
0.04
0.05
1998
1999
2000
2001
2002
2003
2004
2005
2006
2007
2008
2009
2010
2011
2012
2013
2014
2015
2016
2017
Sele
nium
(mg/
L)
Date
Rifle New Processing Site Selenium Concentration
Downgradient Wells Remediation Goal = 0.036 mg/L
0170
0172
0195
0620
Goal
Location

Page 120
0
0.02
0.04
0.06
0.08
0.1
0.12
0.14
0.16
0.18
0.2
1998
1999
2000
2001
2002
2003
2004
2005
2006
2007
2008
2009
2010
2011
2012
2013
2014
2015
2016
2017
Ura
nium
(mg/
L)
Date
Rifle New Processing Site Uranium Concentration
Downgradient Wells Remediation Goal = 0.067 mg/L
0170
0172
0195
0620
Goal
Location

Page 121
0
0.005
0.01
0.015
0.02
1998
1999
2000
2001
2002
2003
2004
2005
2006
2007
2008
2009
2010
2011
2012
2013
2014
2015
2016
2017
Vana
dium
(mg/
L)
Date
Rifle New Processing Site Vanadium Concentration
Downgradient Wells Alternate Concentration Limit = 50 mg/L
0170
0172
0195
0620
Limit
Location

Page 122
This page intentionally left blank

Page 123
Time-Concentration Graphs
Old Rifle Groundwater

Page 124
This page intentionally left blank

Page 125
0
0.02
0.04
0.06
0.08
0.1
0.12
0.14
1998
1999
2000
2001
2002
2003
2004
2005
2006
2007
2008
2009
2010
2011
2012
2013
2014
2015
2016
2017
Sele
nium
(mg/
L)
Date
Rifle Old Processing Site Selenium Concentration
Alternate Concentration Limit = 0.05 mg/L
0292A
0304
0305
0309
Limit
Location

Page 126
0
0.02
0.04
0.06
0.08
0.1
0.12
0.14
1998
1999
2000
2001
2002
2003
2004
2005
2006
2007
2008
2009
2010
2011
2012
2013
2014
2015
2016
2017
Sele
nium
(mg/
L)
Date
Rifle Old Processing Site Selenium Concentration
Alternate Concentration Limit = 0.05 mg/L
0310
0655
0656
0658
Limit
Location

Page 127
0
0.02
0.04
0.06
0.08
0.1
0.12
1998
1999
2000
2001
2002
2003
2004
2005
2006
2007
2008
2009
2010
2011
2012
2013
2014
2015
2016
2017
Ura
nium
(mg/
L)
Date
Rifle Old Processing Site Uranium Concentration
Cleanup Goal = 0.044 mg/L
0292A
0304
0305
0309
Goal
Location

Page 128
0
0.05
0.1
0.15
0.2
0.25
0.3
0.35
0.4
1998
1999
2000
2001
2002
2003
2004
2005
2006
2007
2008
2009
2010
2011
2012
2013
2014
2015
2016
2017
Ura
nium
(mg/
L)
Date
Rifle Old Processing Site Uranium Concentration
Cleanup Goal = 0.044 mg/L
0310
0655
0656
0658
Goal
Location

Page 129
0
0.2
0.4
0.6
0.8
1
1.2
1998
1999
2000
2001
2002
2003
2004
2005
2006
2007
2008
2009
2010
2011
2012
2013
2014
2015
2016
2017
Vana
dium
(mg/
L)
Date
Rifle Old Processing Site Vanadium Concentration
Alternate Concentration Limit = 1.0 mg/L
0292A
0304
0305
0309
Limit
Location

Page 130
0
0.2
0.4
0.6
0.8
1
1.2
1998
1999
2000
2001
2002
2003
2004
2005
2006
2007
2008
2009
2010
2011
2012
2013
2014
2015
2016
2017
Vana
dium
(mg/
L)
Date
Rifle Old Processing Site Vanadium Concentration
Alternate Concentration Limit = 1.0 mg/L
0310
0655
0656
0658
Limit
Location

Page 131
Attachment 4
Assessment of Anomalous Data

Page 132
This page intentionally left blank

Page 133
Potential Outliers Report

Page 134
This page intentionally left blank
Page 135
Potential Outliers Report Potential outliers are measurements that are extremely large or small relative to the rest of the data and, therefore, are suspected of misrepresenting the population from which they were collected. Potential outliers can result from transcription errors, data-coding errors, or measurement system problems. However, outliers can also represent true extreme values of a distribution and can indicate more variability in the population than was expected. Statistical outlier tests give probabilistic evidence that an extreme value does not “fit” with the distribution of the remainder of the data and is therefore a statistical outlier. These tests should only be used to identify data points that require further investigation. The tests alone cannot determine whether a statistical outlier should be discarded or corrected within a data set. There are three steps involved in identifying extreme values or outliers: 1. Identify extreme values that may be potential outliers. Do this by generating the Outliers
Report using the Sample Management System from data in the environmental database. The application compares the new data set (in standard environmental database units) with historical data and lists the new data that fall outside the historical data range. A determination is also made as to whether the data are normally distributed using the Shapiro-Wilk Test.
2. Apply the appropriate statistical test. Dixon's Test for extreme values is used to test for statistical outliers when the sample size is less than or equal to 25. This test considers both extreme values that are much smaller than the rest of the data (case 1) and extreme values that are much larger than the rest of the data (case 2). This test is valid only if the data without the suspected outlier are normally distributed. Rosner's Test is a parametric test that is used to detect outliers for sample sizes of 25 or more. This test also assumes that the data without the suspected outliers are normally distributed.
3. Scientifically review statistical outliers and decide on their disposition. The review should include an evaluation of any notable trends in the data that may indicate the outliers represent true extreme values.
Eleven laboratory results from the New Rifle site sampling event were identified as potential outliers. (See the Data Validation Outliers Reports, below.) Nitrate + nitrite as N at location RFN-0215 was not identified as an outlier but is considerably higher than historical values. The data associated with these results were reviewed in detail with no errors noted. The results for the New Rifle site sampling event are acceptable as qualified. None of the laboratory results from the Old Rifle site sampling event were identified as potential outliers. The results for the Old Rifle site sampling event are acceptable as qualified.

Page 136
This page intentionally left blank
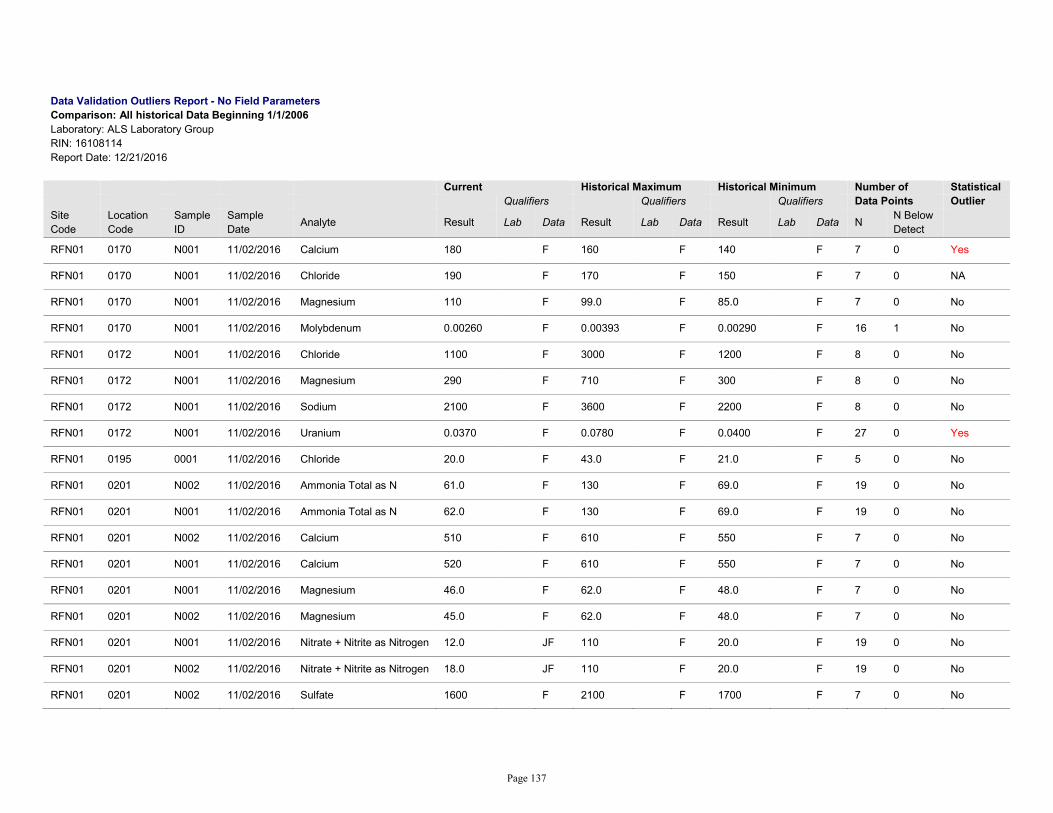
Page 137
Data Validation Outliers Report - No Field Parameters Comparison: All historical Data Beginning 1/1/2006 Laboratory: ALS Laboratory Group RIN: 16108114 Report Date: 12/21/2016 Current Historical Maximum Historical Minimum Number of Statistical Qualifiers Qualifiers Qualifiers Data Points Outlier Site Code
Location Code
Sample ID
Sample Date Analyte Result Lab Data Result Lab Data Result Lab Data N N Below
Detect
RFN01 0170 N001 11/02/2016 Calcium 180 F 160 F 140 F 7 0 Yes
RFN01 0170 N001 11/02/2016 Chloride 190 F 170 F 150 F 7 0 NA
RFN01 0170 N001 11/02/2016 Magnesium 110 F 99.0 F 85.0 F 7 0 No
RFN01 0170 N001 11/02/2016 Molybdenum 0.00260 F 0.00393 F 0.00290 F 16 1 No
RFN01 0172 N001 11/02/2016 Chloride 1100 F 3000 F 1200 F 8 0 No
RFN01 0172 N001 11/02/2016 Magnesium 290 F 710 F 300 F 8 0 No
RFN01 0172 N001 11/02/2016 Sodium 2100 F 3600 F 2200 F 8 0 No
RFN01 0172 N001 11/02/2016 Uranium 0.0370 F 0.0780 F 0.0400 F 27 0 Yes
RFN01 0195 0001 11/02/2016 Chloride 20.0 F 43.0 F 21.0 F 5 0 No
RFN01 0201 N002 11/02/2016 Ammonia Total as N 61.0 F 130 F 69.0 F 19 0 No
RFN01 0201 N001 11/02/2016 Ammonia Total as N 62.0 F 130 F 69.0 F 19 0 No
RFN01 0201 N002 11/02/2016 Calcium 510 F 610 F 550 F 7 0 No
RFN01 0201 N001 11/02/2016 Calcium 520 F 610 F 550 F 7 0 No
RFN01 0201 N001 11/02/2016 Magnesium 46.0 F 62.0 F 48.0 F 7 0 No
RFN01 0201 N002 11/02/2016 Magnesium 45.0 F 62.0 F 48.0 F 7 0 No
RFN01 0201 N001 11/02/2016 Nitrate + Nitrite as Nitrogen 12.0 JF 110 F 20.0 F 19 0 No
RFN01 0201 N002 11/02/2016 Nitrate + Nitrite as Nitrogen 18.0 JF 110 F 20.0 F 19 0 No
RFN01 0201 N002 11/02/2016 Sulfate 1600 F 2100 F 1700 F 7 0 No

Page 138
Data Validation Outliers Report - No Field Parameters Comparison: All historical Data Beginning 1/1/2006 Laboratory: ALS Laboratory Group RIN: 16108114 Report Date: 12/21/2016 Current Historical Maximum Historical Minimum Number of Statistical Qualifiers Qualifiers Qualifiers Data Points Outlier Site Code
Location Code
Sample ID
Sample Date Analyte Result Lab Data Result Lab Data Result Lab Data N N Below
Detect
RFN01 0215 N001 11/02/2016 Nitrate + Nitrite as Nitrogen 7.10 F 0.420 J UF 0.01000 U F 19 7 NA
RFN01 0215 N001 11/02/2016 Potassium 7.30 F 6.40 F 3.70 F 9 0 No
RFN01 0215 N001 11/02/2016 Sodium 210 F 120 F 89.0 F 9 0 Yes
RFN01 0215 N001 11/02/2016 Sulfate 340 F 250 F 140 F 9 0 No
RFN01 0216 N002 10/31/2016 Calcium 93.0 F 87.0 F 58.0 F 9 0 No
RFN01 0216 N001 10/31/2016 Calcium 94.0 F 87.0 F 58.0 F 9 0 No
RFN01 0216 N001 10/31/2016 Sodium 160 F 130 F 74.0 F 9 0 No
RFN01 0216 N002 10/31/2016 Sodium 160 F 130 F 74.0 F 9 0 No
RFN01 0216 N002 10/31/2016 Sulfate 260 F 210 F 100.0 F 9 0 NA
RFN01 0216 N001 10/31/2016 Sulfate 270 F 210 F 100.0 F 9 0 NA
RFN01 0217 N001 11/02/2016 Selenium 0.00420 F 0.211 N F 0.00477 B F 15 0 No
RFN01 0217 N001 11/02/2016 Sulfate 1700 F 1600 F 1500 F 7 0 NA
RFN01 0320 N001 11/01/2016 Selenium 0.00200 0.0330 0.00360 12 0 No
RFN01 0322 N001 11/01/2016 Molybdenum 0.0110 0.00910 0.00130 J 14 2 No
RFN01 0323 N001 11/01/2016 Ammonia Total as N 14.0 42.0 15.0 20 0 No
RFN01 0323 N001 11/01/2016 Nitrate + Nitrite as Nitrogen 5.00 130 15.0 19 0 No
RFN01 0323 N001 11/01/2016 Vanadium 0.00240 J 0.00640 0.00270 20 3 No
RFN01 0324 N001 11/02/2016 Chloride 200 190 20.0 5 0 No

Page 139
Data Validation Outliers Report - No Field Parameters Comparison: All historical Data Beginning 1/1/2006 Laboratory: ALS Laboratory Group RIN: 16108114 Report Date: 12/21/2016 Current Historical Maximum Historical Minimum Number of Statistical Qualifiers Qualifiers Qualifiers Data Points Outlier Site Code
Location Code
Sample ID
Sample Date Analyte Result Lab Data Result Lab Data Result Lab Data N N Below
Detect
RFN01 0324 N001 11/02/2016 Magnesium 15.0 14.0 5.30 5 0 No
RFN01 0324 N001 11/02/2016 Potassium 4.20 3.80 1.20 5 0 No
RFN01 0324 N001 11/02/2016 Sodium 130 110 16.0 5 0 No
RFN01 0452 N001 11/01/2016 Calcium 690 640 310 5 0 No
RFN01 0452 N001 11/01/2016 Chloride 770 390 J 250 5 0 Yes
RFN01 0452 N001 11/01/2016 Magnesium 110 61.0 45.0 5 0 Yes
RFN01 0452 N001 11/01/2016 Potassium 58.0 35.0 26.0 5 0 Yes
RFN01 0452 N001 11/01/2016 Sodium 830 400 270 5 0 Yes
RFN01 0453 N001 11/01/2016 Ammonia Total as N 3.10 120 4.60 14 0 No
RFN01 0453 N001 11/01/2016 Chloride 440 330 J 260 5 0 No
RFN01 0453 N001 11/01/2016 Magnesium 59.0 51.0 41.0 5 0 No
RFN01 0453 N001 11/01/2016 Sodium 480 360 290 5 0 No
RFN01 0575 N001 11/01/2016 Calcium 500 410 210 7 0 Yes
RFN01 0575 N001 11/01/2016 Chloride 680 570 320 7 0 Yes
RFN01 0575 N001 11/01/2016 Magnesium 300 270 200 7 0 Yes
RFN01 0575 N001 11/01/2016 Potassium 80.0 74.0 41.0 7 0 No
RFN01 0575 N001 11/01/2016 Sodium 1400 1100 610 7 0 NA
RFN01 0575 N001 11/01/2016 Sulfate 4800 3900 990 10 0 No

Page 140
Data Validation Outliers Report - No Field Parameters Comparison: All historical Data Beginning 1/1/2006 Laboratory: ALS Laboratory Group RIN: 16108114 Report Date: 12/21/2016 Current Historical Maximum Historical Minimum Number of Statistical Qualifiers Qualifiers Qualifiers Data Points Outlier Site Code
Location Code
Sample ID
Sample Date Analyte Result Lab Data Result Lab Data Result Lab Data N N Below
Detect
RFN01 0590 N001 11/01/2016 Nitrate + Nitrite as Nitrogen 2.50 F 80.0 F 3.60 F 17 0 No
RFN01 0590 N001 11/01/2016 Selenium 0.0160 F 0.0700 F 0.0240 F 15 0 No
RFN01 0620 N001 11/02/2016 Calcium 410 F 400 F 340 F 9 0 No
RFN01 0620 N001 11/02/2016 Chloride 1600 F 1400 F 550 F 9 0 No
RFN01 0620 N001 11/02/2016 Molybdenum 0.0160 F 0.0130 F 0.00680 F 24 0 Yes
RFN01 0620 N001 11/02/2016 Nitrate + Nitrite as Nitrogen 8.50 F 72.5 F 11.0 F 19 0 No
RFN01 0620 N001 11/02/2016 Vanadium 0.00300 F 0.00270 F 0.001 U F 15 3 No
RFN01 0635 N001 11/01/2016 Ammonia Total as N 54.0 F 160 F 62.0 F 12 0 No
RFN01 0658 N001 11/01/2016 Calcium 520 F 490 F 370 F 6 0 No
RFN01 0658 N001 11/01/2016 Sodium 200 F 190 F 150 F 6 0 No
RFN01 0658 N001 11/01/2016 Sulfate 1500 F 1400 F 1000 F 6 0 No
RFN01 0664 N001 10/31/2016 Calcium 140 F 280 FQ 150 F 6 0 NA
RFN01 0664 N001 10/31/2016 Chloride 140 F 130 F 70.0 FQ 6 0 NA
RFN01 0664 N001 10/31/2016 Sulfate 570 F 870 FQ 620 F 6 0 No
RFN01 0664 N001 10/31/2016 Uranium 0.0470 F 0.0880 F 0.0490 F 25 0 No
RFN01 0669 N001 11/01/2016 Arsenic 0.00960 QF 0.00840 FQ 0.00290 FQ 15 0 No
RFN01 0669 N001 11/01/2016 Calcium 210 QF 530 FQ 250 FQ 7 0 No
RFN01 0669 N001 11/01/2016 Chloride 160 QF 150 F 120 FQ 7 0 No

Page 141
Data Validation Outliers Report - No Field Parameters Comparison: All historical Data Beginning 1/1/2006 Laboratory: ALS Laboratory Group RIN: 16108114 Report Date: 12/21/2016 Current Historical Maximum Historical Minimum Number of Statistical Qualifiers Qualifiers Qualifiers Data Points Outlier Site Code
Location Code
Sample ID
Sample Date Analyte Result Lab Data Result Lab Data Result Lab Data N N Below
Detect
RFN01 0669 N001 11/01/2016 Molybdenum 0.520 QF 1.80 FQ 0.530 FQ 17 0 No
RFN01 0669 N001 11/01/2016 Selenium 0.0480 QF 0.0370 FQ 0.00350 15 0 No
RFN01 0669 N001 11/01/2016 Sulfate 690 QF 1700 FQ 810 FQ 7 0 No
RFN01 0670 N001 10/31/2016 Chloride 150 QF 130 F 110 F 6 0 NA
RFN01 0670 N001 10/31/2016 Uranium 0.0530 QF 0.290 FQ 0.0600 F 16 0 NA
RFN01 0855 N001 11/01/2016 Arsenic 0.140 F 2.20 FQ 0.150 F 19 0 No
RFN01 0855 N001 11/01/2016 Calcium 190 F 780 FQ 200 F 10 0 No
RFN01 0855 N001 11/01/2016 Molybdenum 0.330 F 18.0 FQ 0.380 F 19 0 NA
RFN01 0855 N001 11/01/2016 Sodium 220 F 210 F 160 F 10 0 No
RFN01 0855 N001 11/01/2016 Sulfate 630 F 1500 FQ 670 F 10 0 No
RFN01 0855 N001 11/01/2016 Vanadium 9.00 F 1600 9.40 F 23 0 NA
STATISTICAL TESTS: The distribution of the data is tested for normality or lognormality using the Shapiro-Wilk Test Outliers are identified using Dixon's Test when there are 25 or fewer data points. Outliers are identified using Rosner's Test when there are 26 or more data points. See Data Quality Assessment: Statistical Methods for Practitioners, EPA QC/G-9S, February 2006. NA: Data are not normally or lognormally distributed.

Page 142
Data Validation Outliers Report - No Field Parameters Comparison: All historical Data Beginning 1/1/2006 Laboratory: ALS Laboratory Group RIN: 16108115 Report Date: 12/21/2016 Current Historical Maximum Historical Minimum Number of Statistical Qualifiers Qualifiers Qualifiers Data Points Outlier Site Code
Location Code
Sample ID
Sample Date Analyte Result Lab Data Result Lab Data Result Lab Data N N Below
Detect
RFO01 0292A N001 11/01/2016 Sulfate 930 F 820 JF 480 F 15 0 No
RFO01 0304 N001 10/31/2016 Magnesium 100.0 F 98.0 F 48.8 F 19 0 No
RFO01 0305 N001 10/31/2016 Chloride 340 F 330 F 120 F 15 0 No
RFO01 0310 N002 10/31/2016 Uranium 0.150 F 0.290 F 0.160 F 29 0 No
RFO01 0310 N001 10/31/2016 Uranium 0.150 F 0.290 F 0.160 F 29 0 No
RFO01 0310 N001 10/31/2016 Vanadium 0.00790 F 0.0140 F 0.00806 B JF 29 0 No
RFO01 0310 N002 10/31/2016 Vanadium 0.00800 F 0.0140 F 0.00806 B JF 29 0 No
RFO01 0395 N001 11/01/2016 Selenium 0.00066 U 0.01000 0.00093 18 0 No
RFO01 0395 N001 11/01/2016 Sodium 90.0 84.0 62.0 14 0 No
RFO01 0395 N001 11/01/2016 Uranium 0.0150 0.0420 0.0190 18 0 No
RFO01 0395 N001 11/01/2016 Vanadium 0.00083 J 0.00510 0.00098 18 1 No
RFO01 0396 N001 11/02/2016 Calcium 71.0 69.0 25.0 14 0 No
RFO01 0396 N001 11/02/2016 Chloride 190 180 J 16.0 14 0 No
RFO01 0396 N001 11/02/2016 Magnesium 15.0 14.0 4.50 14 0 No
RFO01 0396 N001 11/02/2016 Sodium 130 120 13.0 14 0 No
RFO01 0398 N001 10/31/2016 Vanadium 0.00250 J 0.00820 0.00282 B 26 3 No
RFO01 0741 N001 11/02/2016 Chloride 190 180 2.00 U 14 1 No
RFO01 0741 N001 11/02/2016 Sodium 130 120 13.0 14 0 No
STATISTICAL TESTS: The distribution of the data is tested for normality or lognormality using the Shapiro-Wilk Test Outliers are identified using Dixon's Test when there are 25 or fewer data points. Outliers are identified using Rosner's Test when there are 26 or more data points. See Data Quality Assessment: Statistical Methods for Practitioners, EPA QC/G-9S, February 2006.


