JLBC Staff Report – October 12, 2017 Revenue and Budget Update 1 Summary of the General Fund Budget Outlook • The October Baseline estimate provides an updated forecast of General Fund revenues and statutory spending through Fiscal Year (FY) 2021. • The preliminary FY 2018 beginning balance is projected to be $150 million, compared to a budgeted level of $171 million. The decline is due to slower than expected revenue growth in FY 2017. • Over the next 2 years, gross revenue growth is projected to remain near 4%. After adjusting for tax reductions and one-time revenue, net growth would be 1.5% in FY 2018 and 3.3% in FY 2019. • FY 2019 Baseline spending is expected to grow $226 million. K-12 and Medicaid formula funding would increase by $307 million and be offset by the elimination of $(90) million in one-time spending. • The FY 2018 ending cash balance is currently projected to be a shortfall of $(24) million. The FY 2019 cash shortfall is expected to grow to $(80) million. • Year to date, the FY 2018 revenue signals have been mixed. A slight uptick in growth would eliminate these shortfall estimates. • Even if that were to occur, the gains are unlikely to be significant enough to generate sufficient capacity for substantial discretionary initiatives in the FY 2019 budget. • By FY 2021, the state’s fiscal position is forecast to return to a positive cash balance approaching $290 million. The underlying assumptions, however, make this scenario unlikely. The State’s Level of Reserves The projected FY 2018 shortfall is not surprising since the state only budgeted an ending balance of $38 million. This balance represented approximately 0.4% of the state’s projected revenues. Any small forecast error can easily push the state’s budget into the red. The state’s reserves also include approximately $460 million in the Budget Stabilization Fund (BSF). By itself, that level would be 4.6% of state revenues. Financial analysts typically recommend that these balances be at least 5% and potentially higher than 10%. In rating financial capacity, Standard and Poor’s (S&P) recommends that states strive for an 8% reserve. Moodys believes that reserves of at least 10% are a characteristic of an Aaa-rated entity (although achieving that reserve level does not in and of itself guarantee an Aaa rating). The level of reserves should also be viewed in the context of a state’s particular level of risk. In Arizona, there are uncertainties surrounding both the economic forecast as well as outstanding litigation. JLBC Staff - October 2017 Revenue and Budget Update
Transcript
JLBC Staff Report – October 12, 2017 Revenue and Budget Update 1
Summary of the General Fund Budget Outlook • The October Baseline estimate provides an updated forecast of General Fund revenues and
statutory spending through Fiscal Year (FY) 2021. • The preliminary FY 2018 beginning balance is projected to be $150 million, compared to a
budgeted level of $171 million. The decline is due to slower than expected revenue growth in FY 2017.
• Over the next 2 years, gross revenue growth is projected to remain near 4%. After adjusting for tax reductions and one-time revenue, net growth would be 1.5% in FY 2018 and 3.3% in FY 2019.
• FY 2019 Baseline spending is expected to grow $226 million. K-12 and Medicaid formula funding would increase by $307 million and be offset by the elimination of $(90) million in one-time spending.
• The FY 2018 ending cash balance is currently projected to be a shortfall of $(24) million. The FY 2019 cash shortfall is expected to grow to $(80) million.
• Year to date, the FY 2018 revenue signals have been mixed. A slight uptick in growth would eliminate these shortfall estimates.
• Even if that were to occur, the gains are unlikely to be significant enough to generate sufficient capacity for substantial discretionary initiatives in the FY 2019 budget.
• By FY 2021, the state’s fiscal position is forecast to return to a positive cash balance approaching $290 million. The underlying assumptions, however, make this scenario unlikely.
The State’s Level of Reserves The projected FY 2018 shortfall is not surprising since the state only budgeted an ending balance of $38 million. This balance represented approximately 0.4% of the state’s projected revenues. Any small forecast error can easily push the state’s budget into the red. The state’s reserves also include approximately $460 million in the Budget Stabilization Fund (BSF). By itself, that level would be 4.6% of state revenues. Financial analysts typically recommend that these balances be at least 5% and potentially higher than 10%. In rating financial capacity, Standard and Poor’s (S&P) recommends that states strive for an 8% reserve. Moodys believes that reserves of at least 10% are a characteristic of an Aaa-rated entity (although achieving that reserve level does not in and of itself guarantee an Aaa rating). The level of reserves should also be viewed in the context of a state’s particular level of risk. In Arizona, there are uncertainties surrounding both the economic forecast as well as outstanding litigation.
JLBC Staff - October 2017 Revenue and Budget Update
JLBC Staff Report – October 12, 2017 Revenue and Budget Update 2
Forecast Risks The October Update is associated with a number of forecast risks that could either increase or decrease the projected budget balances. Even small changes can have significant impacts on the budget as a 1% forecast error over 3 years would revise the ending balance by $635 million.
Potential Gains • If implemented, lower federal taxes and fewer regulations could result in greater capital
spending and stronger productivity gains. • Stronger economic growth at the national level would also benefit the Arizona economy
and revenue collections. Potential Gain or Loss
• Changes to federal tax policies have state conformity implications. As a result, depending on the specific federal tax changes that are adopted and the extent to which the state conforms to these changes, Arizona could either gain or lose state revenue. Potential Losses
• The current economic expansion has lasted for 100 months. The average post-1982 expansion is 95 months and the longest is 120 months. The 120-month mark would be reached at the end of FY 2019.
• Lack of progress in Washington with respect to tax and regulatory policies could harm business and consumer confidence.
• Monetary policy errors by the Federal Reserve Board could “derail” the U.S. economy. Forecast Risks – Litigation In addition to economic factors, pending litigation may result in significant impacts to future budgets:
• If the Arizona Supreme Court rules that the Medicaid hospital assessment required a two-thirds vote, it would cost about $290 million General Fund yearly to replace the assessment.
• A Superior Court judge has ruled that the Arizona Sports and Tourism Authority’s car rental tax should have been limited to transportation uses rather than for stadium subsidies and other purposes. The court also ruled that the state is liable for the repayment. The ruling, if upheld, would cost about $150 million in one-time monies.
• The state is currently being sued in federal court over inadequate services to foster care children. No ruling has been issued, however, and it is too early to estimate a potential cost.
• School districts have sued the state to increase its level of K-12 capital funding. As this lawsuit was only filed in May 2017, it may take a considerable time to resolve.
JLBC Staff Report – October 12, 2017 Revenue and Budget Update 3
Reporting Requirements The FY 2018 General Appropriation Act requires JLBC Staff to report by October 15, 2017 as to whether FY 2018’s General Fund revenues and ending balance are projected to change by more than $50 million from the budgeted levels. The FY 2018 projected ending balance is now $(24) million, or $(62) million lower than the budgeted $38 million level. In addition, A.R.S. § 35-125 requires the Legislature to provide 3-year estimates in each year’s budget bill. In fulfilling these requirements, the JLBC Staff has reviewed the preliminary FY 2017 ending balance estimates and updated its 4-sector revenue projections in conjunction with the October 12th FAC meeting. (See Attachment A). In addition, the JLBC Staff has revised its spending projections through FY 2021 based on current statutory funding formulas. Updated FY 2017 Estimates The enacted budget projected the FY 2017 ending balance to be $171 million. Mostly due to lower than expected revenue collections, the FY 2017 ending balance is preliminarily estimated to be $150 million. The $(21) million net loss in the ending balance estimate was due to $(19) million of lower than projected revenues, along with a $2 million loss from higher than expected spending. The Arizona Department of Administration is required by law to publish a final FY 2017 ending balance figure by December 1. Excluding the state’s beginning cash balance and one-time revenues, FY 2017 net revenues grew by 1.5% rather than the budgeted increase of 1.7%, which translated into the revenue shortfall of $(19) million. While total FY 2017 revenue collections were just below the budget forecast, the results in the state’s revenue categories varied significantly. Sales Tax posted the largest forecast gain, coming in at $55 million above forecast. The state’s revenue results were also helped by a $12 million forecast overage in Individual Income Tax, along with gains in smaller categories such as Lottery collections. In contrast, however, Corporate Income Tax collections fell by (36)% and were $(52) million below forecast. The state also saw losses in the Insurance Premium Tax category ($11 million) and in other miscellaneous revenue categories. Table 1 displays the performance of these revenue categories as compared to the enacted forecast.
Table 1 FY 2017 Revenue Growth Rates by Category
Budgeted
Actual
Above Forecast
Sales/TPT 3.2% 4.5% $55 M Individual Income 3.8% 4.1% $12 M Corporate Income (26.3)% (35.5)% $(52) M Insurance Premium 5.1% 2.8% $(11) M
JLBC Staff Report – October 12, 2017 Revenue and Budget Update 4
Sales Tax The Sales Tax category increased by 4.5% in FY 2017 and ended up $55 million above the enacted budget forecast. However, most of the FY 2017 forecast overage in this revenue category occurred for technical reasons. Large taxpayers are required to make an advance payment in June, which then is credited against their tax liability in July. The advance June payment (commonly referred to as “estimated payment”) was unexpectedly large this year, which resulted in a surge of collections at the end of FY 2017. The FY 2017 sales tax growth rate after adjusting for the June advance payments was 3.8%. Although the state’s sales tax is levied under 16 different business classifications, approximately half of total tax revenue is collected from retail businesses. By historical standards, the retail category performed poorly in FY 2017. Collections from retail sales increased by 3.7% in FY 2017, the slowest growth rate since the end of the Great Recession. According to a recent report by the Rockefeller Institute of Government (“Volatility in State Tax Revenues; Mounting Fiscal Uncertainties”), consumers have become more cautious in their discretionary spending habits in the period following the Great Recession. Lower wage growth and less reliance on debt-fueled spending are some of the factors behind this change. The closures of many department stores and other apparel stores across the country, including Arizona, have not only adversely affected retail employment, but likely also resulted in a further shift to online sales. The Rockefeller report suggests that the weakness in sales tax collections experienced in many states, including Arizona, “is at least partially attributable to tax dollars owed, but not collected, from online sales.” Apart from the shift from traditional “brick-and-mortar” stores to online sales, individuals are increasingly spending more of their disposable income on services rather than goods. In Arizona like most other states, services are generally not subject to sales tax. To provide some perspective, 25.9% of Arizona personal income was spent on taxable retail goods in 2006. This figure has trended down over time and was 22.4% in 2016, the most recent year for which complete state personal income data is available. While the (3.5)% reduction of this ratio over the last decade may appear small, it has significant implications for sales tax collections as the following numerical exercise demonstrates. Taxable retail sales were $62.8 billion in 2016. As noted above, this figure represented 22.4% of Arizona personal income that year. However, if the ratio of taxable goods to personal income had remained at 25.9% instead, the level of retail taxable sales would have been $9.7 billion higher in 2016. In terms of sales tax collections, the state General Fund would have received an additional $360 million that year. To conclude, the slowdown in sales tax collections appears to be due to a combination of factors, including slower wage growth in the post-Great Recession era, a shift away from traditional retail sales to electronic commerce, as well as a long-term trend under which consumers are increasingly spending a larger share of their income on services rather than goods.
Individual Income Tax Individual Income Tax grew by 4.1% in FY 2017 and ended up $12 million above the enacted budget forecast. Most of this forecast overage is related to Individual Income Tax withholding, which grew by 5.6%, the fastest growth rate since FY 2011.
JLBC Staff Report – October 12, 2017 Revenue and Budget Update 5
A January 1, 2017 increase in the minimum wage to $10 an hour under Proposition 206 may have served to increase FY 2017 withholding collections. A portion of added minimum wage revenues, though, may ultimately be refunded in FY 2018, depending on the extent that minimum wage workers can reduce taxes owed with exemptions, deductions and credits. Individual Income Tax payments decreased (0.6)% during FY 2017, including a (3.0)% decrease in final payments. Another report from the Rockefeller Institute found that most states experienced reductions in final payments collections in the second half of FY 2017. Changes to final payments are often driven by investment income, including capital gains. The Rockefeller report suggests that a portion of the nationwide negative trend in payments reflects taxpayers deferring investment income, in anticipation of future federal income tax reductions. This may have served to lower payments associated with Tax Year (TY) 2016 income, which were due by April 2017. This explanation appears to be consistent with a (4.1)% year-over-year decrease in the state's April 2017 final payments. Capital gains were likely also affected by poor stock market performance during calendar year (CY) 2016. Growth in the S&P 500 slowed to 1.5% in CY 2016, from 6.8% in CY 2015.
Corporate Income Tax The state collected $368 million in corporate income taxes in FY 2017, which was a decline of (36)% over the prior year and the lowest amount collected since FY 2003. Net revenue came in $(52) million below forecast. State corporate income tax collections depend on several different factors, including underlying profitability, strategic taxpayer behavior, and changes to federal and state tax policy. Without access to corporate tax return data, however, it is difficult to determine the exact reasons for the large revenue decline in FY 2017. One of the reasons for the large decline in FY 2017 net collections was previously-enacted corporate tax reductions, most notably the 4-year phase-in rate reduction. However, recent data from the Rockefeller Institute suggests that lower corporate profits could also help to explain some of the revenue decline. Nationwide, state corporate income tax collections declined year-over-year for 6 consecutive quarters, beginning in the fourth quarter of CY 2015. Since many states did not provide corporate tax reductions during that time, the data suggests that underlying profitability may have been weak. Therefore, the (36)% decline in Arizona corporate income tax revenue was likely due to both previously-enacted tax reductions as well as lower corporate profits.
Insurance Premium Tax Insurance Premium Tax revenues grew 2.8% in FY 2017 and were $(11) million below the enacted budget forecast. The FY 2017 rate of growth was the lowest since FY 2013 and represented a significant slowdown from rates of 6.5% in FY 2014, 9.2% in FY 2015, and 9.1% in FY 2016. Collections from Medicaid contractors was the primary boost to revenues during those years, averaging annual growth of 17.1% from FY 2014 to FY 2016. Growth in Medicaid-related collections during those years was largely driven by the January 1, 2014 expansion of Medicaid coverage.
JLBC Staff Report – October 12, 2017 Revenue and Budget Update 6
The FY 2017 slowdown in insurance premium tax collections was primarily driven by low growth of 1.2% in collections from Medicaid contractors. A reduction in the tax rate for most non-health insurance premiums, from 2.0% CY 2015 to 1.95% in CY 2016, also contributed to the low growth of collections in FY 2017. FY 2018 - 1st Quarter The enacted FY 2018 budget assumed base revenue growth of 4.3% prior to tax law changes, urban revenue sharing and one-time adjustments. After adjusting for the new tax laws, the budgeted FY 2018 net revenue growth rate is 1.7%. Based on preliminary September projections, first quarter FY 2018 revenues are growing at a rate of 4.0% over last year (excluding urban revenue sharing and fund transfers). Collections through September are $17 million above the enacted FY 2018 budget forecast. Preliminary collections were as follows: % Change
• Sales Tax 5.3% • Individual Income Tax 5.4% • Corporate Income Tax (5.1)% • Insurance Premium Tax 4.2% • Other Revenues (33.9)%
Overall revenue growth was moderate during the first quarter of FY 2018, though, results have been mixed across categories. Sales tax growth of 5.3% year to date (YTD) represents a slight acceleration from growth of 4.5% in FY 2017. Withholding collections continue the FY 2017 trend of bolstering overall individual income tax revenues, having grown 5.3% YTD. Following its lowest year of growth since FY 2013, insurance premium tax collection growth has improved to 4.2% YTD. Corporate income tax collections declined (5.1)% YTD, though, this decrease is more moderate than in FY 2016 and FY 2017. The continued reductions in this category have likely been driven by the previously enacted phase-in of tax reductions. Reduced collections in other revenue categories have also limited statewide collections, though, this is partly due to timing issues. FY 2018 – FY 2021 Revenue Projections The FY 2018 – FY 2021 forecast is based on input from the following 4 sectors (each equally weighted): members of the Finance Advisory Committee (FAC) panel, University of Arizona’s “base” and “low” econometric revenue models, and JLBC Staff. The 4-sector forecast includes the 4 largest General Fund revenue categories, which are Sales Tax, Individual and Corporate Income Tax, and Insurance Premium Tax. The JLBC Staff forecasts the remaining small revenue categories, which make up 5% of General Fund revenue. Under the October 4-sector forecast, gross General Fund revenues are projected to grow by 4.1% in FY 2018. This rate is slightly lower than the 4.3% growth rate assumed in the FY 2018
JLBC Staff Report – October 12, 2017 Revenue and Budget Update 7
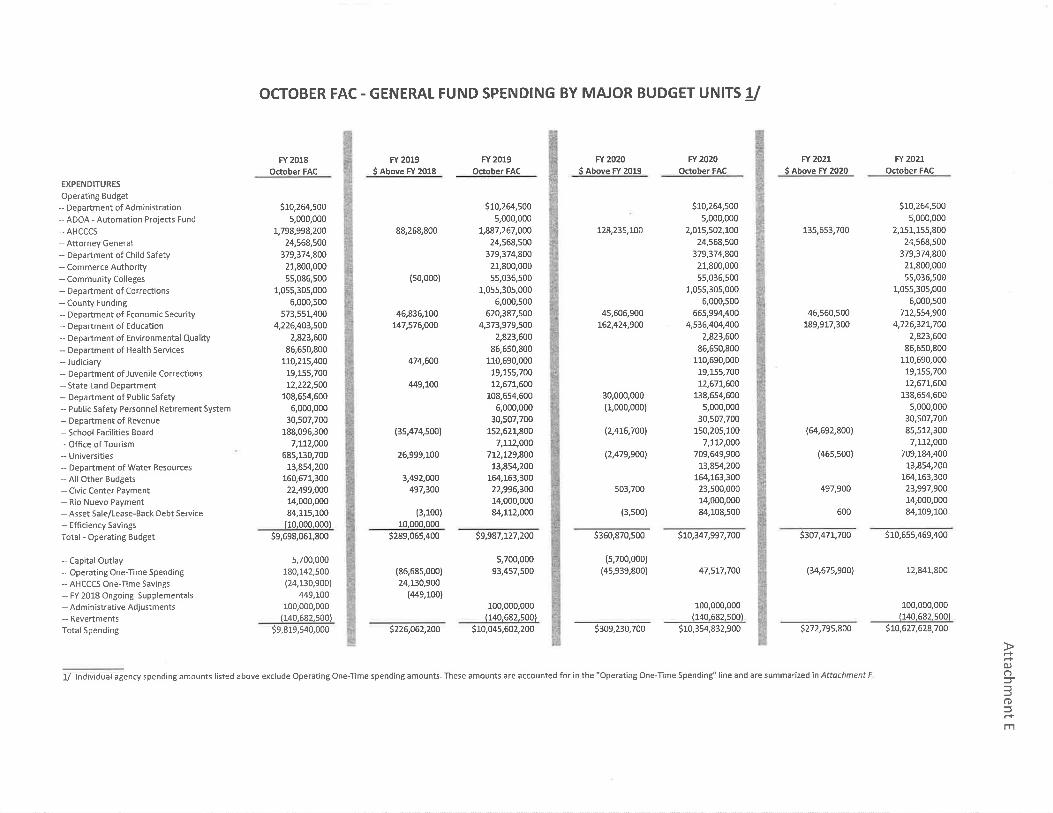
budget. The FY 2018 revenue forecast under the October 4-sector update is $(36) million lower than in the enacted budget. In FY 2019, the projected 4-sector gross revenue growth rate is 3.9%. The growth rate improves to 4.5% in FY 2020 and 4.6% in FY 2021. Details of the October 2017 4-sector forecast are summarized in Attachment B. In addition to the consensus forecast for base revenues, the budget projections also include adjustments for previously-enacted tax legislation. As shown in Attachment D, an estimated $(87.5) million in tax reductions will occur between FY 2019 and FY 2021. Most of these reductions are from the final phase-in of the corporate rate reductions and sales factor increase that began in TY 2014. Excluding the state’s beginning cash balance, total net General Fund revenue is expected to increase from $9.64 billion in FY 2018 to $9.96 billion in FY 2019. The projected FY 2020 and FY 2021 revenue estimates are $10.39 billion and $10.86 billion, respectively. Future Year Spending Estimates As part of the October FAC process, JLBC Staff has updated its FY 2018 – FY 2021 projection of Baseline spending. (See Attachment E). The Baseline reflects the projected spending changes associated with statutory and other active funding formulas. In addition, it reflects changes that were assumed in the FY 2018 enacted budget’s 3-year spending plan. Overall state spending is projected to increase by $226 million in FY 2019, or an increase of 2.3% over the prior year. This includes $351 million of caseload/statutory spending increases, which are partially offset by the elimination of one-time spending items and a reduction in School Facilities Board debt service requirements. Under the Baseline projections, spending is projected to grow by $309 million in FY 2020 (3.1% growth) and $273 million in FY 2020 (2.6% growth). FY 2018 spending remains close to the level of the enacted budget. The estimates incorporate the following specific adjustments: Statutory Formula Spending • K-12 state aid spending is projected to increase by $147 million in FY 2019, $162 million in
FY 2020 and $190 million in FY 2021. The growth reflects the following components: 1) 1.3% annual student growth each year; 2) new annual inflation adjustments of 1.76% for FY 2019 and 2.0% in both FY 2020 and FY 2021; and 3) additional property taxes from new construction.
• AHCCCS funding is projected to grow by $112 million in FY 2019. This adjustment is primarily based on 1.5% enrollment growth and 3.5% capitation rate growth. The increase
JLBC Staff Report – October 12, 2017 Revenue and Budget Update 8
also includes $22 million in state General Fund money to resume a federal health insurer fee in FY 2019, following a 1-year moratorium in FY 2018. In future years, AHCCCS spending is estimated to increase by $128 million in FY 2020 and $136 million in FY 2021.
• University spending is projected to grow by $27 million in FY 2019 as the state pays the first installment on a 25-year plan to support capital projects on all campuses.
• Department of Economic Security (DES) spending for the Developmental Disabilities (DD) program is projected to increase by $34 million in FY 2019, followed by increases of $46 million in FY 2020 and $47 million in FY 2021. These increases are based on: 1) formula assumptions of 4.5% enrollment growth and 3.5% capitation growth; 2) the transfer of funding for DD behavioral health services from AHCCCS to DES in anticipation of plans to fully integrate DD services in FY 2019; 3) the backfill of shortfalls in the DD state-only program for Medicaid-eligible clients to reflect the elimination of one-time DD equity monies from FY 2018; 4) funding for Proposition 206 rate adjustments to address scheduled increases in the minimum wage in calendar years 2018, 2019, and 2020; and 5) elimination of one-time funding for Proposition 206 costs and DD Room and Board from the FY 2018 budget.
• The Department of Corrections budget does not include an increase for FY 2019. The flat budget reflects the prison population having declined by (1.1)% in the last year. The department, however, is in the process of selecting a new vendor for a new inmate health care contract to start June 1, 2018. If the department agrees to a higher daily per diem for inmate health care under the new contract, there could be a need for additional monies.
• The Baseline projections assume the continued annual suspension of any inactive formulas. Each year, the Legislature enacts certain provisions that only suspend, not repeal, certain statutory formulas. If those inactive formulas were counted, spending would increase by approximately $513 million. K-12 accounts for most of the inactive formulas.
One-Time Spending/Expiring Statutory Provisions • As part of the FY 2018 budget 3-year spending plan, certain spending items were
designated as one-time and would not be funded in the FY 2019 Baseline. This one-time spending totaled $180 million, and with the exception of SFB new construction funding and several miscellaneous items, this spending is not continued in the FY 2019 Baseline estimates.
• The FY 2019 Baseline eliminates $90 million of the following one-time FY 2018 spending items: • $25 million for employer contributions to the State Employee Health Insurance Trust
Fund (HITF), which has declining reserves. • $17 million of School Facilities Board Building Renewal Grant funding. • $15 million of funding to the Universities, which was designed for use as either
operating or capital funding. • $12 million of DES funding for the Developmentally Disabled program, most of which
was used to offset the costs of Proposition 206.
JLBC Staff Report – October 12, 2017 Revenue and Budget Update 9
• $10 million of funding distributed to the counties. This funding was mostly designated to partially offset county contributions to the Department of Juvenile Corrections, along with a smaller portion allocated directly to Pinal, Yavapai and Mohave Counties.
• $7 million of funding to ADE for continued development of its computer system. Future Year Balance Projections As reported by the Department of Administration, the state ended FY 2017 with a $150 million cash balance. Combining this $150 million reserve, $8 million Moody’s settlement and projected FY 2018 revenues of $9.64 billion, results in total available resources of $9.80 billion. Compared to the FY 2018 estimated spending level of $9.82 billion translates into a projected FY 2018 cash shortfall of $(24) million. Based on the current FY 2019 projections of $9.97 billion of revenues and $10.05 billion of spending, FY 2019 is estimated to have a cash shortfall of $(80) million. Beginning in FY 2020, the state is projected to have a cash balance of $68 million. This balance is then expected to increase to $287 million in FY 2021. (See Table 2 and Attachment A.) These long-term estimates, however, represent an unlikely scenario due to several assumptions, including that no additional discretionary changes are made by the Legislature over the next 3 years (such as tax reductions or spending increases beyond the Baseline).
Table 2 Baseline Ending Balance Projections
Fiscal Year 18 19 20 21 Balance Forward/Other $ 0.16 B $ 0.00 B $ 0.00 B $ 0.00 B Ongoing Baseline Revenues 9.64 B 9.97 B 10.42 B 10.91 B Less: Ongoing Baseline Spending 9.66 B 9.95 B 10.31 B 10.61 B One-Time Spending 0.16 B 0.10 B 0.05 B 0.01 B
Cash Balance $(24) M* $(80) M* $68 M $287 M
Structural Balance $(20) M $19 M $115 M $300 M * The projected cash shortfalls are presumed to be solved as part of the FY 2019 budget process.
The long-term projections only account for statutory and funding formula growth. Over the last decade, the statutory share of state spending has remained near 67%. In other words, the state has historically spent one new discretionary dollar for every 2 new dollars of statutory growth. The Baseline also does not account for any new tax reductions beyond those already enacted. In addition, the Baseline makes no assumption about higher spending connected with pending litigation. On page 2, we outlined at least 4 different lawsuits that could have a notable effect if the plaintiffs are successful.
JLBC Staff Report – October 12, 2017 Revenue and Budget Update 10
Potential federal policy changes could also have state spending implications. For example, the recent proposed Graham-Cassidy health care legislation would have eliminated the federal funding formulas for both the Medicaid expansion and health insurance exchange populations. In return, the state would have received a block grant no longer linked to the number of recipients. While AHCCCS has a lower forecast of the impact, JLBC Staff’s preliminary FY 2020 estimate of the legislation would have been an annual loss in excess of $(1) billion in federal funding. If the efforts to “repeal and replace” the Affordable Care Act are successfully revived in the form of Graham-Cassidy, the state would have to decide how to address these issues.
* Represents ongoing revenue adjusted for small revenue categories ** Represents ongoing revenue adjusted for tax law changes; excludes Urban Revenue Sharing
October 12, 2017 FAC 4-Sector Consensus
Consensus Weighted Average: *
Attachment D
Legislation FY2018 FY2019 FY2020 FY2021Laws 2006, Chapters 14 & 325STO Credit for Low-Income Students (12.4) (14.9) 0.0 0.0
Laws 2011, 2nd Special Session, Chapter 1Phases down corporate tax rate from 6.968% to 4.9% over 4 years, beginning in TY 2014 (43.5) (32.1) 0.0 0.0 Phases in corporate sales factor from 80% to 100% over 4 years, beginning in TY 2014 (18.7) (11.6) 0.0 0.0
Sub-Total (62.2) (43.7) 0.0 0.0
Laws 2012, Chapter 343Creates a new income tax credit for capital investments in new or expanded manufacturing facilities, commercial headquarters, or research facilities (TY 2013)
(4.0) (2.8) 0.0 0.0
Laws 2015, Chapter 8 & Laws 2016, Chapter 117Ongoing Judiciary Fund Transfer to General Fund (2.0) 0.0 0.0 0.0
Laws 2015, Chapter 220 & Laws 2016, Chapter 358Phases Down Insurance Premium Tax Rate from 2.0% to 1.7% over 6 Years (4.1) (4.3) (4.7) (5.0)
Laws 2016, Chapter 118Increases state income tax deduction from 10% to 100% of federal bonus depreciation over 2 years, beginning in TY 2016
(8.0) 0.0 0.0 0.0
Laws 2016, Chapter 367Exempts aircraft and aircraft equipment operated by charter airlines from TPT (2.3) 0.0 0.0 0.0
Laws 2016, Chapter 374Modifies existing TPT exemption for electricity and natural gas purchased by manufacturing and smelting facilities
(12.2) 0.0 0.0 0.0
Laws 2017, Chapter 43Diverts NEMF assessment from General Fund to Other Funds (2.5) 0.0 0.0 0.0
Laws 2017, Chapter 278Provides income tax subtraction for ADA retrofits 0.0 (1.3) 0.0 0.0
Laws 2017, Chapter 281Increases year-end transfer cap of Captive Insurance Fund to General Fund (0.1) 0.0 0.0 0.0
Laws 2017, Chapter 299Increases personal exemption amount followed by inflation indexing (6.8) (6.7) 0.0 0.0
Laws 2017, Chapter 319Authorizes an additional $10 million in angel investment credits from FY 2018 to FY 2021 (0.8) (0.8) (0.8) 0.0
Laws 2017, Chapter 334Diverts real estate appraisal fee revenue from Board of Appraisals to General Fund 0.7 0.0 0.0 0.0Laws 2017, Chapter 319Modifies eligibility requirements for the new jobs tax credit and extends credit through FY 2025 0.0 (0.8) (0.9) (0.8)
Total General Fund Revenue Impact over Prior Year (117.2) (75.3) (6.4) (5.8)
1/ Each year represents the dollar value of the provision compared to the prior year.
October 2017 Revenue and Budget UpdateMarginal Dollar Impact of Enacted Tax Law Changes 1/


![10 5 09 Forecast Results Update[1]](https://static.documents.pub/doc/80x56/54974103b47959143a8b4574/10-5-09-forecast-results-update1.jpg)


