48
October 30, 2009 October 30, 2009 JLBC JLBC Government Finance Government Finance Officers Association of Officers Association of Arizona Arizona
| Date post: | 28-Dec-2015 |
| Category: |
Documents |
| Upload: | felix-pitts |
| View: | 217 times |
| Download: | 1 times |

October 30, 2009October 30, 2009
JLBCJLBC
Government Finance Officers Government Finance Officers Association of ArizonaAssociation of Arizona

2JLBCJLBC
Summary of PresentationSummary of Presentation
JLBC/FAC
Revenues – Current Year
Revenue Forecast
Other (non-GF) Revenue
Shortfall
Resources
3
6
12
34
39
48
Page #
3JLBCJLBC
• Established by statute in 1966.• 16 members – 8 from Senate and 8 from House.• Supported by Director and approximately 25
staff.• Primary duties are to make recommendations to
the legislature regarding the state budget, revenues and expenditures, future fiscal needs, and the organization and functions of state government.
Joint Legislative Budget Committee (JLBC)Joint Legislative Budget Committee (JLBC)

4JLBCJLBC
• Established by JLBC approximately 30 years ago.
• 15 members – economists and other financial experts with both business and academic backgrounds.
• Meets publicly at least 3 times a year.• Provides a neutral peer review of
economic and revenue forecasts.
Finance Advisory Committee (FAC)Finance Advisory Committee (FAC)

FY ’10 RevenuesFY ’10 Revenues

6JLBCJLBC
7.6% 6.4%
-6.4%
20.0%
6.9%
19.0%
11.3%
-18.2%
-4.6%
0.3%
-16.7%
-30%
-20%
-10%
0%
10%
20%
30%
'00 '01 '02 '03 '04 '05 '06 '07 '08 '09
Fiscal Year
Yea
r O
ver
Yea
r P
erce
nta
ge C
han
ge
Excludes statutory and one-time changes.
’’09 General Fund Base Revenue Decline of 09 General Fund Base Revenue Decline of (18.2)% Was Greater Than Budgeted(18.2)% Was Greater Than Budgeted - Represents Worst Two Year Loss in Modern Era- Represents Worst Two Year Loss in Modern Era
Budgeted
7JLBCJLBC
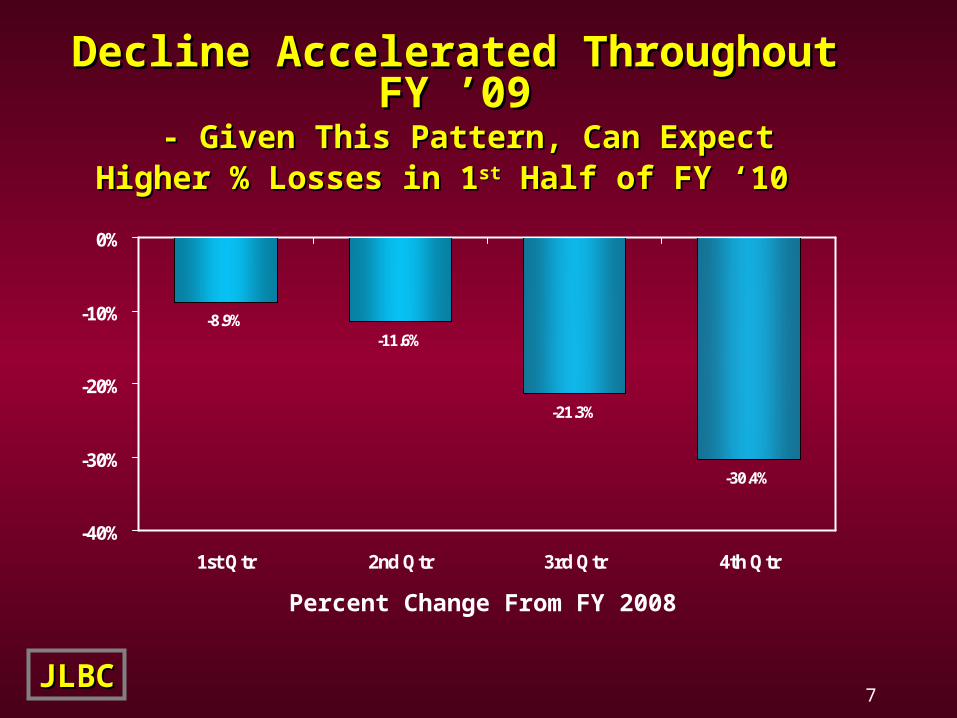
-30.4%
-8.9%-11.6%
-21.3%
-40%
-30%
-20%
-10%
0%
1st Qtr 2nd Qtr 3rd Qtr 4th Qtr
Percent Change From FY 2008
Decline Accelerated Throughout FY ’09Decline Accelerated Throughout FY ’09 - Given This Pattern, Can Expect- Given This Pattern, Can Expect
Higher % Losses in 1Higher % Losses in 1stst Half of FY ‘10 Half of FY ‘10

8JLBCJLBC
FY ’10 Revenues Will Need to Grow By FY ’10 Revenues Will Need to Grow By 0.9% to Meet $7.1 B Budgeted Level 0.9% to Meet $7.1 B Budgeted Level
• Enacted budget FY ’10 growth compared to enacted ’09 Budget
• Growth adjusted for lower ’09 Base
(0.9)%
0.9%

9JLBCJLBC
’’10 Revenue Collections Continuing to Decline10 Revenue Collections Continuing to Decline - 1- 1stst Quarter Decline = (16.1)% Quarter Decline = (16.1)%
• 1st quarter revenue shortfall = $(233) M
• September decline due primarily to low quarterly income tax collections
-10.5%
-12.7%
-23.0%
-30%
-20%
-10%
0%
Jul Aug Sep
10JLBCJLBC
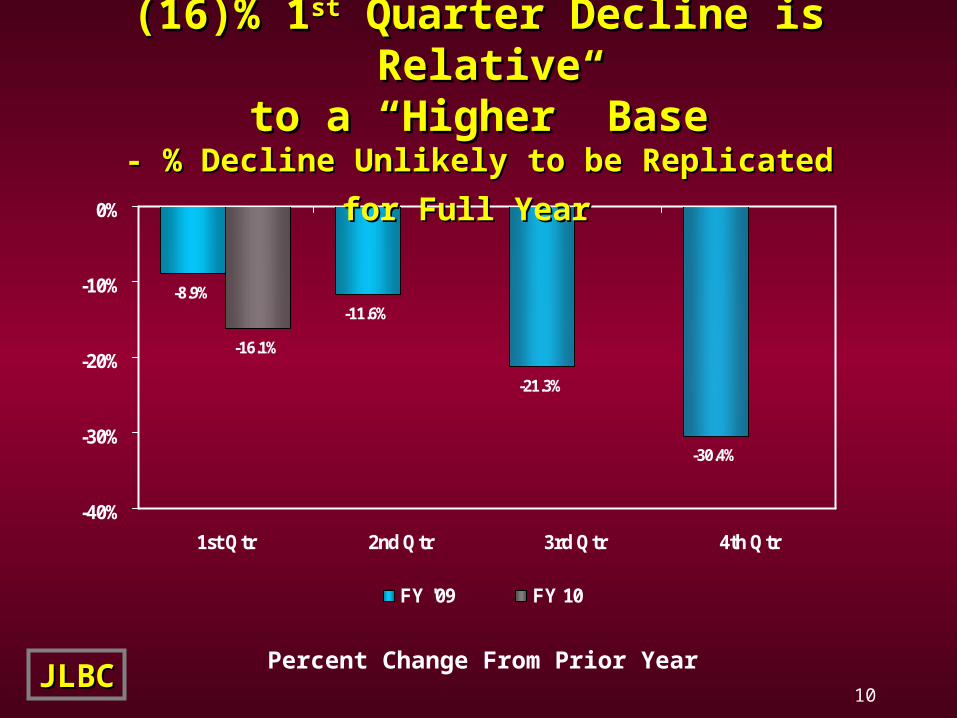
-30.4%
-16.1%
-8.9%-11.6%
-21.3%
-40%
-30%
-20%
-10%
0%
1st Qtr 2nd Qtr 3rd Qtr 4th Qtr
FY '09 FY 10
Percent Change From Prior Year
(16)% 1(16)% 1stst Quarter Decline is Relative Quarter Decline is Relativeto a “Higher” Baseto a “Higher” Base
- % Decline Unlikely to be Replicated for Full Year- % Decline Unlikely to be Replicated for Full Year

Revenue ForecastRevenue Forecast
12JLBCJLBC
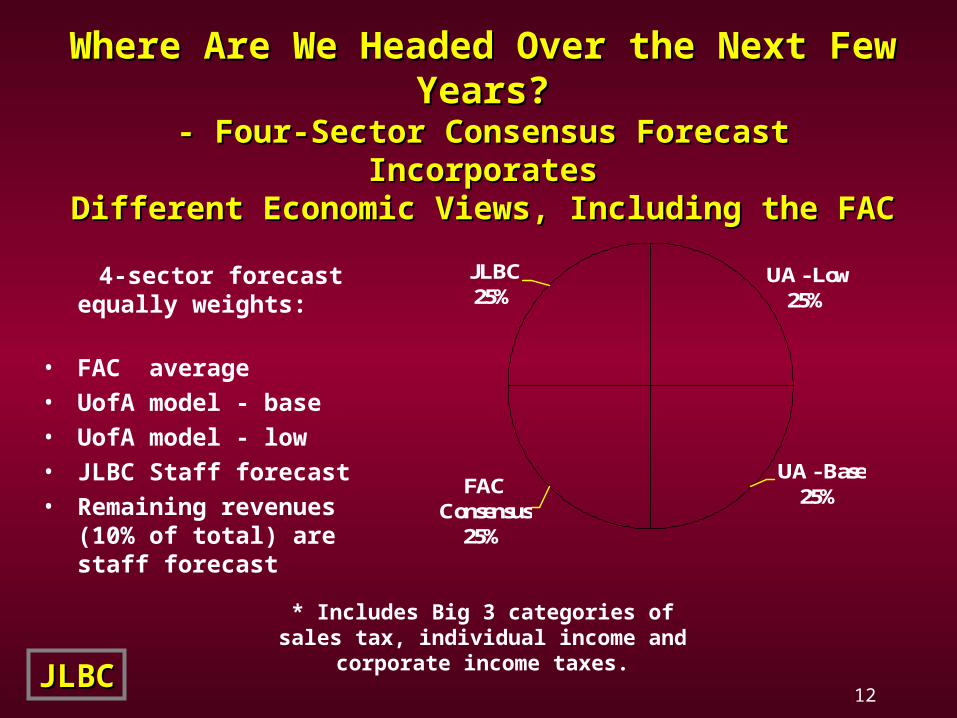
Where Are We Headed Over the Next Few Years?Where Are We Headed Over the Next Few Years?- Four-Sector Consensus Forecast Incorporates- Four-Sector Consensus Forecast IncorporatesDifferent Economic Views, Including the FACDifferent Economic Views, Including the FAC
JLBC25%
UA - Low25%
UA - Base25%FAC
Consensus25%
4-sector forecast equally weights:
• FAC average
• UofA model - base
• UofA model - low
• JLBC Staff forecast
• Remaining revenues (10% of total) are staff forecast
* Includes Big 3 categories of sales tax, individual income and corporate income taxes.

13JLBCJLBC
Consensus Forecasts (7.2)% Decline inConsensus Forecasts (7.2)% Decline inFY ’10, and 7.8% Growth in FY ‘11FY ’10, and 7.8% Growth in FY ‘11
- What Would Cause the Turnaround?- What Would Cause the Turnaround?
• National economic recovery is expected to pull the Arizona economy along
• Retail sales will increase as a result of some pent-up demand built up during the downturn
• Starting point of the recovery is so low in dollar terms that it may be relatively easy to generate positive growth

14JLBCJLBC
Sales TaxSales Tax- The Consensus Forecasts Decline of (7.7)% in FY ’10,- The Consensus Forecasts Decline of (7.7)% in FY ’10,
with Positive Growth Rates Beginning in FY ‘11with Positive Growth Rates Beginning in FY ‘11
FY 2009 Actual = $3.76 Billion
* 5.6% without the $(55.2) million estimated payment threshold change.
7.1% 7.3%
-3.5%
11.1%8.6%
-13.7%
16.7%
4.3*%1.2%0.6%
6.0%
-7.7%
-20%
-15%
-10%
-5%
0%
5%
10%
15%
20%
'02 '03 '04 '05 '06 '07 '08 '09 '10 '11 '12 '13
Fiscal Year
Yea
r O
ver
Yea
r %
Ch
ange
Actual Four-Sector Consensus
15JLBCJLBC
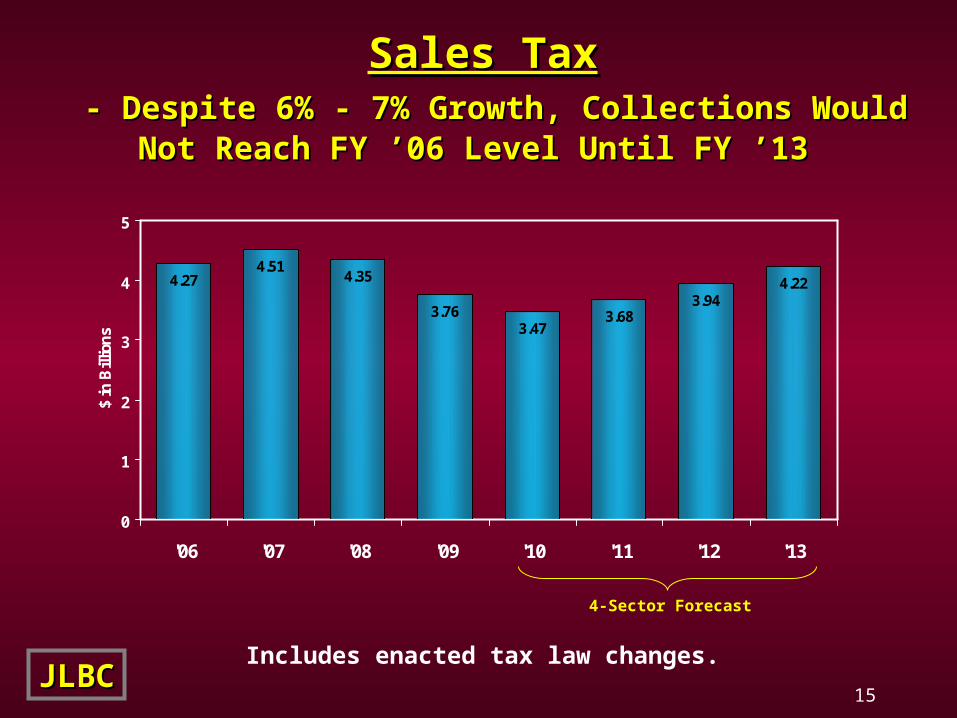
4.274.51
4.35
3.763.47
3.683.94
4.22
0
1
2
3
4
5
'06 '07 '08 '09 '10 '11 '12 '13
$ in
Bill
ion
s
Sales TaxSales Tax - Despite 6% - 7% Growth, Collections Would- Despite 6% - 7% Growth, Collections Would
Not Reach FY ’06 Level Until FY ’13 Not Reach FY ’06 Level Until FY ’13
Includes enacted tax law changes.
4-Sector Forecast

16JLBCJLBC
Sales Tax Collections Appear to Have StabilizedSales Tax Collections Appear to Have Stabilized - Second-Half Flat Growth Still Leads to Yearly Decline- Second-Half Flat Growth Still Leads to Yearly Decline
$0
$300
$600
$900
$1,200
$1,500
1st
2nd
3rd
4th 1s
t2n
d3r
d4t
h 1st
2nd
3rd
4th 1s
t2n
d3r
d4t
h
$ in
Mill
ion
s
FY 2007 FY 2008 FY 2009 FY 2010JLBC Forecast
3-Mo.Actual
Collections by Quarter
17JLBCJLBC
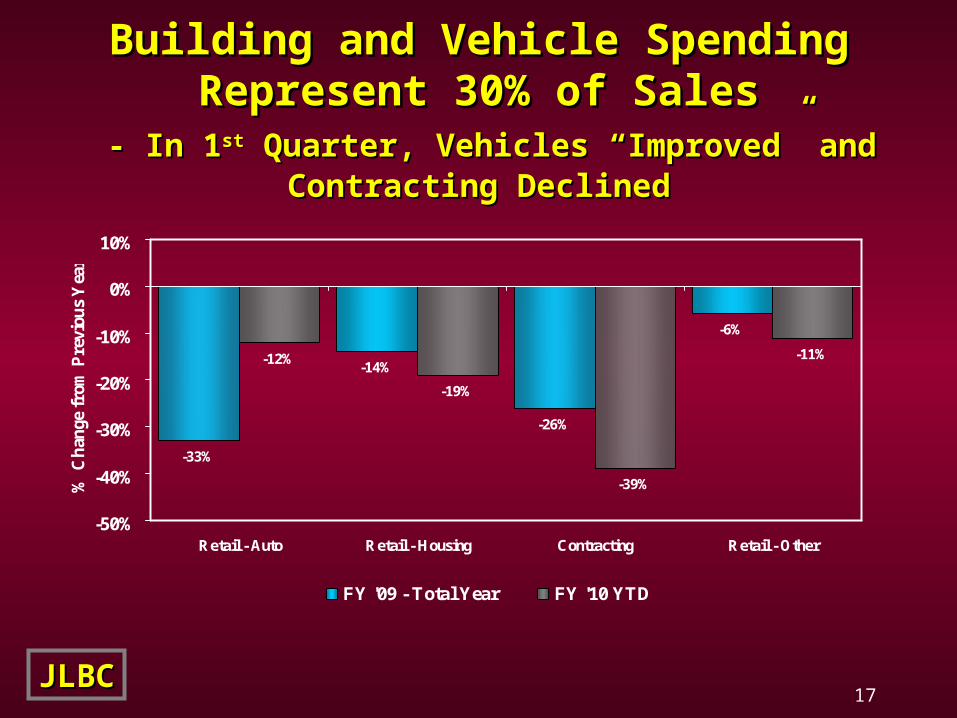
-33%
-14%
-26%
-6%
-39%
-11%
-19%
-12%
-50%
-40%
-30%
-20%
-10%
0%
10%
Retail - Auto Retail - Housing Contracting Retail - Other
% C
han
ge f
rom
Pre
viou
s Y
ear
FY '09 - Total Year FY '10 YTD
Building and Vehicle SpendingBuilding and Vehicle SpendingRepresent 30% of SalesRepresent 30% of Sales
- In 1- In 1stst Quarter, Vehicles “Improved” and Contracting Declined Quarter, Vehicles “Improved” and Contracting Declined

18JLBCJLBC
FY 2009 Actual = $2.57 Billion
Individual Income TaxIndividual Income Tax - The Consensus Forecasts Decline of (4.5)% in FY ’10,- The Consensus Forecasts Decline of (4.5)% in FY ’10,
with Positive Growth Rates Beginning in FY ‘11with Positive Growth Rates Beginning in FY ‘11
4.9%7.6%9.9%
-9.3%
24.1%
1.6%
28.9%
-9.1%
0.5%
10.3%
-4.5%
-24.6%-30%
-20%
-10%
0%
10%
20%
30%
40%
'02 '03 '04 '05 '06 '07 '08 '09 '10 '11 '12 '13
Fiscal Year
Yea
r O
ver
Yea
r %
Ch
ange
Actual Four-Sector Consensus* Excluding the 10% phased-in rate reduction, growth would have been 6.3% in ‘07, and (4.1)% in ’08.
19JLBCJLBC
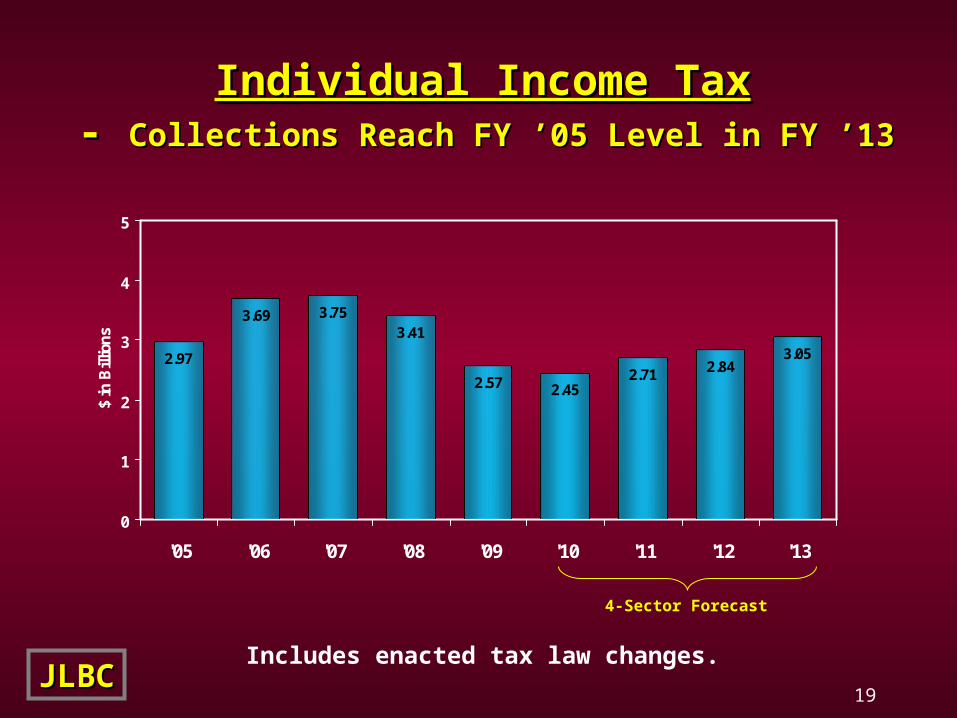
2.97
3.69 3.753.41
2.57 2.452.71 2.84
3.05
0
1
2
3
4
5
'05 '06 '07 '08 '09 '10 '11 '12 '13
$ in
Bill
ion
s
Includes enacted tax law changes.
4-Sector Forecast
Individual Income TaxIndividual Income Tax - - Collections Reach FY ’05 Level in FY ’13 Collections Reach FY ’05 Level in FY ’13
20JLBCJLBC
• Estimated payments declined for the 10th consecutive quarter (previous record = 4 qtrs.)
• Withholding fell for the 7th consecutive quarter (previous record = 4 qtrs.)
• Arizona’s withholding and estimated payment decline was the 3rd worst in the nation
Income Tax Continues RecordIncome Tax Continues RecordLosing Streak in 1Losing Streak in 1stst Quarter Quarter
- Data Available from 1960- Data Available from 1960

21JLBCJLBC
As With Sales, Withholding AppearsAs With Sales, Withholding Appearsto Have Bottomed Outto Have Bottomed Out
- More Difficult to Project Estimated Payments- More Difficult to Project Estimated Payments
$0
$300
$600
$900
$1,200
$1,500
1st
2nd
3rd
4th 1s
t2n
d3r
d4t
h 1st
2nd
3rd
4th 1s
t2n
d3r
d4t
h
$ in
Mill
ion
s
FY 2007 FY 2008 FY 2009 FY 2010JLBC Forecast
3-Mo.Actual
Collections by Quarter

22JLBCJLBC
FY 2009 Actual = $592 Million
Corporate Income TaxCorporate Income Tax - The Consensus Forecasts Decline of (15.5)% in FY ’10,- The Consensus Forecasts Decline of (15.5)% in FY ’10,
with Positive Growth Rates Beginning in FY ‘11with Positive Growth Rates Beginning in FY ‘11
* The ’08 – ‘11 percentages include the impact of the consolidated reporting credit and the phase-in of the corporate sales factor. Excluding these tax law changes, baseline growth
for ’08 – ’11 would be (14.4)%, (20.7)%, (9.9)% and 14.4% respectively.
14.9%9.2%
26.9%
-36.0%
24.6%
12.8%
42.1%
-18.0%
12.5%8.6%
-15.5%
-26.8%
-50%
-25%
0%
25%
50%
'02 '03 '04 '05 '06 '07 '08 '09 '10 '11 '12 '13
Fiscal Year
Yea
r O
ver
Yea
r %
Ch
ange
Actual Four-Sector Consensus
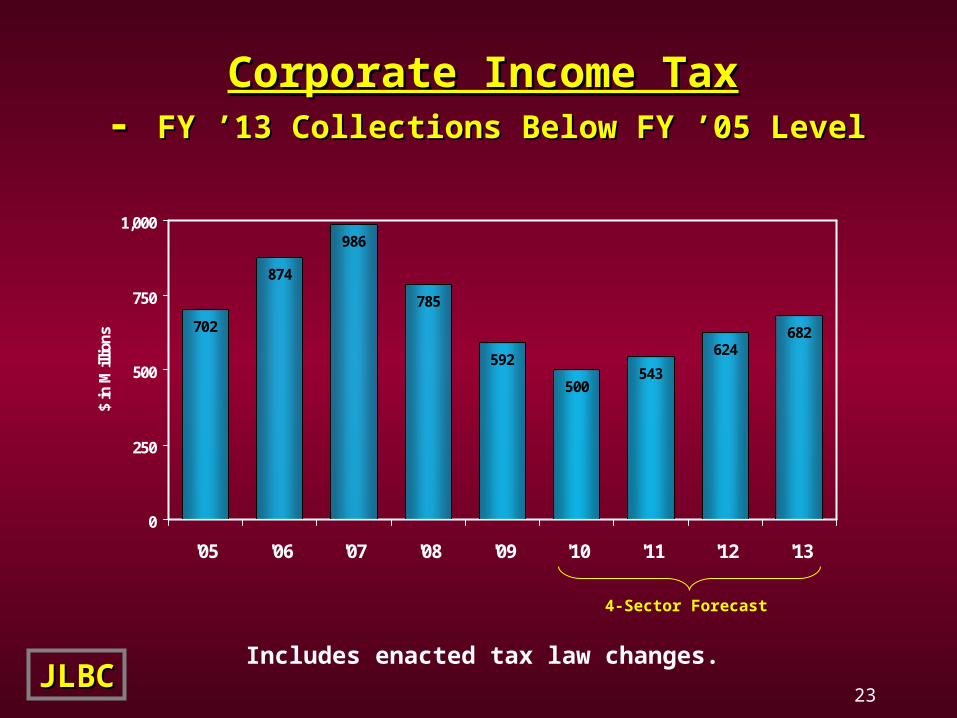
23JLBCJLBC
702
874
986
785
592
500543
624682
0
250
500
750
1,000
'05 '06 '07 '08 '09 '10 '11 '12 '13
$ in
Mill
ion
s
Includes enacted tax law changes.
4-Sector Forecast
Corporate Income TaxCorporate Income Tax - - FY ’13 Collections Below FY ’05 Level FY ’13 Collections Below FY ’05 Level

24JLBCJLBC
October 4-Sector Projecting RevenueOctober 4-Sector Projecting RevenueDecline of (7.2)% in FY ‘10Decline of (7.2)% in FY ‘10
- Enacted Budget Forecast for FY ’10 was 0.9% Increase- Enacted Budget Forecast for FY ’10 was 0.9% Increase
-8.7%
-3.4%
-10.0%
-6.5%
-12%
-8%
-4%
0%
UA-Base UA-Low FAC JLBC
Weighted Big 3 AveragePrior to Tax Law Changes

25JLBCJLBC
Rather Than Consensus, JLBC Recommends Rather Than Consensus, JLBC Recommends Using Its (8.7)% FY ’10 ForecastUsing Its (8.7)% FY ’10 Forecast
• Better to be cautious and improve rather than to see it get worse
• Equates to (4.9)% decline in remaining 9 months rather than (3.5)%
• After adjusting for changes in smaller categories, FY ’10 forecast is (8.2)%
• Results in $(698) M revenue shortfall
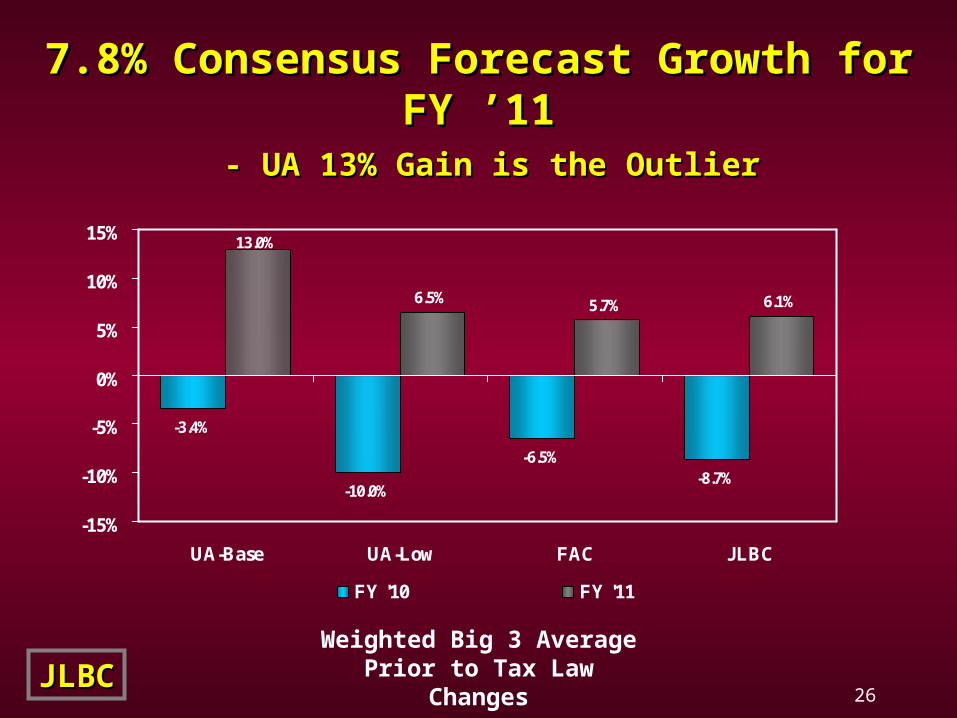
26JLBCJLBC
-8.7%
6.1%
-3.4%
-10.0%
-6.5%
13.0%
6.5% 5.7%
-15%
-10%
-5%
0%
5%
10%
15%
UA-Base UA-Low FAC JLBC
FY '10 FY '11
Weighted Big 3 AveragePrior to Tax Law Changes
7.8% Consensus Forecast Growth for FY ’117.8% Consensus Forecast Growth for FY ’11 - UA 13% Gain is the Outlier- UA 13% Gain is the Outlier
27JLBCJLBC
FY ’11 Revenue Base Also Adjusted for FY ’11 Revenue Base Also Adjusted for Tax Laws and Urban Revenue SharingTax Laws and Urban Revenue Sharing
• Enacted tax law changes of $(45) M– Corporate sales factor phase-in $(29) M
– Phoenix Convention Center payment $(5) M
– Research and Development tax credit $(6) M
– Solar tax credit $(5) M – 1st year difficult to predict
• Urban Revenue Sharing decreases by $(115) M from $629 M in ’10 to $474 M in ’11– Due to lagged decline in income tax collections
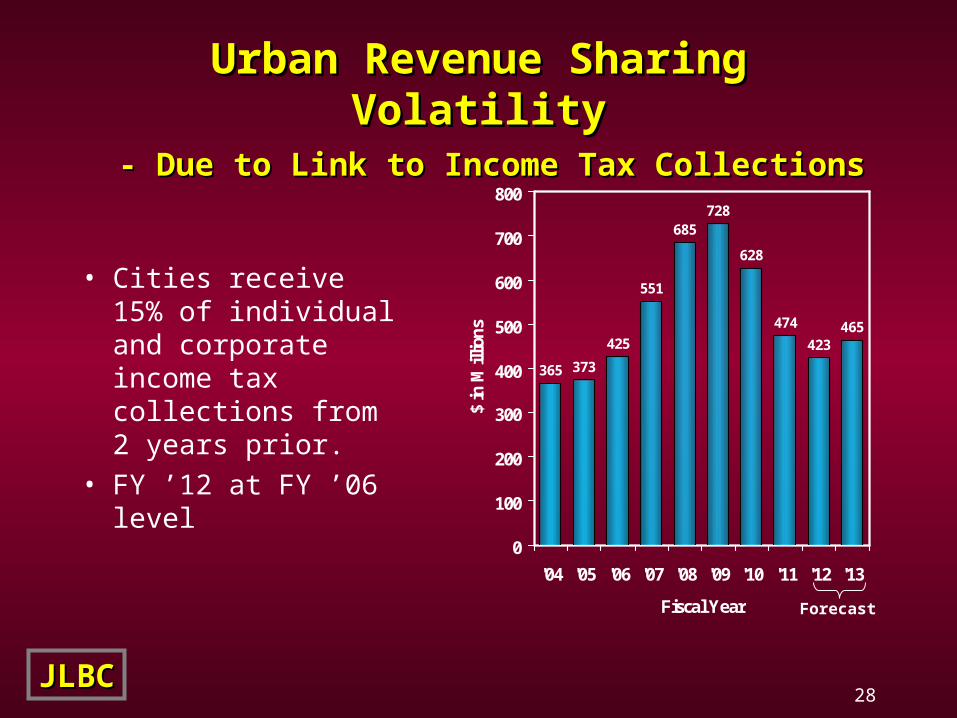
28JLBCJLBC
365 373
425
551
685728
628
474
423465
0
100
200
300
400
500
600
700
800
'04 '05 '06 '07 '08 '09 '10 '11 '12 '13
Fiscal Year
$ in
Mill
ion
s
Urban Revenue Sharing VolatilityUrban Revenue Sharing Volatility - Due to Link to Income Tax Collections- Due to Link to Income Tax Collections
• Cities receive 15% of individual and corporate income tax collections from 2 years prior.
• FY ’12 at FY ’06 level
Forecast
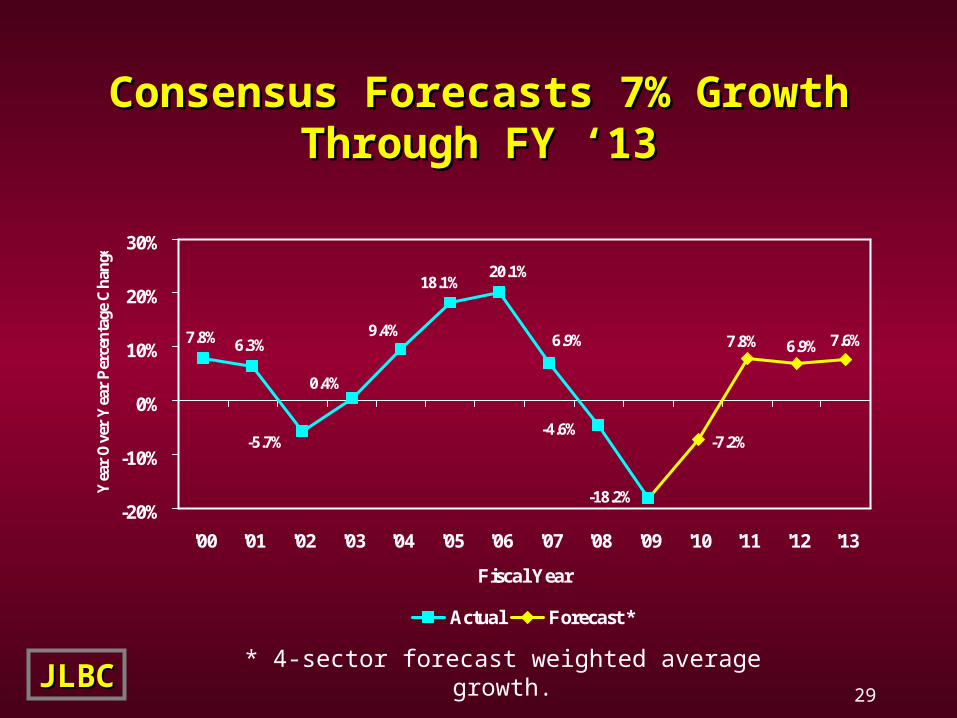
29JLBCJLBC
* 4-sector forecast weighted average growth.
Consensus Forecasts 7% GrowthConsensus Forecasts 7% GrowthThrough FY ‘13Through FY ‘13
7.8% 6.3%
20.1%
6.9%
-5.7%
-18.2%
18.1%
9.4%
-4.6%
0.4%
7.6%6.9%
-7.2%
7.8%
-20%
-10%
0%
10%
20%
30%
'00 '01 '02 '03 '04 '05 '06 '07 '08 '09 '10 '11 '12 '13
Fiscal Year
Yea
r O
ver
Yea
r P
erce
nta
ge C
han
ge
Actual Forecast *
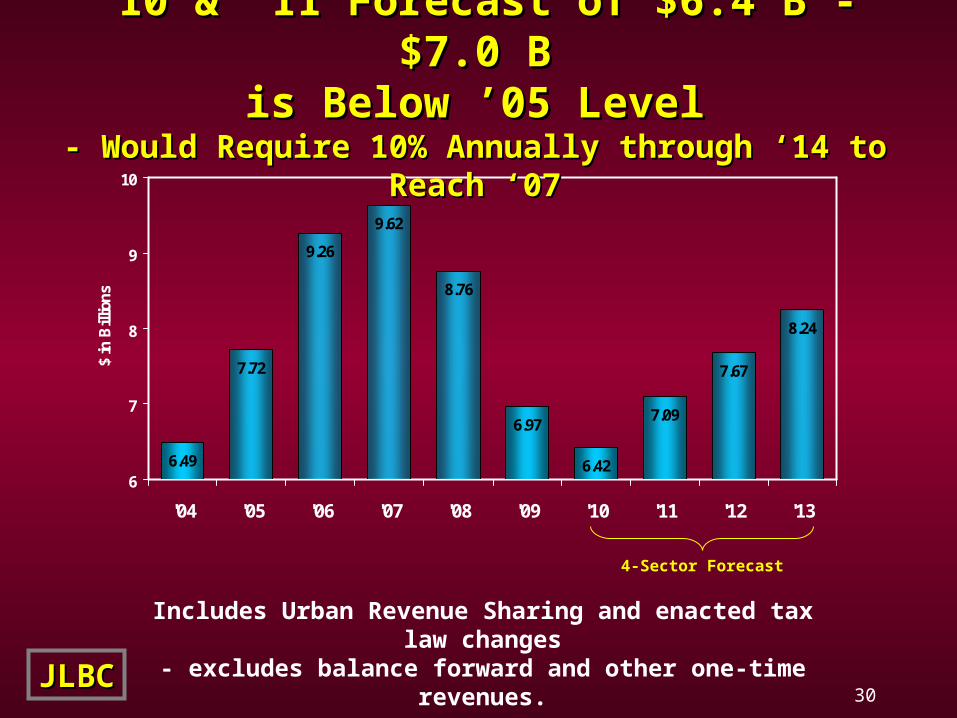
30JLBCJLBC
6.49
7.72
9.26
9.62
8.76
6.42
7.09
7.67
8.24
6.97
6
7
8
9
10
'04 '05 '06 '07 '08 '09 '10 '11 '12 '13
$ in
Bill
ion
s
4-Sector Forecast
Includes Urban Revenue Sharing and enacted tax law changes- excludes balance forward and other one-time revenues.
’’10 & ’11 Forecast of $6.4 B - $7.0 B10 & ’11 Forecast of $6.4 B - $7.0 Bis Below ’05 Levelis Below ’05 Level
- Would Require 10% Annually through ‘14 to Reach ‘07- Would Require 10% Annually through ‘14 to Reach ‘07
31JLBCJLBC
Warning and CaveatWarning and Caveat
• Is it responsible to base a budget on 7.8% estimated growth in FY ‘11?
• Economic forecasting has limited ability to predict future, especially in unprecedented times
32JLBCJLBC
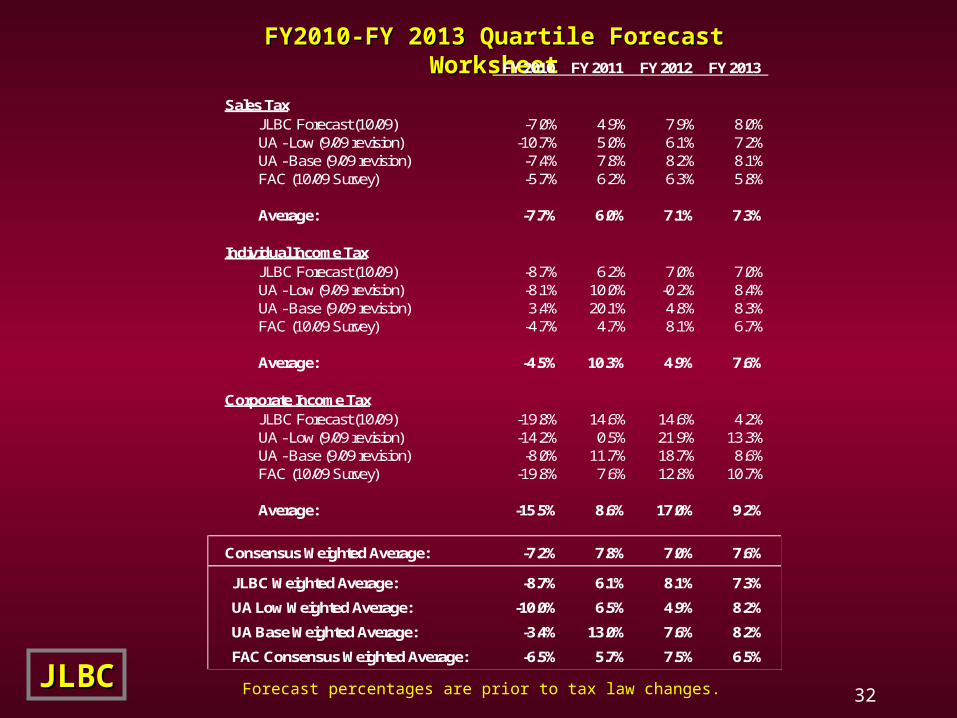
FY2010-FY 2013 Quartile Forecast WorksheetFY2010-FY 2013 Quartile Forecast Worksheet
Forecast percentages are prior to tax law changes.
FY 2010 FY 2011 FY 2012 FY 2013
Sales TaxJLBC Forecast (10/09) -7.0% 4.9% 7.9% 8.0%UA - Low (9/09 revision) -10.7% 5.0% 6.1% 7.2%UA - Base (9/09 revision) -7.4% 7.8% 8.2% 8.1%FAC (10/09 Survey) -5.7% 6.2% 6.3% 5.8%
Average: -7.7% 6.0% 7.1% 7.3%
Individual Income TaxJLBC Forecast (10/09) -8.7% 6.2% 7.0% 7.0%UA - Low (9/09 revision) -8.1% 10.0% -0.2% 8.4%UA - Base (9/09 revision) 3.4% 20.1% 4.8% 8.3%FAC (10/09 Survey) -4.7% 4.7% 8.1% 6.7%
Average: -4.5% 10.3% 4.9% 7.6%
Corporate Income TaxJLBC Forecast (10/09) -19.8% 14.6% 14.6% 4.2%UA - Low (9/09 revision) -14.2% 0.5% 21.9% 13.3%UA - Base (9/09 revision) -8.0% 11.7% 18.7% 8.6%FAC (10/09 Survey) -19.8% 7.6% 12.8% 10.7%
Average: -15.5% 8.6% 17.0% 9.2%
Consensus Weighted Average: -7.2% 7.8% 7.0% 7.6%
JLBC Weighted Average: -8.7% 6.1% 8.1% 7.3%
UA Low Weighted Average: -10.0% 6.5% 4.9% 8.2%
UA Base Weighted Average: -3.4% 13.0% 7.6% 8.2%
FAC Consensus Weighted Average: -6.5% 5.7% 7.5% 6.5%
Other (Non-GF) RevenuesOther (Non-GF) Revenues

34JLBCJLBC
Highway User Revenue FundHighway User Revenue Fund - Forecast Positive Growth Rates Beginning in FY ‘10- Forecast Positive Growth Rates Beginning in FY ‘10
2.0%1.1%
6.9%
3.8%4.4%
-7.1%
5.6%6.1%
-2.7%
3.2% 3.7%2.6%
0.1%1.3%
-10%
-5%
0%
5%
10%
'00 '01 '02 '03 '04 '05 '06 '07 '08 '09 '10 '11 '12 '13
Fiscal Year
Yea
r O
ver
Yea
r P
erce
nta
ge C
han
ge
Actual Forecast
Source: Arizona Department of TransportationFinancial Management Services – September 2009

35JLBCJLBC
1.01 1.031.08
1.111.18
1.331.38
1.34
1.25 1.25 1.271.30
1.35
1.25
0.5
1.0
1.5
'00 '01 '02 '03 '04 '05 '06 '07 '08 '09 '10 '11 '12 '13
$ in
Bill
ion
s
ADOT Forecast
Source: Arizona Department of TransportationFinancial Management Services – September 2009
Highway User Revenue FundHighway User Revenue Fund- FY ’13 Collections at FY ’06 Level- FY ’13 Collections at FY ’06 Level
36JLBCJLBC
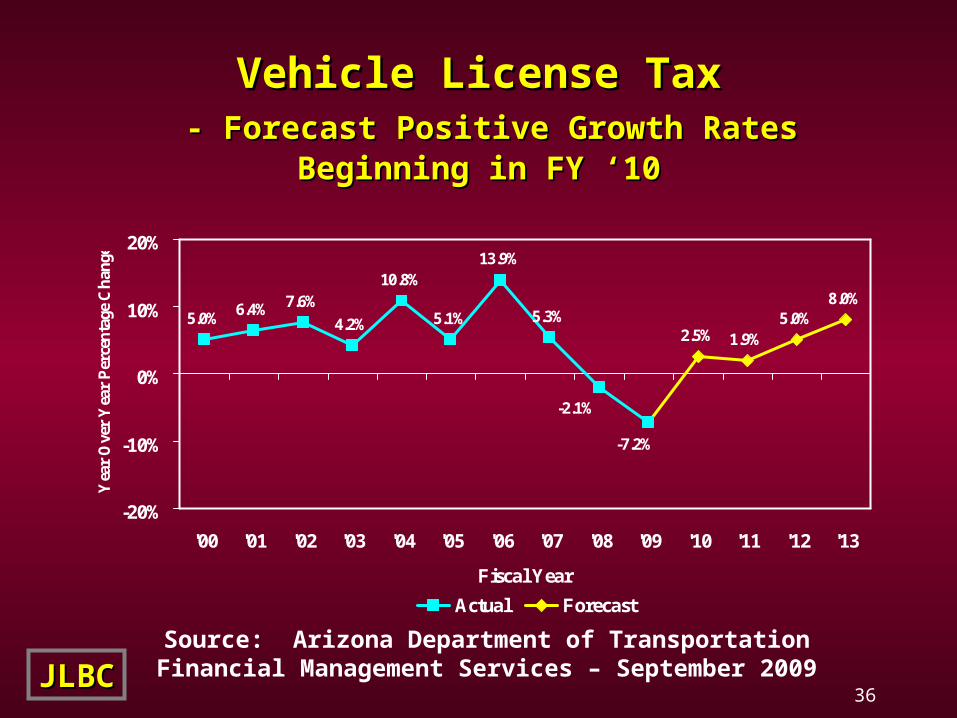
Vehicle License TaxVehicle License Tax - Forecast Positive Growth Rates Beginning in FY ‘10- Forecast Positive Growth Rates Beginning in FY ‘10
5.0%6.4%
13.9%
5.3%7.6%
-7.2%
5.1%
10.8%
-2.1%
4.2%
8.0%5.0%
2.5% 1.9%
-20%
-10%
0%
10%
20%
'00 '01 '02 '03 '04 '05 '06 '07 '08 '09 '10 '11 '12 '13
Fiscal Year
Yea
r O
ver
Yea
r P
erce
nta
ge C
han
ge
Actual Forecast
Source: Arizona Department of TransportationFinancial Management Services – September 2009
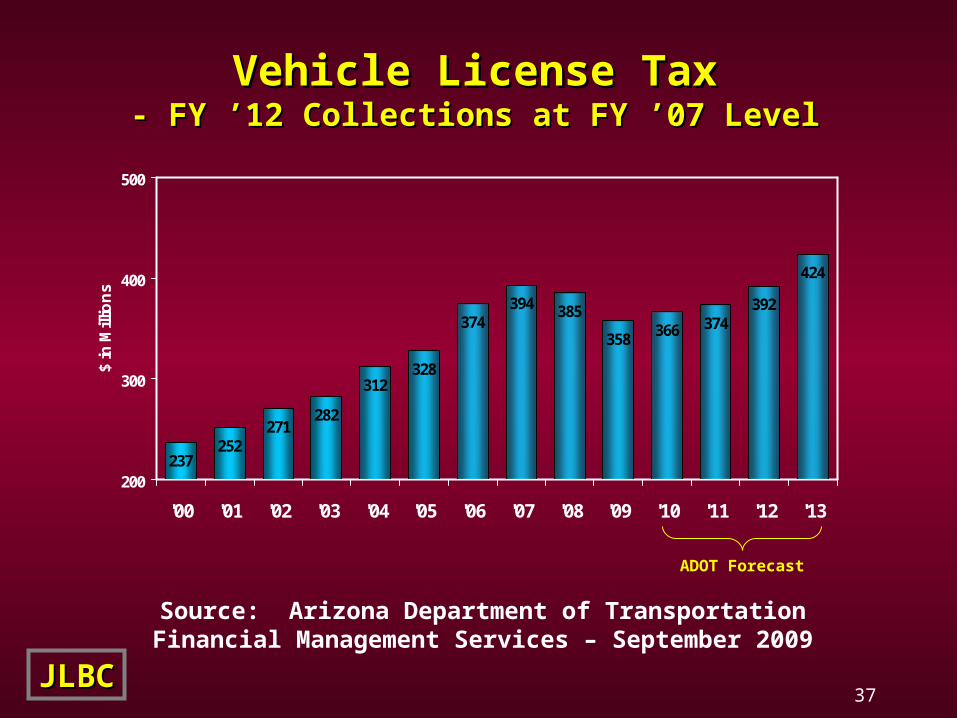
37JLBCJLBC
237252
271282
312
374394 385
358366 374
392
424
328
200
300
400
500
'00 '01 '02 '03 '04 '05 '06 '07 '08 '09 '10 '11 '12 '13
$ in
Mill
ion
s
ADOT Forecast
Source: Arizona Department of TransportationFinancial Management Services – September 2009
Vehicle License TaxVehicle License Tax- FY ’12 Collections at FY ’07 Level- FY ’12 Collections at FY ’07 Level
How Does New General Fund ForecastHow Does New General Fund ForecastAffect Budget Shortfall?Affect Budget Shortfall?

39JLBCJLBC
New Forecast Raises FY ’10 Shortfall to $2.0 B New Forecast Raises FY ’10 Shortfall to $2.0 B
$ in M
• FY ’09 Carryover Shortfall
• FY '10 Budgeted Shortfall after Vetoes
• FY ’10 Revenue Shortfall – Oct. Forecast
• AHCCCS/DHS Caseloads
• Mark-Down of Savings Estimates– AHCCCS Fraud, Concession Agreement,
Sale/Lease-Back
• Total
$ 478
483
698
135
165
_______
$1,959
JLBCJLBC40
There Are 3 MeasuresThere Are 3 Measuresof State’s Fiscal Conditionof State’s Fiscal Condition
• General Fund Budget Balance
• General Fund Structural Balance
• Operating Fund Balance– the actual checkbook
JLBCJLBC41
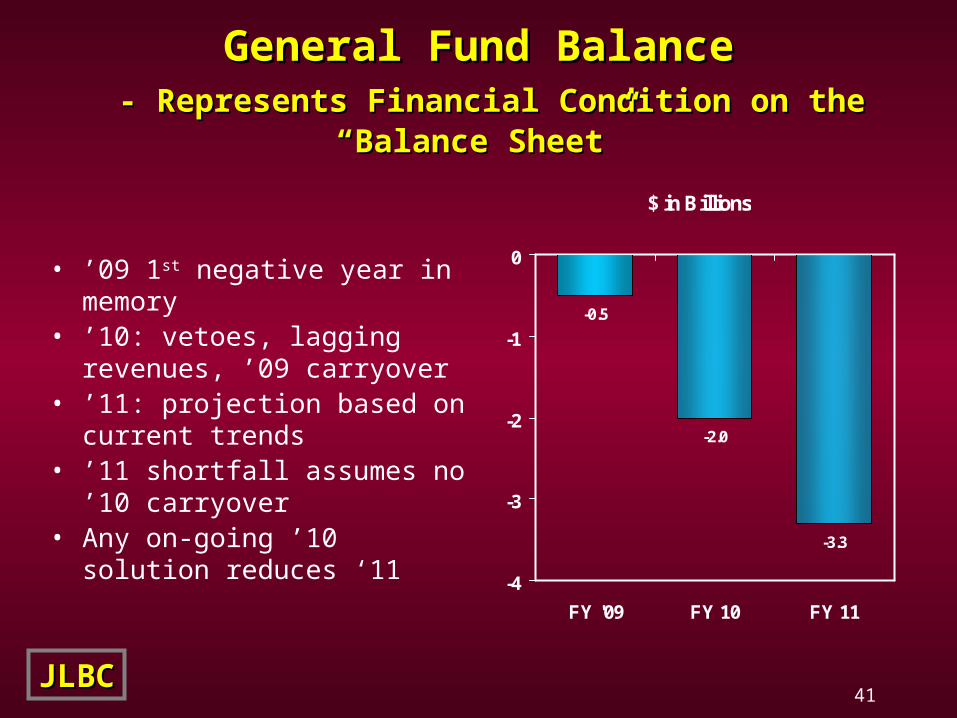
General Fund BalanceGeneral Fund Balance - Represents Financial Condition on the “Balance Sheet”- Represents Financial Condition on the “Balance Sheet”
$ in Billions
-0.5
-2.0
-3.3
-4
-3
-2
-1
0
FY '09 FY 10 FY 11
• ’09 1st negative year in memory• ’10: vetoes, lagging revenues,
’09 carryover• ’11: projection based on current
trends• ’11 shortfall assumes no ’10
carryover• Any on-going ’10 solution
reduces ‘11
JLBCJLBC42
Doesn’t State Have ADoesn’t State Have ABalanced Budget Requirement?Balanced Budget Requirement?
• Arizona Constitution requires Legislature to provide revenues to “defray” the necessary expenses for each year
• If the state falls short, the Legislature may tax in the following year to make up difference
JLBCJLBC43
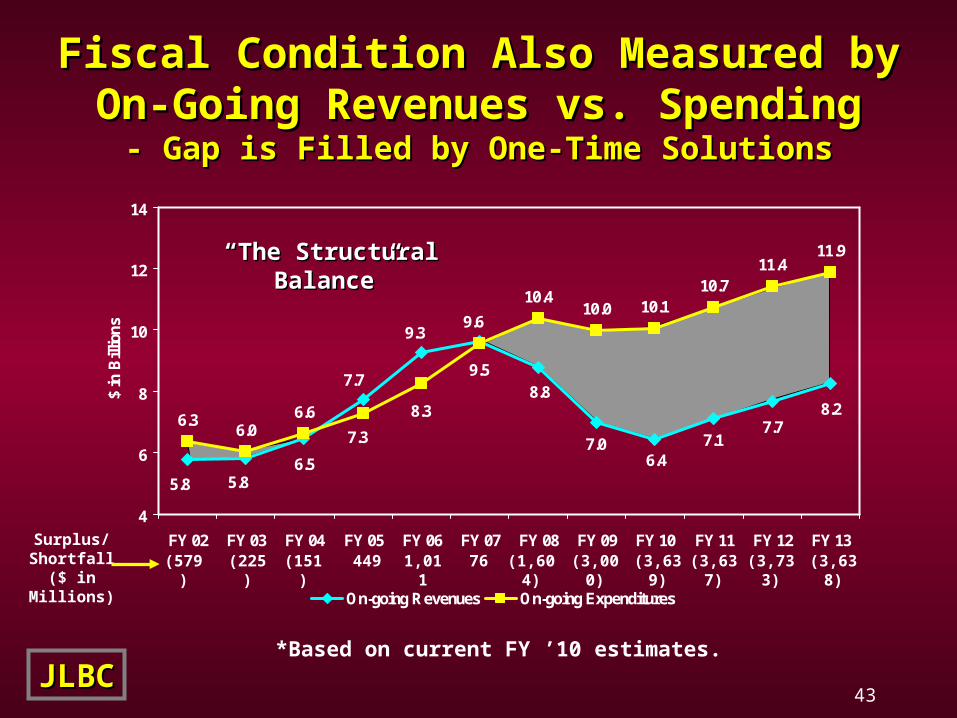
7.78.2
10.711.4
11.9
7.1
9.3
7.7
6.55.85.8
9.6
7.0
8.8
6.4
10.410.110.0
8.3
7.3
6.66.0
6.3
9.5
4
6
8
10
12
14
FY 02 FY 03 FY 04 FY 05 FY 06 FY 07 FY 08 FY 09 FY 10 FY 11 FY 12 FY 13
$ in
Bill
ion
s
On-going Revenues On-going Expenditures
Fiscal Condition Also Measured byFiscal Condition Also Measured byOn-Going Revenues vs. SpendingOn-Going Revenues vs. Spending
- Gap is Filled by One-Time Solutions- Gap is Filled by One-Time Solutions
Surplus/ Shortfall
($ in Millions)(579) (225) (151) 449 1,011 76 (1,604) (3,000) (3,639)
*Based on current FY ’10 estimates.
(3,637)
““The Structural Balance”The Structural Balance”
(3,733) (3,638)

JLBCJLBC44
The Budget and Structural ShortfallsThe Budget and Structural Shortfalls
FY ’09 Shortfall$480 M
Total Budget Shortfall$2.0 B
by end of FY ‘10
Rollovers - $(90) M
1-Time FederalStimulus Offset
$(1.13) B
New FY ’10 Shortfall$1.5 B
Fund Transfers – $230 M
Asset Sale/Lease-Purchase
$735 M
$10.1 B Ongoing Spending
$8.9 B Total Spending
$6.4 B Ongoing Revenues
$7.4 B Total Revenues
StructuralShortfall
$3.6 B
JLBCJLBC45
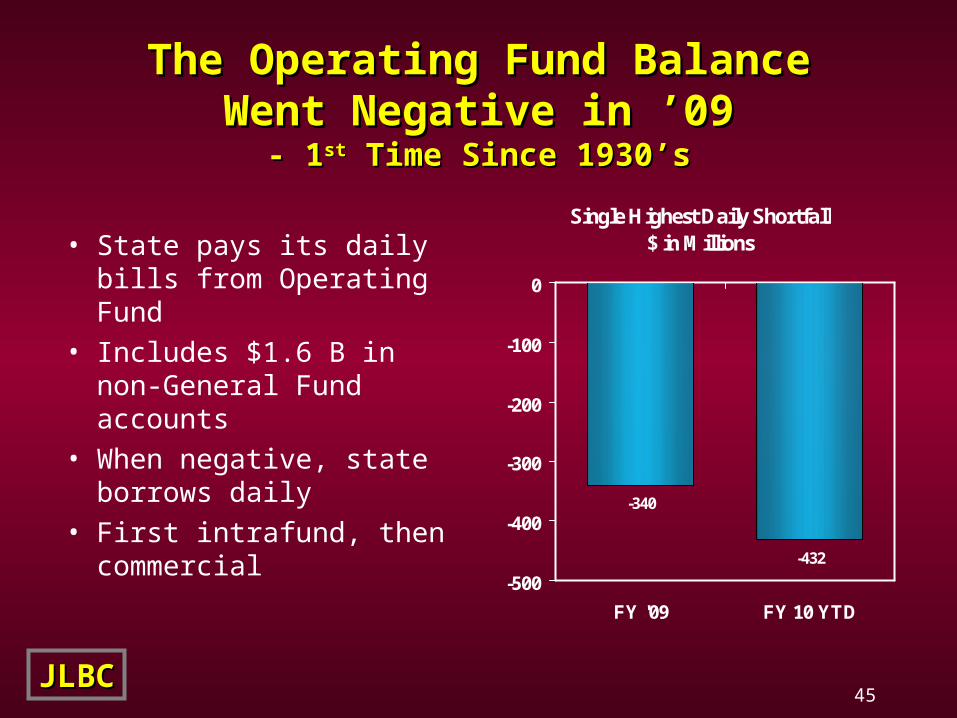
The Operating Fund BalanceThe Operating Fund BalanceWent Negative in ’09Went Negative in ’09
- 1- 1stst Time Since 1930’s Time Since 1930’s
• State pays its daily bills from Operating Fund
• Includes $1.6 B in non-General Fund accounts
• When negative, state borrows daily
• First intrafund, then commercial
Single Highest Daily Shortfall$ in Millions
-340
-432
-500
-400
-300
-200
-100
0
FY '09 FY 10 YTD

JLBCJLBC46
Operating Fund BorrowingOperating Fund Borrowingis the Last Back-Stopis the Last Back-Stop
• State is issuing long-term debt to generate cash for budget-balancing– e.g., $735 M state building leaseback
• The Operating Fund borrowing, however, is overnight debt solely to pay that day’s bills
• At some point, banks won’t lend anymore – the California experience

JLBCJLBC47
Moody’s Shifted Rating Outlook to “Negative”Moody’s Shifted Rating Outlook to “Negative” - Accompanied by Following Observations- Accompanied by Following Observations
• The state has taken some steps to stabilize its fiscal situation
• Statutory limits prevent quick action on shortfalls• Most balancing measures “are not of a recurring
nature”• “Available reserves have been depleted”• The state faces the “challenge of addressing
ongoing structural imbalance with more limited resources, in an environment of continuing economic weakness”
JLBCJLBC48
ResourcesResourcesJLBC Web-SiteJLBC Web-Site
www.azleg.gov/jlbc.htmwww.azleg.gov/jlbc.htm• Appropriations Report – annual budget document.
• Tax Handbook – overview of the state’s tax revenue sources, including description, collection history, and tax law changes.
• Monthly Fiscal Highlights – overview of monthly revenue collections and spending, plus other fiscal related information, including summaries of JLBC, JCCR and FAC meetings.
Tim Everill – Assistant Director602.926.5482


