March 16, 2022 Data Mining: Concepts and Techniques 1 Chapter 3: Data Warehousing and OLAP Technology: An Overview What is a data warehouse? A multi-dimensional data model Data warehouse architecture Data warehouse implementation
Transcript
April 19, 2023Data Mining: Concepts and
Techniques 1
Chapter 3: Data Warehousing and OLAP Technology: An Overview
What is a data warehouse?
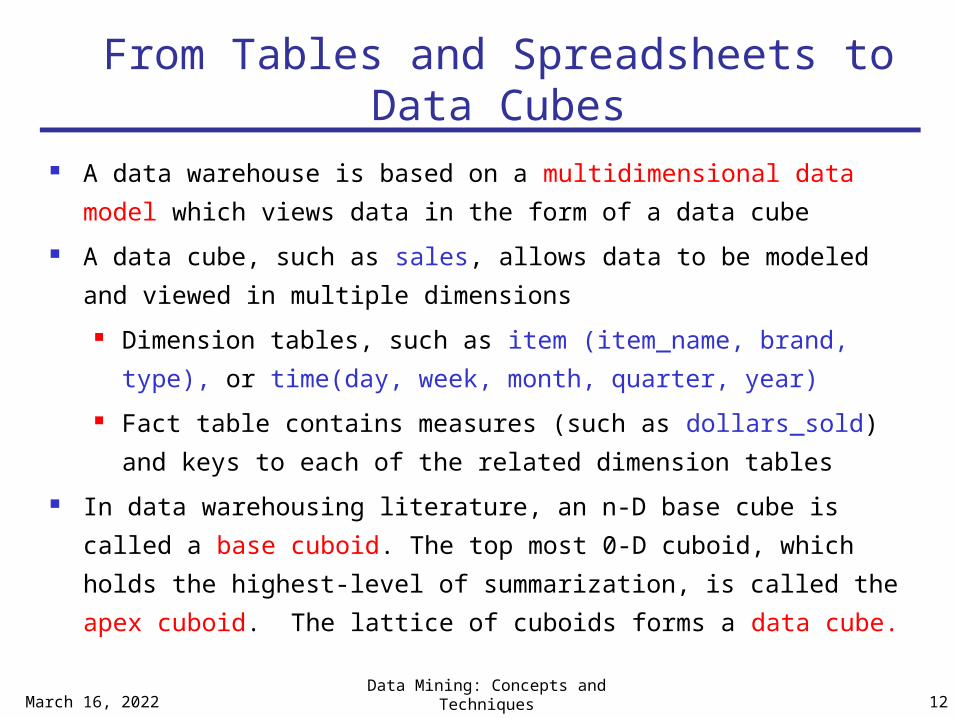
A multi-dimensional data model
Data warehouse architecture
Data warehouse implementation
April 19, 2023Data Mining: Concepts and
Techniques 2
What is Data Warehouse?
Defined in many different ways, but not rigorously.
A decision support database that is maintained
separately from the organization’s operational database
Support information processing by providing a solid
platform of consolidated, historical data for analysis.
“A data warehouse is a subject-oriented, integrated, time-
variant, and nonvolatile collection of data in support of
management’s decision-making process.”—W. H. Inmon
Data warehousing:
The process of constructing and using data warehouses
April 19, 2023Data Mining: Concepts and
Techniques 3
Data Warehouse—Subject-Oriented
Organized around major subjects, such as
customer, product, sales
Focusing on the modeling and analysis of data for
decision makers, not on daily operations or
transaction processing
Provide a simple and concise view around
particular subject issues by excluding data that
are not useful in the decision support process
April 19, 2023Data Mining: Concepts and
Techniques 4
Data Warehouse—Integrated
Constructed by integrating multiple, heterogeneous data sources relational databases, flat files, on-line
transaction records Data cleaning and data integration techniques
are applied. Ensure consistency in naming conventions,
encoding structures, attribute measures, etc. among different data sources
E.g., Hotel price: currency, tax, breakfast covered, etc.
When data is moved to the warehouse, it is converted.
5
Data Warehouse—Time Variant
The time horizon for the data warehouse is significantly longer than that of operational systems Operational database: current value data Data warehouse data: provide information from a
historical perspective (e.g., past 5-10 years) Every key structure in the data warehouse
Contains an element of time, explicitly or implicitly
But the key of operational data may or may not contain “time element”
6
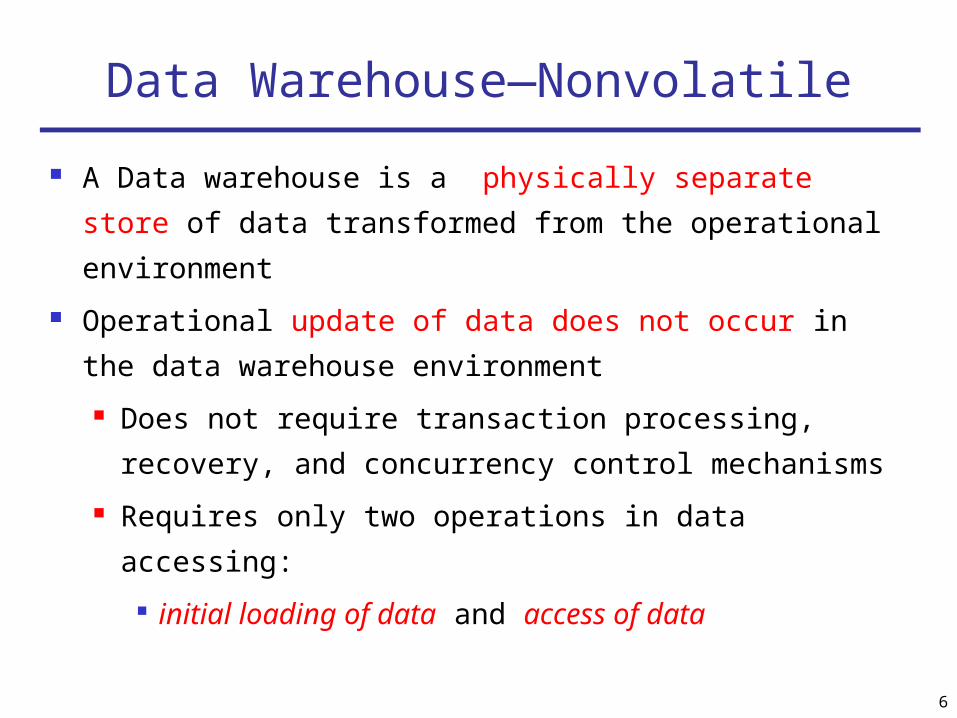
Data Warehouse—Nonvolatile
A Data warehouse is a physically separate store of
data transformed from the operational
environment
Operational update of data does not occur in the
data warehouse environment
Does not require transaction processing,
recovery, and concurrency control mechanisms
Requires only two operations in data accessing:
initial loading of data and access of data
7
Data Warehouse vs. Heterogeneous DBMS
Traditional heterogeneous DB integration: A query driven approach
Build wrappers/mediators/integrators on top of multiple ,heterogeneous
databases
When a query is posed to a client site, a meta-dictionary is used to translate
the query into queries appropriate for individual heterogeneous sites
involved, and the results are integrated into a global answer set
The query driven approach requires Complex information filtering,
integration process , compete for resources with processing at local sources.
Data warehouse: update-driven, high performance
Information from heterogeneous sources is integrated in advance and
stored in warehouses for direct query and analysis
High performance because data are copied , preprocessed,
integrated,summarized and restructured into one semantic data store
8
Data Warehouse vs. Operational DBMS
OLTP (on-line transaction processing ) Major task of traditional relational DBMS Day-to-day operations: purchasing, inventory, banking, manufacturing,
payroll, registration, accounting, etc.
OLAP (on-line analytical processing ) Major task of data warehouse system Data analysis and decision making
Distinct features (OLTP vs. OLAP): User and system orientation: customer vs. market Data contents: current, detailed vs. historical, consolidated Database design: ER + application vs. star + snowflake + subject oriented. View: current, local (enterprise or department) vs. evolutionary, integrated Access patterns: short, atomic, requires concurrency control & recovery
mechanisms (update) vs. read-only but complex queries
April 19, 2023Data Mining: Concepts and
Techniques 9
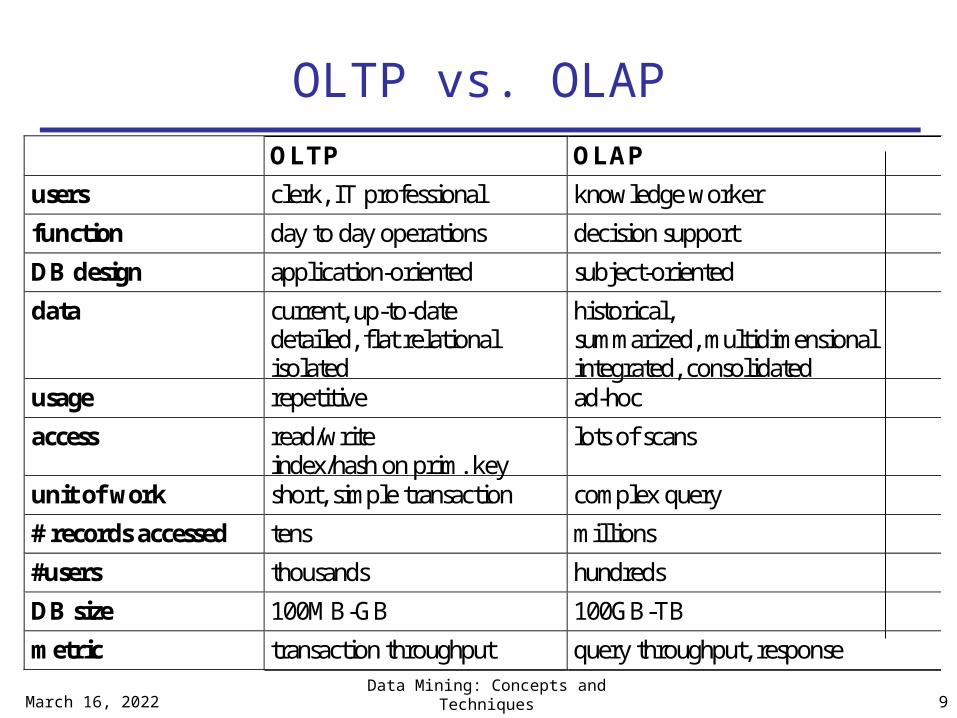
OLTP vs. OLAP OLTP OLAP
users clerk, IT professional knowledge worker
function day to day operations decision support
DB design application-oriented subject-oriented
data current, up-to-date detailed, flat relational isolated
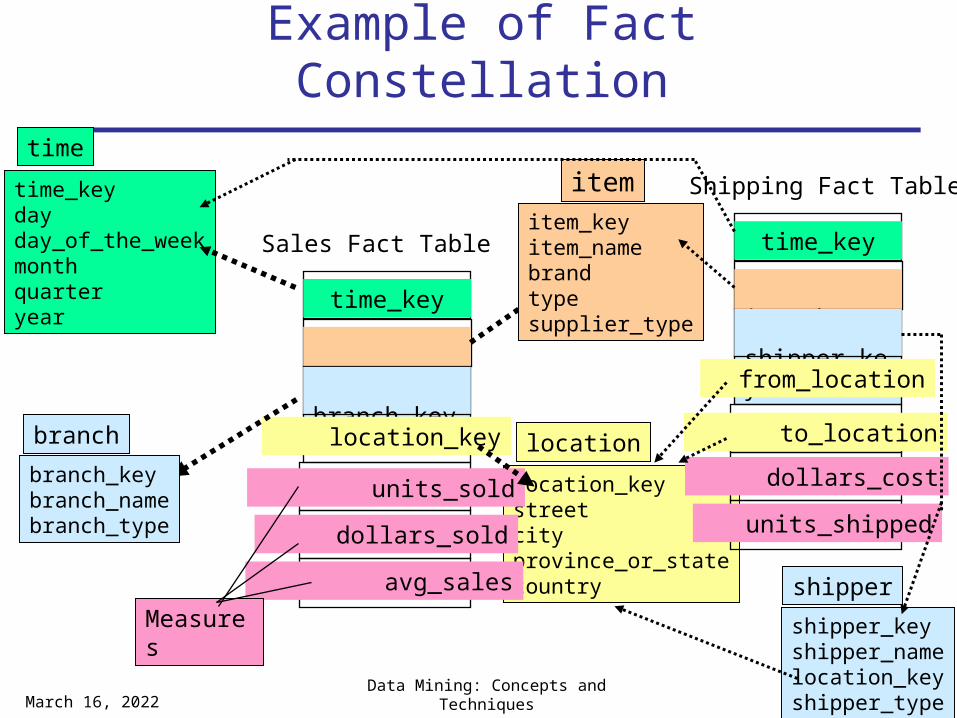
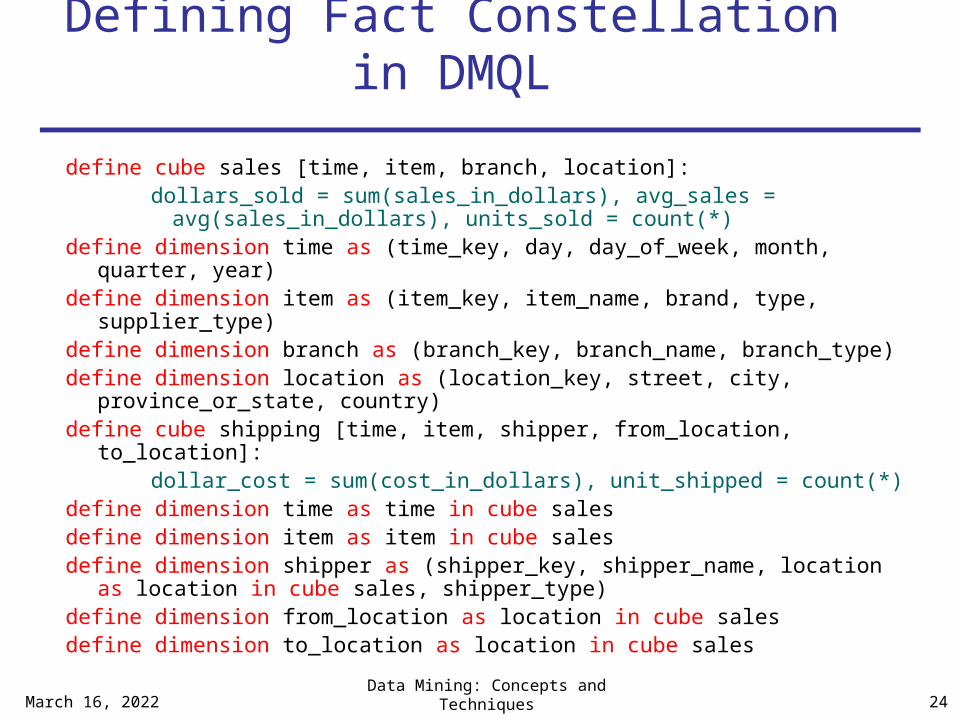
dollar_cost = sum(cost_in_dollars), unit_shipped = count(*)define dimension time as time in cube salesdefine dimension item as item in cube salesdefine dimension shipper as (shipper_key, shipper_name, location as
location in cube sales, shipper_type)define dimension from_location as location in cube salesdefine dimension to_location as location in cube sales
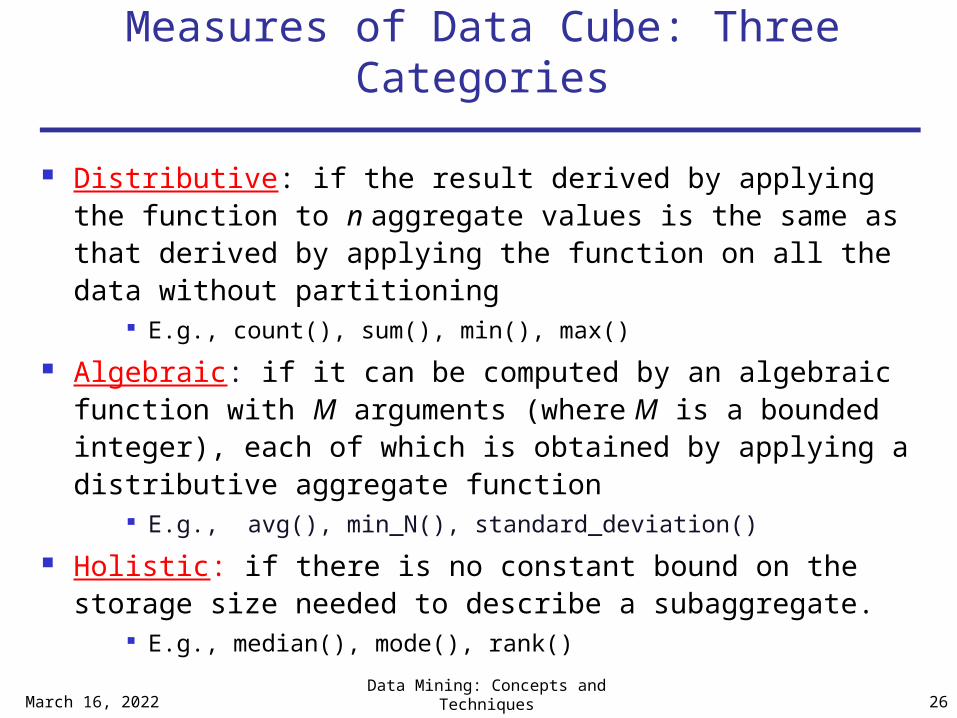
Distributive: if the result derived by applying the function to n aggregate values is the same as that derived by applying the function on all the data without partitioning
E.g., count(), sum(), min(), max()
Algebraic: if it can be computed by an algebraic function with M arguments (where M is a bounded integer), each of which is obtained by applying a distributive aggregate function
E.g., avg(), min_N(), standard_deviation()
Holistic: if there is no constant bound on the storage size needed to describe a subaggregate.
E.g., median(), mode(), rank()
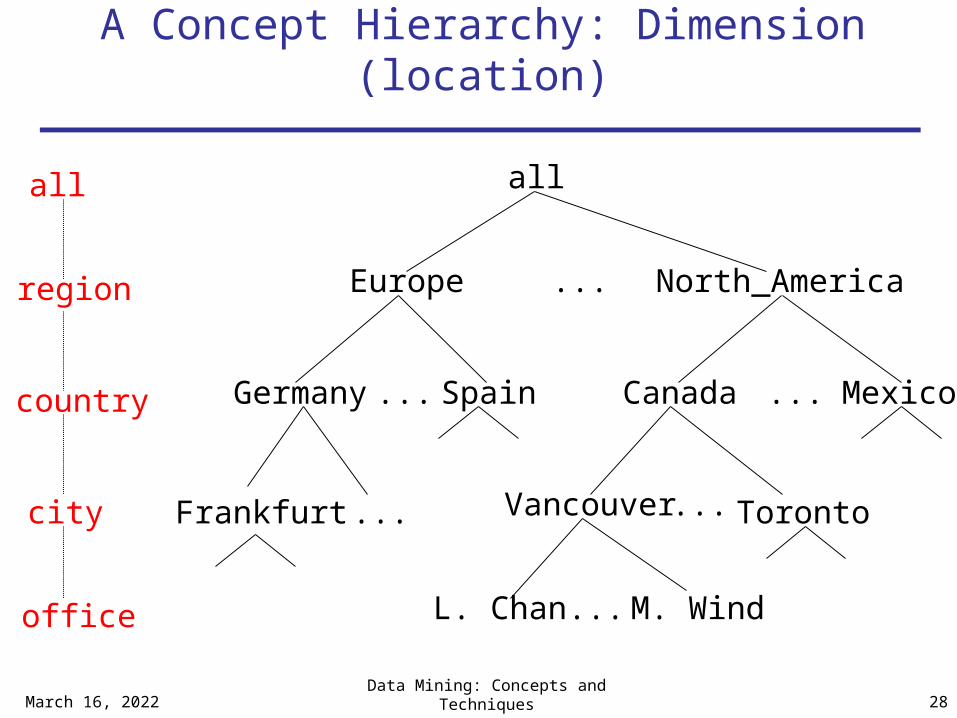
Concept hierarchies
A concept hierarchy defines a sequence of mappings from a set of low level concepts to higher level, more general concepts.
April 19, 2023Data Mining: Concepts and
Techniques 27
April 19, 2023Data Mining: Concepts and
Techniques 28
A Concept Hierarchy: Dimension (location)
all
Europe North_America
MexicoCanadaSpainGermany
Vancouver
M. WindL. Chan
...
......
... ...
...
all
region
office
country
TorontoFrankfurtcity
April 19, 2023Data Mining: Concepts and
Techniques 29
April 19, 2023Data Mining: Concepts and
Techniques 30
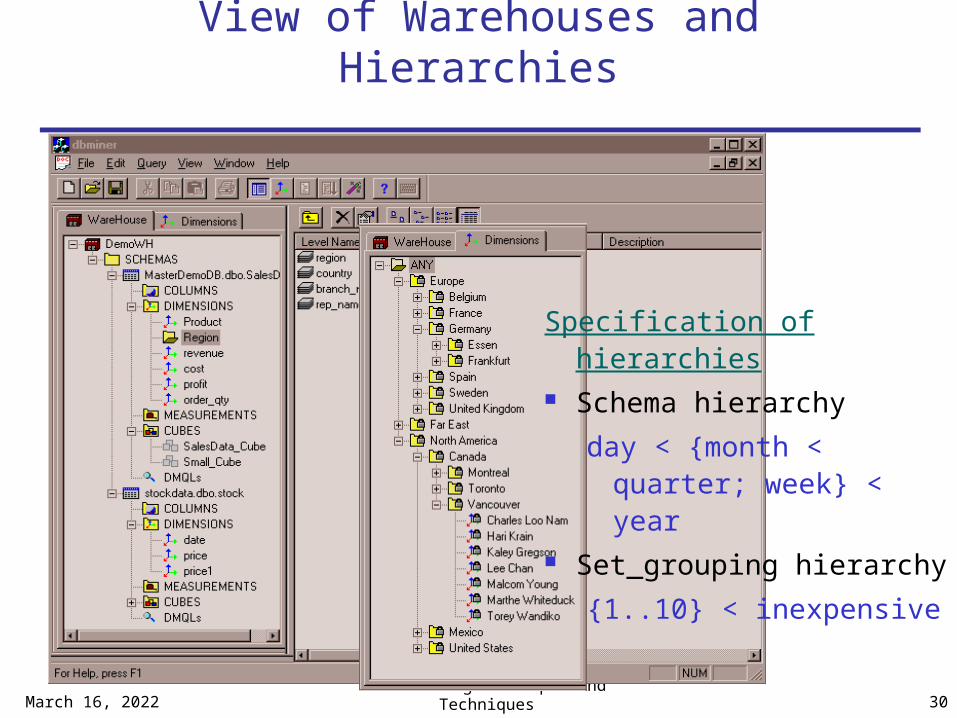
View of Warehouses and Hierarchies
Specification of hierarchies Schema hierarchy
day < {month < quarter; week} < year
Set_grouping hierarchy
{1..10} < inexpensive
April 19, 2023Data Mining: Concepts and
Techniques 31
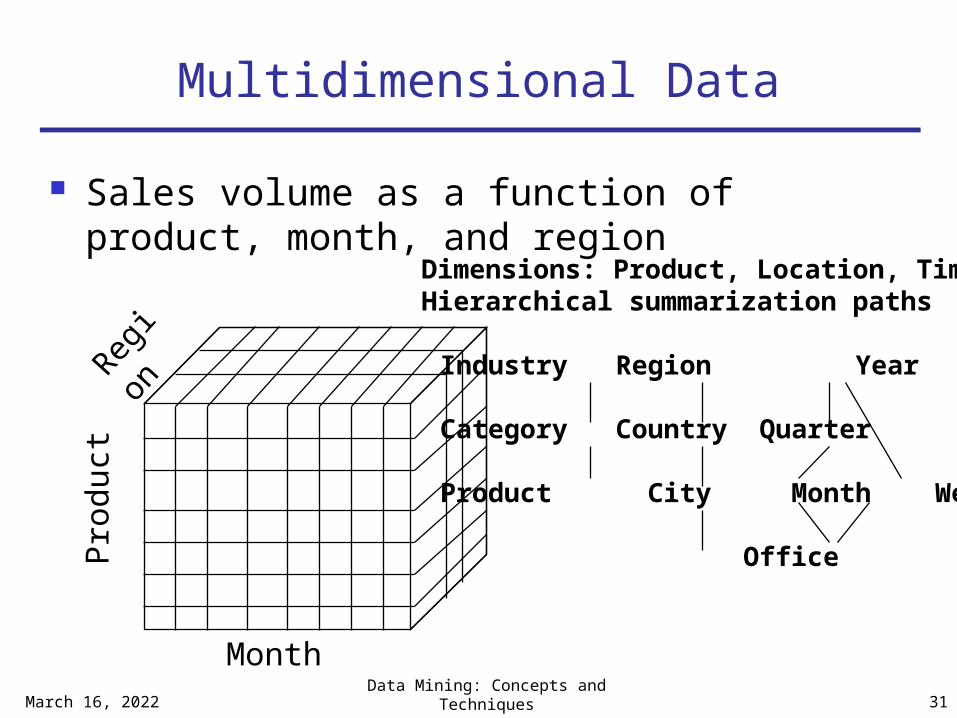
Multidimensional Data
Sales volume as a function of product, month, and region
Roll up (drill-up): summarize data by climbing up concept hierarchy or by dimension
reduction Performs aggregation on a data cube
Drill down (roll down): reverse of roll-up from higher level summary to lower level
summary or detailed data, or introducing new dimensions
It navigates from less detailed data to more detailed data.
Slice and dice: project and select
Pivot (rotate): Is a visualization operation that rotates the data
axes in view in order to provide an alternative presentation of the data.
reorient the cube, visualization, 3D to series of 2D planes
Other operations drill across: executes query involving (i.e
across) more than one fact table drill through: through the bottom level of the
cube to its back-end relational tables (using SQL)
April 19, 2023Data Mining: Concepts and
Techniques 36
http://www.tutorialspoint.com/dwh/dwh_olap.htm
April 19, 2023Data Mining: Concepts and
Techniques 37
April 19, 2023Data Mining: Concepts and
Techniques 38
Fig. 3.10 Typical OLAP Operations
April 19, 2023Data Mining: Concepts and
Techniques 39
A Star-Net Query Model for querying multidimensional
model
Shipping Method
AIR-EXPRESS
TRUCKORDER
Customer Orders
CONTRACTS
Customer
Product
PRODUCT GROUP
PRODUCT LINE
PRODUCT ITEM
SALES PERSON
DISTRICT
DIVISION
OrganizationPromotion
CITY
COUNTRY
REGION
Location
DAILYQTRLYANNUALYTime
Each circle is called a footprint
Querying of multidimensional databases can be based on a starnet model.
Consists of radial lines emanating from a central point, where each line represent a concept hierarchy.
Each abstraction level in the hierarchy is called a footprint.
Footprints represent the granularities available for use by OLAP operations such as drill down and roll up.
April 19, 2023Data Mining: Concepts and
Techniques 40
April 19, 2023Data Mining: Concepts and
Techniques 41
April 19, 2023Data Mining: Concepts and
Techniques 42
Chapter 3: Data Warehousing and OLAP Technology: An Overview
What is a data warehouse?
A multi-dimensional data model
Data warehouse architecture
Data warehouse implementation
Design of Data Warehouse: A Business Analysis Framework
what can business analysts gain from having a DWH?
1) Provide competitive advantage by presenting relevant information from which to measure performance and make critical adjustments in order to help win over competitors.
2) enhance business productivity3) facilitates customer relationship management because it
provides a consistent view of customers and items across all lines of business, all departments, and all markets.
4) bring about cost reduction by tracking trends, patterns, and exceptions over long periods in a consistent and reliable manner.
To design an effective data warehouse we need to understand and analyze business needs and construct a business analysis framework.
43
44
Design of Data Warehouse: A Business Analysis Framework
Four views regarding the design of a data warehouse Top-down view
allows selection of the relevant information necessary for the data warehouse
Data source view exposes the information being captured, stored, and managed
by operational systems
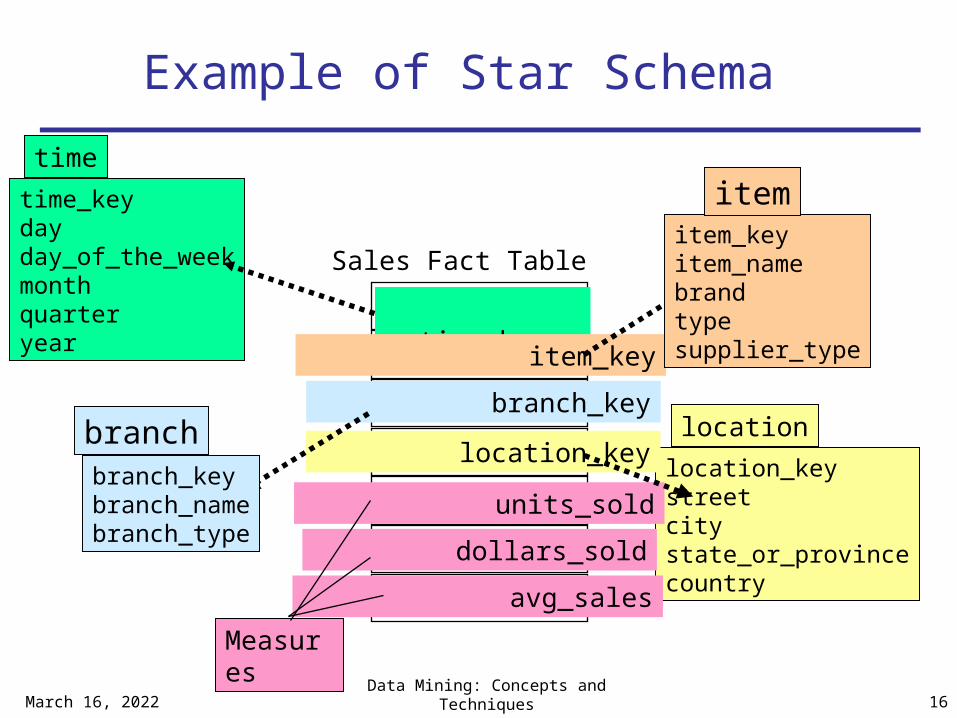
Data warehouse view consists of fact tables and dimension tables. Represents the
information that is stored, precalculated total and counts , information regarding source, date , time of origin etc
Business query view sees the perspectives of data in the warehouse from the view
of end-user
Data Warehouse Design Process Top-down, bottom-up approaches or a
combination of both Top-down: Starts with overall design and planning
(mature).used where business problem are well known and well understood
Bottom-up: Starts with experiments and prototypes (rapid). Allows organization to move forward at considerably less expense.
Combined approach (mature and rapid both)
45
From software engineering point of view
phases of construction of DWH: planning requirements study, problem analysis, warehouse design, data integration & testing , finally deployment of the DWH. Waterfall: structured and systematic analysis at
each step before proceeding to the next Spiral: rapid generation of increasingly
functional systems, short turn around time, quick turn around
April 19, 2023Data Mining: Concepts and
Techniques 46
Typical data warehouse design process
Choose a business process to model, e.g., orders, invoices, inventory, sales etc. if the business process organization and involves multiple complex object then DWH model should be followed. If the process is departmental then data mart model should be choosen.
Choose the grain (atomic level of data) of the business process. Grain is the fundamental atomic level data to be represented in the fact table for this process.
Choose the dimensions that will apply to each fact table record.
Choose the measure that will populate each fact table record.
47
48
The bottom tier is a warehouse database server that is almost always a relational database system.
Back-end tools and utilities are used to feed data into the bottom tier from operational databases.
A gateway is allow client programs to generate SQL code to be executed at a server.
April 19, 2023Data Mining: Concepts and
Techniques 49
The middle tier is an OLAP server that is implemented using either
(1) a relational OLAP (ROLAP) model, that is, an extended relational DBMS that maps operations on multidimensional data to standard relational operations
(2) a multidimensional OLAP (MOLAP) model, that is, a special-purpose server that directly implements multidimensional data and operations.
The top tier is a front-end client layer, which contains query and reporting tools, analysis tools, and/or data mining tools (e.g., trend analysis, prediction, and so on).
April 19, 2023Data Mining: Concepts and
Techniques 50
April 19, 2023Data Mining: Concepts and
Techniques 51
Three Data Warehouse Models (from architecture point of
view) Enterprise warehouse
collects all of the information about subjects spanning the entire organization. Contains detailed as well as summarized data.
Size range from a few gigabytes to hundreds of gigabytes, terabytes, or beyond.
It may take years to design and build.
Data Mart a subset of corporate-wide data that is of value to a specific
groups of users. Its scope is confined to specific, selected groups, such as marketing data mart, sales data mart
Usually implemented on low cost departmental servers that are UNIX/LINUX or windows based.
Implementation cycle is measured in weeks than months or years.
depending on source of data, data marts can be categorized as :
Independent data mart (sourced from operational systems or external information or local within the department) vs. dependent data mart (directly from warehouse).
Virtual warehouse
A set of views over operational databases Only some of the possible summary views may
be materialized
April 19, 2023Data Mining: Concepts and
Techniques 52
April 19, 2023Data Mining: Concepts and
Techniques 53
Data Warehouse Development: A Recommended Approach (incremental and
evolutionary)
Define a high-level corporate data model
Data Mart
Data Mart
Distributed Data Marts
Multi-Tier Data Warehouse
Enterprise Data Warehouse
Model refinementModel refinement
54
Data Warehouse Back-End Tools and Utilities
Data extraction get data from multiple, heterogeneous, and external sources
Data cleaning detect errors in the data and rectify them when possible
Data transformation convert data from legacy or host format to warehouse format
Refresh propagate the updates from the data sources to the
warehouse
April 19, 2023Data Mining: Concepts and
Techniques 55
Metadata Repository Metadata are data about data. Meta data is the data defining warehouse objects. Meta data are created for the data names and definitions of
the given warehouses.
It stores: Description of the structure of the data warehouse
schema, view, dimensions, hierarchies, derived data definition, data mart locations and contents
Operational meta-data data lineage (history of migrated data and transformation
path), currency of data (active, archived, or purged), monitoring information (warehouse usage statistics, error reports, audit trails)
The algorithms used for summarization
The mapping from operational environment to the data warehouse
includes source databases and their contents, gateway
descriptions, data partitions, data extraction, cleaning
,transformation rules and defaults, data refresh, security.
Data related to system performance Indices and profile which increase data access and retrival
system performance, timing and scheduling of refresh, update and replication cycle
Business data business terms and definitions, ownership of data, charging
policies
April 19, 2023Data Mining: Concepts and
Techniques 56
April 19, 2023Data Mining: Concepts and
Techniques 57
OLAP Server Architectures
Relational OLAP (ROLAP) Intermediate servers that stand in between a relational back-
end server and client front end server. Use relational or extended-relational DBMS to store and
manage warehouse data and OLAP middle ware Include optimization of DBMS backend, implementation of
aggregation navigation logic, and additional tools and services
Greater scalability than MLOAP technology.
Multidimensional OLAP (MOLAP) Sparse array-based multidimensional storage engine Allows Fast indexing to pre-computed summarized data
Hybrid OLAP (HOLAP) (e.g., Microsoft SQLServer)
Combines ROLAP and MOLAP technology, benefiting greater
scalability of ROLAP and faster computation of MOLAP. Allow large volume of detail data to be stored in a relational
database, while aggregattion are stored in separate MOLAP store.
Microsoft SQL server 2000 supports a HOLAP server.
Specialized SQL servers (e.g., Redbricks) To meet the growing demand of OLAP processing in relational
databases Specialized support for SQL queries over star/snowflake
schemas
April 19, 2023Data Mining: Concepts and
Techniques 58
April 19, 2023Data Mining: Concepts and
Techniques 59
Chapter 3: Data Warehousing and OLAP Technology: An Overview
What is a data warehouse?
A multi-dimensional data model
Data warehouse architecture
Data warehouse implementation
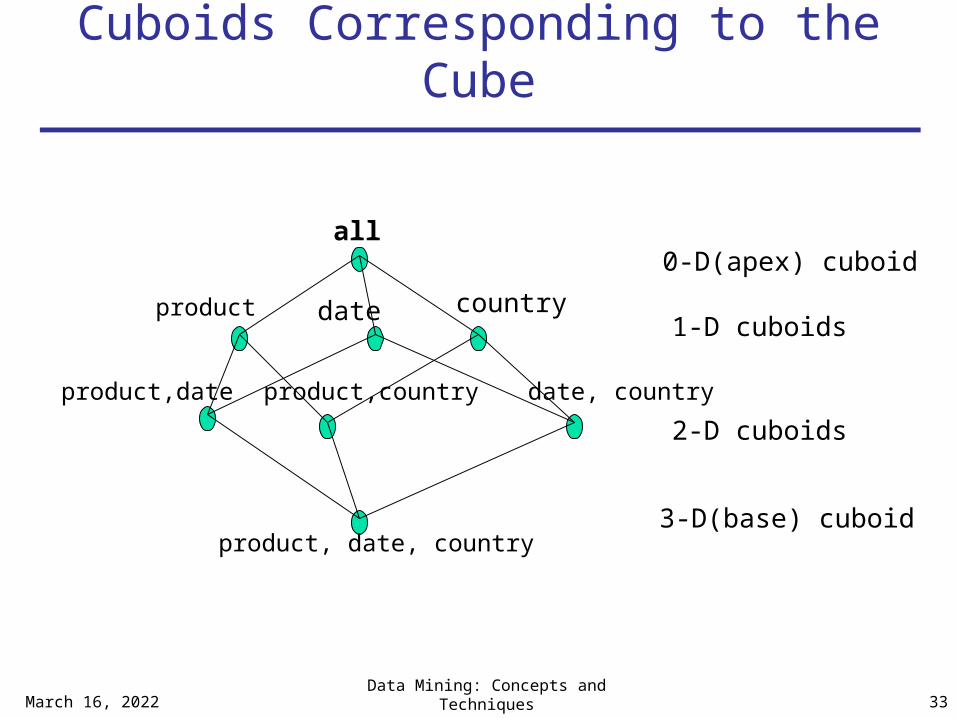
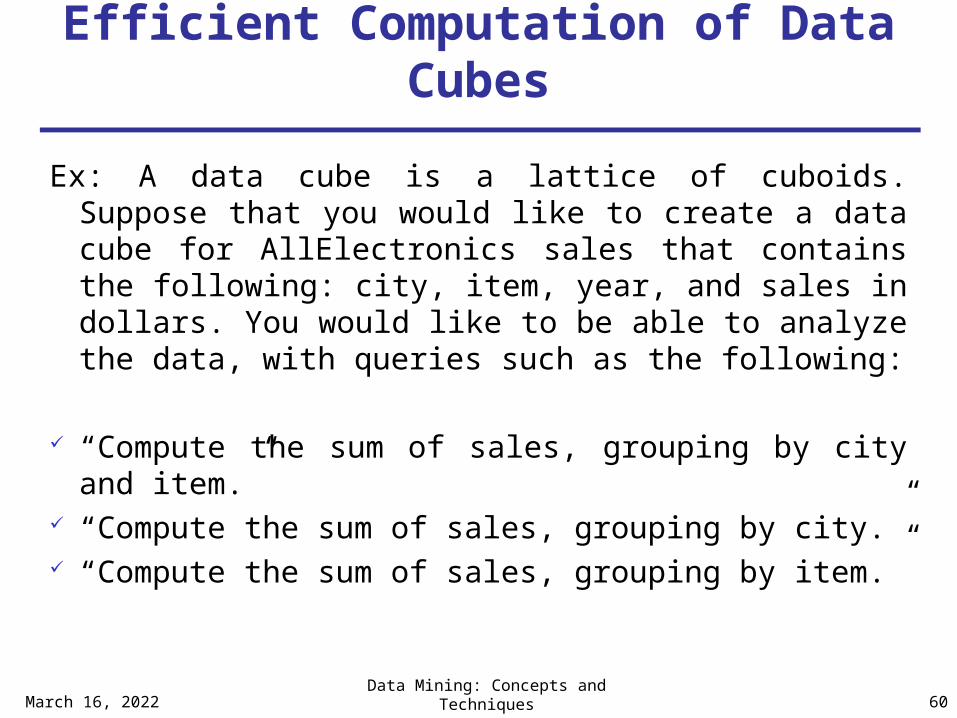
Efficient Computation of Data Cubes
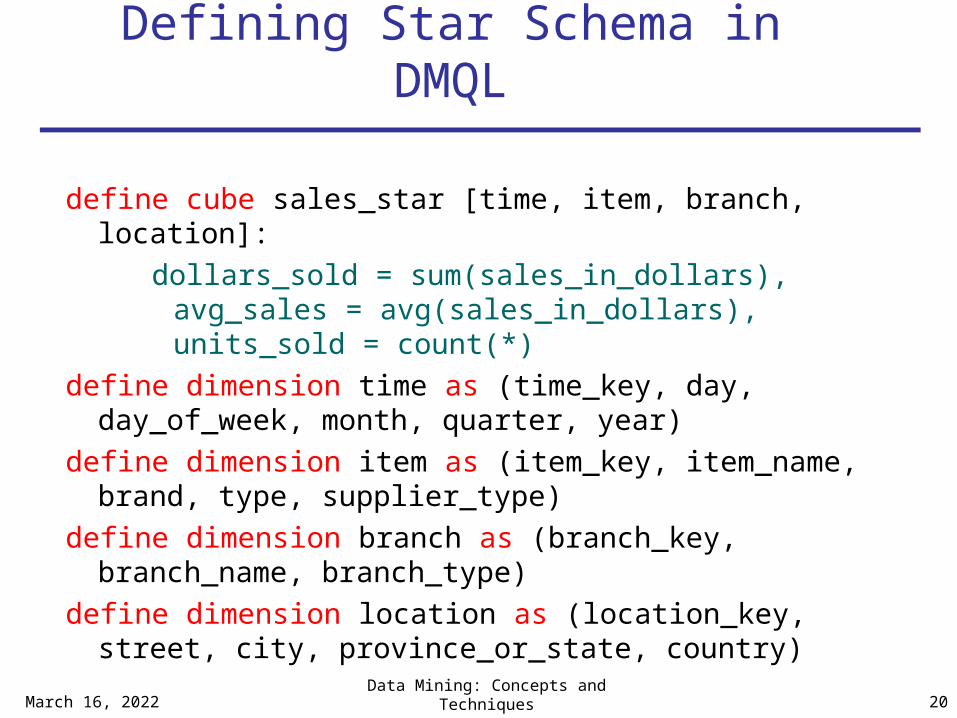
Ex: A data cube is a lattice of cuboids. Suppose that you would like to create a data cube for AllElectronics sales that contains the following: city, item, year, and sales in dollars. You would like to be able to analyze the data, with queries such as the following:
“Compute the sum of sales, grouping by city and item.”
“Compute the sum of sales, grouping by city.” “Compute the sum of sales, grouping by item.”
April 19, 2023Data Mining: Concepts and
Techniques 60
On-line analytical processing may need to access different cuboids for different queries.
Therefore, it may seem like a good idea to compute all or at least some of the cuboids in a data cube in advance.
Precomputation leads to fast response time and avoids some redundant computation.
A major challenge related to this precomputation, however, is that the required storage space especially when the cube has many dimensions.
“How many cuboids are there in an n-dimensional data cube?”
If there were no hierarchies associated with each dimension, then the total number of cuboids for an n-dimensional data cube, as we have seen above,
is 2^n Otherwise
where Li is the number of levels associated with dimension i. One is added to Li to include the virtual top level, all.
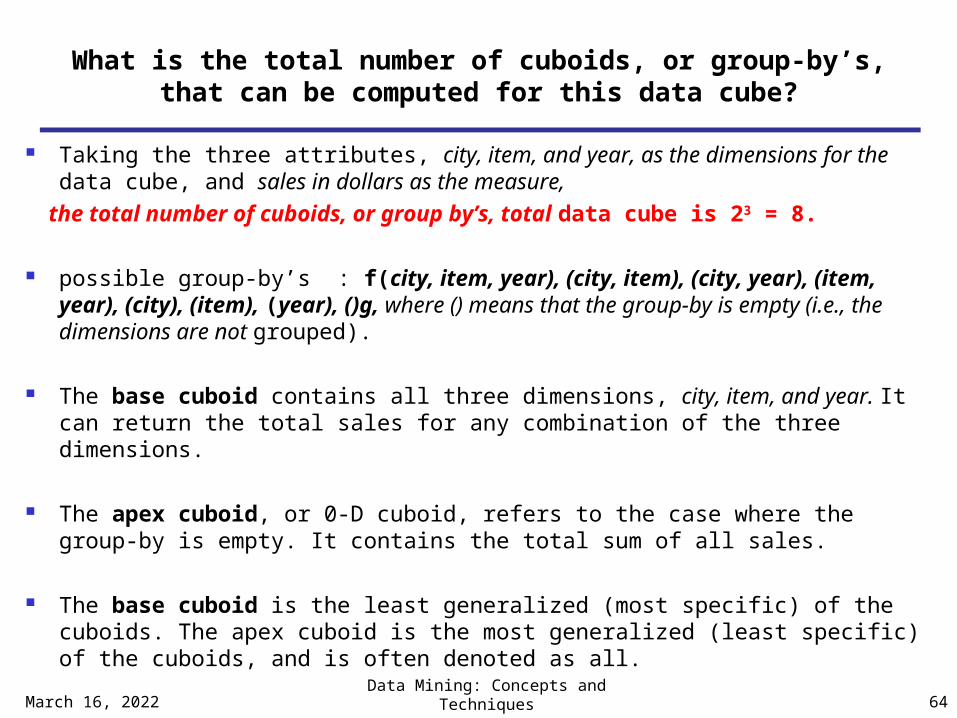
What is the total number of cuboids, or group-by’s, that can be computed for this data cube?
Taking the three attributes, city, item, and year, as the dimensions for the data cube, and sales in dollars as the measure,
the total number of cuboids, or group by’s, total data cube is 23 = 8.
possible group-by’s : f(city, item, year), (city, item), (city, year), (item, year), (city), (item), (year), ()g, where () means that the group-by is empty (i.e., the dimensions are not grouped).
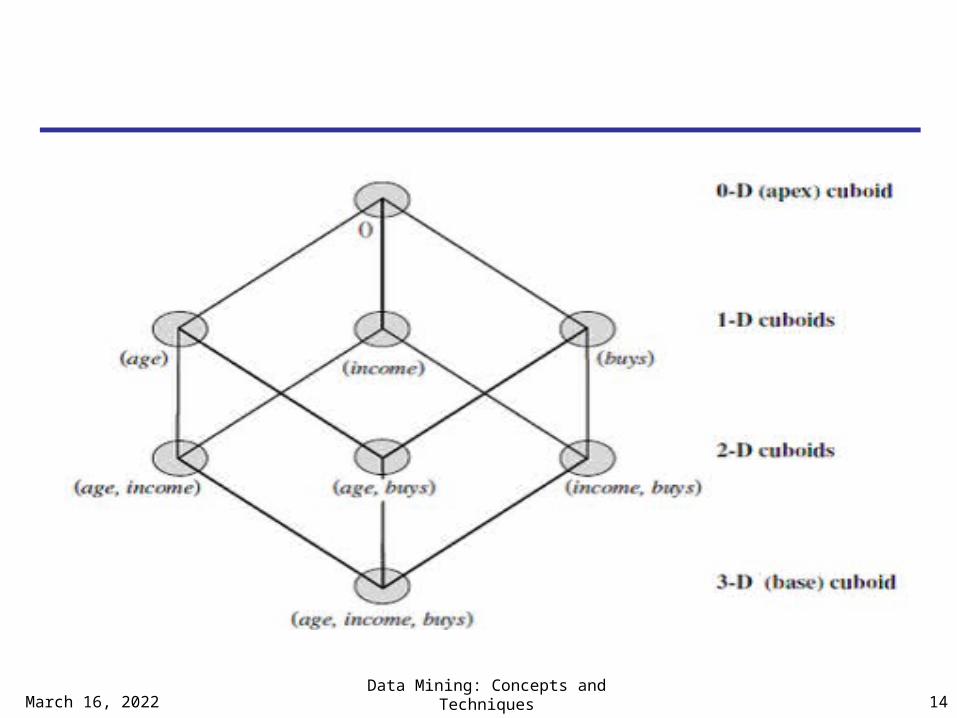
The base cuboid contains all three dimensions, city, item, and year. It can return the total sales for any combination of the three dimensions.
The apex cuboid, or 0-D cuboid, refers to the case where the group-by is empty. It contains the total sum of all sales.
The base cuboid is the least generalized (most specific) of the cuboids. The apex cuboid is the most generalized (least specific) of the cuboids, and is often denoted as all.
April 19, 2023Data Mining: Concepts and
Techniques 64
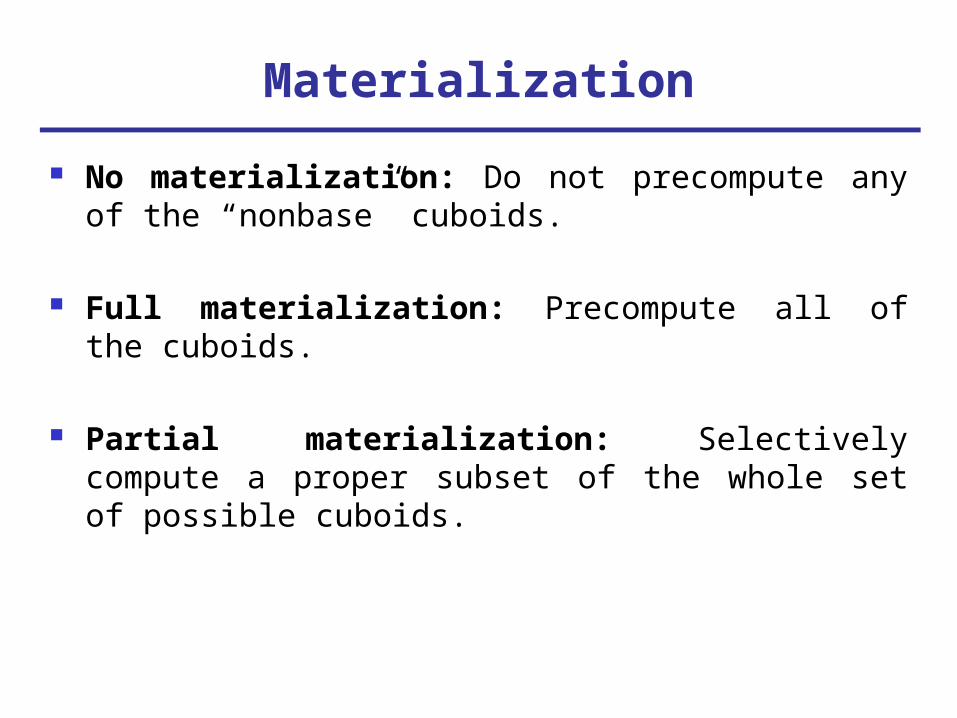
Materialization
No materialization: Do not precompute any of the “nonbase” cuboids.
Full materialization: Precompute all of the cuboids.
Partial materialization: Selectively compute a proper subset of the whole set of possible cuboids.
The partial materialization of cuboids or subcubes should consider three factors:
(1) identify the subset of cuboids or subcubes to materialize;
(2) exploit the materialized cuboids or subcubes during query processing; and
(3) efficiently update the materialized cuboids or subcubes during load and refresh.
April 19, 2023Data Mining: Concepts and
Techniques 67
Indexing OLAP Data: Bitmap Index
Index on a particular column Each value in the column has a bit vector: bit-op is fast The length of the bit vector: # of records in the base table The i-th bit is set if the i-th row of the base table has the
value for the indexed column not suitable for high cardinality domains
Cust Region TypeC1 Asia RetailC2 Europe DealerC3 Asia DealerC4 America RetailC5 Europe Dealer