Page 1
Press Release from the Atlas Copco Group
Atlas Copco Group Center
Atlas Copco AB Visitors address: Telephone: +46 8 743 8000 A Public Company (publ)
SE-105 23 Stockholm Sickla Industriväg 19 www.atlascopcogroup.com Reg. No: 556014-2720
Sweden Nacka Reg. Office Nacka
January 27, 2017
Atlas Copco Interim report on Q4 and full-year summary 2016 (unaudited)
Strong end to a solid year The figures presented in this report refer to continuing operations unless otherwise stated
Orders increased 19% to MSEK 27 617 (23 206), organic growth of 7%
Revenues increased 14% to MSEK 28 495 (25 003), organic growth of 2%
Operating profit increased 18% to MSEK 5 785 (4 882), corresponding to a margin of 20.3% (19.5)
Adjusted operating profit, excluding items affecting comparability, was MSEK 5 849 (4 977)
Profit before tax amounted to MSEK 5 618 (4 704)
Reported earnings per share were SEK 3.49 (0.89)
Previous year includes a negative effect of SEK 2.30 from the large Belgian tax provision
Record strong operating cash flow at MSEK 6 537 (5 355), including discontinued operations
Proposed dividend of SEK 6.80 (6.30) per share, paid in two installments
Mats Rahmström was appointed new President and CEO of Atlas Copco AB, effective April 27, 2017
Proposal for AGM 2018 to split the group in two parts, one industrial and one mining/civil engineering
Divestment of Road Construction Equipment division
MSEK 2016 2015 2016 2015
Orders received 27 617 23 206 19% 102 812 97 002 6%
Revenues 28 495 25 003 14% 101 356 98 973 2%
Operating profit 5 785 4 882 18% 19 798 19 772 0%
– as a percentage of revenues 20.3 19.5 19.5 20.0
Profit before tax 5 618 4 704 19% 18 805 18 875 0%
– as a percentage of revenues 19.7 18.8 18.6 19.1
Profit for the period from
continuing operations 4 254 1 078 295% 13 785 11 777 17%
Loss for the period from
discontinued operations -1 793 -48 -1 837 -54
Profit for the period 2 461 1 030 139% 11 948 11 723 2%
Basic earnings per share, SEK 2.01 0.85 1) 9.81 9.62 1)
- of which continuing operations 3.49 0.89 1) 11.32 9.67 1)
Diluted earnings per share, SEK 2.01 0.85 1) 9.79 9.58 1)
- of which continuing operations 3.48 0.89 1) 11.30 9.62 1)
Return on capital employed, % 262)
272)
1) Effect of SEK -2.30 from the Belgian tax provision
2) Estimated for continuing operations
October - December January - December
Near-term demand outlook The overall demand for the Group is expected to improve somewhat.
Previous near-term demand outlook (published October 20, 2016):
The overall demand for the Group is expected to remain at current level.
Page 2
Atlas Copco – Q4 2016 2 (20)
Atlas Copco Group – Summary of full-year 2016 Orders and revenues
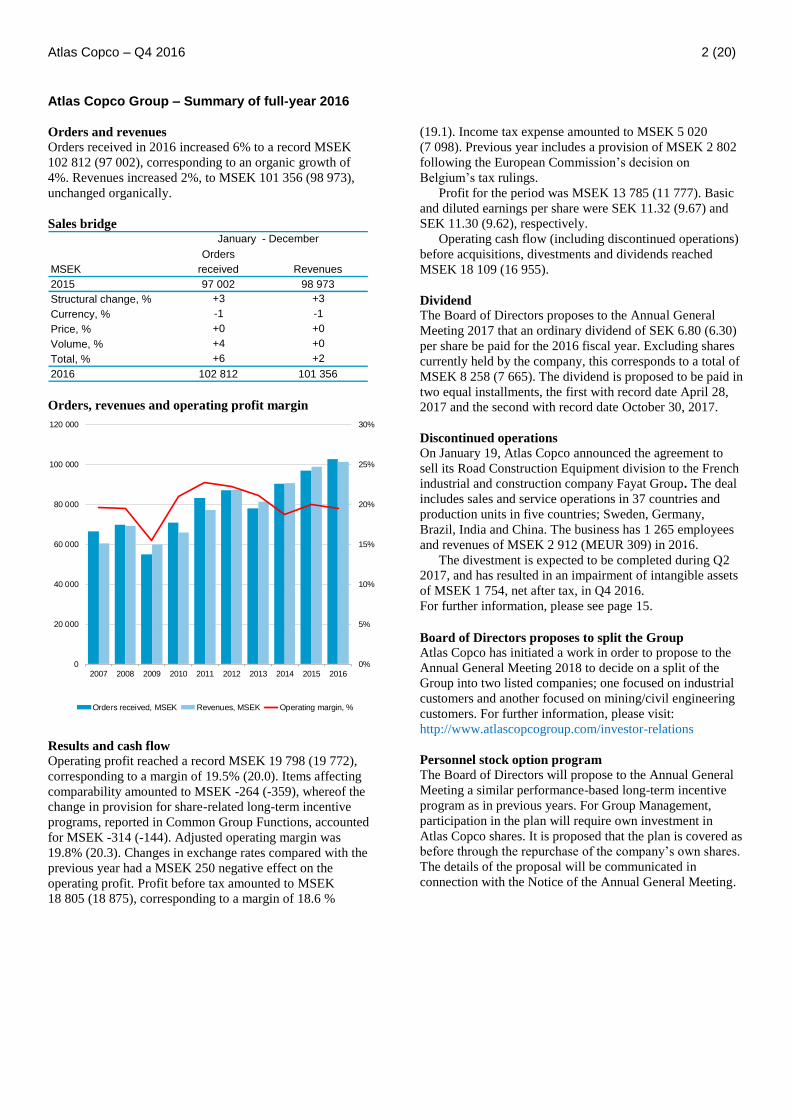
Orders received in 2016 increased 6% to a record MSEK
102 812 (97 002), corresponding to an organic growth of
4%. Revenues increased 2%, to MSEK 101 356 (98 973),
unchanged organically.
Sales bridge
Orders
MSEK received Revenues
2015 97 002 98 973
Structural change, % +3 +3
Currency, % -1 -1
Price, % +0 +0
Volume, % +4 +0
Total, % +6 +2
2016 102 812 101 356
January - December
Orders, revenues and operating profit margin
0%
5%
10%
15%
20%
25%
30%
0
20 000
40 000
60 000
80 000
100 000
120 000
2007 2008 2009 2010 2011 2012 2013 2014 2015 2016
Orders received, MSEK Revenues, MSEK Operating margin, %
Results and cash flow
Operating profit reached a record MSEK 19 798 (19 772),
corresponding to a margin of 19.5% (20.0). Items affecting
comparability amounted to MSEK -264 (-359), whereof the
change in provision for share-related long-term incentive
programs, reported in Common Group Functions, accounted
for MSEK -314 (-144). Adjusted operating margin was
19.8% (20.3). Changes in exchange rates compared with the
previous year had a MSEK 250 negative effect on the
operating profit. Profit before tax amounted to MSEK
18 805 (18 875), corresponding to a margin of 18.6 %
(19.1). Income tax expense amounted to MSEK 5 020
(7 098). Previous year includes a provision of MSEK 2 802
following the European Commission’s decision on
Belgium’s tax rulings.
Profit for the period was MSEK 13 785 (11 777). Basic
and diluted earnings per share were SEK 11.32 (9.67) and
SEK 11.30 (9.62), respectively.
Operating cash flow (including discontinued operations)
before acquisitions, divestments and dividends reached
MSEK 18 109 (16 955).
Dividend The Board of Directors proposes to the Annual General
Meeting 2017 that an ordinary dividend of SEK 6.80 (6.30)
per share be paid for the 2016 fiscal year. Excluding shares
currently held by the company, this corresponds to a total of
MSEK 8 258 (7 665). The dividend is proposed to be paid in
two equal installments, the first with record date April 28,
2017 and the second with record date October 30, 2017.
Discontinued operations
On January 19, Atlas Copco announced the agreement to
sell its Road Construction Equipment division to the French
industrial and construction company Fayat Group. The deal
includes sales and service operations in 37 countries and
production units in five countries; Sweden, Germany,
Brazil, India and China. The business has 1 265 employees
and revenues of MSEK 2 912 (MEUR 309) in 2016.
The divestment is expected to be completed during Q2
2017, and has resulted in an impairment of intangible assets
of MSEK 1 754, net after tax, in Q4 2016.
For further information, please see page 15.
Board of Directors proposes to split the Group
Atlas Copco has initiated a work in order to propose to the
Annual General Meeting 2018 to decide on a split of the
Group into two listed companies; one focused on industrial
customers and another focused on mining/civil engineering
customers. For further information, please visit:
http://www.atlascopcogroup.com/investor-relations
Personnel stock option program
The Board of Directors will propose to the Annual General
Meeting a similar performance-based long-term incentive
program as in previous years. For Group Management,
participation in the plan will require own investment in
Atlas Copco shares. It is proposed that the plan is covered as
before through the repurchase of the company’s own shares.
The details of the proposal will be communicated in
connection with the Notice of the Annual General Meeting.
Page 3
Atlas Copco – Q4 2016 3 (20)
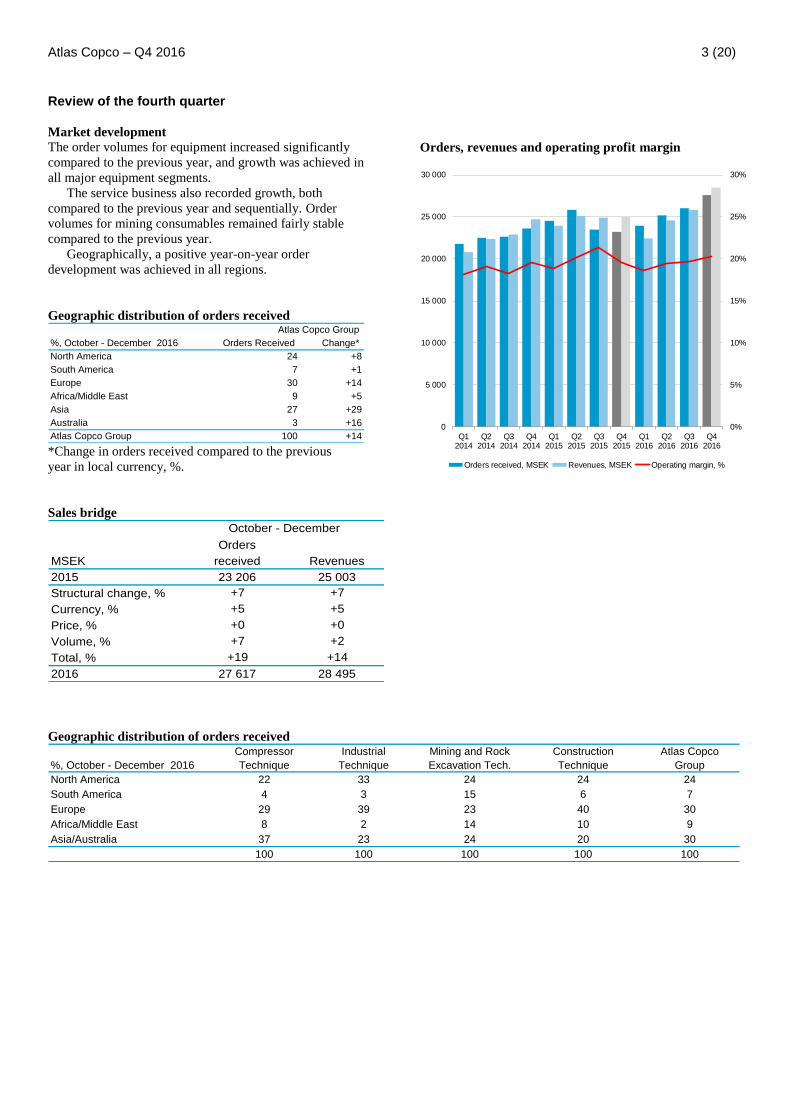
Review of the fourth quarter Market development
The order volumes for equipment increased significantly
compared to the previous year, and growth was achieved in
all major equipment segments.
The service business also recorded growth, both
compared to the previous year and sequentially. Order
volumes for mining consumables remained fairly stable
compared to the previous year.
Geographically, a positive year-on-year order
development was achieved in all regions.
Geographic distribution of orders received
%, October - December 2016 Orders Received Change*
North America 24 +8
South America 7 +1
Europe 30 +14
Africa/Middle East 9 +5
Asia 27 +29
Australia 3 +16
Atlas Copco Group 100 +14
Atlas Copco Group
*Change in orders received compared to the previous
year in local currency, %.
Sales bridge
Orders
MSEK received Revenues
2015 23 206 25 003
Structural change, % +7 +7
Currency, % +5 +5
Price, % +0 +0
Volume, % +7 +2
Total, % +19 +14
2016 27 617 28 495
October - December
Orders, revenues and operating profit margin
0%
5%
10%
15%
20%
25%
30%
0
5 000
10 000
15 000
20 000
25 000
30 000
Q12014
Q22014
Q32014
Q42014
Q12015
Q22015
Q32015
Q42015
Q12016
Q22016
Q32016
Q42016
Orders received, MSEK Revenues, MSEK Operating margin, %
Geographic distribution of orders received Compressor Industrial Mining and Rock Construction Atlas Copco
%, October - December 2016 Technique Technique Excavation Tech. Technique Group
North America 22 33 24 24 24
South America 4 3 15 6 7
Europe 29 39 23 40 30
Africa/Middle East 8 2 14 10 9
Asia/Australia 37 23 24 20 30
100 100 100 100 100
Page 4
Atlas Copco – Q4 2016 4 (20)
Revenues, profits and returns
Revenues increased 14% to MSEK 28 495 (25 003),
corresponding to a 2% organic increase. The currency
translation effect was +5%.
The operating profit increased 18% to MSEK 5 785
(4 882) and includes items affecting comparability of MSEK
-64 (-95). The MSEK -64 consists of a net MSEK +50 in
Compressor Technique (a release of pension provision
related to the acquisition of Edwards and restructuring
costs), and MSEK -114 (-40) from a change in provision for
share-related long-term incentive programs, reported in
Common Group Functions.
The adjusted operating profit of MSEK 5 849 (4 977),
corresponds to a margin of 20.5% (19.9). The net currency
effect compared to the previous year was positive at MSEK
500, mainly due to a stronger USD.
Net financial items were MSEK -167 (-178). Interest net
was MSEK -200 (-190). Other financial items were MSEK
33 (+12).
Profit before tax amounted to MSEK 5 618 (4 704),
corresponding to a margin of 19.7% (18.8).
Income tax expense amounted to MSEK 1 364 (3 626).
Previous year includes a provision of MSEK 2 802
following the European Commission’s decision on
Belgium’s tax rulings.
Profit for the period was MSEK 4 254 (1 078). Basic and
diluted earnings per share were SEK 3.49 (0.89) and SEK
3.48 (0.89), respectively. Adjusted for the tax provision,
profit for the period and basic earnings per share in 2015
were MSEK 3 880 and SEK 3.19, respectively.
The return on capital employed during the last 12
months was 26% (27). Return on equity was 24% (24). The
Group uses a weighted average cost of capital (WACC) of
8.0% as an investment and overall performance benchmark.
Operating cash flow and investments
(including discontinued operations)
Operating cash surplus reached MSEK 7 071 (5 914). Cash
flows from financial items were MSEK -450 (-855). The
main explanation, this quarter as well as previous year, is
negative cash flows from currency hedges of loans of
MSEK -526 (-621) where the offsetting cash flow from the
loans occurs in the future. Working capital decreased by
MSEK 1 155 (1 381), primarily due to a reduction of
inventory. Net investments in rental equipment were MSEK
171 (221). Net investments in property, plant and equipment
were MSEK 349 (424).
In total, operating cash flow, adjusted for currency
hedges of loans, reached a record MSEK 6 537 (5 355). The
contribution from discontinued operations was insignificant.
Net indebtedness
The Group’s net indebtedness, adjusted for the fair value of
interest rate swaps, amounted to MSEK 14 829 (14 805), of
which MSEK 3 907 (2 225) was attributable to post-
employment benefits. The Group has an average maturity of
5.7 years on interest-bearing liabilities. The net
debt/EBITDA ratio was 0.6 (0.6). The net debt/equity ratio
was 28% (32).
Acquisition and divestment of own shares
During the quarter, 2 833 985 A shares, net, were acquired
and 61 220 B shares, net, were divested for a total net value
of MSEK 781. These transactions are in accordance with
mandates granted by the Annual General Meeting and relate
to the Group’s long-term incentive programs.
Employees On December 31, 2016, the number of employees was
44 695 (41 852). The number of consultants/external
workforce was 3 300 (2 804). For comparable units, the total
workforce increased by 228 from December 31, 2015.
Revenues and operating profit – bridge
Volume, price, One-time items Share based
MSEK Q4 2016 mix and other Currency Acquisitions LTI programs Q4 2015
Atlas Copco Group
Revenues 28 495 572 1 135 1 785 - 25 003
Operating profit 5 785 284 500 193 -74 4 882
% 20.3% 49.7% 19.5%
Page 5
Atlas Copco – Q4 2016 5 (20)
Compressor Technique
MSEK 2016 2015 2016 2015
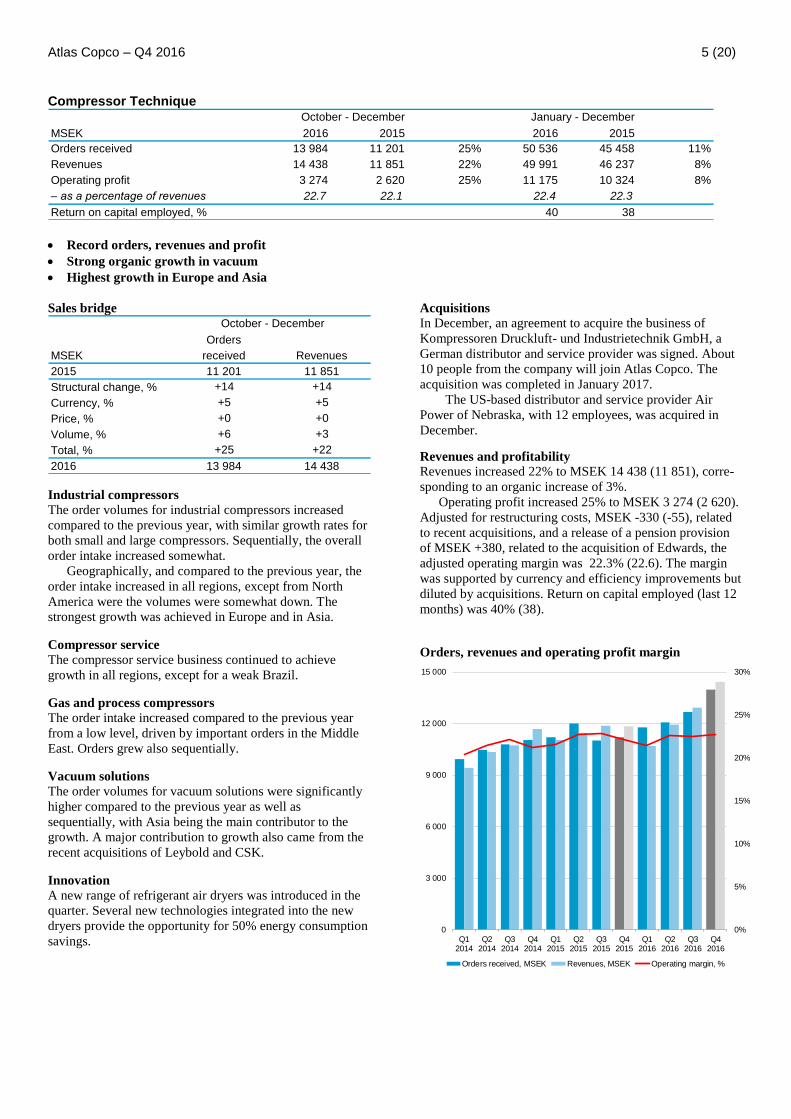
Orders received 13 984 11 201 25% 50 536 45 458 11%
Revenues 14 438 11 851 22% 49 991 46 237 8%
Operating profit 3 274 2 620 25% 11 175 10 324 8%
– as a percentage of revenues 22.7 22.1 22.4 22.3
Return on capital employed, % 40 38
October - December January - December
Record orders, revenues and profit
Strong organic growth in vacuum
Highest growth in Europe and Asia
Sales bridge
Orders
MSEK received Revenues
2015 11 201 11 851
Structural change, % +14 +14
Currency, % +5 +5
Price, % +0 +0
Volume, % +6 +3
Total, % +25 +22
2016 13 984 14 438
October - December
Industrial compressors
The order volumes for industrial compressors increased
compared to the previous year, with similar growth rates for
both small and large compressors. Sequentially, the overall
order intake increased somewhat.
Geographically, and compared to the previous year, the
order intake increased in all regions, except from North
America were the volumes were somewhat down. The
strongest growth was achieved in Europe and in Asia.
Compressor service
The compressor service business continued to achieve
growth in all regions, except for a weak Brazil.
Gas and process compressors
The order intake increased compared to the previous year
from a low level, driven by important orders in the Middle
East. Orders grew also sequentially.
Vacuum solutions The order volumes for vacuum solutions were significantly
higher compared to the previous year as well as
sequentially, with Asia being the main contributor to the
growth. A major contribution to growth also came from the
recent acquisitions of Leybold and CSK.
Innovation
A new range of refrigerant air dryers was introduced in the
quarter. Several new technologies integrated into the new
dryers provide the opportunity for 50% energy consumption
savings.
Acquisitions
In December, an agreement to acquire the business of
Kompressoren Druckluft- und Industrietechnik GmbH, a
German distributor and service provider was signed. About
10 people from the company will join Atlas Copco. The
acquisition was completed in January 2017.
The US-based distributor and service provider Air
Power of Nebraska, with 12 employees, was acquired in
December.
Revenues and profitability
Revenues increased 22% to MSEK 14 438 (11 851), corre-
sponding to an organic increase of 3%.
Operating profit increased 25% to MSEK 3 274 (2 620).
Adjusted for restructuring costs, MSEK -330 (-55), related
to recent acquisitions, and a release of a pension provision
of MSEK +380, related to the acquisition of Edwards, the
adjusted operating margin was 22.3% (22.6). The margin
was supported by currency and efficiency improvements but
diluted by acquisitions. Return on capital employed (last 12
months) was 40% (38).
Orders, revenues and operating profit margin
0%
5%
10%
15%
20%
25%
30%
0
3 000
6 000
9 000
12 000
15 000
Q12014
Q22014
Q32014
Q42014
Q12015
Q22015
Q32015
Q42015
Q12016
Q22016
Q32016
Q42016
Orders received, MSEK Revenues, MSEK Operating margin, %
Page 6
Atlas Copco – Q4 2016 6 (20)
Industrial Technique
MSEK 2016 2015 2016 2015
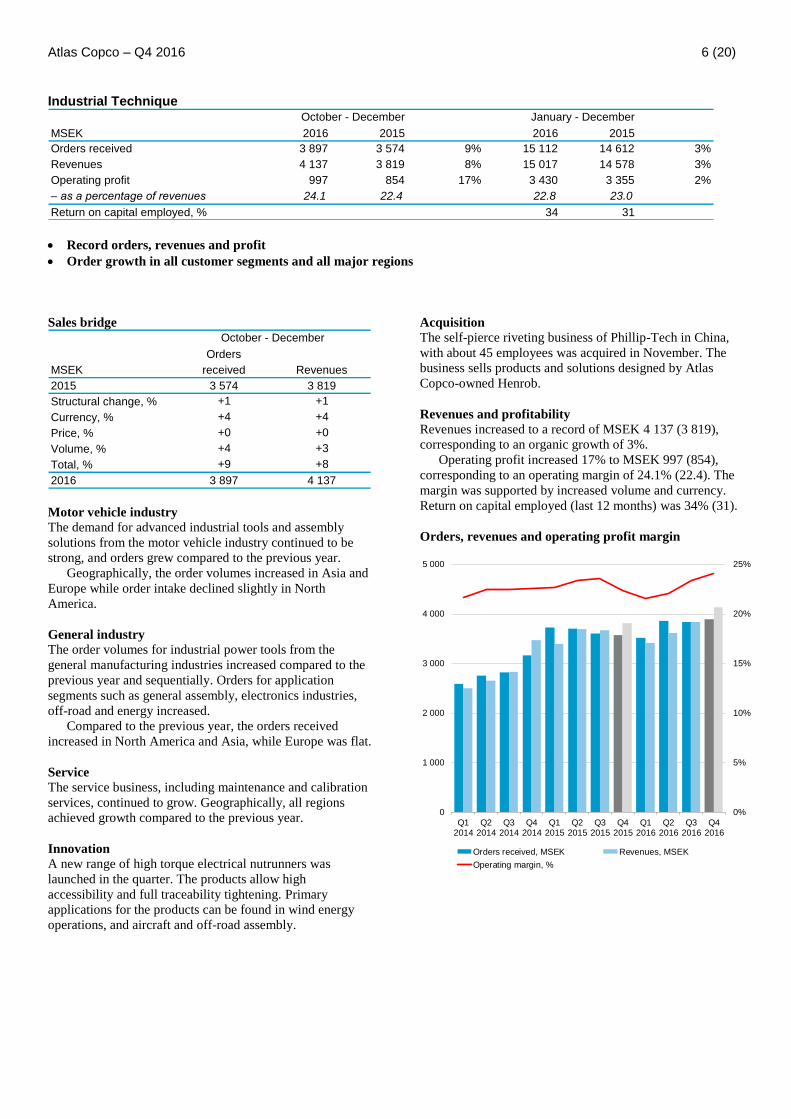
Orders received 3 897 3 574 9% 15 112 14 612 3%
Revenues 4 137 3 819 8% 15 017 14 578 3%
Operating profit 997 854 17% 3 430 3 355 2%
– as a percentage of revenues 24.1 22.4 22.8 23.0
Return on capital employed, % 34 31
January - December October - December
Record orders, revenues and profit
Order growth in all customer segments and all major regions
Sales bridge
Orders
MSEK received Revenues
2015 3 574 3 819
Structural change, % +1 +1
Currency, % +4 +4
Price, % +0 +0
Volume, % +4 +3
Total, % +9 +8
2016 3 897 4 137
October - December
Motor vehicle industry
The demand for advanced industrial tools and assembly
solutions from the motor vehicle industry continued to be
strong, and orders grew compared to the previous year.
Geographically, the order volumes increased in Asia and
Europe while order intake declined slightly in North
America.
General industry
The order volumes for industrial power tools from the
general manufacturing industries increased compared to the
previous year and sequentially. Orders for application
segments such as general assembly, electronics industries,
off-road and energy increased.
Compared to the previous year, the orders received
increased in North America and Asia, while Europe was flat.
Service
The service business, including maintenance and calibration
services, continued to grow. Geographically, all regions
achieved growth compared to the previous year.
Innovation A new range of high torque electrical nutrunners was
launched in the quarter. The products allow high
accessibility and full traceability tightening. Primary
applications for the products can be found in wind energy
operations, and aircraft and off-road assembly.
Acquisition The self-pierce riveting business of Phillip-Tech in China,
with about 45 employees was acquired in November. The
business sells products and solutions designed by Atlas
Copco-owned Henrob.
Revenues and profitability
Revenues increased to a record of MSEK 4 137 (3 819),
corresponding to an organic growth of 3%.
Operating profit increased 17% to MSEK 997 (854),
corresponding to an operating margin of 24.1% (22.4). The
margin was supported by increased volume and currency.
Return on capital employed (last 12 months) was 34% (31).
Orders, revenues and operating profit margin
0%
5%
10%
15%
20%
25%
0
1 000
2 000
3 000
4 000
5 000
Q12014
Q22014
Q32014
Q42014
Q12015
Q22015
Q32015
Q42015
Q12016
Q22016
Q32016
Q42016
Orders received, MSEK Revenues, MSEK
Operating margin, %
Page 7
Atlas Copco – Q4 2016 7 (20)
Mining and Rock Excavation Technique
MSEK 2016 2015 2016 2015
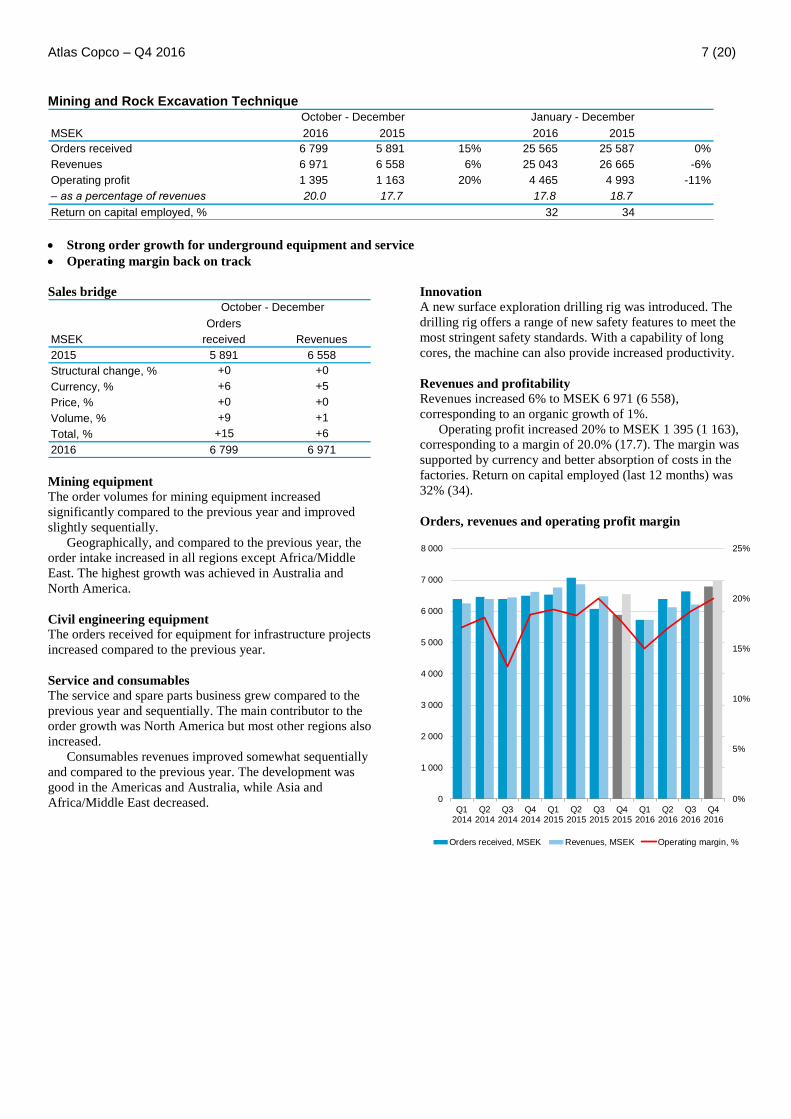
Orders received 6 799 5 891 15% 25 565 25 587 0%
Revenues 6 971 6 558 6% 25 043 26 665 -6%
Operating profit 1 395 1 163 20% 4 465 4 993 -11%
– as a percentage of revenues 20.0 17.7 17.8 18.7
Return on capital employed, % 32 34
October - December January - December
Strong order growth for underground equipment and service
Operating margin back on track
Sales bridge
Orders
MSEK received Revenues
2015 5 891 6 558
Structural change, % +0 +0
Currency, % +6 +5
Price, % +0 +0
Volume, % +9 +1
Total, % +15 +6
2016 6 799 6 971
October - December
Mining equipment
The order volumes for mining equipment increased
significantly compared to the previous year and improved
slightly sequentially.
Geographically, and compared to the previous year, the
order intake increased in all regions except Africa/Middle
East. The highest growth was achieved in Australia and
North America.
Civil engineering equipment The orders received for equipment for infrastructure projects
increased compared to the previous year.
Service and consumables
The service and spare parts business grew compared to the
previous year and sequentially. The main contributor to the
order growth was North America but most other regions also
increased.
Consumables revenues improved somewhat sequentially
and compared to the previous year. The development was
good in the Americas and Australia, while Asia and
Africa/Middle East decreased.
Innovation A new surface exploration drilling rig was introduced. The
drilling rig offers a range of new safety features to meet the
most stringent safety standards. With a capability of long
cores, the machine can also provide increased productivity.
Revenues and profitability
Revenues increased 6% to MSEK 6 971 (6 558),
corresponding to an organic growth of 1%.
Operating profit increased 20% to MSEK 1 395 (1 163),
corresponding to a margin of 20.0% (17.7). The margin was
supported by currency and better absorption of costs in the
factories. Return on capital employed (last 12 months) was
32% (34).
Orders, revenues and operating profit margin
0%
5%
10%
15%
20%
25%
0
1 000
2 000
3 000
4 000
5 000
6 000
7 000
8 000
Q12014
Q22014
Q32014
Q42014
Q12015
Q22015
Q32015
Q42015
Q12016
Q22016
Q32016
Q42016
Orders received, MSEK Revenues, MSEK Operating margin, %
Page 8
Atlas Copco – Q4 2016 8 (20)
Construction Technique
MSEK 2016 2015 2016 2015
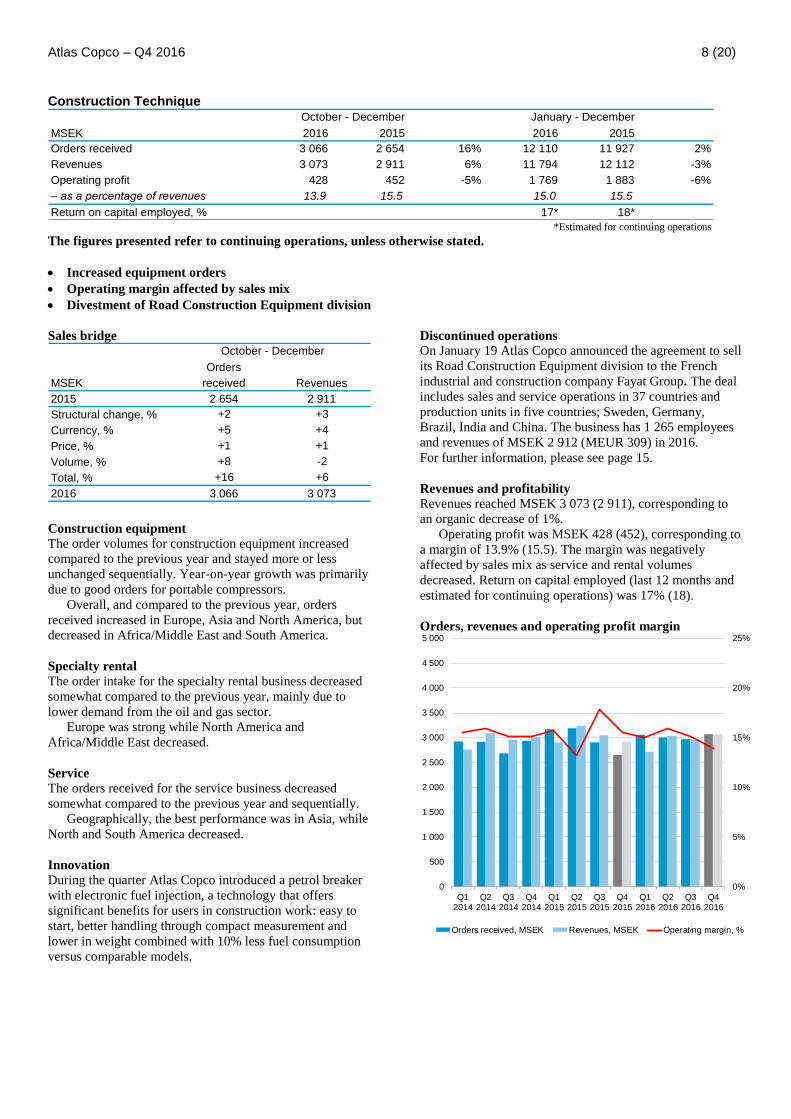
Orders received 3 066 2 654 16% 12 110 11 927 2%
Revenues 3 073 2 911 6% 11 794 12 112 -3%
Operating profit 428 452 -5% 1 769 1 883 -6%
– as a percentage of revenues 13.9 15.5 15.0 15.5
Return on capital employed, % 17* 18*
October - December January - December
*Estimated for continuing operations
The figures presented refer to continuing operations, unless otherwise stated.
Increased equipment orders
Operating margin affected by sales mix
Divestment of Road Construction Equipment division
Sales bridge
Orders
MSEK received Revenues
2015 2 654 2 911
Structural change, % +2 +3
Currency, % +5 +4
Price, % +1 +1
Volume, % +8 -2
Total, % +16 +6
2016 3 066 3 073
October - December
Construction equipment
The order volumes for construction equipment increased
compared to the previous year and stayed more or less
unchanged sequentially. Year-on-year growth was primarily
due to good orders for portable compressors.
Overall, and compared to the previous year, orders
received increased in Europe, Asia and North America, but
decreased in Africa/Middle East and South America.
Specialty rental
The order intake for the specialty rental business decreased
somewhat compared to the previous year, mainly due to
lower demand from the oil and gas sector.
Europe was strong while North America and
Africa/Middle East decreased.
Service
The orders received for the service business decreased
somewhat compared to the previous year and sequentially.
Geographically, the best performance was in Asia, while
North and South America decreased.
Innovation
During the quarter Atlas Copco introduced a petrol breaker
with electronic fuel injection, a technology that offers
significant benefits for users in construction work: easy to
start, better handling through compact measurement and
lower in weight combined with 10% less fuel consumption
versus comparable models.
Discontinued operations
On January 19 Atlas Copco announced the agreement to sell
its Road Construction Equipment division to the French
industrial and construction company Fayat Group. The deal
includes sales and service operations in 37 countries and
production units in five countries; Sweden, Germany,
Brazil, India and China. The business has 1 265 employees
and revenues of MSEK 2 912 (MEUR 309) in 2016.
For further information, please see page 15.
Revenues and profitability
Revenues reached MSEK 3 073 (2 911), corresponding to
an organic decrease of 1%.
Operating profit was MSEK 428 (452), corresponding to
a margin of 13.9% (15.5). The margin was negatively
affected by sales mix as service and rental volumes
decreased. Return on capital employed (last 12 months and
estimated for continuing operations) was 17% (18).
Orders, revenues and operating profit margin
0%
5%
10%
15%
20%
25%
0
500
1 000
1 500
2 000
2 500
3 000
3 500
4 000
4 500
5 000
Q12014
Q22014
Q32014
Q42014
Q12015
Q22015
Q32015
Q42015
Q12016
Q22016
Q32016
Q42016
Orders received, MSEK Revenues, MSEK Operating margin, %
Page 9
Atlas Copco – Q4 2016 9 (20)
Accounting principles
The consolidated accounts of the Atlas Copco Group are
prepared in accordance with International Financial
Reporting Standards (IFRS). The description of the
accounting principles and definitions are found in the annual
report 2015. The interim report is prepared in accordance
with IAS 34 Interim Financial Reporting. Non-IFRS
measures are also presented in the report since they are
considered to be important supplemental measures of the
company´s performance. For further information on how
these measures have been calculated, please visit:
http://www.atlascopcogroup.com/investor-relations
Risks and factors of uncertainty
Market risks
The demand for Atlas Copco’s equipment and services is
affected by changes in the customers’ investment and
production levels. A widespread financial crisis and
economic downturn affects the Group negatively both in
terms of revenues and profitability. However, the Group’s
sales are well diversified with customers in many industries
and countries around the world, which limits the risk.
Financial risks
Atlas Copco is subject to currency risks, interest rate risks,
tax risks, and other financial risks. In line with the overall
goals with respect to growth, return on capital, and
protecting creditors, Atlas Copco has adopted a policy to
control the financial risks to which the Group is exposed. A
financial risk management committee meets regularly to
manage and follow up financial risks, in line with the policy.
Production risks
Many components are sourced from sub-suppliers. The
availability is dependent on the sub-suppliers and if they
have interruptions or lack capacity, this may adversely affect
production. To minimize these risks, Atlas Copco has
established a global network of sub-suppliers, which means
that in most cases there are more than one sub-supplier that
can supply a certain component.
Atlas Copco is also directly and indirectly exposed to
raw material prices. Cost increases for raw materials and
components often coincide with strong end-customer
demand and can partly be offset by increased sales to
mining customers and partly compensated for by increased
market prices.
Acquisitions
Atlas Copco has the ambition to grow all its business areas,
primarily through organic growth, complemented by
selected acquisitions. The integration of acquired businesses
is a difficult process and it is not certain that every
integration will be successful. Therefore, costs related to
acquisitions can be higher and/or synergies can take longer
to materialize than anticipated.
For further information, see the annual report 2015.
Forward-looking statements
Some statements in this report are forward-looking, and the
actual outcome could be materially different. In addition to
the factors explicitly discussed, other factors could have a
material effect on the actual outcome. Such factors include,
but are not limited to, general business conditions,
fluctuations in exchange rates and interest rates, political
developments, the impact of competing products and their
pricing, product development, commercialization and
technological difficulties, interruptions in supply, and major
customer credit losses.
Atlas Copco AB
Atlas Copco AB and its subsidiaries are sometimes referred
to as the Atlas Copco Group, the Group or Atlas Copco.
Atlas Copco AB is also sometimes referred to as Atlas
Copco. Any mentioning of the Board of Directors or the
Directors refers to the Board of Directors of Atlas Copco
AB.
Page 10
Atlas Copco – Q4 2016 10 (20)
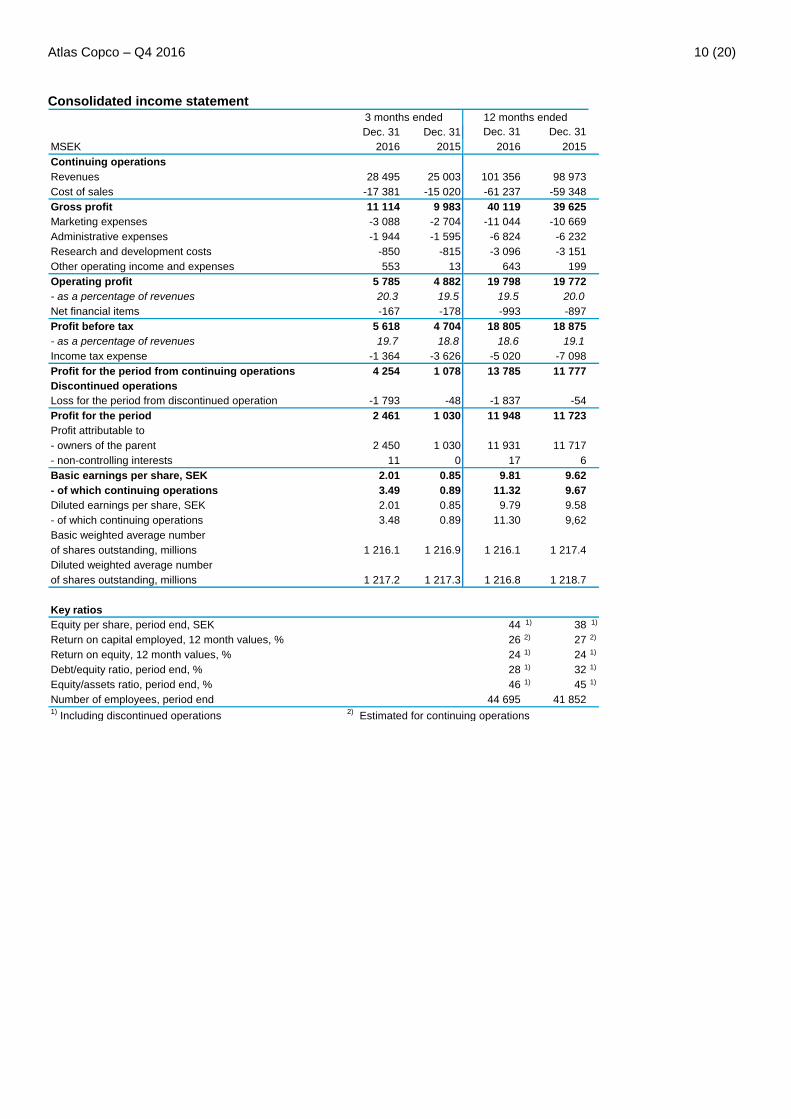
Consolidated income statement
Dec. 31 Dec. 31 Dec. 31 Dec. 31
MSEK 2016 2015 2016 2015
Continuing operations
Revenues 28 495 25 003 101 356 98 973
Cost of sales -17 381 -15 020 -61 237 -59 348
Gross profit 11 114 9 983 40 119 39 625
Marketing expenses -3 088 -2 704 -11 044 -10 669
Administrative expenses -1 944 -1 595 -6 824 -6 232
Research and development costs -850 -815 -3 096 -3 151
Other operating income and expenses 553 13 643 199
Operating profit 5 785 4 882 19 798 19 772
- as a percentage of revenues 20.3 19.5 19.5 20.0
Net financial items -167 -178 -993 -897
Profit before tax 5 618 4 704 18 805 18 875
- as a percentage of revenues 19.7 18.8 18.6 19.1
Income tax expense -1 364 -3 626 -5 020 -7 098
Profit for the period from continuing operations 4 254 1 078 13 785 11 777
Discontinued operations
Loss for the period from discontinued operation -1 793 -48 -1 837 -54
Profit for the period 2 461 1 030 11 948 11 723
Profit attributable to
- owners of the parent 2 450 1 030 11 931 11 717
- non-controlling interests 11 0 17 6
Basic earnings per share, SEK 2.01 0.85 9.81 9.62
- of which continuing operations 3.49 0.89 11.32 9.67
Diluted earnings per share, SEK 2.01 0.85 9.79 9.58
- of which continuing operations 3.48 0.89 11.30 9,62
Basic weighted average number
of shares outstanding, millions 1 216.1 1 216.9 1 216.1 1 217.4
Diluted weighted average number
of shares outstanding, millions 1 217.2 1 217.3 1 216.8 1 218.7
Key ratios
Equity per share, period end, SEK 44 1) 38 1)
Return on capital employed, 12 month values, % 26 2) 27 2)
Return on equity, 12 month values, % 24 1) 24 1)
Debt/equity ratio, period end, % 28 1) 32 1)
Equity/assets ratio, period end, % 46 1) 45 1)
Number of employees, period end 44 695 41 8521)
Including discontinued operations2)
Estimated for continuing operations
3 months ended 12 months ended
Page 11
Atlas Copco – Q4 2016 11 (20)
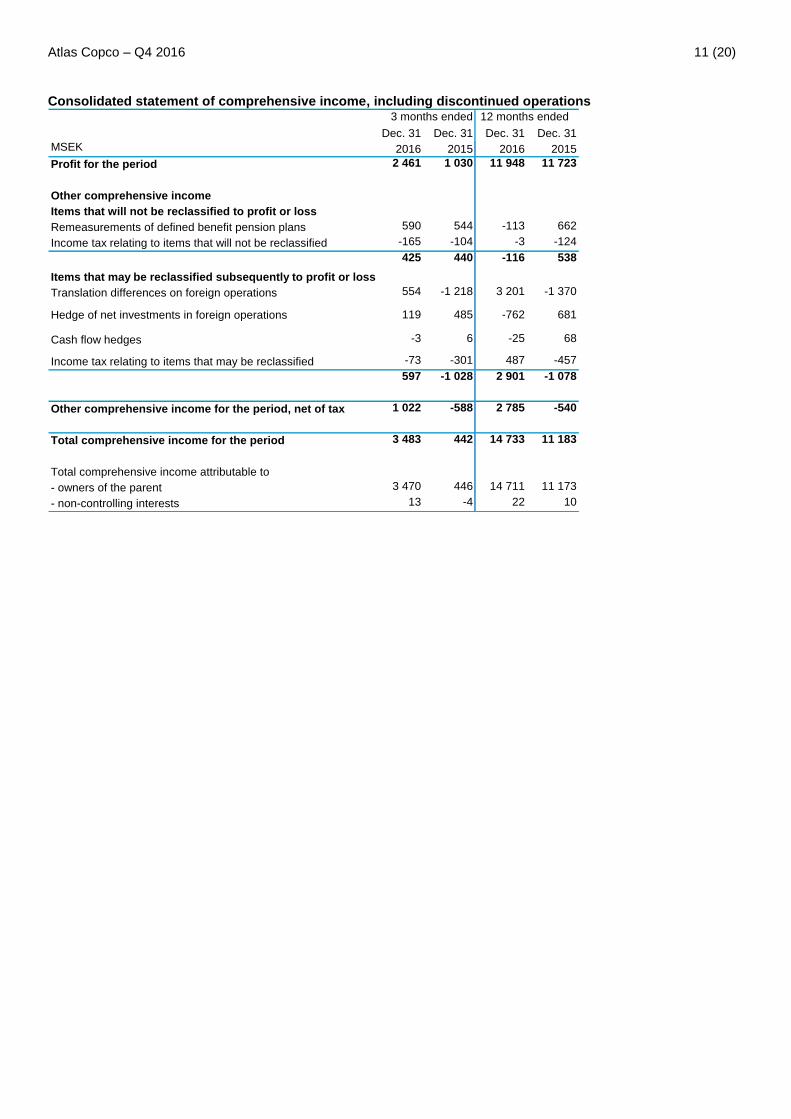
Consolidated statement of comprehensive income, including discontinued operations
Dec. 31 Dec. 31 Dec. 31 Dec. 31
MSEK 2016 2015 2016 2015
Profit for the period 2 461 1 030 11 948 11 723
Other comprehensive income
Items that will not be reclassified to profit or loss
Remeasurements of defined benefit pension plans 590 544 -113 662
Income tax relating to items that will not be reclassified -165 -104 -3 -124
425 440 -116 538
Items that may be reclassified subsequently to profit or loss
Translation differences on foreign operations 554 -1 218 3 201 -1 370
Hedge of net investments in foreign operations
Cash flow hedges -3 6 -25 68
Income tax relating to items that may be reclassified -73 -301 487 -457
597 -1 028 2 901 -1 078
Other comprehensive income for the period, net of tax 1 022 -588 2 785 -540
Total comprehensive income for the period 3 483 442 14 733 11 183
Total comprehensive income attributable to
- owners of the parent 3 470 446 14 711 11 173
- non-controlling interests 13 -4 22 10
3 months ended
119
12 months ended
-762 681485
Page 12
Atlas Copco – Q4 2016 12 (20)
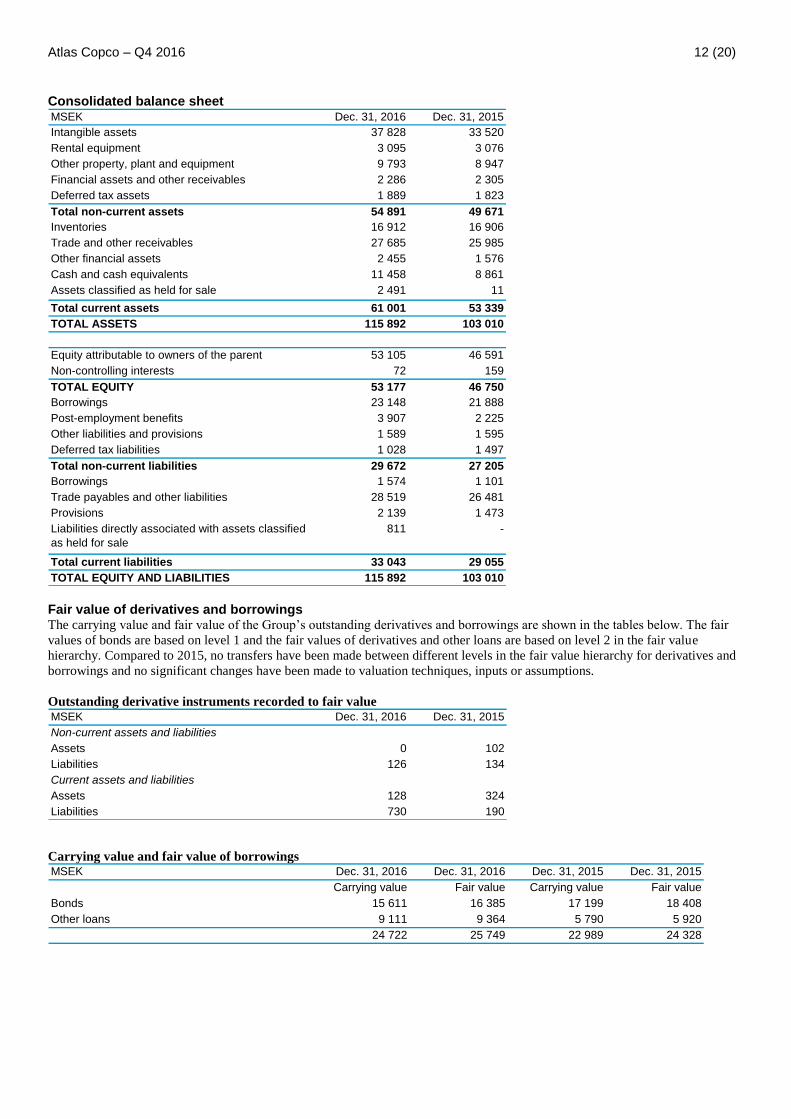
Consolidated balance sheet MSEK Dec. 31, 2016 Dec. 31, 2015
Intangible assets 37 828 33 520
Rental equipment 3 095 3 076
Other property, plant and equipment 9 793 8 947
Financial assets and other receivables 2 286 2 305
Deferred tax assets 1 889 1 823
Total non-current assets 54 891 49 671
Inventories 16 912 16 906
Trade and other receivables 27 685 25 985
Other financial assets 2 455 1 576
Cash and cash equivalents 11 458 8 861
Assets classified as held for sale 2 491 11
Total current assets 61 001 53 339
TOTAL ASSETS 115 892 103 010
Equity attributable to owners of the parent 53 105 46 591
Non-controlling interests 72 159
TOTAL EQUITY 53 177 46 750
Borrowings 23 148 21 888
Post-employment benefits 3 907 2 225
Other liabilities and provisions 1 589 1 595
Deferred tax liabilities 1 028 1 497
Total non-current liabilities 29 672 27 205
Borrowings 1 574 1 101
Trade payables and other liabilities 28 519 26 481
Provisions 2 139 1 473
Liabilities directly associated with assets classified
as held for sale
811 -
Total current liabilities 33 043 29 055
TOTAL EQUITY AND LIABILITIES 115 892 103 010 Fair value of derivatives and borrowings The carrying value and fair value of the Group’s outstanding derivatives and borrowings are shown in the tables below. The fair
values of bonds are based on level 1 and the fair values of derivatives and other loans are based on level 2 in the fair value
hierarchy. Compared to 2015, no transfers have been made between different levels in the fair value hierarchy for derivatives and
borrowings and no significant changes have been made to valuation techniques, inputs or assumptions.
Outstanding derivative instruments recorded to fair value MSEK Dec. 31, 2016 Dec. 31, 2015
Non-current assets and liabilities
Assets 0 102
Liabilities 126 134
Current assets and liabilities
Assets 128 324
Liabilities 730 190
Carrying value and fair value of borrowings MSEK Dec. 31, 2016 Dec. 31, 2016 Dec. 31, 2015 Dec. 31, 2015
Carrying value Fair value Carrying value Fair value
Bonds 15 611 16 385 17 199 18 408
Other loans 9 111 9 364 5 790 5 920
24 722 25 749 22 989 24 328
Page 13
Atlas Copco – Q4 2016 13 (20)
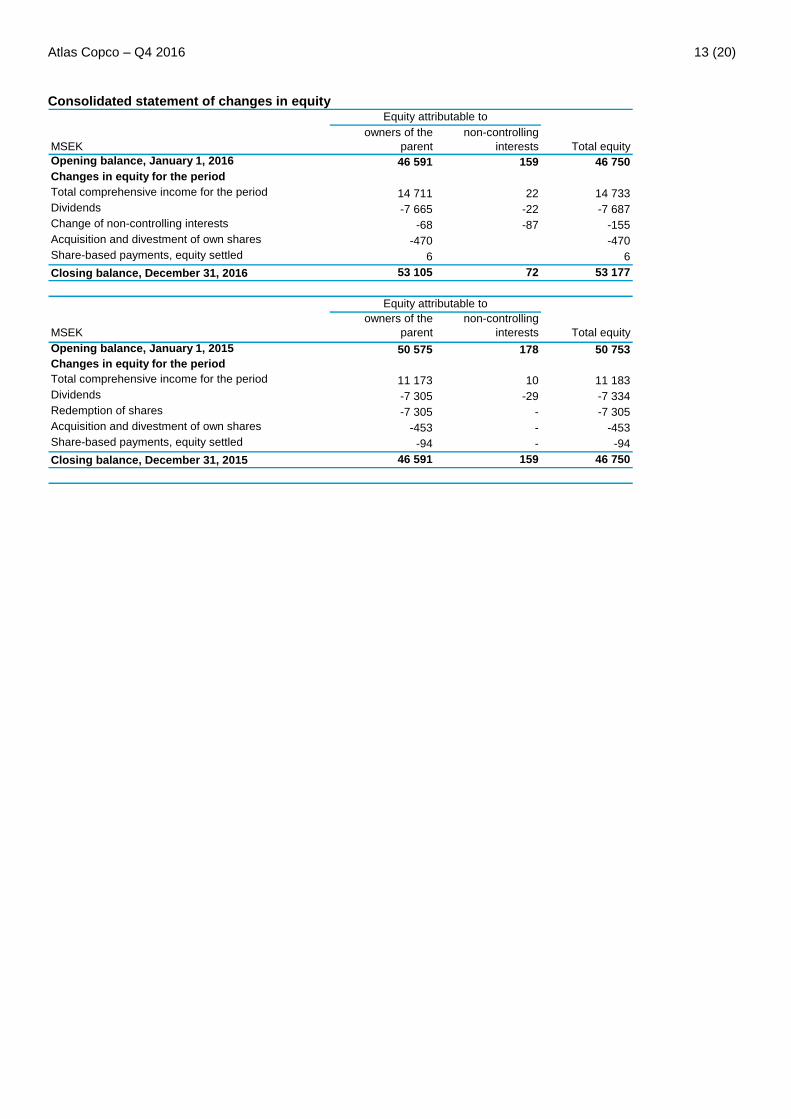
Consolidated statement of changes in equity
MSEK
owners of the
parent
non-controlling
interests Total equity
Opening balance, January 1, 2016 46 591 159 46 750
Changes in equity for the period
Total comprehensive income for the period 14 711 22 14 733
Dividends -7 665 -22 -7 687
Change of non-controlling interests -68 -87 -155
Acquisition and divestment of own shares -470 -470
Share-based payments, equity settled 6 6
Closing balance, December 31, 2016 53 105 72 53 177
MSEK
owners of the
parent
non-controlling
interests Total equity
Opening balance, January 1, 2015 50 575 178 50 753
Changes in equity for the period
Total comprehensive income for the period 11 173 10 11 183
Dividends -7 305 -29 -7 334
Redemption of shares -7 305 - -7 305
Acquisition and divestment of own shares -453 - -453
Share-based payments, equity settled -94 - -94
Closing balance, December 31, 2015 46 591 159 46 750
Equity attributable to
Equity attributable to
Page 14
Atlas Copco – Q4 2016 14 (20)
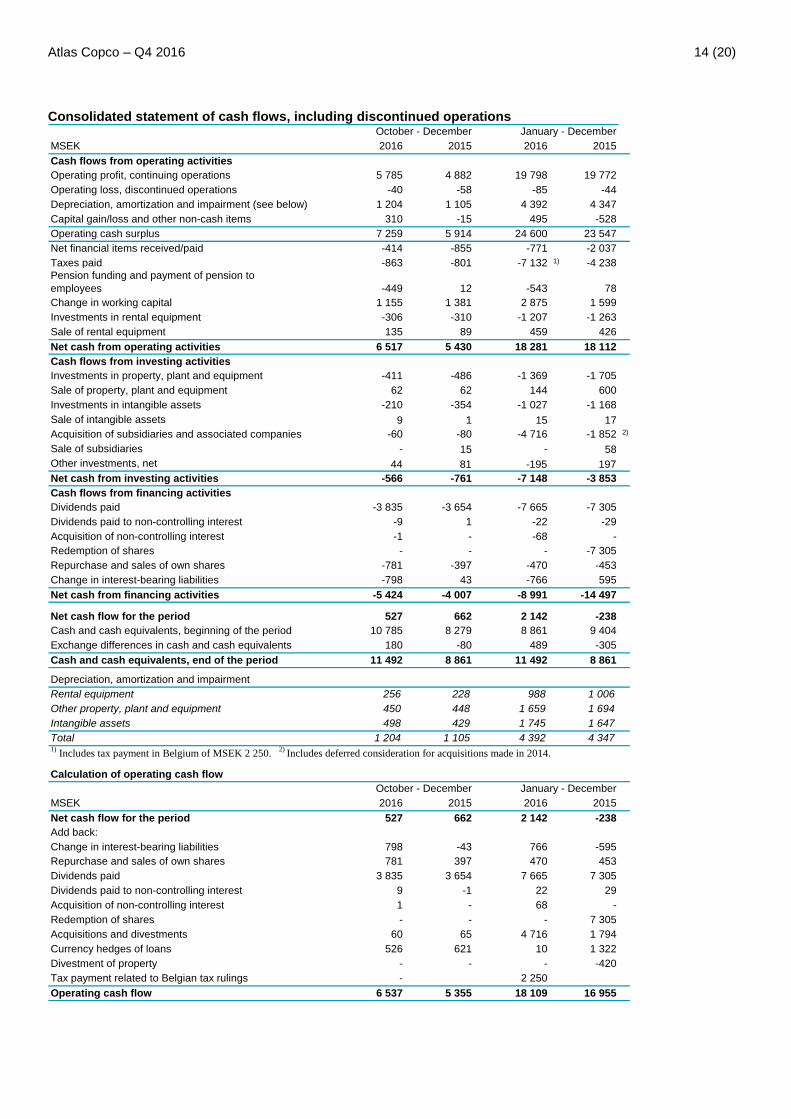
Consolidated statement of cash flows, including discontinued operations
MSEK 2016 2015 2016 2015
Cash flows from operating activities
Operating profit, continuing operations 5 785 4 882 19 798 19 772
Operating loss, discontinued operations -40 -58 -85 -44
Depreciation, amortization and impairment (see below) 1 204 1 105 4 392 4 347
Capital gain/loss and other non-cash items 310 -15 495 -528
Operating cash surplus 7 259 5 914 24 600 23 547
Net financial items received/paid -414 -855 -771 -2 037
Taxes paid -863 -801 -7 132 1) -4 238
Pension funding and payment of pension to
employees -449 12 -543 78
Change in working capital 1 155 1 381 2 875 1 599
Investments in rental equipment -306 -310 -1 207 -1 263
Sale of rental equipment 135 89 459 426
Net cash from operating activities 6 517 5 430 18 281 18 112
Cash flows from investing activities
Investments in property, plant and equipment -411 -486 -1 369 -1 705
Sale of property, plant and equipment 62 62 144 600
Investments in intangible assets -210 -354 -1 027 -1 168
Sale of intangible assets 9 1 15 17
Acquisition of subsidiaries and associated companies -60 -80 -4 716 -1 852 2)
Sale of subsidiaries - 15 - 58
Other investments, net 44 81 -195 197
Net cash from investing activities -566 -761 -7 148 -3 853
Cash flows from financing activities
Dividends paid -3 835 -3 654 -7 665 -7 305
Dividends paid to non-controlling interest -9 1 -22 -29
Acquisition of non-controlling interest -1 - -68 -
Redemption of shares - - - -7 305
Repurchase and sales of own shares -781 -397 -470 -453
Change in interest-bearing liabilities -798 43 -766 595
Net cash from financing activities -5 424 -4 007 -8 991 -14 497
Net cash flow for the period 527 662 2 142 -238
Cash and cash equivalents, beginning of the period 10 785 8 279 8 861 9 404
Exchange differences in cash and cash equivalents 180 -80 489 -305
Cash and cash equivalents, end of the period 11 492 8 861 11 492 8 861
Depreciation, amortization and impairment
Rental equipment 256 228 988 1 006
Other property, plant and equipment 450 448 1 659 1 694
Intangible assets 498 429 1 745 1 647
Total 1 204 1 105 4 392 4 3471)
Includes tax payment in Belgium of MSEK 2 250. 2)
Includes deferred consideration for acquisitions made in 2014.
Calculation of operating cash flow
MSEK 2016 2015 2016 2015
Net cash flow for the period 527 662 2 142 -238
Add back:
Change in interest-bearing liabilities 798 -43 766 -595
Repurchase and sales of own shares 781 397 470 453
Dividends paid 3 835 3 654 7 665 7 305
Dividends paid to non-controlling interest 9 -1 22 29
Acquisition of non-controlling interest 1 - 68 -
Redemption of shares - - - 7 305
Acquisitions and divestments 60 65 4 716 1 794
Currency hedges of loans 526 621 10 1 322
Divestment of property - - - -420
Tax payment related to Belgian tax rulings - 2 250
Operating cash flow 6 537 5 355 18 109 16 955
October - December January - December
October - December January - December
Page 15
Atlas Copco – Q4 2016 15 (20)
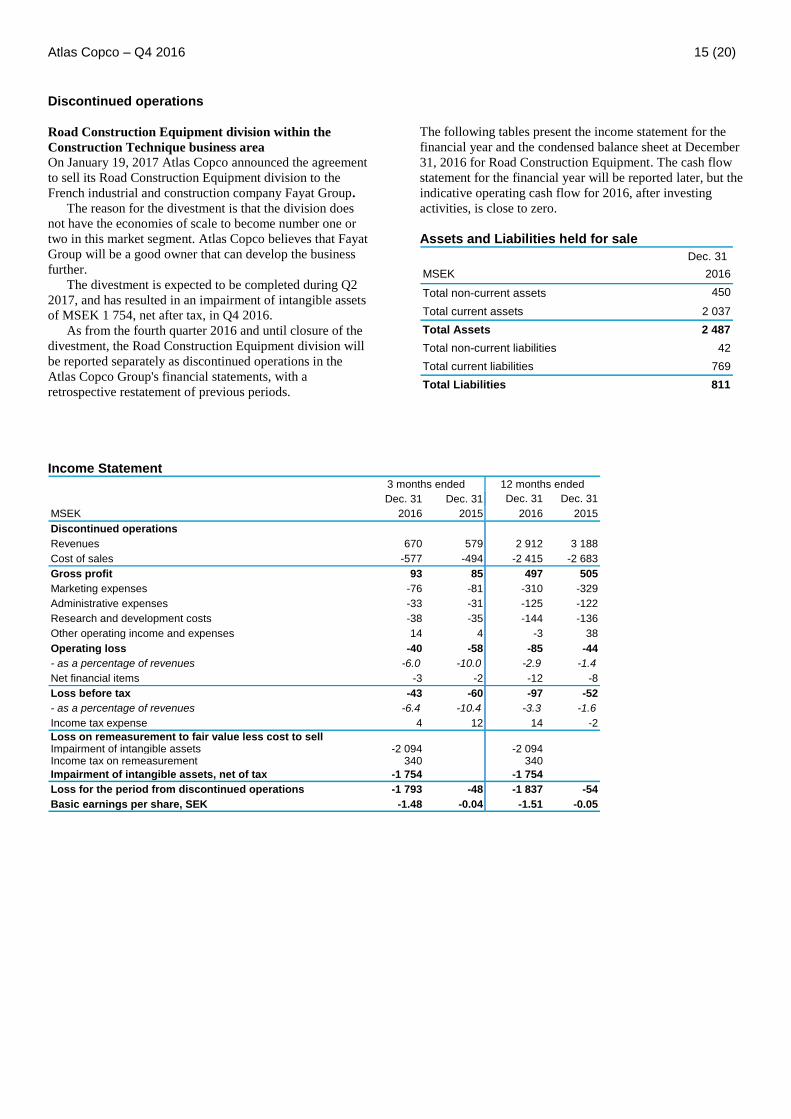
Discontinued operations
Road Construction Equipment division within the
Construction Technique business area
On January 19, 2017 Atlas Copco announced the agreement
to sell its Road Construction Equipment division to the
French industrial and construction company Fayat Group.
The reason for the divestment is that the division does
not have the economies of scale to become number one or
two in this market segment. Atlas Copco believes that Fayat Group will be a good owner that can develop the business
further.
The divestment is expected to be completed during Q2
2017, and has resulted in an impairment of intangible assets
of MSEK 1 754, net after tax, in Q4 2016.
As from the fourth quarter 2016 and until closure of the
divestment, the Road Construction Equipment division will
be reported separately as discontinued operations in the
Atlas Copco Group's financial statements, with a
retrospective restatement of previous periods.
The following tables present the income statement for the
financial year and the condensed balance sheet at December
31, 2016 for Road Construction Equipment. The cash flow
statement for the financial year will be reported later, but the
indicative operating cash flow for 2016, after investing
activities, is close to zero.
Assets and Liabilities held for sale
Dec. 31
MSEK 2016
Total non-current assets 450
Total current assets 2 037
Total Assets 2 487
Total non-current liabilities 42
Total current liabilities 769
Total Liabilities 811
Income Statement
Dec. 31 Dec. 31 Dec. 31 Dec. 31
MSEK 2016 2015 2016 2015
Discontinued operations
Revenues 670 579 2 912 3 188
Cost of sales -577 -494 -2 415 -2 683
Gross profit 93 85 497 505
Marketing expenses -76 -81 -310 -329
Administrative expenses -33 -31 -125 -122
Research and development costs -38 -35 -144 -136
Other operating income and expenses 14 4 -3 38
Operating loss -40 -58 -85 -44
- as a percentage of revenues -6.0 -10.0 -2.9 -1.4
Net financial items -3 -2 -12 -8
Loss before tax -43 -60 -97 -52
- as a percentage of revenues -6.4 -10.4 -3.3 -1.6
Income tax expense 4 12 14 -2
Loss on remeasurement to fair value less cost to sellImpairment of intangible assets -2 094 -2 094Income tax on remeasurement 340 340
Impairment of intangible assets, net of tax -1 754 -1 754
Loss for the period from discontinued operations -1 793 -48 -1 837 -54
Basic earnings per share, SEK -1.48 -0.04 -1.51 -0.05
3 months ended 12 months ended
Page 16
Atlas Copco – Q4 2016 16 (20)
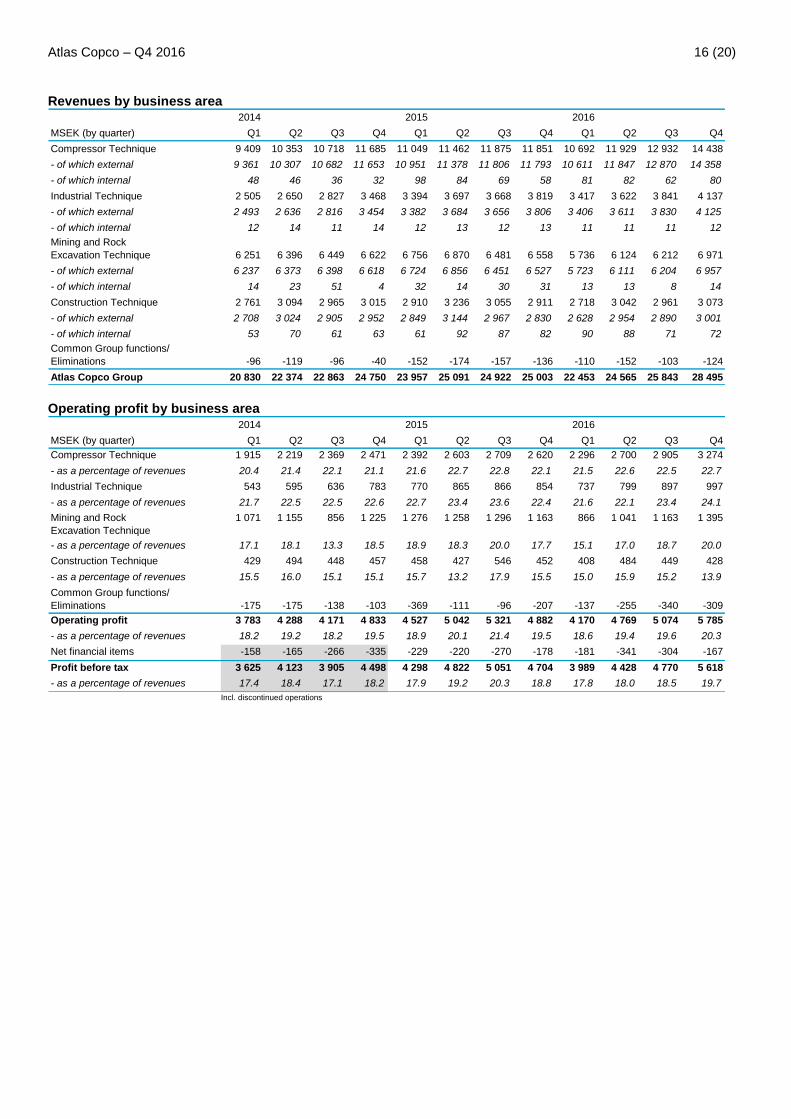
Revenues by business area 2014 2015 2016
MSEK (by quarter) Q1 Q2 Q3 Q4 Q1 Q2 Q3 Q4 Q1 Q2 Q3 Q4
Compressor Technique 9 409 10 353 10 718 11 685 11 049 11 462 11 875 11 851 10 692 11 929 12 932 14 438
- of which external 9 361 10 307 10 682 11 653 10 951 11 378 11 806 11 793 10 611 11 847 12 870 14 358
- of which internal 48 46 36 32 98 84 69 58 81 82 62 80
Industrial Technique 2 505 2 650 2 827 3 468 3 394 3 697 3 668 3 819 3 417 3 622 3 841 4 137
- of which external 2 493 2 636 2 816 3 454 3 382 3 684 3 656 3 806 3 406 3 611 3 830 4 125
- of which internal 12 14 11 14 12 13 12 13 11 11 11 12
Mining and Rock
Excavation Technique 6 251 6 396 6 449 6 622 6 756 6 870 6 481 6 558 5 736 6 124 6 212 6 971
- of which external 6 237 6 373 6 398 6 618 6 724 6 856 6 451 6 527 5 723 6 111 6 204 6 957
- of which internal 14 23 51 4 32 14 30 31 13 13 8 14
Construction Technique 2 761 3 094 2 965 3 015 2 910 3 236 3 055 2 911 2 718 3 042 2 961 3 073
- of which external 2 708 3 024 2 905 2 952 2 849 3 144 2 967 2 830 2 628 2 954 2 890 3 001
- of which internal 53 70 61 63 61 92 87 82 90 88 71 72
Common Group functions/
Eliminations -96 -119 -96 -40 -152 -174 -157 -136 -110 -152 -103 -124
Atlas Copco Group 20 830 22 374 22 863 24 750 23 957 25 091 24 922 25 003 22 453 24 565 25 843 28 495 Operating profit by business area
2014 2015 2016
MSEK (by quarter) Q1 Q2 Q3 Q4 Q1 Q2 Q3 Q4 Q1 Q2 Q3 Q4
Compressor Technique 1 915 2 219 2 369 2 471 2 392 2 603 2 709 2 620 2 296 2 700 2 905 3 274
- as a percentage of revenues 20.4 21.4 22.1 21.1 21.6 22.7 22.8 22.1 21.5 22.6 22.5 22.7
Industrial Technique 543 595 636 783 770 865 866 854 737 799 897 997
- as a percentage of revenues 21.7 22.5 22.5 22.6 22.7 23.4 23.6 22.4 21.6 22.1 23.4 24.1
Mining and Rock
Excavation Technique
1 071 1 155 856 1 225 1 276 1 258 1 296 1 163 866 1 041 1 163 1 395
- as a percentage of revenues 17.1 18.1 13.3 18.5 18.9 18.3 20.0 17.7 15.1 17.0 18.7 20.0
Construction Technique 429 494 448 457 458 427 546 452 408 484 449 428
- as a percentage of revenues 15.5 16.0 15.1 15.1 15.7 13.2 17.9 15.5 15.0 15.9 15.2 13.9
Common Group functions/
Eliminations -175 -175 -138 -103 -369 -111 -96 -207 -137 -255 -340 -309
Operating profit 3 783 4 288 4 171 4 833 4 527 5 042 5 321 4 882 4 170 4 769 5 074 5 785
- as a percentage of revenues 18.2 19.2 18.2 19.5 18.9 20.1 21.4 19.5 18.6 19.4 19.6 20.3
Net financial items -158 -165 -266 -335 -229 -220 -270 -178 -181 -341 -304 -167
Profit before tax 3 625 4 123 3 905 4 498 4 298 4 822 5 051 4 704 3 989 4 428 4 770 5 618
- as a percentage of revenues 17.4 18.4 17.1 18.2 17.9 19.2 20.3 18.8 17.8 18.0 18.5 19.7
Incl. discontinued operations
Page 17
Atlas Copco – Q4 2016 17 (20)
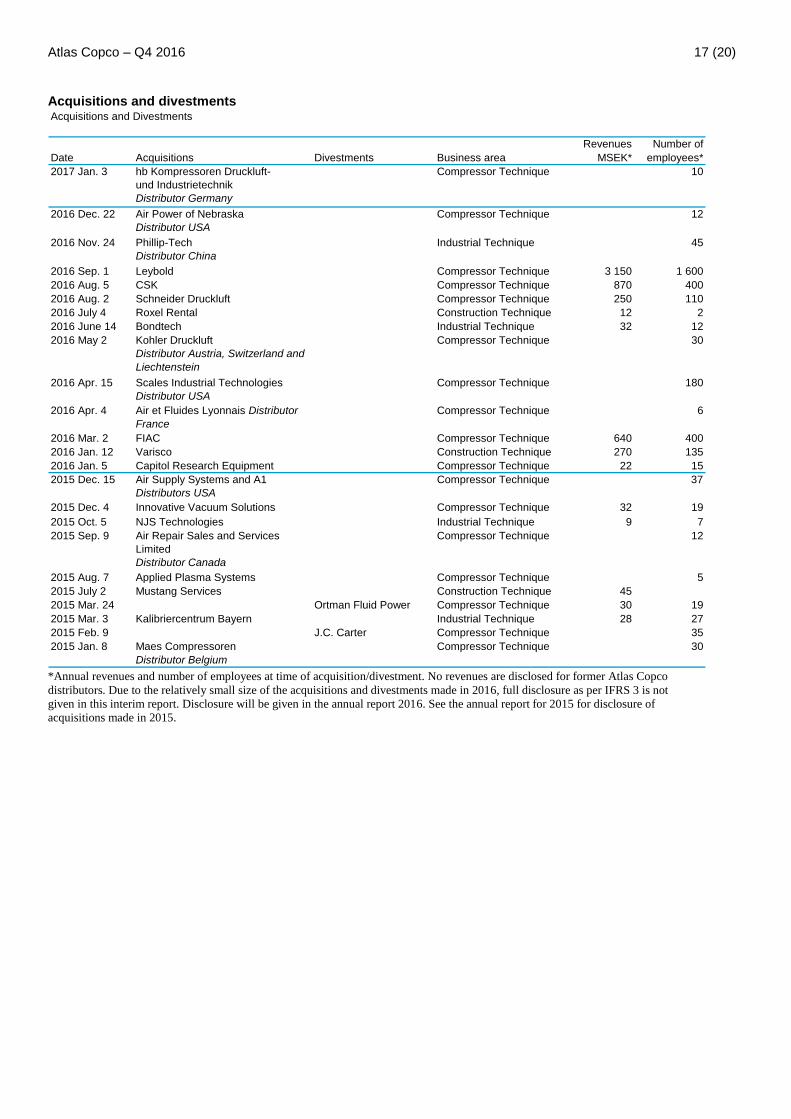
Acquisitions and divestments Acquisitions and Divestments
Revenues Number of
Date Acquisitions Divestments Business area MSEK* employees*
2017 Jan. 3 hb Kompressoren Druckluft-
und Industrietechnik
Distributor Germany
Compressor Technique 10
2016 Dec. 22 Air Power of Nebraska
Distributor USA
Compressor Technique 12
2016 Nov. 24 Phillip-Tech
Distributor China
Industrial Technique 45
2016 Sep. 1 Leybold Compressor Technique 3 150 1 600
2016 Aug. 5 CSK Compressor Technique 870 400
2016 Aug. 2 Schneider Druckluft Compressor Technique 250 110
2016 July 4 Roxel Rental Construction Technique 12 2
2016 June 14 Bondtech Industrial Technique 32 12
2016 May 2 Kohler Druckluft
Distributor Austria, Switzerland and
Liechtenstein
Compressor Technique 30
2016 Apr. 15 Scales Industrial Technologies
Distributor USA
Compressor Technique 180
2016 Apr. 4 Air et Fluides Lyonnais Distributor
France
Compressor Technique 6
2016 Mar. 2 FIAC Compressor Technique 640 400
2016 Jan. 12 Varisco Construction Technique 270 135
2016 Jan. 5 Capitol Research Equipment Compressor Technique 22 15
2015 Dec. 15 Air Supply Systems and A1
Distributors USA
Compressor Technique 37
2015 Dec. 4 Innovative Vacuum Solutions Compressor Technique 32 19
2015 Oct. 5 NJS Technologies Industrial Technique 9 7
2015 Sep. 9 Air Repair Sales and Services
Limited
Distributor Canada
Compressor Technique 12
2015 Aug. 7 Applied Plasma Systems Compressor Technique 5
2015 July 2 Mustang Services Construction Technique 45
2015 Mar. 24 Ortman Fluid Power Compressor Technique 30 19
2015 Mar. 3 Kalibriercentrum Bayern Industrial Technique 28 27
2015 Feb. 9 J.C. Carter Compressor Technique 35
2015 Jan. 8 Maes Compressoren
Distributor Belgium
Compressor Technique 30
*Annual revenues and number of employees at time of acquisition/divestment. No revenues are disclosed for former Atlas Copco
distributors. Due to the relatively small size of the acquisitions and divestments made in 2016, full disclosure as per IFRS 3 is not
given in this interim report. Disclosure will be given in the annual report 2016. See the annual report for 2015 for disclosure of
acquisitions made in 2015.
Page 18
Atlas Copco – Q4 2016 18 (20)
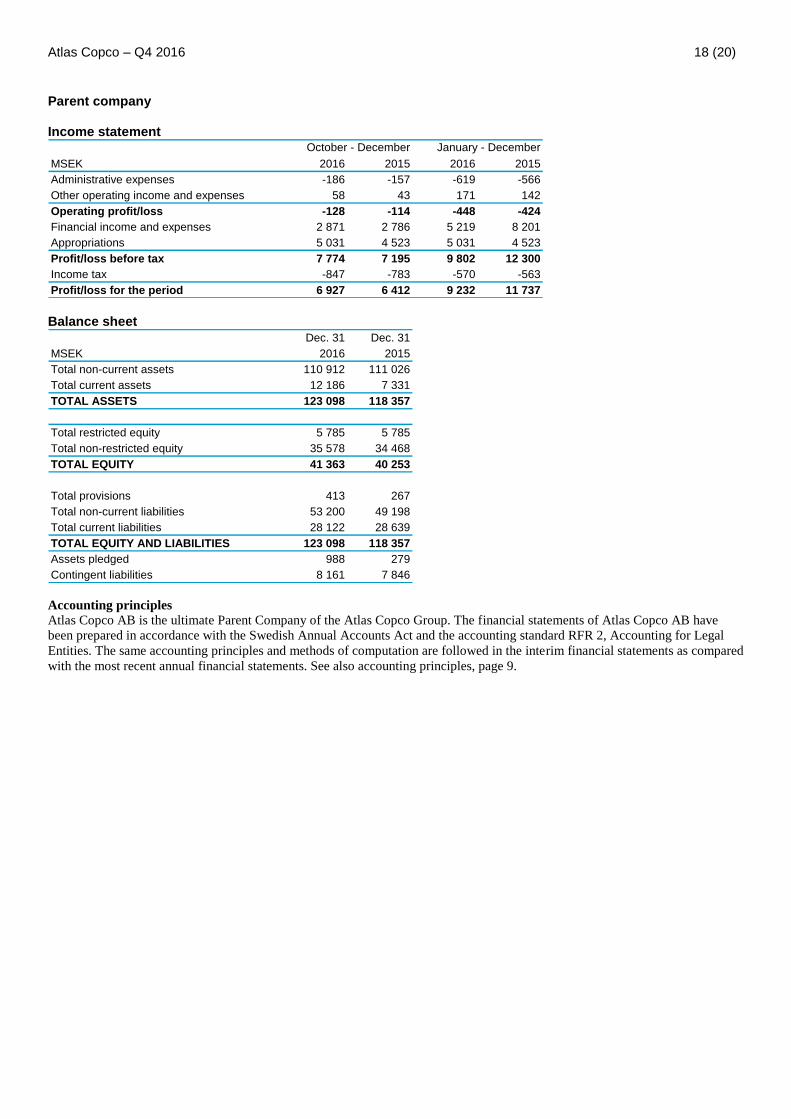
Parent company Income statement
MSEK 2016 2015 2016 2015
Administrative expenses -186 -157 -619 -566
Other operating income and expenses 58 43 171 142
Operating profit/loss -128 -114 -448 -424
Financial income and expenses 2 871 2 786 5 219 8 201
Appropriations 5 031 4 523 5 031 4 523
Profit/loss before tax 7 774 7 195 9 802 12 300
Income tax -847 -783 -570 -563
Profit/loss for the period 6 927 6 412 9 232 11 737
October - December January - December
Balance sheet
Dec. 31 Dec. 31
MSEK 2016 2015
Total non-current assets 110 912 111 026
Total current assets 12 186 7 331
TOTAL ASSETS 123 098 118 357
Total restricted equity 5 785 5 785
Total non-restricted equity 35 578 34 468
TOTAL EQUITY 41 363 40 253
Total provisions 413 267
Total non-current liabilities 53 200 49 198
Total current liabilities 28 122 28 639
TOTAL EQUITY AND LIABILITIES 123 098 118 357
Assets pledged 988 279
Contingent liabilities 8 161 7 846
Accounting principles
Atlas Copco AB is the ultimate Parent Company of the Atlas Copco Group. The financial statements of Atlas Copco AB have
been prepared in accordance with the Swedish Annual Accounts Act and the accounting standard RFR 2, Accounting for Legal
Entities. The same accounting principles and methods of computation are followed in the interim financial statements as compared
with the most recent annual financial statements. See also accounting principles, page 9.
Page 19
Atlas Copco – Q4 2016 19 (20)
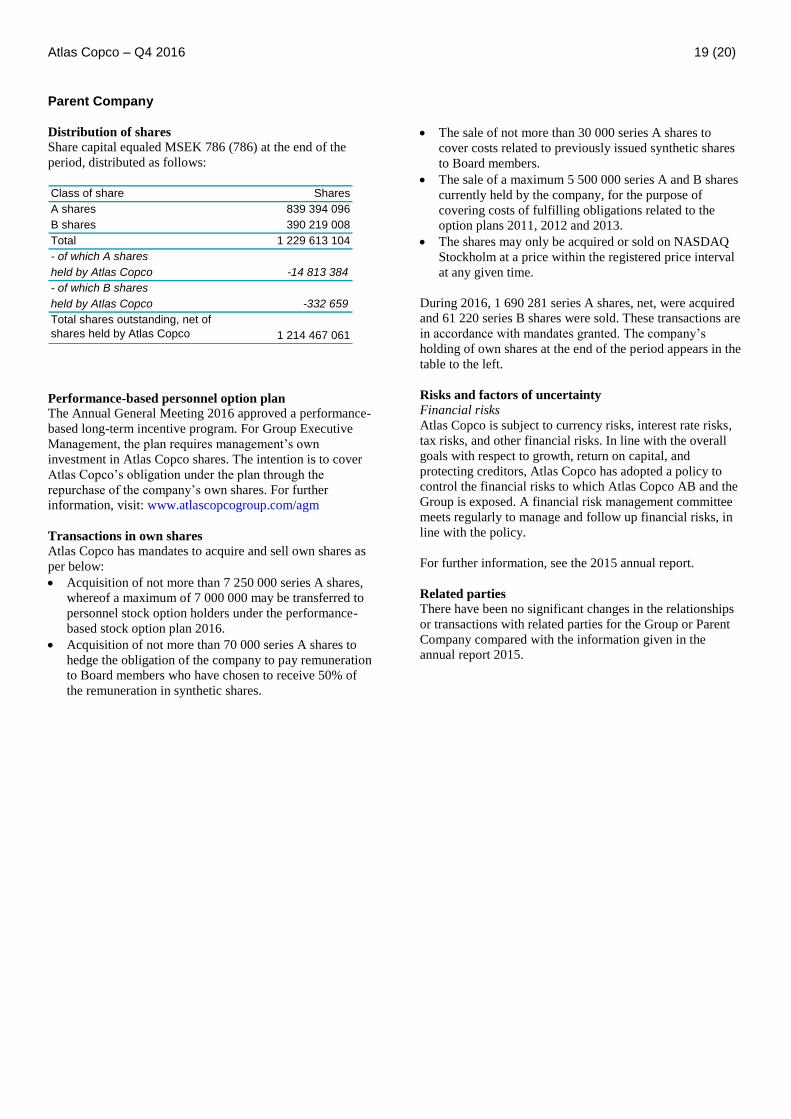
Parent Company Distribution of shares
Share capital equaled MSEK 786 (786) at the end of the
period, distributed as follows:
Class of share Shares
A shares 839 394 096
B shares 390 219 008
Total 1 229 613 104
- of which A shares
held by Atlas Copco -14 813 384
- of which B shares
held by Atlas Copco -332 659
1 214 467 061
Total shares outstanding, net of
shares held by Atlas Copco
Performance-based personnel option plan
The Annual General Meeting 2016 approved a performance-
based long-term incentive program. For Group Executive
Management, the plan requires management’s own
investment in Atlas Copco shares. The intention is to cover
Atlas Copco’s obligation under the plan through the
repurchase of the company’s own shares. For further
information, visit: www.atlascopcogroup.com/agm
Transactions in own shares
Atlas Copco has mandates to acquire and sell own shares as
per below:
Acquisition of not more than 7 250 000 series A shares,
whereof a maximum of 7 000 000 may be transferred to
personnel stock option holders under the performance-
based stock option plan 2016.
Acquisition of not more than 70 000 series A shares to
hedge the obligation of the company to pay remuneration
to Board members who have chosen to receive 50% of
the remuneration in synthetic shares.
The sale of not more than 30 000 series A shares to
cover costs related to previously issued synthetic shares
to Board members.
The sale of a maximum 5 500 000 series A and B shares
currently held by the company, for the purpose of
covering costs of fulfilling obligations related to the
option plans 2011, 2012 and 2013.
The shares may only be acquired or sold on NASDAQ
Stockholm at a price within the registered price interval
at any given time.
During 2016, 1 690 281 series A shares, net, were acquired
and 61 220 series B shares were sold. These transactions are
in accordance with mandates granted. The company’s
holding of own shares at the end of the period appears in the
table to the left.
Risks and factors of uncertainty
Financial risks
Atlas Copco is subject to currency risks, interest rate risks,
tax risks, and other financial risks. In line with the overall
goals with respect to growth, return on capital, and
protecting creditors, Atlas Copco has adopted a policy to
control the financial risks to which Atlas Copco AB and the
Group is exposed. A financial risk management committee
meets regularly to manage and follow up financial risks, in
line with the policy.
For further information, see the 2015 annual report.
Related parties
There have been no significant changes in the relationships
or transactions with related parties for the Group or Parent
Company compared with the information given in the
annual report 2015.
Page 20
Atlas Copco – Q4 2016 20 (20)
This is Atlas Copco Atlas Copco is a world-leading provider of sustainable
productivity solutions. The Group serves customers with
innovative compressors, vacuum solutions and air treatment
systems, construction and mining equipment, power tools
and assembly systems. Atlas Copco develops products and
service focused on productivity, energy efficiency, safety
and ergonomics. The company was founded in 1873, is
based in Stockholm, Sweden, and has a global reach
spanning 180 countries. In 2016, Atlas Copco had revenues
of BSEK 101 (BEUR 11) and more than 42 000 employees.
Business areas
Atlas Copco has four business areas. The business areas are
responsible for developing their respective operations by
implementing and following up on strategies and objectives
to achieve sustainable, profitable growth.
The Compressor Technique business area provides
industrial compressors, vacuum solutions, gas and process
compressors and expanders, air and gas treatment equipment
and air management systems. The business area has a global
service network and innovates for sustainable productivity
in the manufacturing, oil and gas, and process industries.
Principal product development and manufacturing units are
located in Belgium, the United States, China, South Korea,
Germany, Italy and the United Kingdom.
The Industrial Technique business area provides industrial
power tools and systems, industrial assembly solutions,
quality assurance products, software and service through a
global network. The business area innovates for sustainable
productivity for customers in the automotive and general
industries, maintenance and vehicle service. Principal
product development and manufacturing units are located in
Sweden, Germany, the United States, United Kingdom,
France and Japan.
The Mining and Rock Excavation Technique business
area provides equipment for drilling and rock excavation, a
complete range of related consumables and service through
a global network. The business area innovates for
sustainable productivity in surface and underground mining,
infrastructure, civil works, well drilling and geotechnical
applications. Principal product development and
manufacturing units are located in Sweden, the United
States, Canada, China and India.
The Construction Technique business area provides
construction and demolition tools, portable compressors,
pumps and generators, and lighting towers. The business
area offers specialty rental and provides service through a
global network. Construction Technique innovates for
sustainable productivity in infrastructure, civil works, oil
and gas, energy and drilling. Principal product development
and manufacturing units are located in Belgium, Spain,
Sweden, the United States, China, and India.
Vision, mission and strategy
The Atlas Copco Group’s vision is to become and remain
First in Mind—First in Choice® of its customers and other
principal stakeholders. The mission is to achieve
sustainable, profitable growth. Sustainability plays an
important role in Atlas Copco’s vision and it is an integral
aspect of the Group’s mission. An integrated sustainability
strategy, backed by ambitious goals, helps the company
deliver greater value to all its stakeholders in a way that is
economically, environmentally and socially responsible.
For further information
• Analysts and investors
Daniel Althoff, Investor Relations Manager
Phone: +46 8 743 95 97 or +46 768 99 95 97
[email protected]
• Media
Ola Kinnander, Media Relations Manager
Phone: +46 8 743 8060 or +46 70 347 2455
[email protected]
Conference call
A presentation for investors, analysts and media will be held
on January 27, at 3.00 PM CET.
The dial-in numbers are:
Sweden: +46 8 566 426 90
United Kingdom: +44 20 300 898 04
United States: +1 855 831 5946
The conference call will be broadcasted live via the Internet.
Please see our website for link and presentation material:
www.atlascopco.com/ir The webcast and a recorded audio presentation will be
available on our homepage following the call.
Report on Q1 2017
The report on Q1 2017 will be published on April 26, 2017.
Annual General Meeting The Annual General Meeting for Atlas Copco AB will be
held April 26, 2017 at 4 PM CEST in Aula Medica, Nobels
väg 6, Solna, Sweden.
This information is information that Atlas Copco AB is obliged to make public pursuant to the EU Market Abuse Regulation and the Securities Markets Act. The information was submitted for publication, through the agency of the contact person set out above, at 12.00 CET on January 27, 2017