13
Odisha’s progress in nutrition: multiple drivers of change Neha Kohli With Rasmi Avula, Mara van den Bold, Elisabeth Becke Purnima Menon, Lawrence Haddad, Nick Nisbett
| Date post: | 28-Jan-2018 |
| Category: |
Education |
| Upload: | transform-nutrition |
| View: | 42 times |
| Download: | 0 times |

Odisha’s progress in nutrition:
multiple drivers of change
Neha Kohli
With
Rasmi Avula, Mara van den Bold, Elisabeth Becker
Purnima Menon, Lawrence Haddad, Nick Nisbett

Focus for the Odisha study
- Odisha recognized as a high performing state on mortality reductions and nutrition
- Survey data and our own operations research on nutrition service delivery had highlighted high coverage of nutrition-specific interventions
- The focus of the Odisha study, therefore, was to understand what factors had contributed to change in outcomes and scale up of key health and nutrition interventions
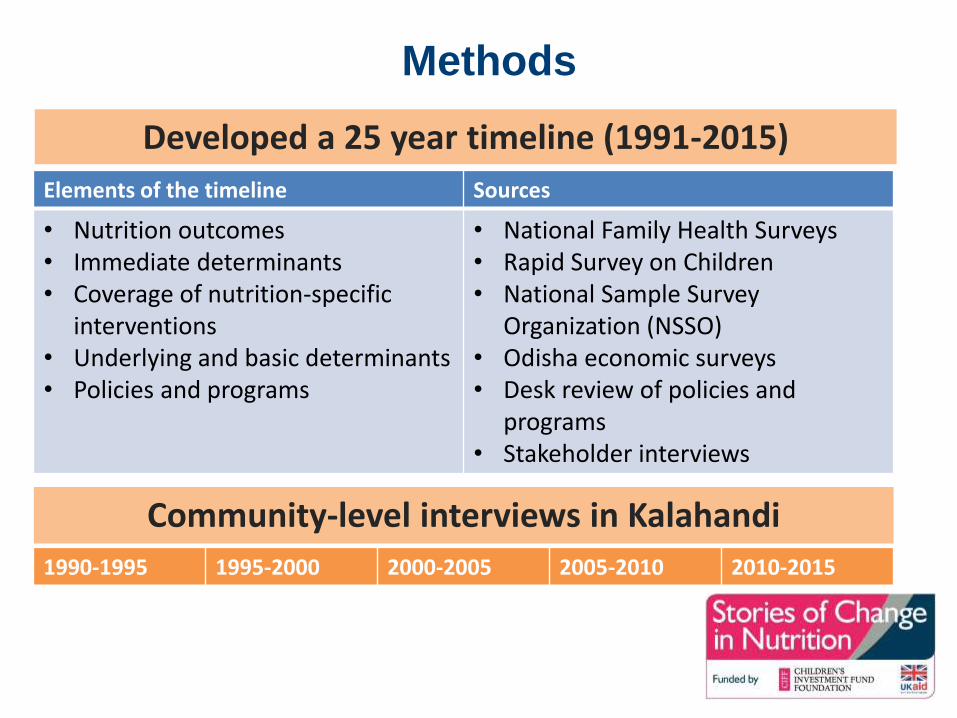
Methods
Developed a 25 year timeline (1991-2015)
Elements of the timeline Sources
• Nutrition outcomes• Immediate determinants• Coverage of nutrition-specific
interventions• Underlying and basic determinants• Policies and programs
• National Family Health Surveys• Rapid Survey on Children • National Sample Survey
Organization (NSSO) • Odisha economic surveys • Desk review of policies and
programs • Stakeholder interviews
Community-level interviews in Kalahandi
1990-1995 1995-2000 2000-2005 2005-2010 2010-2015

Progress in most immediate
determinants
0
10
20
30
40
50
60
70
80
1992-93 1998-99 2005-06 2013-14
Women with body mass index<18.5
+Children (<3 years) breastfedwithin 1 hour of birth (%)
Children (<6 months)exclusively breastfed (%)
Children receiving solid/semi-solid food and breast milk (%)
Children (0-59 mo) withdiarrhea in the last two weeks(%)
Children (<5yr) with diarrheain the last 2 weeks whoreceived ORS (%)

Progress in most Nutrition- Specific
Interventions
0
10
20
30
40
50
60
70
80
90
100
1992-93 1998-99 2005-06 2013-14
Women received/bought iron folic acidsupplements during pregnancy (%)
Mothers who had 3+ ANC visits for last birth(%)
Mothers who had antenatal care during firsttrimester (%)
Receipt & use of ICDS supplementary nutritionduring pregnancy (%)
Births in a health facility (based on last 2 birthsin three years prior to survey) (%)
Births assisted by a health professional in lastthree years
Receipt & use of ICDS supplementary nutritionduring lactation (%)
Children (12-23 mos) fully immunized (%)
Children (12-35 mos) who received vitamin A -last 6 months (%)
Receipt & use of ICDS supplementary nutritionfor children (%)

Community-level changes mirrored
changes in nutrition interventionsPregnancy care
– “Not going to any hospital…….
there were no facilities then, like
there are now….. How could I go?”
“Nothing like that.....no
injection....no medicine.....nothing
was there at that time”.
– “They (pregnant women) are not
dying now”. “Anganwadi offers
everything” Place of delivery
-“Now ASHA facilitates everything....., but no one was there to help back then.... I gave birth to four children... All of them at home only”

Progress in literacy, infrastructure, food
security
Of concern: Sanitation & early marriage in
girls
0
10
20
30
40
50
60
70
80
90
100
Early 1990s Late 1990s Mid 2000 Late 2000 onwards
% of monthly per capita foodexpenditure in rural areas
% of people buying rice from PDS
% of households with access tosafe drinking water
% of households with access totoilet facilities
% Literacy
% Female literacy
% women (15-19 yrs) whoreceived at least secondaryeducation% of women (20-24yrs) marriedby age 18
Poverty headcount ratio

Vision, catalysts, implementation strategies in
place for health & nutrition
Elements Health and Nutrition
Clear vision IMR & MMR reduction
Delivering interventions through multiple platforms
Integrated Child Development Services & Health worked with a common goal
Catalysts, champions, and ownership
- Poor mortality ranking- Human Rights Commission- Political support - Motivated bureaucracy- Development Partner and Civil Society
support
Pathways for scaling up - Expansion of platforms- Frontline workers expansion- New platforms

Operational capacities, financing, enabling
policy and learning environment for health &
nutritionElements Health and Nutrition
Building strategic and operational capacities
- High caliber bureaucrats appointed- Transparency in hiring FLWs- Training of the FLWs- Development partner support
Adequate, stable, and flexible financing
- Financial restructuring- Central funding
Enabling policy environment - Chief Minister leadership- Bureaucratic stability- Supportive national policies
Measurement, learning, and accountability
- Periodic program reviews- Surveys

Other programs and factors influencing
nutrition determinants
Food security interventions have a similar story of scaling up but not sanitation
Gender: Early to kick off women’s empowerment programs [but note less on early marriage/pregnancy]
Infrastructure:
• Road connectivity improved Rural electrification but distribution problems exist
• Drinking water facilities improved but issues of contamination exist
Agriculture and livelihoods: Invested in irrigation and mechanization
• Struggles over land access and migration remain challengesCommunity-level changes mirrored some of these perceptions

Key takeaways: Enablers of change in
nutrition
• State vision and goal
• National policy guidance
• Investment in social sector
programs
• Stable and able
bureaucracy
• Political leadership and
politics
• Improvement in
infrastructure
• Support across
stakeholders

Challenges and Looking ahead
Stunting levels are still high (34%), gaps in complementary feeding and use of IFA during pregnancy. Inter-district variability across outcomes and determinants persist. Hence a need to:
• Strengthen existing system & technical capacities for further scale up of nutrition interventions• Invest in quality improvements
• Engage with other government departments to improve underlying determinants of nutrition: WASH, education, land rights
• Capitalize on high level support to social sector

Thank you!


