ODOT Road Grip Tester Snow Plow Unit Tow Hitch Unit Friction in Winter Maintenance • Commonly used in the evaluation of airport runways – Available systems were typically expensive and cost prohibitive for road maintenance • Successfully used in other countries for over 20 years within road maintenance • Gained serious attention in the US during the early 90’s for use in winter road maintenance Applications for Snow and Ice Control • Provides a method to quantify results – A measure of the quality of work performance – An indicator of the consistency and uniformity of service • Assist with operational decision making – Early detection of icy spots – treatment implementation – Effectiveness/evaluation of treatment selections – treatment adjustments • Advisory information for motorist – Early warnings of icy conditions – Alerts for specific routes/geographical areas
Transcript
1
ODOT Road Grip Tester
Snow Plow Unit
Tow Hitch Unit
Friction in Winter Maintenance
• Commonly used in the evaluation of airport runways– Available systems were typically expensive and cost
prohibitive for road maintenance
• Successfully used in other countries for over 20 years within road maintenance
• Gained serious attention in the US during the early 90’s for use in winter road maintenance
Applications for Snow and Ice Control
• Provides a method to quantify results– A measure of the quality of work performance– An indicator of the consistency and uniformity of
service• Assist with operational decision making
– Early detection of icy spots – treatment implementation– Effectiveness/evaluation of treatment selections –
treatment adjustments• Advisory information for motorist
– Early warnings of icy conditions– Alerts for specific routes/geographical areas
2
Project Vision
• Real time method to determine friction (grip) before, during and after a storm
• Early detection of black ice and frost• Objective method to evaluate performance• Practical utilization and display with
minimal interference to operators• Data transmittal for storage and analysis• Advanced notification for motorist alerts
Technologies to investigate measuring road grip.– Increase snowplow operator safety. – Improve public safety by helping snowplow
operators detect icy conditions.• Spring 2002: ODOT began testing a
prototype – Favorable results obtained over two seasons– Four additional units installed by 2003/2004
Roadway Grip Tester
3
Prototype• Mounted in the spring of 2002 on ODOT’s Prototype truck.•Truck contained a Force America CommandAll Hydraulic System and a ThomTech GPS System with data collection capabilities.•Prototype contained an in-cab display of 10 green, 10 amber and 10 red lights to indicate friction *
The Display• Lights give the driver an
indication of road surface conditions. More lights = more slippery conditions.
• Display is a voltmeter that reads the voltage from the hub, calibrated for road conditions.
• Numerical display (for unit calibration) is converted to a friction range
RGT Ranges
• Green - Dry or wet Pavements
• Yellow - Partly snow covered
• Red - Snow covered or ice
4
Results - Winter 2002-2003During a light morning snow, different traffic volumes were seen to affect the surface friction.
Black Ice
During the early morning, rain with fallingtemperatures formed a 1/8” to 1/4” ice sheet
Example #1 Road Condition and Data
5
Example #2 Road Condition and Data
Tow Hitch Unit
In 2004 ODOT program expanded to include a more diverse and flexible design
• Explored measuring grip via a Reese coupled grip meter– Designed for installation on the back of a passenger
vehicle– Eliminated the requirement of a CDL for operation– Could be placed on existing freeway service patrol
units (good samaritan patrols) and/or area maintenance vehicles
Tow Hitch Unit
6
Rear Mount RGT
RGT wheel is at 1.75°Angle
How RGT Works
• RGT wheel is at a slight angle to the others.
• Wheel “scrubs” or is pushed sideways based on road grip conditions.
• This side force is converted to an electrical signal by the hub.
7
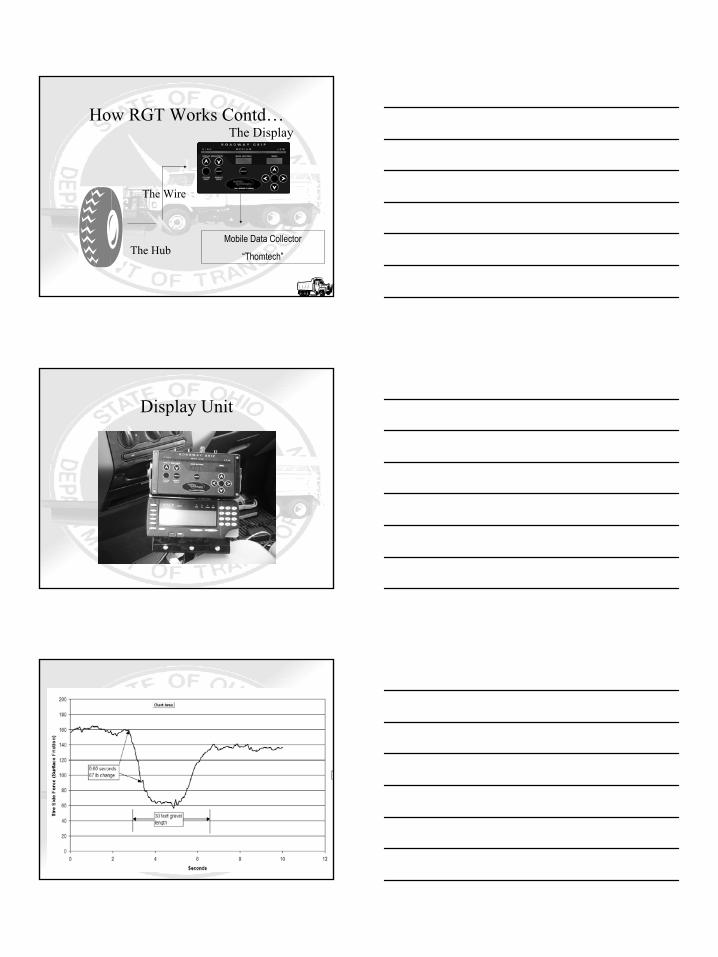
How RGT Works Contd…
The Hub
The Wire
The Display
Mobile Data Collector
“Thomtech”
Display Unit
8
Cornering• The wheel only gives a true reading of road
grip when the vehicle is driving straight ahead.
• More steering wheel input results in greater meter deviation.
• Turning even on slight curves will affect the readings of all grip meters.
Offset Tow Version
2004 Goals
• Refine application of the Tow RGT unit for freeway service patrol vehicles
• Evaluate reliability, consistency, and accuracy
• Evaluate real-time pavement condition testing and travel advisory alerts
9
2004 Accomplishments
• Deployed 12 patrol vehicle units by 8/1/04 *• Collected 200 days of data *• Additional testing in controlled environment –
TRC and Ohio State University ice rink *• Units were dependable, data was consistent and
readings accurately reflected pavement condition *• Modified data collection devices for real time
wireless transmission *
Forward
Patrol RGT Unit
Summary of Summer Testing
• 11 Units assigned to specific test sections
• 7 Test individual locations – straightaway, like sections
*** No. of readings significantly higher for D-2 & D-4 than others due to fact that no readings were discarded; for other trucks, only readings within pre-selected one mile sections were kept/analyzed.
** Over the 1 mile section, friction readings are recorded every 10 seconds; those readings are then averaged.
* These units tested for reliability/durability only. Repeatability/consistency not tested.
• 11 Real Time Data Tow Units Deployed– Three First Team units – Columbus – Three Road Crewzers units - Cleveland– Four Maint Admin units – Central Office– One District 4 unit – NE Ohio
• 4 Manual Data Collection Snow Plows Deployed– Franklin County (Columbus area)
Recent Accomplishments/Successes
• Adjusted scale to reflect ice at lower readings (0-103) *
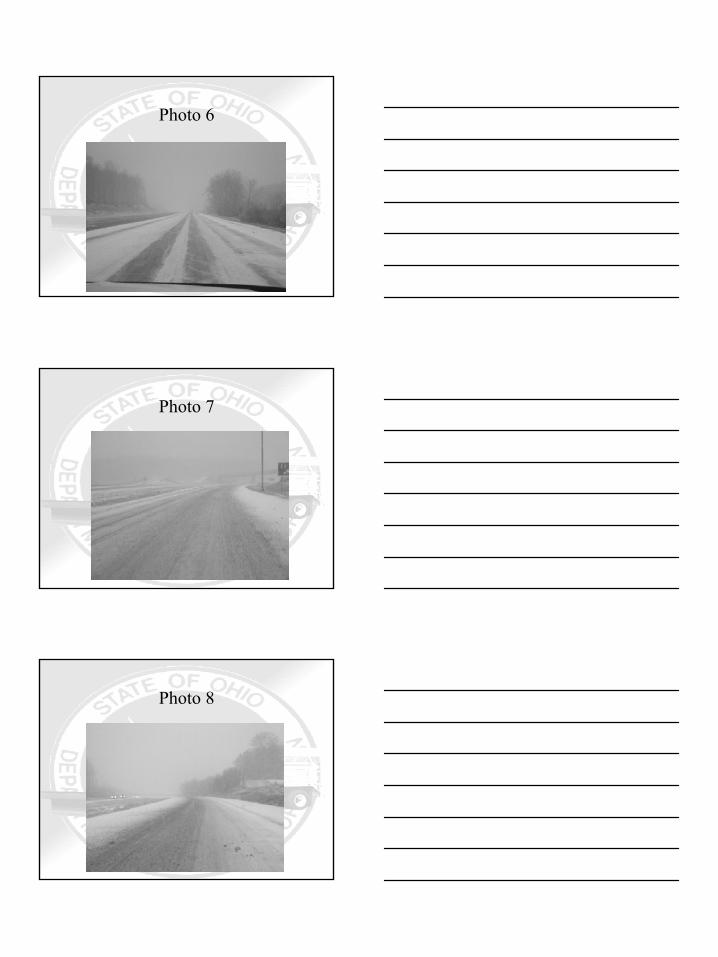
• Compared readings to pavement condition photos*
• Conducted follow testing with two units to confirm consistency *
• Collected data at different temperature ranges• Confirmed RGT readings with winter weather
conditions *
RGT Ranges
• Green - Dry or wet pavements– Friction Readings greater than 175
• Yellow - Partly snow covered– Friction Readings between 174 and 104
• Red - Snow covered or ice– Friction Readings less than 103 *
12
Green RangeFranklin Co. I-70W MM 24.8
Date:1-22-2005
Time:10:04 AM
Friction Reading:246
Air Temp:30
Pavement Temp:30
RGT Scale:Green
Yellow RangeLicking Co. I-70E MM 17.2
Date:1-23-2004
Time:9:35 AM
Friction Reading:162
Air Temp:8
Pavement Temp:8
RGT Scale:Yellow
Red RangeLicking Co. I-70E MM 28.3
Date:1-22-2005
Time:7:57 AM
Friction Reading:49
Air Temp:28
Pavement Temp:28
RGT Scale:Red
13
Follow Testing – Wet and Dry
Unit 0524 v. Unit 0549Southbound11/19/2004
200
250
300
350
400
1 2 3 4 5
# of Passes
Avg
. Fric
tiona
l Va
lues
Unit 0524 WetUnit 0549 WetUnit 0524 DryUnit 0549 Dry
• Mechanical Issues– Internal heat with load cells– Early fatigue/ware on bearings, tires and shocks– Minor electrical issues– Tire wear – approximately 4,500 miles (cold weather)
• Unit Deployment• User Buy-In• Internal Coordination
Data Collection• Initial manual collection with data cards
– Cards stored up to 16 hours data– Manually down loaded and summarized for post storm
analysis
• Began real-time data collection late January 2005– Data collected for each individual unit and reported
real-time to a web site – Graphic and tabular display in real-time and playback
modes
18
Web Site Screen
Cleveland, Ohio3/1/05 12-1 PM
Cleveland, Ohio3/1/05 2-3 PM
19
Cleveland, Ohio3/1/05 4-5 PM
Cleveland, Ohio3/1/05 6-7 PM
Columbus, Ohio3/1/05 4-5 PM
20
Columbus, Ohio3/1/05 5-6 PM
Current Evaluations
• Cycle time to detect pavement condition changes• Exploration of advisory radio messages to the
traveling public• Investigation of Changeable Message Board
options• Integration of data with existing motorist
information system (Ohio Transportation Information System, OTIS)
Short Term Items• Steering correction device
– To eliminate impacts of slight curves on grip readings• Tire Issues
– Document tread wear and correction factors– Develop field tire replacement process
• Mapping options– Creating a more user friendly display of captured conditions
• Deployment options– Freeway Service Patrol units
• Center mount and/or offset tow designs– Dump truck units
21
Tentative Goals/Work Plan• Upgrade existing manual data collection units to
real-time data collection (4 snow plow units)• Install 12 additional snow plow units (one per
District or all in a concentrated area)• Depending upon outcome of offset tow version
evaluation – possibly modify existing tow units from center mount to offset design (12 units)
• Add additional tow units – 6 to 12 units• Implement enhanced mapping program• Develop a project management process to ensure
accurate equipment use and data collection (fostering user buy-in and project support)– Develop evaluation and assessment process – Comparative analysis of snow plow units and tow units– Further development of motorist alerts
Estimated Cost
• Total cost varies by unit type and number ordered – approximations (for RGT equipment and instrumentation only) are:– 1 Unit at $25,000 per unit– 6 Units at $20,000 per unit
• Additional cost associated with hydraulics, shipping, installation and training
• Data collection cost average $2,500 per vehicle for the data collector (MCD), the GPS receiver, Nextel modem and associated hardware
Anticipated Outcome• Create a system that detects, records, reports and
disseminates informational data regarding low grip areas on road surfaces– Explore integration with other AVL applications and
RWIS• To provide a process for integration of this data
into an early alert and advanced notification system for:– Winter Maintenance Activities– Motorist Alerts– Ohio Transportation Information System, OTIS– Treatment Implementation– Treatment Adjustments – Performance Evaluations
22
Contact Information
Diana Evans Douglas Burke, P.E.ODOT, Snow and Ice Coordinator ODOT Truck Run SectionOffice of Maintenance Administration Office of Equipment Tel# 614-644-7159 Fax # 614-728-5590 Tel# 614-351-2836 Fax # [email protected][email protected]
Don Halliday Gregory E. ThompsonHalliday Technologies ThomTech Design, Inc.80 Grace Drive Unit A 3830 Rustic PlacePowell, Ohio 43065 Saint Paul, MN 55126Tel# 614-685-6585 Fax # 614-985-6582 Tel# 651-482-9680 Fax# [email protected][email protected]
Other RGT Projects
• Washington State – 2 under truck unitsContact - Ed Bosley 360-705-7863
• Wyoming State – 1 offset tow hitchContact – Chuck James 307-777-4138
• Alberta – 1 center tow hitchContact – Steve Otto 780-422-9972