88
ORGANISATION FOR ECONOMIC CO-OPERATION AND DEVELOPMENT FOOD AND AGRICULTURE ORGANIZATION OF THE UNITED NATIONS OECD-FAO Agricultural Outlook 2007-2016
ORGANISATION FOR ECONOMIC CO-OPERATION AND DEVELOPMENTFOOD AND AGRICULTURE ORGANIZATION OF THE UNITED NATIONS
OECD-FAO Agricultural Outlook
2007-2016

ORGANISATION FOR ECONOMIC CO-OPERATION AND DEVELOPMENT
The OECD is a unique forum where the governments of 30 democracies work together toaddress the economic, social and environmental challenges of globalisation. The OECD is also atthe forefront of efforts to understand and to help governments respond to new developments andconcerns, such as corporate governance, the information economy and the challenges of anageing population. The Organisation provides a setting where governments can compare policyexperiences, seek answers to common problems, identify good practice and work to co-ordinatedomestic and international policies.
The OECD member countries are: Australia, Austria, Belgium, Canada, the Czech Republic,Denmark, Finland, France, Germany, Greece, Hungary, Iceland, Ireland, Italy, Japan, Korea,Luxembourg, Mexico, the Netherlands, New Zealand, Norway, Poland, Portugal, the Slovak Republic,Spain, Sweden, Switzerland, Turkey, the United Kingdom and the United States. The Commission ofthe European Communities takes part in the work of the OECD.
OECD Publishing disseminates widely the results of the Organisation’s statistics gathering andresearch on economic, social and environmental issues, as well as the conventions, guidelines andstandards agreed by its members.
THE FOOD AND AGRICULTURE ORGANIZATION (FAO) OF THE UNITED NATIONS
The Food and Agriculture Organization of the United Nations leads international efforts todefeat hunger. FAO’s mandate is to raise levels of nutrition, improve agricultural productivity,better the lives of rural populations and contribute to the growth of the world economy. Servingboth developed and developing countries, FAO acts as a neutral forum where all nations meet asequals to negotiate agreements and debate policy. FAO is also a source of knowledge providingaccess to information in print and electronic format. We help developing countries and countriesin transition modernize and improve agriculture, forestry and fisheries practices and ensure goodnutrition for all. Since our founding in 1945, we have focused special attention on developing ruralareas, home to 70 per cent of the world’s poor and hungry people. FAO’s activities comprise fourmain areas: putting information within reach; sharing policy expertise; providing a meeting placefor nations; bringing knowledge to the field.
Also available in French under the title:
Perspectives agricoles de l’OCDE et de la FAO 2007-2016
© OECD/FAO 2007
No reproduction, copy, transmission or translation of this publication may be made without written permission. Applications should be sent to
OECD Publishing [email protected] or by fax 33 1 45 24 99 30. Permission to photocopy a portion of this work should be addressed to the Centre français
d’exploitation du droit de copie (CFC), 20, rue des Grands-Augustins, 75006 Paris, France, fax 33 1 46 34 67 19, [email protected] or (for US only) to
Copyright Clearance Center (CCC), 222 Rosewood Drive Danvers, MA 01923, USA, fax 1 978 646 8600, [email protected].
This work is published under the responsibilities of the Secretary-General of the OECDand the Director General of FAO. The views expressed and conclusions reached in thisreport do not necessarily correspond to those of the governments of OECD membercountries, or the governments of the FAO member countries. The designations employedand the presentation of material in this information product do not imply the expressionof any opinion whatsoever on the part of the Food and Agriculture Organization of theUnited Nations concerning the legal or development status of any country, territory, cityor area or of its authorities, or concerning the delimitation of its frontiers or boundaries.

FOREWORD
Foreword
This is the third occasion that the Agricultural Outlook report has been prepared jointly by the
Organisation for Economic Co-operation and Development (OECD) and the Food and Agriculture
Organization (FAO) of the United Nations. The report draws on the commodity, policy and country
expertise of both Organisations in providing a medium-term assessment of future prospects in the
major world agricultural commodity markets. The report is published annually, as part of a continuing
effort to promote informed discussion of emerging market and policy issues. This edition of the
Agricultural Outlook offers an assessment of agricultural markets covering cereals, oilseeds, sugar,
meats, milk and dairy products over the period 2007 to 2016. It takes account of the enlargement of the
European Union, from twenty-five to twenty-seven member states and for the fist time includes
explicitly assumptions on biofuel production. The market assessments are based on a set of projections
that are conditional on specific assumptions regarding macroeconomic conditions, agricultural and
trade policies and production technologies; it also assumes average weather conditions. Using the
underlying assumptions, the Agricultural Outlook presents a plausible scenario for the evolution of
agricultural markets over the next decade and provides a yardstick or benchmark for the analysis of
agricultural market outcomes that would result from alternative assumptions.
This year’s projections are set against a backdrop of a steady global economic growth over the
medium term, slowing population growth, continuing low inflation, and markets that globally are
responding to the challenge of a rapidly changing biofuel industry. Global economic growth is
propelled mainly by fast growing economies of large developing countries. In particular, the emerging
economies of China, India, Brazil and Russia are key to global and agricultural market developments.
Over the projection period, the countries in the non-OECD region are expected to continue to
experience a much stronger increase in consumption of agricultural products than countries in the
OECD area. This trend is driven by population and, above all, income growth – underpinned by rural
migration to higher income urban areas. The strong growth in demand in many developing and
emerging economies is also expected to spur expansion in imports and provide the impetus to the
development of domestic production capacity. But exports are growing strongly in a number of
developing countries as well. As a result, OECD countries as a group are projected to lose production
and export shares in many commodities to non-OECD countries. Growth in the use of agricultural
commodities as feedstock to a rapidly increasing biofuel industry is one of the main drivers in the
outlook and one of the reasons for international commodity prices to attain a significantly higher
plateau over the outlook period than has been reported in the previous reports. However, new
production technologies, changes in biofuel policies, or unexpected price changes in crude oil and
feedstock prices could significantly alter market developments in the future.
The projections and assessments provided in this report are the result of close co-operation
between the OECD and FAO Secretariats and national experts in member countries, and thus reflect
the combined knowledge and expertise of this wide group of participants. As a result of FAO
participation in the Outlook, the country coverage of the projections has been considerably extended
to a larger number of developing countries and developing country regions. A jointly developed
OECD-FAO AGRICULTURAL OUTLOOK 2007-2016 – © OECD/FAO 2007 3

FOREWORD
modelling system, based on the OECD’s Aglink and FAO’s Cosimo models, facilitated the assurance
of consistency in the projections. The fully documented outlook database, including historical data
and projections, is available through the OECD-FAO joint Internet site www.agri-outlook.org.
Within the OECD, this publication is prepared by the Trade and Agriculture Directorate, while at
FAO, the Trade and Markets Division was responsible for the report.
Acknowledgements. This Agricultural Outlook was prepared by thefollowing staff members of the OECD and FAO Secretariats:
At the OECD, the team of economic and market analysts of the OECD Tradeand Agriculture Directorate that contributed to this report consisted ofLoek BOONEKAMP (team leader), David DOWEY, Céline GINER, Garry SMITH,Pavel VAVRA (baseline co-ordinator) and Martin VON LAMPE.
Research and statistical assistance were provided by David DOWEY,Armelle ELASRI, Alexis FOURNIER and Claude NENERT. Secretarial servicesand co-ordination in report preparation was provided by Christine CAMERON.Technical assistance in the preparation of the Outlook database was provided byEric ESPINASSE and Frano ILICIC. Many other colleagues in the OECD Secretariatand member country delegations furnished useful comments on earlier drafts ofthe report.
At FAO, the team of economists and commodity officers from the Commodities andTrade Division contributing to this edition consisted of Abdolreza ABBASSIAN,El Mamoun AMROUK, Concepcion CALPE, Kaison CHANG, Merritt CLUFF,Piero CONFORTI, Cheng FANG, David HALLAM (team leader), Holger MATTHEY(baseline co-ordinator), Jennifer NYBERG, Adam PRAKASH, Grégoire TALLARD,Peter THOENES, Koji YANAGISHIMA and Carola FABI from the Statistics Division.AliArslan GURKAN and Alexander SARRIS initiated support for FAO’s Cosimomodelling project.
Research assistance and database preparation was provided by Claudio CERQUILINI,Daniela CITTI, Berardina FORZINETTI, John HEINE, Massimo IAFRATE, Marco MILOand Barbara SENFTER. Secretarial services were provided by Rita ASHTON andSilvia RIPANI.
OECD-FAO AGRICULTURAL OUTLOOK 2007-2016 – © OECD/FAO 20074

TABLE OF CONTENTS
Table of Contents
Acronyms and Abbreviations . . . . . . . . . . . . . . . . . . . . . . . . . . . . . . . . . . . . . . . . . . . . . . . . . 7
Outlook in Brief . . . . . . . . . . . . . . . . . . . . . . . . . . . . . . . . . . . . . . . . . . . . . . . . . . . . . . . . . . . . . 10
Chapter 1. Overview. . . . . . . . . . . . . . . . . . . . . . . . . . . . . . . . . . . . . . . . . . . . . . . . . . . . . . . . . 11
Introduction . . . . . . . . . . . . . . . . . . . . . . . . . . . . . . . . . . . . . . . . . . . . . . . . . . . . . . . . . . . . 12
The main underlying assumptions . . . . . . . . . . . . . . . . . . . . . . . . . . . . . . . . . . . . . . . . . 12
Assumptions related to evolving biofuel production . . . . . . . . . . . . . . . . . . . . . . . . . . 17
Main trends in commodity markets . . . . . . . . . . . . . . . . . . . . . . . . . . . . . . . . . . . . . . . . 20
Uncertainties . . . . . . . . . . . . . . . . . . . . . . . . . . . . . . . . . . . . . . . . . . . . . . . . . . . . . . . . . . . 30
A short review of historical patterns in trade flows for agricultural products . . . . . 37
Notes . . . . . . . . . . . . . . . . . . . . . . . . . . . . . . . . . . . . . . . . . . . . . . . . . . . . . . . . . . . . . . . . . . 46
Annex A. Statistical Tables . . . . . . . . . . . . . . . . . . . . . . . . . . . . . . . . . . . . . . . . . . . . . . . . . . . . 47
Annex B. Trade Annex Tables . . . . . . . . . . . . . . . . . . . . . . . . . . . . . . . . . . . . . . . . . . . . . . . . . 72
Annex C. Glossary of Terms. . . . . . . . . . . . . . . . . . . . . . . . . . . . . . . . . . . . . . . . . . . . . . . . . . . 78
List of boxes
1.1. Partial stochastic analysis: Variability around deterministic projections . . . . . . . 33
List of tables
1.1. Where population and income is projected to grow . . . . . . . . . . . . . . . . . . . . . . . . . 14
1.2. Consumption and production annual (least squares) growth rates, 2007-16 . . . . 22
1.3. Consumption and production of OECD countries as a share of world total . . . . . 23
1.4. Total merchandise and agriculture exports 1985-2004
(with and without intra-EU trade) . . . . . . . . . . . . . . . . . . . . . . . . . . . . . . . . . . . . . . . . 38
1.5. Leading agro-food exporting countries (average 1985-89 and 2000-04) . . . . . . . . . 39
A.1. Economic assumptions . . . . . . . . . . . . . . . . . . . . . . . . . . . . . . . . . . . . . . . . . . . . . . . . . 48
A.2. World prices. . . . . . . . . . . . . . . . . . . . . . . . . . . . . . . . . . . . . . . . . . . . . . . . . . . . . . . . . . . 50
A.3. World trade projections . . . . . . . . . . . . . . . . . . . . . . . . . . . . . . . . . . . . . . . . . . . . . . . . . 52
A.4. Main policy assumptions for cereal markets . . . . . . . . . . . . . . . . . . . . . . . . . . . . . . . 54
A.5. World cereal projections . . . . . . . . . . . . . . . . . . . . . . . . . . . . . . . . . . . . . . . . . . . . . . . . 57
A.6. Main policy assumptions for oilseed markets . . . . . . . . . . . . . . . . . . . . . . . . . . . . . . 58
A.7. World oilseed projections . . . . . . . . . . . . . . . . . . . . . . . . . . . . . . . . . . . . . . . . . . . . . . . 60
A.8. Main policy assumptions for meat markets . . . . . . . . . . . . . . . . . . . . . . . . . . . . . . . . 61
A.9. World meat projections . . . . . . . . . . . . . . . . . . . . . . . . . . . . . . . . . . . . . . . . . . . . . . . . . 63
A.10. Main policy assumptions for dairy markets . . . . . . . . . . . . . . . . . . . . . . . . . . . . . . . . 65
A.11. World dairy projections (butter and cheese). . . . . . . . . . . . . . . . . . . . . . . . . . . . . . . . 68
A.12. World dairy projections (powders and casein) . . . . . . . . . . . . . . . . . . . . . . . . . . . . . . 69
OECD-FAO AGRICULTURAL OUTLOOK 2007-2016 – © OECD/FAO 2007 5

TABLE OF CONTENTS
A.13. Main policy assumptions for sugar markets . . . . . . . . . . . . . . . . . . . . . . . . . . . . . . . 70
A.14. World sugar projections (in raw sugar equivalent) . . . . . . . . . . . . . . . . . . . . . . . . . . 71
B.1. Concordance of product groupings . . . . . . . . . . . . . . . . . . . . . . . . . . . . . . . . . . . . . . . 73
B.2. Top 20 exporters and importers of bulk products (excludes intra-EU) . . . . . . . . . . 74
B.3. Top 20 exporters and importers of horticultural products
(excludes intra-EU) . . . . . . . . . . . . . . . . . . . . . . . . . . . . . . . . . . . . . . . . . . . . . . . . . . . . . 75
B.4. Top 20 exporters and importers of semi-processed products
(excludes intra-EU) . . . . . . . . . . . . . . . . . . . . . . . . . . . . . . . . . . . . . . . . . . . . . . . . . . . . . 76
B.5. Top 20 exporters and importers of processed products (excludes intra-EU) . . . . . 77
List of figures
1.1. Trends in output growth in selected countries . . . . . . . . . . . . . . . . . . . . . . . . . . . . . 13
1.2. Expansion of US ethanol production and corresponding use of maize . . . . . . . . . 18
1.3. Ethanol and bio-diesel use in the EU to increase – based on wheat,
rapeseed and imports . . . . . . . . . . . . . . . . . . . . . . . . . . . . . . . . . . . . . . . . . . . . . . . . . . 19
1.4. Canadian ethanol and bio-diesel production to expand,
using growing cereal quantities in particular. . . . . . . . . . . . . . . . . . . . . . . . . . . . . . . 19
1.5. Expanding Chinese ethanol industry to increase maize use for biofuels . . . . . . . 20
1.6. Continued growth in Brazil cane-based ethanol production . . . . . . . . . . . . . . . . . . 21
1.7. Outlook for world crop prices to 2016 . . . . . . . . . . . . . . . . . . . . . . . . . . . . . . . . . . . . . 29
1.8. Outlook for world livestock product prices to 2016 . . . . . . . . . . . . . . . . . . . . . . . . . . 29
1.9. The range of world oilseed yields in the stochastic simulations. . . . . . . . . . . . . . . 33
1.10. Evolution range of the world oilseed price (expressed in real terms)
in the stochastic simulations . . . . . . . . . . . . . . . . . . . . . . . . . . . . . . . . . . . . . . . . . . . . 34
1.11. Outcomes of stochastic simulations versus deterministic baseline in 2016:
Relation between world oilseed price (expressed in real terms)
and world oilseed yields . . . . . . . . . . . . . . . . . . . . . . . . . . . . . . . . . . . . . . . . . . . . . . . . 35
1.12. Outcomes of stochastic simulations versus deterministic baseline in 2016:
Relation between world maize price (expressed in real terms)
and world coarse grains yields . . . . . . . . . . . . . . . . . . . . . . . . . . . . . . . . . . . . . . . . . . . 35
1.13. Outcomes of stochastic simulations versus deterministic baseline in 2016:
Relation between world oilseed price (expressed in real terms)
and world coarse grains yields . . . . . . . . . . . . . . . . . . . . . . . . . . . . . . . . . . . . . . . . . . . 36
1.14. Outcomes of stochastic simulations versus deterministic baseline in 2016:
Relation between world oilseed and maize prices
(both expressed in real terms) . . . . . . . . . . . . . . . . . . . . . . . . . . . . . . . . . . . . . . . . . . . 36
1.15. Agriculture export share (excludes intra-EU trade) by income group
(1985-2004) . . . . . . . . . . . . . . . . . . . . . . . . . . . . . . . . . . . . . . . . . . . . . . . . . . . . . . . . . . . . 40
1.16. Share of agriculture exports (excludes intra-EU trade) by stage (1985-2004) . . . . . 41
1.17. Exports of bulk and horticultural products by various groups of countries
(1985-2004) . . . . . . . . . . . . . . . . . . . . . . . . . . . . . . . . . . . . . . . . . . . . . . . . . . . . . . . . . . . . 41
1.18. Exports of semi processed and processed products by various groups
of countries, 1985-2004 . . . . . . . . . . . . . . . . . . . . . . . . . . . . . . . . . . . . . . . . . . . . . . . . . 42
OECD-FAO AGRICULTURAL OUTLOOK 2007-2016 – © OECD/FAO 20076

ACRONYMS AND ABBREVIATIONS
Acronyms and Abbreviations
Acronyms and abbreviationsAAFC Agriculture and agri-food Canada
ACP African, Caribbean and Pacific countries
AMAD Agricultural Market Access Database
AI Avian influenza
BRIC Brazil, Russia, India, China
BSE Bovine Spongiform Encephalopathy
CAFTA Central American Free Trade Agreement
CAP Common Agricultural Policy (EU)
CCC Commodity Credit Corporation
CET Common External Tariff
CIS Commonwealth of Independent States
CPI Consumer Price Index
CRP Conservation Reserve Program of the United States
CMO Common Market Organisation for sugar (EU)
CO2 Carbon dioxide
Cts/lb Cents per pound
cwe Carcass weight equivalent
DBES Date-based Export Scheme
DDA Doha Development Agenda
DDG Dried Distiller’s Grains
dw Dressed weight
EBA Everything But Arms Initiative (EU)
ECOWAP West Africa Regional Agricultural Policy
ECOWAS Economic Community of West African States
EPAs Economic Partnership Agreements (between EU and ACP countries)
ERS Economic Research Service of the US Department for Agriculture
est. Estimate
EU European Union
EU15 Fifteen member states of the European Union
EU10 Ten new member states of the European Union from May 2004
EU27 Twenty seven member states of the European Union (including Bulgaria
and Romania from 2007)
FAO Food and Agriculture Organisation of the United Nations
FMD Foot and Mouth Disease
FOB Free on board (export price)
FSRI ACT Farm Security and Rural Investment Act (US) of 2002
FTA Free Trade Agreement
GDP Gross Domestic Product
OECD-FAO AGRICULTURAL OUTLOOK 2007-2016 – © OECD/FAO 2007 7

ACRONYMS AND ABBREVIATIONS
G10 Group of 10 countries (see Glossary)
G20 Group of 20 developing countries (see Glossary)
GDPD Gross Domestic Product Deflator
GM Genetically modified
HFCS High Fructose Corn Syrup
HS Harmonised Commodity Description and Coding System
kt Thousand tonnes
LAC Latin America and the Caribbean
LDCs Least Developed Countries
LICONSA Leche Industralizada
lw Live weight
MERCOSUR Common Market of the South
MFN Most Favoured Nation
Mha Million hectares
MPS Market Price Support
Mt Million tonnes
MTBE Methyl Tertiary Butyl Ether
NAFTA North American Free Trade Agreement
OECD Organisation for Economic Co-operation and Development
OIE World Organisation for Animal Health
PCE Private Consumption Expenditure
PROCAMPO Mexican Farmers Direct Support Programme
PPP Purchasing Power Parity
PSE Producer Support Estimate
pw Product weight
rse Raw sugar equivalent
rtc Ready to cook
RFS Renewable Fuels Standard in the US, which as part of the Energy Policy Act
of 2005 adjusts fuel standards in favour of ethanol and other biofuels
and sets increased mandated biofuel consumption quantities
rwt Retail weight
SEAC Spongiform Encephalopathy Advisory Committee
SFP Single Farm Payment
SMP Skim milk powder
SPS Sanitary and Phytosanitary measures
STRV Short Tons Raw Value
t Tonnes
t/ha Tonnes/hectare
TRQ Tariff rate quota
UK United Kingdom
UN The United Nations
URAA Uruguay Round Agreement on Agriculture
UNCTAD United Nations Conference on Trade and Development
US United States of America
USDA United States Department of Agriculture
VAT Value added tax
vCJD New Creutzfeld-Jakob-Disease
OECD-FAO AGRICULTURAL OUTLOOK 2007-2016 – © OECD/FAO 20078

ACRONYMS AND ABBREVIATIONS
WAEMU West African Economic and Monetary Union
WMP Whole milk powder
WTO World Trade Organisation
SymbolsAUD Dollars (Australia)
ARS Pesos (Argentina)
bn Billion
BRL Real (Brazil)
CAD Dollars (Canada)
CNY Yuan (China)
EUR Euro (Europe)
gal Gallons
ha Hectare
hl Hectolitre
INR Indian rupees
KRW Korean won
lb Pound
Mn Million
MXN Mexican pesos
NZD Dollars (New Zealand)
p.a. Per annum
RUB Ruble (Russia)
THB Thai baht
USD Dollars (United States)
ZAR South African rand
OECD-FAO AGRICULTURAL OUTLOOK 2007-2016 – © OECD/FAO 2007 9

OUTLOOK IN BRIEF
Outlook in Brief
● Currently strong world market prices for many agricultural commodities in international tradeare, in large measure, due to factors of a temporary nature, such as drought related supplyshortfalls, and low stocks. But, structural changes such as increased feedstock demand forbiofuel production, and the reduction of surpluses due to past policy reforms, may keep pricesabove historic equilibrium levels during the next 10 years.
● Higher commodity prices are a particular concern for net food importing developing countries aswell as the poor in urban populations, and will evoke on-going debate on the “food versus fuel”issue. Furthermore, while higher biofuel feedstock prices support incomes of producers of theseproducts, they imply higher costs and lower incomes for producers that use the same feedstockin the form of animal feed.
● The expectation that world market prices have attained a higher plateau may facilitate furtherpolicy reform away from price support. This would reduce the need for border protection andwould provide flexibility for tariff reductions.
● Growing use of cereals, sugar, oilseeds and vegetable oils to satisfy the needs of a rapidlyincreasing biofuel industry, is one of the main drivers in the outlook. Over the outlook period,substantial amounts of maize in the US, wheat and rapeseed in the EU and sugar in Brazil willbe used for ethanol and bio-diesel production. This is underpinning crop prices and, indirectlythrough higher feed costs, the prices for livestock products as well.
● Given that in most temperate zone countries ethanol and bio-diesel production are noteconomically viable without support, a different combination of production technologies,biofuel policies and crude oil prices than is assumed in this Outlook could to lead to lower pricesthan are projected in this Outlook.
● The assumed strong growth in demand in many developing and emerging economies will spurexpansion in imports as well as provide the impetus to the development of domestic productioncapacity. As a result, OECD countries as a group are projected to lose production and exportshares in many commodities to non-OECD countries over the outlook period.
● Measured by global imports, world trade is projected to grow for all commodities reviewed in thisreport, without exception. By 2016, and compared to the average for 2001-05, trade expansionremains modest for SMP (7%), is situated at 13% to 17% for coarse grains and wheat respectively,but grows by between over 50% for beef, pigmeat and WMP and by close to 70% for vegetable oils.
● Imports grow more strongly in developing countries than in OECD countries for all productsexcept vegetable oils. And for all products except wheat and coarse grains, these growingmarkets are increasingly satisfied through larger exports from other developing countries.Agricultural world markets are thus characterised by growing south-south trade, raising thecompetition for exporting countries within the OECD.
● The growing presence on export markets of Argentina and Brazil is staggering. While Brazil’sgrowth is mostly concentrated in sugar, oilseeds and meats, Argentina’s export performance alsocovers cereals and many dairy products. Other growing exporters in the developing and transitioneconomies include Russia and the Ukraine for coarse grains, Viet Nam and Thailand for rice,Indonesia and Thailand for vegetable oils, and Thailand, Malaysia, India and China for poultry.
● Import growth is much more widely spread across countries. However, China’s dominance ofoilseeds and oilseed products trade is striking. By 2016, China will have become the world’s largestimporter of oilseed meals and it will have further consolidated its leading position in imports ofoils and oilseeds. For the latter product, its share in global imports will have risen to almost 50%.
OECD-FAO AGRICULTURAL OUTLOOK 2007-2016 – © OECD/FAO 200710

OECD-FAO Agricultural Outlook 2007-2016
© OECD/FAO 2007
Chapter 1
Overview
11

1. OVERVIEW
IntroductionThe Agricultural Outlook is a collaborative effort of the OECD in Paris and the Food and
Agriculture Organisation (FAO) of the United Nations in Rome. Its main purpose is to produce an
updated annual 10-year assessment of global commodity markets that includes analysis of
recent developments and emerging issues, bringing together the commodity, policy and
country expertise of both Organisations. The projections for production, consumption,
stocks, trade and prices described and analysed in this report cover the years 2007 to 2016.
The projections are presented in the Statistical Annex, and can be viewed in more detail at
the website www.agr-outlook.org. They reflect many specific assumptions concerning key
external factors such as macroeconomic performance, agricultural and trade policies, and
trends in technologies as well as consumer preferences. The projections do not take account
of weather shocks and related impacts on crop yields and livestock production, nor are
changes considered to agricultural and trade policies – anticipated or otherwise – that have
yet to be adopted by legislation or international agreements. Such deviations from these
assumptions constitute some of the important uncertainties in the Outlook, the potential
impacts of which are also assessed in this report.
The main underlying assumptions
Global economic growth may be the strongest in decades
Brightened prospects prevail in the macroeconomic climate for this year’s Outlook.
Global economic growth has remained vigorous through 2006. Demand continues to be
strong in OECD countries with output growth in the OECD area remaining robust and near-
term prospects optimistic, in particular in OECD member countries in Europe, Australia
and Asia. GDP growth for the OECD area increased to 3.2% in 2006 and is expected to
remain buoyant at close to 2.5% throughout the outlook horizon. In per capita terms,
economic growth is anticipated to be the strongest in recent times, due to, among other
factors, the spread of technology and globalization of markets as well as an income
dividend due to declining population growth.1
The recent downturn of activity in the United States is not expected to last beyond the
short-term, and thereafter growth is assumed to remain solid. Conversely, short-term
prospects are bright for Canada, the US’s main trading partner, given the stable economic
climate in this country as well as expanding trade reinforced by high commodity prices. In
the European Union (EU), confidence prevails now that solid growth seems to finally have
taken root, even though output is assumed to moderate over the outlook period. The
recovery is also established in Japan, but with weakening potential over the longer term
coming chiefly from its ageing workforce. In the short term, interest rates are expected to
notch upwards in both of these latter countries while the euro and yen continue to
appreciate against the dollar, diminishing the prospects for EU agricultural exports but
boosting import demand in Japan. Activity has surged back in Mexico with GDP growth
rates beyond 2009 expected to exceed 4%, and the dynamic economies of Korea and Turkey
OECD-FAO AGRICULTURAL OUTLOOK 2007-2016 – © OECD/FAO 200712
1. OVERVIEW
continue to steam ahead. In the near-term, a rebound is also expected in Australia, which,
if it eventually spreads to New Zealand, will bring renewed optimism in this latter country
as well after several years of declining performance.
Because of their growth potential, the large emerging economies of China, India, Brazil
and Russia are key drivers of global economic growth. Moreover, the relative significance
and growth potential of their agricultural sectors mean that they play an expanding role in
world trade of agricultural commodities. Higher responsiveness of food demand to income
growth imply that income gains in Russia and the high growth developing countries will
translate directly into increased consumption, in particular for high value-added food
items such as meat and dairy products.
With rising investment, surging demand and expanding trade prospects, output growth
is expected to remain strong in China and India over the outlook period, providing the
dynamic behind activity throughout much of Asia. Export demand, in particular for
agricultural commodities, is essential to continued GDP growth in the main South American
economies. Exports should spur a return to solid growth in Brazil which is expected to
remain strong thereafter at near 4%. In Argentina, however, the rapid growth of the past few
years should slow somewhat. Likewise, economic growth in Russia, as in other CIS countries,
should dampen slightly amid concerns over fiscal discipline, but growth rates in both
countries are assumed to remain higher than in most OECD countries. Even though
economic growth in the BRIC countries is expected to remain high by OECD standards, the
assumed growth rates are nevertheless lower than they were in the recent past.
Population and income growth assumptions constitute the principal elements of the
global economic outlook in that they are the key drivers in demand developments, but
also because with globalisation, differences in regional growth prospects increasingly
determine both the future landscape of the world agricultural markets and global trade
patterns. While recent fluctuations have some impact on short term economic growth
expectations, over the longer term, projected growth rates are based on broad assumptions
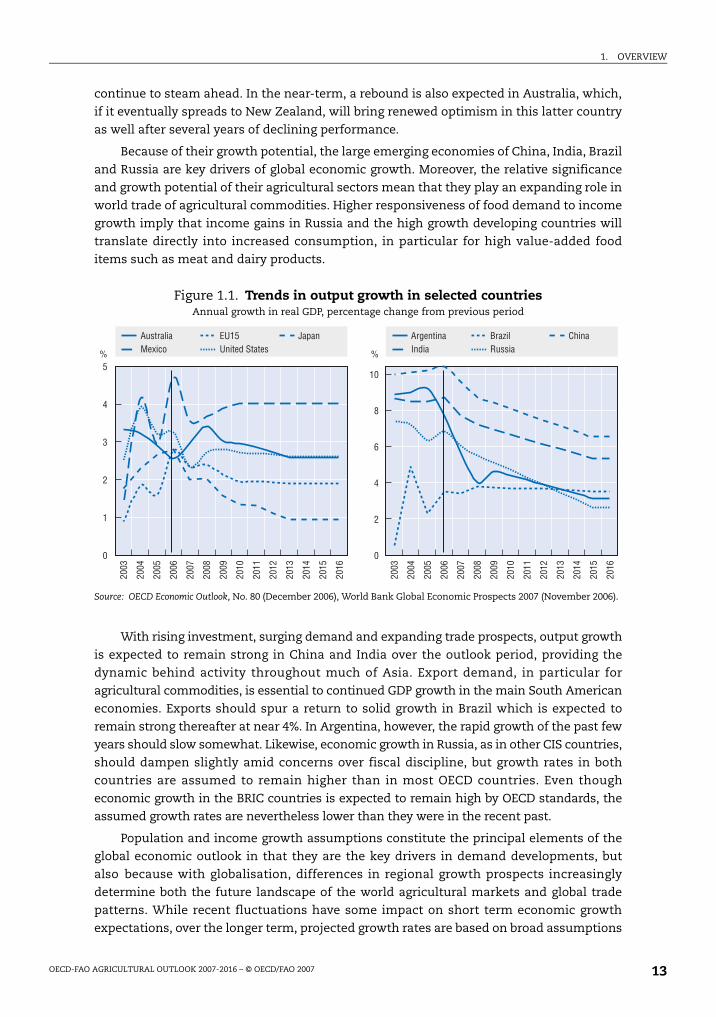
Figure 1.1. Trends in output growth in selected countriesAnnual growth in real GDP, percentage change from previous period
Source: OECD Economic Outlook, No. 80 (December 2006), World Bank Global Economic Prospects 2007 (November 2006).
��
��
�
����
�
�
�
�
�
����
���
���
����
����
����
����
����
����
����
����
���
����
����
����
���
���
����
����
����
����
����
����
����
����
���
����
�
�
�
�
��������������
����������������� �!��
"������#������
$�����%��&�� '(���
OECD-FAO AGRICULTURAL OUTLOOK 2007-2016 – © OECD/FAO 2007 13

1. OVERVIEW
about the trends of such diverse underlying factors as fertility, ageing, urbanisation, land
use and production technology, not to mention the structure and evolution of labour and
capital markets. In general, these factors change slowly over time, and in any case they are
not specifically taken into account in the present projections.
Growth in developing countries should increase potential for south-south agricultural trade
As illustrated in Table 1.1, income growth is closely related to population growth. The
regions where income growth is the highest, like Africa, Asia and Latin America, are also
those where population growth is the highest, at rates close to or exceeding 4% on average
over the next decade. Countries in these regions often have a comparative advantage in the
production of labour-intensive agricultural commodities such as fruits and vegetables due
to a substantial supply of low-cost labour and relatively limited resources of arable land.
Nevertheless, available crop land in these countries is usually utilised for year-round
cultivation of products such as sugar and rice or other staples. As shown later in
this section in the review of historical patterns of agricultural trade flows, exports of
semi-processed and processed agricultural and horticultural product have been much
larger in lower middle-income countries than they have been in low-income countries.2 For
higher value agricultural commodities such as meat and dairy products, demand is more
responsive to the rising incomes in emerging economies than it is in the mature markets
of OECD countries. In high growth developing countries this will continue to lead growth in
imports not only of processed products, but also of bulk agricultural commodities destined
for budding domestic processing industries.
Much of the uncertainty in constructing a global economic outlook comes from
projecting the nominal elements such as price indices and exchange rates. It is more
difficult to gauge the long-term dynamics of these variables which are influenced by a wide
variety of economic and political factors, particularly when in some countries their recent
trends have been unstable. Interest rate differentials, unprecedented global liquidity in
financial markets and high volatility commodity prices, in particular oil and energy prices,
contribute to the inherent uncertainties related to making assumptions for a ten year
outlook horizon.
Table 1.1. Where population and income is projected to growPopulation in 2006, million. Average annual growth over 10 year period and income share, percentage
Population Income
1997-2006 2007-20162006
million1997-2006 2007-2016
2006income share
World 1.23 1.08 6 530 2.86 3.05 100
Africa 2.20 2.04 923 4.21 4.32 1.8
Latin America and Caribbean 1.40 1.17 564 2.27 3.79 5.9
North America 1.02 0.86 332 2.81 2.62 32.3
Europe 0.29 0.06 527 2.20 2.13 27.6
Asia 1.15 0.98 4 150 3.55 4.02 30.3
Oceania 1.36 1.08 33 3.33 2.72 2.0
Note: Income is measured by GDP at USD 2000 market prices. Average annual growth is the least-squares growth rate(see glossary).Source: UN World Population Prospects (2004 Revision), World Bank Global Economic Prospects 2007 (November 2006).
OECD-FAO AGRICULTURAL OUTLOOK 2007-2016 – © OECD/FAO 200714

1. OVERVIEW
Inflation is assumed to remain low in OECD countries, despite high commodity prices
Inflation expectations remain low in most developed countries, as governments are
assumed to enforce low inflation targets through the use of appropriate monetary policies.
Throughout the OECD, consumer prices have shown substantial resilience over recent
years to oil price movements despite being subjected to upward pressure from strong
commodity price increases. Nevertheless, in most OECD countries consumer price
inflation is anticipated to remain below 3%, and in many is closer to 2% in the medium
term. For the OECD as a whole, inflation was contained at 2.4% in 2006; it is assumed to fall
and to remain below 2% by 2010. In the recent past, monetary policy responses in major
OECD countries have been swift as inflation measures neared the upper thresholds of
established targets. Although several years of sustained tightening in the United States
have ended, interest rates in the euro area and Britain have risen over the past year and
seem to have contained price pressures. Even in Japan, positive but low inflation at the end
of 2006 has led to the Bank of Japan to abandon its five-year long zero interest rate policy.
The observed effectiveness of these measures in developed OECD economies has led to
longer-term expectations that prices will remain under control in these countries.
Food price inflation is an increasing concern in emerging economies
Conversely, in many rapidly growing developing countries, inflation has become more
and more of a concern over the past year. Whereas large increases in the prices of
non-agricultural commodities have widely been attributed to the strong demand and
accelerating growth in these emerging economies, more and more, price pressure is being
felt in markets through increased demand for food products. This pressure can be either
direct, through growing demand and changes in consumption patterns as incomes rise, or
indirect as alternative uses of food crops, such as inputs for biofuels, have led to higher
domestic prices. As energy prices have subsided over the past year, food price inflation has
been increasingly accused of driving higher headline inflation. In India, inflation rates
above 6% have led to both fears of an overheating economy and concern that surging
demand for wheat will continue to exceed supply. In Argentina, where beef consumption per
capita is the highest in the world, beef exports were temporarily banned in an attempt to
lower domestic beef prices and help cut economy-wide inflation levels. Mexico too, despite
moderate inflation expectations, has experienced dramatic increases in maize flour prices.
World oil prices remain high relative to historical levels
The world benchmark Brent crude oil price assumption underlying this year’s
Agricultural Outlook is based on the assumption for the (real) average price of OECD crude oil
imports of the International Energy Agency’s 2006 World Energy Outlook. The nominal Brent
price is assumed to decline over the medium term to about USD 55 by 2012, rising again
slowly thereafter to finish just over USD 60 by the outlook horizon. This price path is
significantly higher than in last year’s outlook reflecting the sustained tightness of oil
markets. Price pressure has been maintained as geopolitical tensions combine with
processing capacity constraints to keep global supply from the major oil producers below
demand. With the easing of this tightness, the world price should decline. However, in the
longer term beyond 2012, rising marginal production costs of non-OPEC producers may tend
to impart market power to a small number of dominant, Middle East OPEC members whose
collective investment and production policies are generally expected to push prices higher.
OECD-FAO AGRICULTURAL OUTLOOK 2007-2016 – © OECD/FAO 2007 15

1. OVERVIEW
Increasing global focus on the exchange rates of high growth developing economies
The depreciation of the US dollar against several major currencies, including the euro,
Japanese yen, the Chinese yuan and the Brazilian real that began in 2006, is not expected
to persist beyond the near term. While a stronger euro may dampen the euro area’s export
prospects the weaker dollar is not expected to substantially impact Brazil’s and China’s
booming export markets. The renewed strength of the yen will improve the import position
of Japan, a major importer of US agro-food products. Likewise, the continuing appreciation
of the Korean won throughout the outlook period, in the context of strong domestic growth
and rising incomes, would help drive an expansion in Korean agricultural imports.
With the expansion of global trade opportunities, there is an increasing importance
placed on the exchange rates of developing countries vis-à-vis the US dollar because of their
prime influence on global terms of trade and external imbalances. Of particular interest is
the Chinese yuan, which has appreciated by almost 5% since the adoption of a more flexible
management system in July 2005 and is expected to appreciate further over the outlook
period. In strong growth countries like Argentina, Brazil, India, Mexico and Russia, export
markets are expanding solidly. Yet over the longer term to 2016, projected inflation rates are
higher than in the United States, amid strong demand growth, in particular for imports. This
constitutes a depreciating influence on the exchange rate vis-à-vis the dollar.
Domestic support and trade policies affect agricultural markets
Agricultural and trade policies play an important role in both domestic and
international agricultural markets, directly affecting the levels of production and
consumption of agricultural commodities and food products. More and more, agricultural
policies are directed towards achieving specific objectives (e.g. environmental performance
or biofuel development) and beneficiaries (e.g. specific groups of farmers) within broader
goals with respect to national, regional or global concerns (e.g. domestic and trade policy
reform, income inequality, food quality and safety, global warming, etc.). At the same time,
non-agricultural policies, such as energy, environment and rural development policies,
have a growing impact on the agri-food sector. Policies influence the composition and
levels of both production and consumption, thereby creating (or sometimes correcting)
market distortions and influencing prices.
No conjecture as to the future outcome of negotiations for the completion of the Doha
Development Agenda is incorporated in the Outlook projections and consequently, it is
assumed that trade policies as agreed in the Uruguay Round Agreement on Agriculture (URAA)
will hold for the entire period to 2016. As noted later in this chapter in the review of trade
flows, despite the URAA, trade in agricultural products continues to be dominated by a
relatively small number of countries. Trade flows are increasingly influenced by policies
that have been negotiated as part of regional trade agreements such as the North American
Free Trade Agreement (NAFTA), the Everything But Arms (EBA) initiative of the European
Union and the Mercosur agreement between Argentina, Brazil, Paraguay and Uruguay. The
policy assumptions of the Outlook take into account the provisions of these agreements, in
addition to existing bilateral preferential trade provisions covering specific agricultural
commodities. Regional or bilateral trade agreements have not always been explicitly taken
into account in the underlying modeling system but allowance for such agreements has
been made where they are expected to have an impact on growth in trade. This is the case
for both the Central American Free Trade Agreement (CAFTA) and the Australia-US FTA, which
is expected to have a substantial impact on Pacific region beef trade.
OECD-FAO AGRICULTURAL OUTLOOK 2007-2016 – © OECD/FAO 200716

1. OVERVIEW
This Outlook makes no anticipation of changes to agricultural policies which may be
part of forthcoming farm legislation in the United States. Although current legislation is
slated for expiry in 2007, the programmes and provisions of the Farm Security and Rural
Investment Act (FSRI) of 2002 are assumed to continue for the entire Outlook period and
moreover, no changes are anticipated in crop loan rates which are extended at constant
levels through to 2016. The requirements of the Renewable Fuels Standard (the Energy Policy
Act of 2003, modified 2005) have been taken into account, as discussed later in this section
under the assumptions related to biofuel production. The main policy elements of the EU
Common Agricultural Policy Reform of 2003, as described in previous editions of the Outlook,
are assumed to remain unchanged. For other countries, established support measures and
policy programmes (such as PROCAMPO in Mexico) are implemented as legislated. Where
well-defined termination dates exist, they are factored into the projections; otherwise
payments, provisions and other policy measures are assumed to continue through 2016.
For sugar, projections take into account the EU sugar reform implemented as of
1 July 2006, which includes a progressive cut in price support of 36% over four years and the
reduction of EU sugar subsidised exports from the current level of 7.6 Mt to the agreed
URAA limit of 1.4 Mt. The provisions also include a progressive reduction of duties followed
by unrestricted sugar exports to the EU from LDC countries under the EBA Initiative
from 2009. Another important development which has been taken into account in the
sugar projections is the resolution of a long standing sweetener dispute between the US
and Mexico under NAFTA which has resulted in an elimination of both the consumption
tax on Mexican beverages manufactured with HFCS and, from 2008, of export restrictions
and duties which should spur exports of Mexican sugar to the US.
Assumptions related to evolving biofuel productionWorld markets for cereals, sugar and, increasingly, oilseeds and palm oil, are strongly
influenced by developments in biofuels. Production of renewable energy, in general, and
biofuels in particular, has risen rapidly to the top of the policy agendas in many countries
and has become a major issue for markets. There are numerous motives behind political
support for biofuels and the composition and priorities of objectives differ across countries.
Most of the objectives can be grouped within three broad categories. First, concerns about
future energy supplies; in particular expectations of finite availability of crude oil and
increasing reliance on oil imports from countries considered as less reliable suppliers;
second, environmental concerns – most notably the increased emissions of carbon dioxide
(CO2) as one of the main causes for climate change; and finally, the development of new
markets for agricultural produce and hence increased revenues for farmers.
This Outlook does not analyse the developments in the biofuels sector, but treats
biofuel production through implicit and exogenous assumptions in a number of countries.
In particular these include the US, the EU, Canada and China, while ethanol production in
Brazil is an explicit part of the sugar baseline.
US
The US is assumed to substantially increase its ethanol production, which
predominantly is based on domestic maize. Ethanol output and corresponding maize use
is assumed to grow by almost 50% in 2007, and while growth rates are assumed to decline
thereafter, US ethanol production is still assumed to double between 2006 and 2016
(Figure 1.2). This expansion would exceed the requirements stated in the Renewable Fuel
OECD-FAO AGRICULTURAL OUTLOOK 2007-2016 – © OECD/FAO 2007 17

1. OVERVIEW
Standard (RFS) by far. In consequence, maize use for fuel production, which has doubled
from 2003, would increase from some 55 Mt or one-fifth of maize production in 2006 to
110 Mt or 32% at the end of the projection period.
Bio-diesel production, in contrast, is assumed to remain relatively limited in the US,
due to lower profitability caused by high feedstock costs. Soya oil use for bio-diesel
production is expected to reach 2 Mt in 2007 and to further increase to 2.3 Mt in 2011, with
no growth assumed for the remaining projection years.
EU
Biofuel production and use in the EU was historically for bio-diesel based on oilseeds,
mostly rapeseed. Increasingly it is assumed that ethanol, made mostly from wheat and
maize, will become important on EU markets. Despite growth in total biofuel use by some
170% between 2006 and 2010, however, it is assumed that the share of biofuels in total
transport fuel consumption will not exceed 3.3% in energy terms, rather than the 5.75%
target envisaged by the EU Biofuels Directive. Further growth is, however, expected
throughout the projection period (Figure 1.3).
Despite some increased imports of biofuels, this growth in biofuel markets translates
into strongly increased demand for feedstock products. Use of wheat in particular is set to
increase twelvefold and to reach some 18 million tonnes by 2016. Growth in the use of
oilseeds (largely rapeseed) and maize is less dramatic, but would still reach 21 Mt and
5.2 Mt by 2016, respectively.
Canada
Compared to both the US and the EU, biofuel production in Canada (a country with large
fossil-based energy resources) is small in absolute terms. In 2006, ethanol production
doubled and bio-diesel production commenced. In addition to this, the Canadian
government announced its intention to regulate biofuel by mandating a 5% ethanol blend in
gasoline by 2010 and a 2% bio-diesel blend in on-road diesel and heating-oil by 2012. In this
report projections it is assumed that these mandates are met. In compliance with the 5%
target, ethanol production, based to a larger extent on maize and to a smaller part on wheat,
Figure 1.2. Expansion of US ethanol production and corresponding use of maize
Source: ERS.
�� ���
���
��
�
��
��
�����
��
��
��
��
��
��
��
��
�
���� ���� ���� ���� ���� ��� ���� ���� ���� ����
%���������������)��(����* ���������������)+��&�*
$���,�-���.������������/�������(�����!��������� ��&������)��0�����*
OECD-FAO AGRICULTURAL OUTLOOK 2007-2016 – © OECD/FAO 200718

1. OVERVIEW
is assumed to grow by another 150% in 2007 to reach almost 1.9 billion litres in 2009,
compared to 550 million litres in 2006. Little growth, following the increased gasoline use, is
assumed for the remainder of the projection period. Bio-diesel production is assumed to see
an even stronger growth in relative terms, though at much lower levels. Standing at
70 million litres in 2006, bio-diesel production is assumed to reach 600 million litres by 2012,
with little growth thereafter (Figure 1.4).
About half the growth in bio-diesel production is expected to be derived from oilseed
oils; the remainder should be made from yellow grease and tallow. The assumed growth in
ethanol production would consume significant quantities of maize and wheat. Maize use
for ethanol is assumed to increase from 1 Mt or 4% of domestic production in 2006 to
Figure 1.3. Ethanol and bio-diesel use in the EU to increase – based on wheat, rapeseed and imports
Note: Ethanol and bio-diesel data before 2006 refer to production, from 2006 to 2016 to consumption.
Source: EU Commission, OECD Secretariat.
Figure 1.4. Canadian ethanol and bio-diesel production to expand, using growing cereal quantities in particular
Source: AAFC.
�� ��
��
��
��
�
�����
��
��
��
��
��
�
����� ��� ���� ���� ���� ���� ���
%���������������)-��.����* ���������������)���!����*
��&��.�����(����
%��1������
2(����.�����(����
��(���� 3��������.���-��1������
�0� �0�
�0�
�0�
�0�
�0�
�����
�0�
�0�
�0�
�0�
�0�
����� ���� ��� ���� ���� ���� ������� ���� ����
�0�
�0�
�0�
%���������������)-��.����* ���������������)#���������*
%��1��������(���� ��&����� 2(�������
OECD-FAO AGRICULTURAL OUTLOOK 2007-2016 – © OECD/FAO 2007 19
1. OVERVIEW
almost 3.4 Mt or more than 13% in 2008 before growing at a slow pace only for the rest of
the projection period. Wheat use will remain less important, but with an increase to close
to 1.5 Mt from 2009, ethanol production is still assumed to consume some 5.5% of domestic
production by 2016.
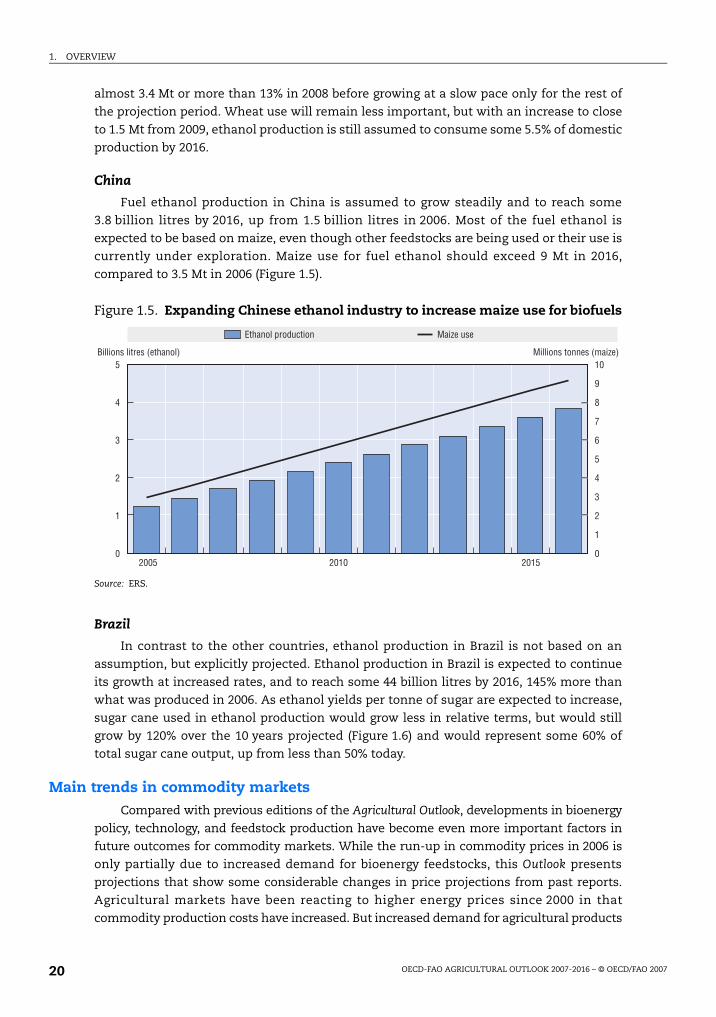
China
Fuel ethanol production in China is assumed to grow steadily and to reach some
3.8 billion litres by 2016, up from 1.5 billion litres in 2006. Most of the fuel ethanol is
expected to be based on maize, even though other feedstocks are being used or their use is
currently under exploration. Maize use for fuel ethanol should exceed 9 Mt in 2016,
compared to 3.5 Mt in 2006 (Figure 1.5).
Brazil
In contrast to the other countries, ethanol production in Brazil is not based on an
assumption, but explicitly projected. Ethanol production in Brazil is expected to continue
its growth at increased rates, and to reach some 44 billion litres by 2016, 145% more than
what was produced in 2006. As ethanol yields per tonne of sugar are expected to increase,
sugar cane used in ethanol production would grow less in relative terms, but would still
grow by 120% over the 10 years projected (Figure 1.6) and would represent some 60% of
total sugar cane output, up from less than 50% today.
Main trends in commodity marketsCompared with previous editions of the Agricultural Outlook, developments in bioenergy
policy, technology, and feedstock production have become even more important factors in
future outcomes for commodity markets. While the run-up in commodity prices in 2006 is
only partially due to increased demand for bioenergy feedstocks, this Outlook presents
projections that show some considerable changes in price projections from past reports.
Agricultural markets have been reacting to higher energy prices since 2000 in that
commodity production costs have increased. But increased demand for agricultural products
Figure 1.5. Expanding Chinese ethanol industry to increase maize use for biofuels
Source: ERS.
� ��
�
�
�
�
�
�
�
�
����� ��������
�
�
�
�
%���������������)��(����* ���������������)+��&�*
��(�����!��������� ��&�����
OECD-FAO AGRICULTURAL OUTLOOK 2007-2016 – © OECD/FAO 200720

1. OVERVIEW
in the form of bioenergy feedstocks, largely from sugar, maize, vegetable oils and wheat,
constitute an important change from previous market situations. While the emergence of
these prospects has been noted in past editions of this report, it is now a major point of
discussion and analysis worldwide. What remains to be seen is whether bioenergy
constitutes a lasting structural change for agricultural markets, and a change which is
revealed by a higher plateau for real prices. Another question is whether there will be
increased uncertainty and more price variability with higher dependence on developments
in the energy market, including the policies that affect them.
Globalisation and the rising importance of key emerging economies are having diverse
effects on world agricultural markets. The assumed strong growth in demand will initially
spur expansion in import demand of processed products as well as agricultural raw
materials. Subsequently, growing demand provides the impetus to the development of
domestic production capacity, especially given the unprecedented level of global liquidity
and the acceleration of foreign direct investment flows towards emerging markets. For
example, investment in processing capacity is expected to be particularly strong in India
and China, and it is a shared priority of many governments in high growth developing
countries to capture a larger share of the added value in domestically consumed
agricultural products. Trade patterns are also changing. In the context of growing global
markets, larger export shares are not only gained by displacing competitors, but more
importantly by growing faster than others. Against this background, OECD countries as a
whole are projected to lose export shares in many commodities to non-OECD countries
over the outlook period.
These developments taken together lead to the projection of lower production and
consumption growth prospects in the OECD region than in the developing and former
transition countries for all of the 15 agricultural commodities listed in Table 1.2, but wheat.
The largest growth differentials occur in the high value added products such as beef,
pigmeat, butter and SMP, but also sugar. They affect production and consumption equally.
The bulk of the global production growth for these products, and most of the consumption
growth as well, will originate in developing countries and transition economies.
Figure 1.6. Continued growth in Brazil cane-based ethanol production
Source: OECD and FAO Secretariats.
�� ���
���
���
���
���
�
��
��
��
��
���������
���
������
��
�
��
��
��
����
���� ���������������� �� ����� ���� �����������������
����� ���� ����� � ��������������
OECD-FAO AGRICULTURAL OUTLOOK 2007-2016 – © OECD/FAO 2007 21

1. OVERVIEW
As a result, Table 1.3 shows that developing and transition countries will take a growingshare of total world production and consumption over the outlook period – and that theshare of OECD countries is consequently declining – for the majority of products. Theexceptions are for wheat and coarse grains, where the OECD’s share in global production isincreasing. OECD shares in milk powders are much larger for production than they are forconsumption and the production shares decline initially before stabilising. The largest lossesin shares over the outlook period are for butter and milk, but also for meat products,especially beef. These products have much larger growth potential in developing countries,in particular in the largest amongst them such as Brazil, China and India, than in the maturemarkets of the OECD. While the OECD’s coarse grains production share is increasing and theconsumption share is stable, that for feed use is declining, reflecting the growing importanceof biofuel use in OECD countries. Production and consumption shares are decreasing onlyslightly for cheese, for which OECD countries remain dominant market players.
Cereal markets recover from production shortfalls while biofuel use of maize increases
Under the assumption of a return to normal yields, and the incentive of currently higher
prices, global cereal production is projected to recover from the shortfalls experienced in the
past year. The unprecedented demand for maize coming from rapidly growing biofuel
production in the United States is in the process of transforming the coarse grain market.
The impact of these changes on cereal markets may gradually ease over the years, but that
will much depend on the evolution of renewable fuel policies and further development of the
biofuel industry, particularly from a technological perspective. Driven by current low stocks
and high prices there will be a shift towards more area planted in cereals, either from
reallocation of land from other crops in the main OECD producers (Australia, Canada and the
US), from land taken out of set aside (EU) or out of CRP reserves (US) or from cultivation
of new land in many developing countries, particularly in South and Latin America.
Table 1.2. Consumption and production annual (least squares) growth rates, 2007-16
Production Consumption
% %
Total OECD Non-OECD Total OECD Non-OECD
Wheat 0.7 1.0 0.5 0.8 0.9 0.8
Rice 0.9 0.1 1.0 0.9 0.1 1.0
Coarse grains 1.2 1.2 1.3 1.2 0.9 1.5
Coarse grains used for feed 1.0 0.5 1.5 1.0 0.5 1.5
Oilseeds 2.1 1.3 2.6 1.9 1.3 2.2
Oilseed meal 2.1 1.4 2.5 2.1 0.9 3.2
Beef 1.5 0.2 2.4 1.5 0.2 2.4
Pig meat 1.7 0.4 2.3 1.7 0.5 2.2
Poultry meat 1.9 1.0 2.6 1.9 1.1 2.4
Milk 1.8 0.7 2.8 . . . . . .
Butter 2.2 –0.2 3.6 2.3 0.0 3.4
Cheese 1.3 1.1 2.1 1.3 1.1 2.0
Skim milk powder 1.0 0.6 2.1 1.1 1.0 1.3
Whole milk powder 2.4 2.2 2.6 2.5 1.0 2.8
Vegetable oils 2.5 1.6 2.8 2.5 2.4 2.6
Sugar 1.8 0.3 2.2 1.8 0.5 2.2
Source: OECD and FAO Secretariats.
OECD-FAO AGRICULTURAL OUTLOOK 2007-2016 – © OECD/FAO 200722

1. OVERVIEW
Nevertheless, beyond the initial years of the outlook, much of the growth in output is
expected to stem from area productivity gains as world prices decline from current highs.
The bulk of wheat and coarse grain production will continue to be concentrated with the
largest producers, the EU, China and the United States, along with India for wheat,
dominating over half of total world output. By 2016 global production will reach 673 million
tonnes of wheat and 1.2 billion tonnes of coarse grains.
Exports have been substantially reduced in recent years in several important
countries, in particular because of severe drought in Australia, but also because of poor
harvests in the EU and the United States. But global cereal trade is projected to rebound
and grow at close to 1.5% annually over the outlook period. The EU is expected to surpass
Canada and Australia as the second largest wheat exporter after the United States.
However, the recuperation of traditional export sources will be supplemented by export
expansion in Russia, the Ukraine and Argentina and in Brazil for coarse grains, while
Chinese exports of both cereals are expected to diminish.
Developing countries cereal imports set to grow
Significant import demand for wheat will continue to develop in India, and will grow
further in Brazil and Egypt as well as in an increasing number of developing countries.
Although the Outlook projects expanding exports from the CIS countries and Argentina,
most of the growth in import demand will be satisfied through larger shipments from
OECD countries. Rising per capita incomes and developing food markets are behind the
swelling demand that has outpaced domestic production capacity. More generally growth
in per capita food consumption of wheat is expected to remain modest in most countries.
Despite the prospects of increased biofuel use of maize, which will be largely grown
domestically, demand growth for coarse grains in world markets will be predominantly
driven by increased feed demand from thriving livestock industries in emerging economies
Table 1.3. Consumption and production of OECD countries as a share of world total
Production Consumption
% %
2006 2011 2016 2006 2011 2016
Wheat 39.6 43.0 43.3 33.6 34.3 34.2
Rice 5.0 4.9 4.7 5.2 5.1 4.8
Coarse grains 50.8 52.6 52.5 50.2 50.9 50.0
Coarse grains used for feed . . . . . . 54.7 53.0 51.8
Oilseeds 42.1 38.5 37.7 39.4 38.4 36.9
Oilseed meal 40.0 38.6 37.0 53.6 49.6 46.8
Beef 41.1 37.7 36.3 41.5 38.6 37.1
Pig meat 34.9 32.5 30.2 33.6 31.4 29.5
Poultry meat 45.5 43.1 41.8 43.8 41.2 40.2
Milk 46.6 44.0 41.6 . . . . . .
Butter 41.3 36.1 32.4 35.8 31.3 28.3
Cheese 78.4 77.6 76.9 76.0 75.7 74.9
Skim milk powder 76.7 73.0 73.7 54.6 54.0 54.1
Whole milk powder 46.1 43.6 43.8 19.5 17.7 16.7
Vegetable oils 26.0 25.4 23.8 35.4 35.8 35.2
Sugar 24.0 22.4 21.0 26.9 24.7 23.3
Source: OECD and FAO Secretariats.
OECD-FAO AGRICULTURAL OUTLOOK 2007-2016 – © OECD/FAO 2007 23

1. OVERVIEW
such as China, India and Argentina. Import growth in China will augment its position as a
major coarse grain importer. While the quantities of coarse grains destined for dominant
importers such as Japan, Korea, Mexico and Saudi Arabia remain broadly stable throughout
the outlook, a rising share will be headed for key importers such as China, Egypt and the
Islamic Republic of Iran as well as Colombia and Chile.
Rice production set to expand
More than cereals, rice is an essential crop for many developing countries because its
cultivation is particularly suited to their climate and arable land characteristics, and
consequently, rice has been a staple food in their traditional diet. While growth in wheat
and coarse grain consumption is linked to increases in per capita incomes, growth in rice
consumption remains tied to underlying population growth, with per capita consumption
expected to rise only slightly over the outlook period, mostly because of growth in Africa.
Nevertheless, rice production is set to expand, in part because of policies in many
developing countries to promote rice cultivation as a means of supporting farmer incomes
and limiting rural emigration, as well as both national and regional efforts to encourage
food self-sufficiency, especially in Sub-Saharan Africa. Still, the largest production gains
will come from the major rice producers, such as India, Indonesia, Thailand and Viet Nam.
Rice stocks throughout the world have declined dramatically from their high levels of
the past decade and there has been a significant increase in global rice trade. At the same
time rice export prices have risen, with particularly sharp escalations in recent years. The
trend in trade expansion is expected to persist, with prices climbing even higher in the
short-term before beginning a gradual decline. Underlying this expansion is the higher
import dependency projected for Asian producers such as China and Indonesia, along with
growing demand in Turkey and in Middle East countries like Saudi Arabia. In addition,
changes to trade policy in some OECD countries, like scaled back import duties in the EU
and an enlarged quota in Korea, will also spur imports. In terms of exports, despite recent
contractions, steady growth in the longer term will continue to be driven by the small
number of dominant market players in Asia, principally Thailand, but also Viet Nam and
India, with only moderate export growth expected in the United States.
Global oilseed production and oilseed meal exports to expand
Biofuels are also strong drivers of oilseeds markets both directly through demand for
oilseed oils in the bio-diesel production process and indirectly through the impact of the
relative prices of oilseeds and maize which affect the competition for arable land between
these crops, particularly in the US. Furthermore, because of rapidly rising maize prices
relative to those for oilseeds, there is an increasing demand for oil meals to replace maize
in livestock feed rations as a source for energy. In the current context of high cereal prices,
oilseed meals are cheaper than coarse grain sourced feed – but this relative cost advantage
may be short lived as maize-based ethanol production develops, feed will become available
from low-cost distiller by-products, creating new sources of competition for oilseed derived
protein meals, particularly in the United States. OECD oilseed production will remain
broadly stable with most of the changes taking place through crop reallocation and a
geographical redistribution of production.
Oilseed production in Brazil and Argentina will intensify as arable land is diverted from
pasture to oilseed crops. With Brazilian production growing by 3.9% per year on average over
the outlook period, it will overtake the United States by 2009 as the world’s largest oilseed
OECD-FAO AGRICULTURAL OUTLOOK 2007-2016 – © OECD/FAO 200724

1. OVERVIEW
exporter. Argentina will cultivate its position as a regional hub for oilseed crushing with
differential export tax enticements and investment in processing capacity contributing to
promote the domestic crushing industry. This will lead to a 33% rise in protein meal exports
as well as higher exports of both meal and oil to satisfy growing import demand in China.
By 2016, China will have become the world’s largest importer of oilseed meals and it will have
further consolidated its leading position in imports of oils and oilseeds. For the latter
product, its share in global imports will have risen to almost 50%.
Increasing world livestock production will continue to drive the consumption of
oilseed-derived protein meal, with most of the growth taking place in developing
countries. Oilseed meal consumption in the non-OECD region will swell by over 55% with
over two-thirds of the growth attributed to Brazil and China alone because of expanding
livestock production. While the EU should continue to hold its position as the largest
importer of oilseed meals, its import dependency will diminish as a growing proportion of
the region’s protein meal consumption comes from domestically produced and crushed
oilseeds, in particular rapeseed meal. The nurturing of bio-diesel production capacity will
stimulate oilseed oil demand in the EU which, when combined with the growing demand
for oilseed and palm oil for food use, will almost double EU imports of vegetable oils over
the outlook period. Despite strong investment led growth in China’s domestic oilseed oil
production capacity, expanding demand for food oils will continue to spur imports in this
country as well as in India.
Largely driven by income growth, vegetable oils, both from oilseed crops and from
palm, will remain the fastest growing commodity in terms of consumption covered in this
Outlook. Within this overall context, growth rates of the developing countries almost double
those of developed countries. Over time, increased vegetable oil consumption has made a
large contribution to increased calorie consumption. Use of vegetable oils for bioenergy
purposes is expected to grow strongly, and may alter trade patterns and the consumption
mix in diets in some countries/regions depending on policies in place. This may be
particularly the case in the EU where bioenergy use of vegetable oils has been mostly
oriented to the use of rapeseed oil.
A closer link between sugar and ethanol
Brazil is the world’s leading sugar and ethanol producer and currently accounts for
around 40% of world sugar trade. Demand for sugarcane-based ethanol by domestic
motorists and for export is expected to continue to rise at a rapid rate and to account for a
larger share of Brazil’s sugar cane crop. However, these developments are not expected to
unduly constrain the amount of cane available for sugar production and sugar exports
projected to rise strongly and to exert a moderating influence on world price prospects over
the coming decade. Further production and trade growth is also expected in other leading
sugar exporting countries, such as Australia and Thailand. Following reform of its sugar
regime, the EU is expected to reduce production in a context of rising imports and tight
controls on subsidized exports and may eventually challenge the Russian Federation for its
role as the leading sugar importer. Mexican sugar exports to the US should increase when
duties and restrictions are eliminated under NAFTA in 2008, although rising consumption
is expected to reduce its exportable surplus. Countries in Asia are expected to experience
the fastest growth in sugar consumption, with China, Indonesia, Korea and Japan
remaining significant sugar importers.
OECD-FAO AGRICULTURAL OUTLOOK 2007-2016 – © OECD/FAO 2007 25

1. OVERVIEW
Developing countries increasingly dominant in the meat outlook
The global outlook for meat is increasingly characterised by rising production and
consumption trends of developing countries and a more stable and mature path of
development for markets of OECD countries. Still, animal disease outbreaks in recent years
have affected established trade patterns for meat products, led to short-term perturbations
to supply and demand in major trading countries and an increased market share of
disease-free exporting countries. In response to these outbreaks, consumption decisions in
OECD countries will be to a greater extent driven by quality assurances such as traceability,
meat-packing requirements and processing controls which reinforce an underlying
preference for premium quality meats. While per capita consumption in high income
countries is expected to increase only marginally over the outlook period, rising incomes
and the ensuing diversification of diets will lead to a shift towards significantly higher
meat consumption in developing countries, representing more than 80% of expected world
growth. Much of this expansion will take place in Asia and the Pacific region, and will
reflect in particular the rise in consumption of pigmeat.
Over the outlook period, world meat production is expected to grow by 1.7% per year,
mostly because of expanding markets in Brazil, China and India. As a result, the production
share of major OECD producers will continue to fall, despite expectations of renewed growth
in the United States. With trade recovering from the effects animal disease outbreaks, a
small number of major exporters, namely Brazil, the US, Canada, Argentina and Australia,
will remain dominant in world markets with export growth particularly strong in South
America. By 2016, net exports of Brazil are expected to surpass those of the four others
combined to take a 28% share of total world meat exports. Beef trade is continuing to recover
between the US and Canada ensuring that the United States remains the world’s largest
meat importer at the end of the outlook period followed by Japan and Russia.
The burgeoning economies and strong income growth in Korea, Saudi Arabia, Mexico
and the Philippines will contribute to a considerable rise in meat imports in these
countries, increasing their importance in regional markets. Import dependency in meat
products is likewise expected to grow in many other dynamic developing countries as
nascent demand surpasses the domestic capacity for meat production throughout the
duration of the outlook period.
Growing importance of developing countries in dairy supply and demand
One of the most prominent trends in the Agricultural Outlook is the increasing
importance of developing countries in the supply and demand for dairy products. Milk
production gains over the outlook period will be overwhelmingly driven by output growth
in non-OECD countries. Expansion in India, the largest individual producing country in the
world, where surging demand growth will stimulate a strong increase in milk and butter
production, will be especially marked. Driven by substantial yield gains, strong growth in
milk production is also expected in China. This contrasts the moderate growth in the OECD
area where milk production mainly increases due to gains in Oceania and the United States
and is chiefly constrained by domestic production controls in many other countries.
The escalation of world dairy prices of recent years may now be regarded as symptoms
of broader structural changes. First, urbanisation and higher incomes have shifted diets in
emerging economies towards higher consumption of not only butter and cheese, but also
to increasingly more versatile milk powders. These trends have been encouraged by
OECD-FAO AGRICULTURAL OUTLOOK 2007-2016 – © OECD/FAO 200726

1. OVERVIEW
growth in dairy marketing as retailing channels develop and through government
programs in some countries. Second, with technological advances and wider global
investment there is a shift towards higher value-added processing of dairy products. In
developing countries this includes improvements in storage and processing capacity which
allows the production of more fresh dairy products, but also improved processing of WMP.
In the mature markets of developed countries, value-added innovation means increased
convenience and a wider variety of products, in particular cheeses and flavoured fresh
dairy products, which cater to specific consumer tastes. Lastly, but indeed not least
importantly, with dairy market reform, intervention stocks have broadly ceased to be
systematically unloaded onto world markets while at the same time, subsidised exports
have diminished significantly. Both of these distortionary policy practices, which
traditionally had the effect of holding down international dairy prices, are thus likely to be
much less prevalent over the outlook period than in previous years.
Dairy exports continue to be dominated by OECD countries
Nevertheless, trade in world dairy markets will continue to be dominated by the
traditional OECD exporters of Australia, New Zealand and the EU, with growth expected for all
products except butter. Trade remains regional, with for example, intra-EU trade larger than all
remaining global trade put together. Still, non-OECD countries gain export share in butter and
SMP, filling the place left by declining EU exports in light of diminished intervention stocks.
Argentina’s surging milk production is behind its emergence as an up-and-coming WMP and
cheese exporter, while exports of these products from the EU should remain roughly stable.
Rising exports of all dairy products are expected from New Zealand. Russia, Japan and the US
will continue to be key cheese importers while more and more milk powders are destined for
milk reconstitution in developing countries, most notably in the Middle East and North Africa
but also in Mexico. China’s strong increase in consumption of dairy products will be largely met
by a sharp growth in domestic production with only a marginal growth in imports, in particular
of whole milk powder.
High world prices for most products at the beginning of the outlook period
Actual world prices rose much more strongly in 2006 than earlier anticipated for
cereals and dairy products, and to a lesser extent also for oilseeds, but weakened markedly
for sugar. Are these unexpected price developments the result of systemic changes in
commodity markets, leading to longer term price strength? Or are they the result of short
term factors, such as weather-related production shocks, with prices in the longer term
returning to their historical equilibrium levels?
In looking at the price developments that have taken place in 2006, a number of
factors have been identified as contributing to the observed price changes for the
agricultural products covered by the Agricultural Outlook.
● For cereals, weather-related shortfalls in production have occurred in a number of
producing countries and regions such as the US, the EU, Canada, Russia, Ukraine and
most notably in Australia, where production fell by more than 50%. In a global context of
low global cereal stocks in recent years, these lower supplies have been a strong factor
underpinning world prices.
● Reduced global stocks and production were confronted with stronger than expected
demand for cereals for biofuel production, notably in North America and Europe. This
additional demand compounded the already tight supply situation and contributed to
OECD-FAO AGRICULTURAL OUTLOOK 2007-2016 – © OECD/FAO 2007 27

1. OVERVIEW
further strengthening of world cereal prices. It is noteworthy, however, that the
combined cereal supply shortfall in North America, Europe and Australia in 2006 of over
60 Mt was nearly four times larger than the 17 Mt increase in cereal use for ethanol in
these countries.
● Growing cereal use for ethanol lead to a reduction in planted acreage to oilseeds,
particularly in the US, in favour of maize. Increasing cereal prices relative to those for
oilseeds caused this land reallocation. As a knock-on effect, oilseed prices then also
increased as a result of tightening supplies and this price strength was enhanced by
rising demand for meals as a cereal feed substitute and increasing demand for vegetable
oils for bio-diesel production.
● World sugar prices surged in late 2005 and early 2006 to reach 25-year highs under the
pressure of tight global supplies and growing linkages between international sugar and
oil prices, but then fell back again later in the year. Sugar prices remained below earlier
expectations for 2006-07, reflecting abundant supplies, higher stocks and an emerging
global surplus. Sugar reform in the EU and the retraction of large white sugar supplies
from the international market contributed to a widening white sugar premium in 2006.
● Continuing solid demand for dairy products in combination with rising feed costs and
reduced overall supplies, most notably in the European Union and Australia, accounted
for most of the price increase for these products, particularly for milk powders. Policy
reforms in the EU are behind the reduction in EU dairy surpluses and the drop in
subsidised exports. This may constitute a more permanent element of price strength in
world dairy markets.
● World meat prices stayed in line with earlier expectations for 2006. Abundant supplies
and the demand-reducing impacts of Avian influenza continued to exert downward
pressure on prices for pigmeat and poultry. A number of factors, including FMD in Brazil,
drought induced slaughter in Australia, and export taxes in Argentina, offset each other
to keep beef prices leveled. Lamb prices, however, fell more strongly than earlier
expected for 2006 due to drought-induced slaughter in Australia.
World market prices in the medium term remain above previous projections
The foregoing would suggest that much of the observed variation between actual and
projected prices in 2006 can be explained largely by short-term production shocks and
resulting supply/demand imbalances. But longer-term influences may also be at work,
even though they may have been masked by the more traditional market fundamentals.
For instance, policy reform leading to lower use of export subsidies may have lifted prices
for dairy products and sugar. And maize prices in the US have undoubtedly been supported
by increased biofuel production. There is obviously growing interest in many countries in
the development of renewable energy supplies based on the use of agricultural feedstocks.
This link is well established in the case of the US and Brazil, and is emerging as an
important additional dimension to global demand for cereals, oilseeds and sugar products
over the projection period.
In a context of generally lower global stocks in recent years, this additional demand is
expected to underpin prices and to lead to price levels for field crops that are, on average,
higher than in past projections. Nevertheless, cereal, oilseed and sugar prices are expected
to fall below current or recent peak levels. Higher average crop prices and associated feed
costs, in turn, lead to higher livestock product prices over the outlook period as well.
OECD-FAO AGRICULTURAL OUTLOOK 2007-2016 – © OECD/FAO 200728

1. OVERVIEW
There are a number of uncertainties in relation to biofuel markets and how important
they will prove to be in underpinning prices in agricultural markets in the future. These
uncertainties include the nature of agricultural and trade policies that will be implemented
to nurture biofuel production from domestic agricultural crops, the pace of technological
progress in developing viable “second generation” biofuel production plants that utilise
cellulosic feedstocks rather than food and feed crops, and the future price of oil. A different
combination of these factors than is anticipated in this Outlook could lead to lower prices
than are now projected.
Cereal prices lose some of their current strength
Trends in nominal world indicator prices for the different commodities are shown, first
for crop commodities in Figure 1.7, and then for livestock products in Figure 1.8. World cereal
prices have been driven higher as the weather-related production shortfalls of the past year
and dwindling global stocks have tightened supply on world markets. They should decline
towards the end of the outlook horizon, but should stay substantially higher than prices
Figure 1.7. Outlook for world crop prices to 2016Index of nominal prices, 1996 = 1
Source: OECD and FAO Secretariats.
Figure 1.8. Outlook for world livestock product prices to 2016Index of nominal prices, 1996 = 1
Source: OECD and FAO Secretariats.
�0
���
�0�
�0�
�0�
�0�
�0���� ��� ��� ���� ��� ��� ���� ������� ��� ���
�0�
�0�
�0�
�0�
�0
�0
����
�0
�0�
�0�
�0�
�0�
�0�
�0�
�0�
�0�
�0�
�0
�0
�0
�0�
�0�
�0�
�0�
�0�
�0�
�0�
�0�
�0�
�0
�0
���� ����
$�.�������#��
$�,���#��
4�#���-������
3������
3�������+���
$���
2(���
'������#�����
�0
���
�0�
�0�
�0�
�0�
�0���� ��� ��� ���� ��� ��� ���� ������� ��� ���
�0�
�0�
�0�
�0�
�0
�0
����
�0
�0�
�0�
�0�
�0�
�0�
�0�
�0�
�0�
�0�
�0
�0
�0
�0�
�0�
�0�
�0�
�0�
�0�
�0�
�0�
�0�
�0
�0
���� ����
�5�+�+��5�!�,���
2(����+��5!�,���
%�����
6�#+���
%��.
6�����7'(����
OECD-FAO AGRICULTURAL OUTLOOK 2007-2016 – © OECD/FAO 2007 29

1. OVERVIEW
observed over the past decade because of expanding food demand in developing countries as
well as budding demand for maize in ethanol production. Very similar prospects are seen in
rice markets, with expanding global food demand as incomes and populations grow pushing
international prices to their highest levels in a decade, before falling back gradually.
Price strength in the oilseed sector dominated by vegetable oils
Oilseeds and oilseed meals prices will continue to rise through 2007 partly as a result
of the run-up in cereal prices that have made oilseed protein meals to become a more a
cost-competitive animal feed. In subsequent years however prices will gradually fall back
as supply and demand adjust. For the sugar market, world indicator prices had swelled to
quarter-century highs during the 2005/06 marketing year, almost doubling in the space of
two years. However, their subsequent decline in 2006/07 as sugar balances moved into
surplus has been equally dramatic, particularly for raw sugar which fell 27%. Sugar prices
will remain under pressure throughout the outlook period, with the white sugar margin
remaining substantial, particularly in the first years, as high quality EU white sugar is
pulled from world markets under reforms to the EU sugar regime.
Meat prices stay above recent averages
A return to normal market conditions for meat products has brought about
diminishing world prices. For beef, this trend will continue for most of the projection
period, with prices moderately strengthening again during the outer years. Pigmeat prices
rally in the first years of the outlook to 2009, but thereafter remain stable. A similar trend
prevails for poultry prices, although they are expected to continue to rise for a longer
period before stabilising, reflecting growing demand in North and Latin America and in
Europe. World prices of dairy products, which had escalated strongly in 2006 and 2007, will
remain at these elevated levels throughout the outlook, partly reflecting the structural
changes that reforms have brought about on world markets.
UncertaintiesWeather-related production shocks, future policy developments, animal diseases
outbreaks and unstable macroeconomic performance are among the main uncertainties
affecting the prospects for world agricultural markets over the medium term. The effects
of recent drought in Australia attest to this degree to which such shocks may impact
markets – wheat and coarse grain production fell by more than half in 2006, and in a
context of global cereal production shortfalls, contributed to rising world prices. While
economic growth seems to be firming up in Europe and Japan, recent years have shown
that optimism about future output growth has sometimes been premature and does not
necessarily mean that growth in demand, imports or exports will be forthcoming. Past
experience has shown that it is very difficult to predict the future level of world oil prices,
or even to correctly guess the direction in which they will move. Yet, the outlook
projections are dependent upon a world oil price assumption – one that is felt to be the
most consistent assumption available for the 10-year projection horizon.
OECD-FAO AGRICULTURAL OUTLOOK 2007-2016 – © OECD/FAO 200730

1. OVERVIEW
Trade and domestic support policy
The future of international trade policy is a key uncertainty in this outlook. If and when
the Doha Development Agenda of multinational trade negotiations come to a conclusion, the
agreement will result in generally lower barriers to trade in agricultural products and
diminished levels of domestic support for agricultural production. The overall outcome
would be less distortion to world markets, leading to a better distribution of production
according to comparative advantages, implying increased trade in agricultural commodities
and generally higher world prices; but there may be downward price pressure from increased
competition in some specific markets where protection has traditionally shielded producers
from declining world prices. While the effects of regional trade agreements, such as CAFTA,
have been implicitly incorporated in the outlook projections, it is difficult to accurately gauge
the response in the diverse range of agricultural sectors to increased liberalisation,
particularly during implementation periods. Similarly, there is a general trend toward more
bilateral agreements, which may both reinforce existing trade patterns as well as creating
new and unanticipated trade channels.
A forthcoming United States’ farm bill may have significant implications given the
relative importance of US agricultural output and its dominant position in world markets.
As any new policies will be likely implemented as soon as 2008, only the second year of the
current outlook projections, any substantial changes to domestic support payments and
crop loan rates would have consequential impacts on the present projections, which are
based on policy assumptions according to the 2003 FSRI Act.
The future developments in the biofuel industry – in particular in terms of policy and
technological developments – are unclear, and this implies uncertainty for agricultural
markets, especially those for cereals, oilseeds and sugar crops. Earlier in this section an
overview of biofuel assumptions were presented which set the foundations for the current
outlook. However, public support measures are necessary in a majority of countries (and in
almost all OECD countries) for biofuel production to be profitable. The form and substance
of these biofuel policies can have significant implications for biofuel production but also
for cereal, oilseed and sugar use, for feed prices and subsequently for livestock numbers
and meat and dairy production. Moreover, most biofuel policies are new and it is not clear
which measures are most effective in achieving the mix of objectives such as lower fossil
fuel dependence or less greenhouse gas emissions, not to mention domestic support for
farmers. It is natural to assume that these measures may be adjusted in unpredictable
ways over the coming decade as biofuel production unfolds. In addition, even if this Outlook
assumes crude oil prices in a range from USD 55 to USD 60, it is not excluded that lower
prices may prevail, impacting on the profitability of ethanol/bio-diesel production and
demand and prices for feedstocks.
Animal disease impacts
As previously stressed, the current outlook has been produced within the context of
“normal” conditions for the meat sector, which is to say an absence of animal disease
outbreaks and no explicit accounting of animal disease restrictions on production, trade or
consumption. At the same time, the projections anticipate a recovery from trade
disruptions resulting from recent disease outbreaks. These recent occurrences include
reduced beef trade in North America due to BSE, export restrictions on beef and pigmeat
following FMD in Argentina and Brazil and the effects of Avian influenza in Asia and
Europe. Any renewed occurrences would likely reduce the speed of recovery.
OECD-FAO AGRICULTURAL OUTLOOK 2007-2016 – © OECD/FAO 2007 31

1. OVERVIEW
Since the magnitude and extent of potential epizootics is by nature unknown, the
evolution of global meat markets could be dramatically different from the baseline
anticipated in the outlook if either fresh outbreaks of known diseases occur or if a new
epizootic of an unfamiliar disease strikes. Nevertheless, substantial international efforts
have been made to limit the impacts of new outbreaks. On the supply side, these include
the regionalisation of export embargoes, more stringent animal health and inspection
regulations as well as implementation of vaccination policies. On the demand side,
consumers have been reassured by measures to ensure early detection of infection,
information on potential health risks, improved production control standards and efforts
to ensure meat traceability. The implications of animal disease occurrences have been
investigated in recent joint OECD-FAO work on animal disease scenarios.
Strong growth in emerging economies
The projections have been produced under the assumption that the strong growth in
countries such as China, India and Brazil will persist, in turn spurring broader growth in
Asia and South America. All three countries have a growing presence in agricultural
markets, albeit India is less of a trader than the other two. However, the robust growth in
these countries is a relatively recent and unprecedented phenomenon, therefore it is
difficult to foresee the consequences of expansion being plagued by what are commonly
referred to as downside risks.
Inflation is one of these risks. There has been increasing speculation that the economy
in India is overheating and that with demand outpacing supply, imports cannot keep up.
Additionally, price pressure on commodities and food products is compounded by the lack
of consolidation in markets. In Brazil, with historical bouts of high inflation, there are risks
that strong export growth will, as in Argentina, drive domestic prices higher. While China
does not currently have significant inflation worries – indeed its projected inflation rate is
lower than that of the United States – there may be some risk inherent to the future path
of the Yuan-US dollar exchange rate. The assumption in this report, in the aim of
consistency, implies constant exchange rates in real terms from 2008 and thus, because of
the differential in inflation rate vis-à-vis the United States, there is an appreciation of the
Yuan in the medium term, before depreciation over the outer years of the outlook period.
The Yuan is currently under a flexible, but managed system, yet it is widely anticipated
that given the current size of Chinese dollar reserves, the Yuan might appreciate, perhaps
over the entire period of the outlook. If this were the case, then Chinese agricultural
imports may be even larger than projected in the outlook, and simultaneously, exports may
be diminished. Lastly, past government policies in favour of self-sufficiency in both China
and India have impeded the flow of imports of some agricultural commodities. While
decisions in such a direction are not anticipated, further policies of this type would have an
impact on the outlook for agricultural trade.
OECD-FAO AGRICULTURAL OUTLOOK 2007-2016 – © OECD/FAO 200732

1. OVERVIEW
Box 1.1. Partial stochastic analysis:Variability around deterministic projections
The projections presented in this Outlook are deterministic in the sense that they correspond to aparticular market environment that is conditioned by specific assumptions on exogenous variables.However, there are uncertainties concerning that environment, notably with respect to keyassumptions with regard to weather and macroeconomic conditions. Varying these assumptionswould directly affect the outlook accordingly: the question is by how much and what would be theimplications for the projections. If assumptions for these variables were to be at least partly definedby a range of possible values, then projection outcomes can be assessed for the many resultingdifferent situations. The process is then partially stochastic rather than deterministic, in the sensethat the range of assumptions defines a range of projection outcomes. Thus, a set of more robustprojections can be generated where uncertainty can at least be described by a range around thespecific deterministic baseline.
The analysis presented in this box is carried out with the use of the Aglink-Cosimo model thathas been applied in the generation of the baseline projections. Details on the process of doingpartial stochastic analysis are given in the methodology section of the Outlook. To carry out thestochastic experiments, the model is calibrated to the final set of baseline projections and is thensimulated 500 times under different values for yields (to allow for weather variability) and for GDPand inflation (to allow for variability in key macroeconomic variables). These simulations providea set of 500 different outcomes for all projection variables, in particular for the evolution of worldmarket prices, which is assessed below.
Figure 1.9 illustrates the process of undertaking a stochastic analysis. It presents the evolution ofworld oilseed yields in the 500 stochastic simulations by three lines: The average value of the500 stochastic simulations for the focus variable, the 10% percentile value, i.e. the value belowwhich 10% of the simulations can be found and the 90% percentile, i.e. the value below which 90%of the simulations can be found. These three lines give an overview of the projected distribution ofworld oilseed yields for each year in the projection period. The world oilseed yield is an aggregatemeasure. It summarises the yield information from all producing countries and as such is aproduction weighted aggregate of the different yield simulations in producing countries. The figureunderlines the fact that historical deviations from trend for world oilseed yields have been globally,and at least historically, relatively modest.
Figure 1.9. The range of world oilseed yields in the stochastic simulations
�0�
���� ���� ���� ��� ���� ���� ���� ���� ���
�0�
�0�
�0�
�0�
�0�
�0�
�0�
8�������������9(������
�:���#��:������.�����(��������+��������
����!�����������.��(���+!�������������-����� ����!�����������.��(���+!�������������-�����
OECD-FAO AGRICULTURAL OUTLOOK 2007-2016 – © OECD/FAO 2007 33

1. OVERVIEW
Box 1.1. Partial stochastic analysis: Variability around deterministic projections (cont.)
Price impacts with partial stochastic simulations
Figure 1.10 presents the evolution of world oilseed prices expressed in real terms whendeterministic assumptions on yields and macroeconomic variables are replaced by a rangedetermined through stochastic simulations. The particular interest of Figure 1.10 is to see thecombined effect of the different simulation assumptions on the world price of a given commodity.One first point to underline is that the evolution of the average of world oilseed prices expressedin real terms over the stochastic simulation is different from the evolution of the deterministicbaseline. In 2016, the world oilseed price expressed in real terms in the deterministic baseline is 8%lower than the average of stochastic simulations. This is due to interactions between the differentvariables that are being shocked in the stochastic analysis in comparison to the benchmarkscenario and to the non linearity of the Aglink-Cosimo model. Another interesting point regardingthe distribution of outcomes of stochastic simulations for world oilseed prices is that there is adiversity of outcomes around the average of the stochastic simulation. At the end of the projectionperiod, half of the stochastic outcomes are within a range of –20% to +15 % around the averagestochastic outcome whereas the complete range of outcomes is much wider.
Drivers for world oilseed prices expressed in real terms
What drives the uncertainty in world oilseed price projections (expressed in real terms) that havebeen illustrated in Figure 1.10? Obviously many variables as well as interactions between variablesinfluence the evolution of world commodity prices, but the focus here is on the relation betweenworld yields and world price levels only.
To answer the question, a simple comparison is presented in the next four graphs. They show therespective projected distributions in 2016 of four variables: World oilseed yields, world coarsegrains yields, the world maize price and the world oilseed price, both expressed in real terms. Thedeterministic baseline is also shown in the different figures.
Figure 1.10. Evolution range of the world oilseed price (expressed in real terms) in the stochastic simulations
���
���� ���� ���� ���� ���� ��� ��� ��� ���
���
���
���
��
��
�� �����
���������������������������������������
� �!�������������������!�������"�����#����� $� �!�������������������!�������"�����#�����
%� �!�������������������!�������"�����#�����
�� �!�������������������!�������"�����#�����
��������������#�������
OECD-FAO AGRICULTURAL OUTLOOK 2007-2016 – © OECD/FAO 200734

1. OVERVIEW
Box 1.1. Partial stochastic analysis: Variability around deterministic projections (cont.)
Figure 1.11 shows that the relationship between world oilseed prices and yields is not obvious.The distribution of prices expressed in real terms and yields is fairly strongly concentrated withrelatively few outliers. The deterministic baseline outcomes are within that part of the stochasticdistribution that is most heavily concentrated.
The relationship between world coarse grains yields and the world maize price is presented inFigure 1.12. The negative correlation between yields and prices seems to be more obvious andstable than in the case of oilseeds. Again the deterministic baseline projection is in the mostconcentrated part of the cloud of points.
Figure 1.11. Outcomes of stochastic simulations versus deterministic baseline in 2016: Relation between world oilseed price (expressed in real terms)
and world oilseed yields
���
�0�� �0�� �0�� �0�� �0�� �0�� �0�� �0��
���
���
���
���
���
���
�
���
���
��
2�������������!����������;9������)��!������������������+�*
����(��������+�������� ;����+��������-�������
2�������������7�������������9(�
�:���#���.�����(��������+��������
Figure 1.12. Outcomes of stochastic simulations versus deterministic baseline in 2016: Relation between world maize price (expressed in real terms)
and world coarse grains yields
���
�0�� �0� �0� �0� �0� �0�� �0��
��
���
���
���
��
�
�
��
��
2�����+��&��!����������;9������)��!������������������+�*
����(��������+�������� ;����+��������-�������
2������������#������7�������������9(������
�:���#���.�����(��������+��������
OECD-FAO AGRICULTURAL OUTLOOK 2007-2016 – © OECD/FAO 2007 35

1. OVERVIEW
Box 1.1. Partial stochastic analysis: Variability around deterministic projections (cont.)
Figures 1.13 and 1.14 illustrate both the same point: World oilseed prices expressed in real termsare directly influenced by world coarse grain markets. If coarse grain yields are low then worldmaize prices tend to be high, and this in turn tends to push world oilseed prices higher too.
Figure 1.13. Outcomes of stochastic simulations versus deterministic baseline in 2016: Relation between world oilseed price (expressed in real terms)
and world coarse grains yields
Figure 1.14. Outcomes of stochastic simulations versus deterministic baseline in 2016: Relation between world oilseed and maize prices
(both expressed in real terms)
���
�0�� �0� �0� �0� �0� �0�� �0��
���
���
���
���
���
���
�
���
��
���
2�������������!����������;9������)��!������������������+�*
����(��������+�������� ;����+��������-�������
2������������#������7�������������9(�
�:���#���.�����(��������+��������
���
� �� �� � ��� �� ���
���
���
���
���
���
���
�
���
��
���
��������
2�������������,�����!����������;9������)��!������������������+�*
����(��������+�������� %�������
2�����+��&��!����������;9��������!������������������+�
�:���#���.�����(��������+��������
OECD-FAO AGRICULTURAL OUTLOOK 2007-2016 – © OECD/FAO 200736

1. OVERVIEW
A short review of historical patterns in trade flows for agricultural productsThe Agricultural Outlook provides an assessment of the evolution of agricultural
markets and trade over the next 10 years, assuming constant policies and “normal”
weather conditions. As the focus of the Outlook is on selected temperate-zone products,
occasionally it is useful to review the trade developments of the entire agriculture and food
sectors in the recent past to place current and future developments in perspective. This
section reviews agricultural and food trade over the twenty-year period from 1985 to 2004
and puts the spotlight on agriculture as defined at the WTO, i.e. including the whole gamut
of produce from farm gate to dinner plate. In order to simplify the presentation,
the commodity composition of agricultural trade has been segregated into four broad
sub-sectors following the classification in Regmi et al. (2005). These categories are: 1) bulk
commodities such as wheat or coffee; 2) horticultural commodities such as bananas
or cut flowers; 3) semi-processed commodities such as live animals or vegetable oils;
and 4) processed products, i.e. goods that require extensive transformation prior to
consumption such as chocolates, beverages, and fresh or chilled meats. This classification
is primarily based upon the relative dependence of production upon land and climatic
conditions. While products in the first two categories depend disproportionately on land
availability, geography, and climatic conditions, those in Categories 3 and 4 are less
dependant upon those factors and in principle, can be produced almost anywhere.3 A
complete listing of the products and the concordance with the trade data is given in
Table B.1. As the period that is reviewed ends before the enlargement of the EU to
27 member states, references to aggregate EU data in this section covers members prior
to 2004, that is, EU15 only.
Evolution in total agricultural and merchandise trade
During the twenty-year period 1985 to 2004, world agricultural exports (excluding
intra-EU trade) increased more than threefold from USD 123 billion to USD 393 billion4
resulting in an annual compound growth rate averaging 6.3% a year (Table 1.4). Over the
same time period however, total world merchandise exports expanded at an even faster
Box 1.1. Partial stochastic analysis: Variability around deterministic projections (cont.)
Conclusion
Partial stochastic analysis has only a partial coverage of uncertainties; this analysis focuses onexogenous uncertainties linked to climate and macroeconomic evolution. There are several othersources of uncertainty in the benchmark projections. In particular, there is an empiricaluncertainty on the estimation of the parameters used in the model jointly developed by the OECDand the FAO and an endogenous uncertainty on the functioning of agricultural markets. Despitethese limitations, the information that partial stochastic analysis is of interest for better assessingthe evolution of agricultural commodity markets would be possible from the analysis of adeterministic baseline. This box has described how a partial stochastic analysis has beenundertaken with the 2007 Agricultural Outlook projections. A number of conclusions emerge fromthis analysis using the Aglink-Cosimo model: First, the deterministic baseline projections differslightly from the averages of stochastic simulations. Second, stochastic projections of world cropprices (expressed in real terms) are relatively highly concentrated around the average. And finally,the analysis underlines strong price correlations across commodities.
OECD-FAO AGRICULTURAL OUTLOOK 2007-2016 – © OECD/FAO 2007 37

1. OVERVIEW
rate, increasing more than fivefold from USD 1.1 trillion to USD 6.1 trillion, revealing an
average compound growth rate of 9.6% a year. Given different growth rates in total
merchandise exports and agricultural exports, the share of agricultural exports to total
merchandise fell from almost 12% of the total in 1985 to about 7% of total merchandise
exports in 2004 (Table 1.4).
The value of agriculture and total merchandise exports increased over the time period
examined because countries exported more products and because more countries became
engaged in trade (globalization). Between 1985 and 2004, the number of reporting countries
or economic regions (all referred to as countries) increased from 88 to 130, with the number
of reporting countries reaching 164 in 2000. Of this number, only 74 countries are
considered consistent traders, defined as countries with at least 18 years of reported
exports during the sample. These countries increased their merchandise exports more
than fivefold during this period growing from USD 1 trillion in 1985 (96% of total
merchandise exports) to USD 5.6 trillion (these figures and all figures in the rest of the
section exclude intra-EU trade) in 2004 (92% of total). Agricultural exports by this group of
countries grew from USD 119 billion USD 362 billion, representing 96% and 92% of total
agricultural exports in 1985 and 2004 respectively.
This information suggests that exports are relatively concentrated; although globalisation
has led to more countries participating in trade, they play a relatively minor role. Which
countries are the major world exporters, how has this changed over time, and what share of
agricultural exports do they control? In the 1985 to 1989 period, the US was the largest
Table 1.4. Total merchandise and agriculture exports 1985-2004 (with and without intra-EU trade)
Data exclude intra-EU Data include intra-EU trade
Total agricultural exports
Total merchandise exports
Agriculture share of total
Total agricultural exports
Total merchandise exports
Agriculture share of total No. of countries
reportingBillion USD Billion USD Per cent Billion USD Billion USD Per cent
1985 123 1 071 11.5 175 1 477 11.9 88
1986 126 1 137 11.1 194 1 656 11.7 98
1987 134 1 335 10.1 218 1 980 11.0 95
1988 156 1 590 9.8 248 2 307 10.8 96
1989 179 1 858 9.6 274 2 628 10.4 102
1990 189 2 105 9.0 300 3 037 9.9 105
1991 190 2 208 8.6 308 3 137 9.8 103
1992 212 2 093 10.1 341 3 081 11.1 106
1993 212 2 573 8.2 327 3 411 9.6 111
1994 245 2 928 8.4 372 3 908 9.5 118
1995 290 3 464 8.4 438 4 661 9.4 134
1996 313 3 741 8.4 463 4 968 9.3 139
1997 316 3 899 8.1 456 5 124 8.9 146
1998 295 3 832 7.7 435 5 106 8.5 144
1999 277 4 006 6.9 416 5 301 7.9 152
2000 284 4 683 6.1 411 5 955 6.9 164
2001 292 4 425 6.6 423 5 719 7.4 161
2002 300 4 459 6.7 443 5 788 7.6 153
2003 352 5 166 6.8 527 6 742 7.8 149
2004 393 6 140 6.4 594 8 032 7.4 131
Growth rate 6.29 9.63 6.63 9.32
OECD-FAO AGRICULTURAL OUTLOOK 2007-2016 – © OECD/FAO 200738
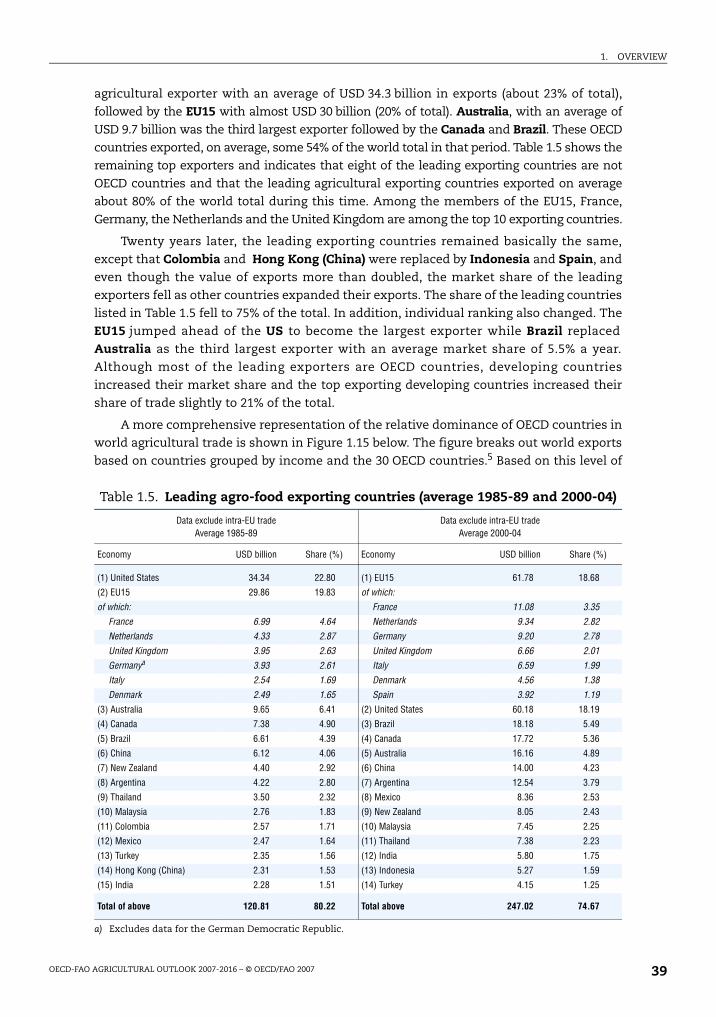
1. OVERVIEW
agricultural exporter with an average of USD 34.3 billion in exports (about 23% of total),
followed by the EU15 with almost USD 30 billion (20% of total). Australia, with an average of
USD 9.7 billion was the third largest exporter followed by the Canada and Brazil. These OECD
countries exported, on average, some 54% of the world total in that period. Table 1.5 shows the
remaining top exporters and indicates that eight of the leading exporting countries are not
OECD countries and that the leading agricultural exporting countries exported on average
about 80% of the world total during this time. Among the members of the EU15, France,
Germany, the Netherlands and the United Kingdom are among the top 10 exporting countries.
Twenty years later, the leading exporting countries remained basically the same,
except that Colombia and Hong Kong (China) were replaced by Indonesia and Spain, and
even though the value of exports more than doubled, the market share of the leading
exporters fell as other countries expanded their exports. The share of the leading countries
listed in Table 1.5 fell to 75% of the total. In addition, individual ranking also changed. The
EU15 jumped ahead of the US to become the largest exporter while Brazil replaced
Australia as the third largest exporter with an average market share of 5.5% a year.
Although most of the leading exporters are OECD countries, developing countries
increased their market share and the top exporting developing countries increased their
share of trade slightly to 21% of the total.
A more comprehensive representation of the relative dominance of OECD countries in
world agricultural trade is shown in Figure 1.15 below. The figure breaks out world exports
based on countries grouped by income and the 30 OECD countries.5 Based on this level of
Table 1.5. Leading agro-food exporting countries (average 1985-89 and 2000-04)
Data exclude intra-EU tradeAverage 1985-89
Data exclude intra-EU tradeAverage 2000-04
Economy USD billion Share (%) Economy USD billion Share (%)
(1) United States 34.34 22.80 (1) EU15 61.78 18.68
(2) EU15 29.86 19.83 of which:
of which: France 11.08 3.35
France 6.99 4.64 Netherlands 9.34 2.82
Netherlands 4.33 2.87 Germany 9.20 2.78
United Kingdom 3.95 2.63 United Kingdom 6.66 2.01
Germanya 3.93 2.61 Italy 6.59 1.99
Italy 2.54 1.69 Denmark 4.56 1.38
Denmark 2.49 1.65 Spain 3.92 1.19
(3) Australia 9.65 6.41 (2) United States 60.18 18.19
(4) Canada 7.38 4.90 (3) Brazil 18.18 5.49
(5) Brazil 6.61 4.39 (4) Canada 17.72 5.36
(6) China 6.12 4.06 (5) Australia 16.16 4.89
(7) New Zealand 4.40 2.92 (6) China 14.00 4.23
(8) Argentina 4.22 2.80 (7) Argentina 12.54 3.79
(9) Thailand 3.50 2.32 (8) Mexico 8.36 2.53
(10) Malaysia 2.76 1.83 (9) New Zealand 8.05 2.43
(11) Colombia 2.57 1.71 (10) Malaysia 7.45 2.25
(12) Mexico 2.47 1.64 (11) Thailand 7.38 2.23
(13) Turkey 2.35 1.56 (12) India 5.80 1.75
(14) Hong Kong (China) 2.31 1.53 (13) Indonesia 5.27 1.59
(15) India 2.28 1.51 (14) Turkey 4.15 1.25
Total of above 120.81 80.22 Total above 247.02 74.67
a) Excludes data for the German Democratic Republic.
OECD-FAO AGRICULTURAL OUTLOOK 2007-2016 – © OECD/FAO 2007 39

1. OVERVIEW
aggregation, the share of agricultural exports of OECD countries peaked in 1987-88 at
almost 70% of exports but fell from this high level to around 60% in the latter years
(Figure 1.15).6 The share of high income non-OECD countries (not shown in figure) also
declined somewhat from around 4% in 1985 to 3% in 2004 and that of low income countries
from around 6% in 1985 to around 4% in 2004. The declining share from OECD and high-
income countries has been captured by the middle income countries. The upper-middle-
income countries increased their share from around 8% in 1985 to around 11% in 2004,
while lower middle income countries increased their share from 19% to 23% of the total
during this time.
Shifting the focus to the G207 group of developing countries – countries with
particularly strong views on agricultural trade in the Doha negotiations – the data reveals
that total merchandise exports by this group increased almost 13 times to USD 1.3 trillion,
representing 21% of world’s total in 2004. The average growth rate of 14% per year
considerably outpaced that of all exporting countries. Total agricultural exports by the
G20 on the other hand increased only fourfold to USD 111 billion in 2004 or 28% of the
world total. Reflecting the different growth rates of agricultural and merchandise exports,
the export sector of this group of countries exhibited traits similar to all countries, namely,
the share of agricultural goods to total merchandise exports declined. During the 20 years
from 1985, the value of agricultural exports in total exports dropped by 19 percentage
points to 9% in 2004.
Evolution in the exports of the four agricultural sub-sectors
Within an overall growing agricultural export trade over the 20-year period, the value
of exports in each of the four sub-sectors, bulk, horticultural, semi-processed and
processed, also expanded, but at very different rates of growth. While exports of bulk
commodities increased at an annual growth rate of 2.6% a year, the growth in exports of
horticultural products was much faster at 8.6% a year. Nevertheless, the share of these two
broad groups of commodities – both heavily dependant upon land and climatic conditions
– in the value of total agricultural exports fell from 45% to 30% from 1985 to 2004
(Figure 1.16).
Figure 1.15. Agriculture export share (excludes intra-EU trade) by income group (1985-2004)
���
�
�
��
��
��
��
��
����� ��� ��� ���� ���� ���� ���� ���� ���� ���� ���� ��� ��� ���� ���� ���� ���� ���� ���� ����
3�'; �!!��1+�����1����+� <�,��1+�����1����+� <�,1����+�
OECD-FAO AGRICULTURAL OUTLOOK 2007-2016 – © OECD/FAO 200740
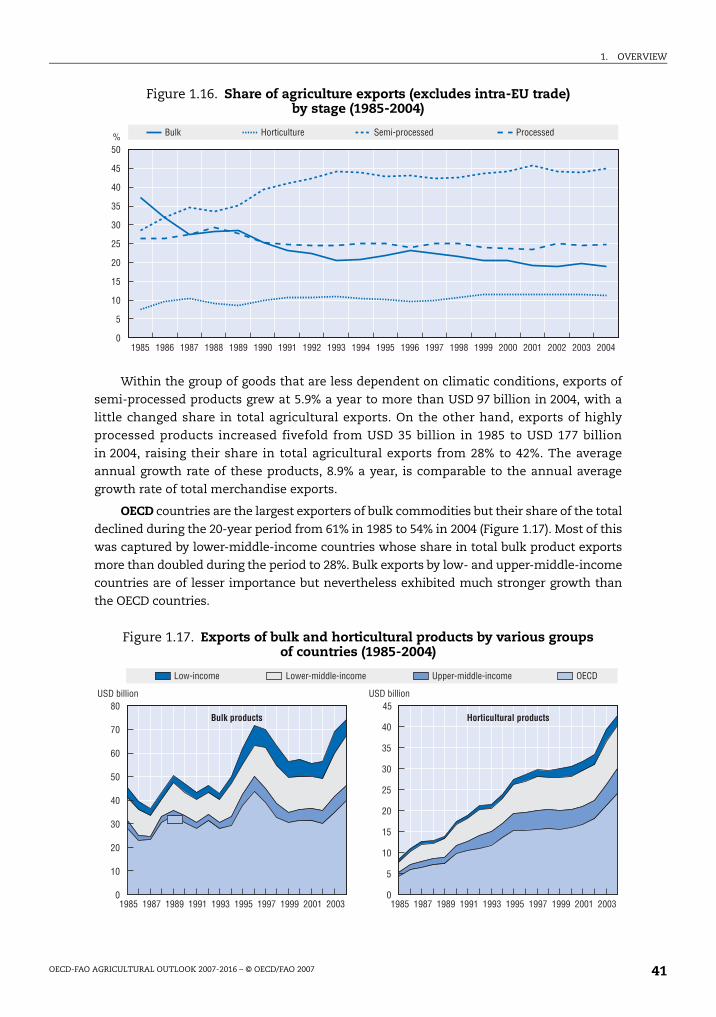
1. OVERVIEW
Within the group of goods that are less dependent on climatic conditions, exports of
semi-processed products grew at 5.9% a year to more than USD 97 billion in 2004, with a
little changed share in total agricultural exports. On the other hand, exports of highly
processed products increased fivefold from USD 35 billion in 1985 to USD 177 billion
in 2004, raising their share in total agricultural exports from 28% to 42%. The average
annual growth rate of these products, 8.9% a year, is comparable to the annual average
growth rate of total merchandise exports.
OECD countries are the largest exporters of bulk commodities but their share of the total
declined during the 20-year period from 61% in 1985 to 54% in 2004 (Figure 1.17). Most of this
was captured by lower-middle-income countries whose share in total bulk product exports
more than doubled during the period to 28%. Bulk exports by low- and upper-middle-income
countries are of lesser importance but nevertheless exhibited much stronger growth than
the OECD countries.
Figure 1.16. Share of agriculture exports (excludes intra-EU trade) by stage (1985-2004)
Figure 1.17. Exports of bulk and horticultural products by various groups of countries (1985-2004)
���
��
��
��
��
��� �� �� � � �� �� �� �� �� �� �� �� � � ���� ���� ���� ���� ����
�
��
��
��
��
��� ������������ �������������� ���������
�
��
��
��
��
��
��
��
�
��
��
��
��
��
��
��
��
��
�
��
�
�� � �� �� �� �� � ���� ���� �� � �� �� �� �� � ���� ����
�� ��!���� �� �����������!���� "�������������!���� #$%&
���������� ������������������
"�&'(�����!"�&'(�����!
OECD-FAO AGRICULTURAL OUTLOOK 2007-2016 – © OECD/FAO 2007 41

1. OVERVIEW
Looking at individual countries (EU15 counting as one), the US, Canada and the EU15are the top three exporters of bulk commodities with an annual average export value of
USD 17.2 billion, USD 3.8 billion and USD 3.2 billion respectively during the 1985 to 1989
period, representing more than half of average world exports during those years (Table B.2).
Even though many countries export bulk products, trade is concentrated and the top
20 exporters captured on average more than 91% of world total. But, over time, the
concentration of the top 20 exporting countries declined and stood at 86% in 2000 to 2004
period. Within this overall trend, the relevance of OECD countries is declining and by 2004
there were only five OECD countries among the leading 20 exporters of bulk commodities.
Thus, unlike the exports of all agricultural products where the OECD countries dominate,
exports of bulk commodities that depend more on climatic conditions, and land
availability has shifted more toward developing countries.
Production of horticultural commodities is also relatively location specific, i.e. relatively
more dependent on land and climatic conditions. As already stated, trade in this sector has
been much more dynamic than trade in bulk products. While the OECD dominates
horticultural exports with a total of USD 24 billion in 2004, the strongest growth was exhibited
by the upper-middle-income countries, with an growth rate of 10.8% a year to USD 6 billion
in 2004 (Figure 1.18). As a group the G20 exhibited a high growth rate (9.6% per year, not shown
in the graph), followed by the OECD countries (9.4%), the lower-middle-income countries (8%)
and the low-income countries with an average annual growth of horticulture exports of 5.8%.
As for bulk commodities, the leading horticultural exporting country is the US with an
average of USD 2.2 billion a year during the 1985 to 1989 period and USD 6.2 billion a year
for the 2000 to 2004 period representing 16% of the world’s total of these products during
each of these periods (Table B.3). The rank ordering of the leading horticultural product
exporters has changed over time, but overall and in contrast to trade in bulk commodities,
the importance of OECD countries in horticultural products trade increased with its share
of total horticultural exports growing from 46% in 1985 to 54% in 2004.
The third agricultural sub-sector, semi processed products includes products that are
less dependant on climatic conditions with key inputs into their production process that
Figure 1.18. Exports of semi processed and processed products by various groups of countries, 1985-2004
���
����
��
��
��
�
�
��
�
��
���
����
���
���
��
��
��
��
�
���
�
���� ���� ���� ��� ���� ���� ���� ��� �� ���� ���� ���� ��� ���� ���� ���� ��� ��
��
��
� ����� �� � �������������� �� ���������������� �� ����
������������ ������ ������� ������
���� ���� ����� ���� �
OECD-FAO AGRICULTURAL OUTLOOK 2007-2016 – © OECD/FAO 200742

1. OVERVIEW
are importable. This group of products as mentioned above is the second largest exported
sub-sector. As a group, OECD countries increased their exports in this segment by 4.9% a
year to USD 48.1 billion in 2004 (Figure 1.18). Nevertheless, their share in the world total
fell by 10 percentage points to an average of about 50% as that of upper-middle-income
developing countries increased by 6 percentage points to 14% of the total in 2000-04
reflecting an average growth rate of 8.2% a year. Strong export growth of 7.3% per year to
USD 30 billion in 2004 was also exhibited by members of the G20 (not shown in the figure).
Exports of semi-processed products by the least developed countries (not shown in the
figure) increased from USD 166 million to USD 693 million in 2003. But with slower growth
than that of other developing countries, their share in world total exports hardly changed.
The EU15 and the US are the world’s largest exporters of semi-processed products, with
respective shares of total world trade in 2004 of 17% and 16%. On average, the EU15 exported
some USD 13.4 billion a year during 2000-04 and the US just above USD 13 billion (Table B.4).
The final group of products considered here those with the highest level of
transformation or processing prior to consumption. Production of this group of products is
not very location specific, is very little concerned with climatic conditions, most of the
required inputs can be sourced from practically anywhere and other considerations loom
more important in firms decisions as to where to locate. This group of products has the
largest share of agricultural exports and has the highest growth rate. OECD exports of
processed products have grown by more than 8% per year since 1985 to USD 120.4 billion
in 2004 (Figure 1.18). But, although from a much lower base, exports in this segment by
upper-middle-income and lower-middle-income countries grew at double digit rates,
averaging respectively 13.6% and 10.7% per year, reaching respectively USD 14.1 billion and
USD 34 billion in 2004.
OECD countries dominate trade in this segment: The six leading processed product
exporters are all members of the OECD; the number of OECD countries in the top 20
increased to 15 by 2004; and on average these countries exported almost USD 87 billion a
year or 60% of the total (Table B.5). Nevertheless, reflecting the very high growth rates in
processed product exports by developing countries, these countries are increasing their
share in total world trade. For instance, processed products became the most important
export segment for the G20 countries, overtaking exports of bulk or semi-processed
products. Their share of total world exports increased from 15% to 23% since 1985. Other
developing countries (except the least developed countries) also demonstrated impressive
growth rates in exporting products in this market segment.
In general, the export data reveal the extent of globalisation with the share of the
leading exporting countries declining over the 1985 to 2004 period. This illustrates that
more countries are contesting agricultural export markets and that more countries have
entered the global markets while existing competitors below the group in the top 20
increased their competitiveness and their share of the market. Overall, the share of exports
by OECD countries has declined in three of the four broad aggregates discussed (except for
horticultural markets). The data also reveal that despite the policy changes that have
occurred since the mid-1990s and the implementation of the URAA, agricultural trade
continues to be dominated by a relatively small number of countries, with the leading
20 exporting countries controlling more than 70% of the exports in each of the four
segments examined.
OECD-FAO AGRICULTURAL OUTLOOK 2007-2016 – © OECD/FAO 2007 43

1. OVERVIEW
Evolution of agricultural imports
Turning our attention to the flip side of the issue, the data show that growth of
agricultural trade based on imports is the same as that described above based on exports.
For example, agricultural imports increased at an average growth rate of 6.5% a year, but
still lagged behind that of all merchandise trade resulting in agriculture’s share of world
merchandise trade based on imports declining from 10% of the total in 1985 to slightly
above 6% in 2004. In terms of the composition of trade, import developments are also
similar to those for exports with the share of bulk commodities in total agricultural
imports falling and that for processed products increasing.
The Least Developed Countries seem to be more engaged in importing rather than
exporting agricultural goods as their share of world imports during the last 10 years has
been above 1% in contrast to less than 0.5% in exports. OECD countries share of imports fell
from more than 74% of the total at the beginning of the period to the low-60% in the later
years, while the import share of developing countries other than low income, increased
from around 13% at the beginning of the period to around 26% in the later years. Demand
for bulk commodities by the OECD countries has fallen particularly with its share in total
world imports of bulk products falling from 72% on average during the period between 1985
and 1989 to 51% for the 2000 to 2004 period. In contrast, import demand for bulk
commodities by developing countries expanded at a faster rate, increasing their share of
the market. Import demand increased the fastest among upper-middle-income countries,
averaging 11.4% a year, followed by lower-middle-income countries with an annual growth
rate of 9.1%.
The same trend prevailed for imports of processed products where imports by the
OECD countries grew at an annual rate of 8.2% compared to double digit rates for many
developing countries. Consequently, the share in world imports of processed products by
OECD countries fell to 68% by 2004. Import demand by upper-middle-income countries
increased at an average rate of 13.4% a year expanding their demand more than 10 times
from USD 1.7 billion in 1985 to USD 17.9 billion in 2004. Lower-middle-income countries
also increased their demand at a double digit rate averaging 10.2% a year. Their demand
expanded more than 6 times from USD 2.8 billion in 1985 to USD 18.1 billion in 2004.
Low-income countries expanded their demand for this class of commodities about
threefold from USD .9 billion in 1985 to USD 2.9 billion in 2004. (Tables B.2 to B.5 contain a
list of the leading importing countries for each of the four sub-sectors.)
It is noteworthy that import demand also expanded for the G20 countries, the group
that is considered to have an export orientation at the WTO negotiations. Double digit
growth in import demand by the G20 countries was registered in each of the four
sub-sectors and their total imports of agricultural products grew by more than 11% per
year between 1985 and 2004, raising their share of total world imports from 10.8%
during 1985-89 to 17.2% during the 2000-04 period (compared to an average share of 17.7%
of world exports). This phenomenon was not confined to one or two large members, a
development that would lead to misleading interpretations. Rather large import demand
was exhibited by a majority of the members. Average imports for the 2000 to 2004 period by
three members, China, Indonesia, and Mexico, placed them among the leading 20
importing countries, while a total of 13 members were among the top 50 agricultural
importers. Furthermore, of these 13 important importers, 7 led by Mexico, Egypt and
Venezuela were on average net importers of agricultural goods during the 2000 to 2004
OECD-FAO AGRICULTURAL OUTLOOK 2007-2016 – © OECD/FAO 200744

1. OVERVIEW
period. It is particularly striking that the average growth in import demand for bulk
commodities by the G20 group of countries, 11.1% a year, outpaces that of global growth or
growth by OECD. Consequently, the G20 as a group switched from being net exporters of
bulk products on average during 1985-89 to being net importers during 2000-04. For the
other three sub-sectors however, strong growth in imports was more than offset by an even
stronger expansion in exports. As a result, the G20 maintained their net export position in
these set of commodities and in total agricultural trade.
Another group of countries that has joined ranks at the WTO negotiations is the G10.8
This group of countries is thought to have more of an import orientation in the
negotiations. While their agricultural imports indeed increased by 6.2% a year from 1985
to 2004, their share of total world imports declined from an average of 21.2% in the 1985-89
period to 18.4% in the 2000-04 period. And as total merchandise imports increased at an
even faster rate, averaging 8.8% a year, the agriculture share of total imports by these
countries fell from 11% in 1985 to 7% by 2004.
Most of the growth in agricultural imports by the G10 has occurred in processed
products. These grew at an annual average rate of 9.7%, increasing their share of
agricultural imports to almost half on average during 2000-04. On the other hand, import
demand for bulk commodities moderated during the 20-year period, growing by only 2.4%
a year. As a result their share in total agricultural imports declined from an average of 35%
of total in 1985-89 to 21% in 2000-04.
Summary
To summarize, between 1985 and 2004 trade in agriculture products (whether
measured by the value of exports or imports) increased substantially both due to an
expansion in trade by existing countries and due to new countries participating in the
globalisation of markets. Agricultural trade did not increase as fast as all merchandise
trade, resulting in a declining share of agriculture in world trade, to less than 10% in recent
years. This trend of a falling share of agriculture in total merchandise trade is persistent
across all income levels and geopolitical groupings, and is consistent with a similar pattern
of agriculture capturing a declining share of an economy’s income.
The trade data between 1985 and 2004 also show that even though there are more and
more countries participating in trade, a relatively small number of countries continue to
capture most of this trade whether one is referring to agriculture or non-agriculture goods.
The concentration ratio of the top 4 or top 20 exporting countries, although dropping
moderately over the 20-year period, is still rather high, with the top 20 exporting countries
accounting for almost 80% of total merchandise exports or 73% of total agricultural exports
in 2004. LDCs, the group of countries who are receiving special consideration in the Doha
Development Agenda are not very big participants in the expansion of agriculture trade,
accounting for less than 1% of the total. Members of the OECD continue to dominate
agriculture trade although their share of the total has declined somewhat over the 20-year
period. Most of the gains have been made by countries that are in the G20 and other
developing countries that are not LDCs.
The data suggest that the dynamics of agricultural trade is chiefly about trade in
processed products. The growth rate for this sector (8.5% a year) is comparable to the
growth rate of non-agricultural products and as a result this group of commodities has
steadily increased its share of agriculture trade, to 41% of total exports (45% of total
OECD-FAO AGRICULTURAL OUTLOOK 2007-2016 – © OECD/FAO 2007 45
1. OVERVIEW
imports) in 2004. Trade in bulk products on the other hand is growing at the lowest rate
(3.7% a year based on exports and 2.6% a year based on imports) among the agricultural
sectors and as a result the share of bulk products in agricultural trade has declined from
37% to 19% of exports (from 34% to 21% of imports) during the 20 years since 1985.
Patterns in the exports of each of the four agriculture sub-sectors – bulk products,
horticulture, semi-processed products and processed products – follow those of agriculture
in general. The top 4 or 20 exporters continue to dominate but their share has declined
somewhat. The OECD countries continue to account for a majority of trade, and they tend
to dominate trade in processed products. Nevertheless, developing countries other than
LDCs have increased their importance in the trade of agricultural products in all the
sub-sectors but especially for bulk commodities.
Trade developments by some groups of countries are particularly striking given the
stance of these countries in the current Doha Round of trade negotiation. For instance,
agricultural exports for the G20 have decreased in importance as the share of agricultural
exports to total merchandise exports has declined from 28% of the total in 1985 to 9%
in 2004. Members of the G20 as a group have become net importers of bulk products while
remaining overall net exporters in agriculture.
The development in agricultural trade by the G10 group of countries is also
noteworthy. This group of countries has an import orientation in the current Doha
negotiation. However, both their share in world agricultural imports as the share of
agricultural imports in total imports by these countries has fallen over time.
Notes
1. These and other macroeconomic assumptions in this section are based on the OECD, World Bankand UN sources which are explained in detail in footnote a to Table A.1 of the Statistical Annex.
2. There appears to be an income threshold beyond which entry into export markets becomes morefeasible. This in turn implies that the benefits from globalisation may depend on income levels.
3. See Regmi et al. (2005) for more details on the rationale for the product classification scheme.
4. All values are stated in nominal US dollars. Trade data are from UN COMTRADE.
5. Country classification by income is from the World Bank and is based on per capital gross nationalincome as of 2005; http://siteresources.worldbank.org/DATASTATISTICS/Resources/CLASS.XLS.
6. If intra EU trade is included, the share of OECD countries in world trade is considerably higher,averaging 74% of the total in the last four years.
7. Members of the G20 are: Argentina, Bolivia, Brazil, Chile, China, Cuba, Egypt (Arab Republic of),Guatemala, India, Indonesia, Mexico, Nigeria, Pakistan, Paraguay, Philippines, South Africa,Tanzania, Thailand, Uruguay, Venezuela RB and Zimbabwe.
8. Members are: Bulgaria, Chinese Taipei, Iceland, Israel, Japan, Korea Republic, Liechtenstein,Mauritius, Norway and Switzerland.
OECD-FAO AGRICULTURAL OUTLOOK 2007-2016 – © OECD/FAO 200746

OECD-FAO Agricultural Outlook 2007-2016
© OECD/FAO 2007
ANNEX A
Statistical Tables
47

ANNEX A
2016
2.6
2.3
1.9
0.9
4.8
4.0
2.5
2.7
1.4
7.3
2.6
3.2
3.5
6.5
5.3
2.7
3.4
2.4
2.4
1.9
1.7
1.0
2.4
3.1
1.9
2.4
0.7
4.6
1.8
4.0
4.6
2.5
5.7
4.0
5.1
2.0
Table A.1. Economic assumptions
Calendar yeara Average 2001-05
2006 est. 2007 2008 2009 2010 2011 2012 2013 2014 2015
REAL GDPb
Australia % 3.2 2.6 3.0 3.4 3.0 3.0 2.9 2.7 2.6 2.6 2.6
Canada % 2.6 2.8 2.7 3.1 2.9 2.5 2.3 2.3 2.3 2.3 2.3
EU15 % 1.4 2.8 2.4 2.4 2.1 2.0 1.9 1.9 1.9 1.9 1.9
Japan % 1.5 2.8 2.0 2.0 1.6 1.4 1.3 1.1 0.9 0.9 0.9
Korea % 4.5 5.0 4.4 4.6 4.9 4.9 4.8 4.8 4.8 4.8 4.8
Mexico % 1.8 4.7 3.6 3.7 3.9 4.0 4.0 4.0 4.0 4.0 4.0
New Zealand % 3.4 1.5 1.3 2.0 2.9 2.5 2.5 2.5 2.5 2.5 2.5
Norway % 2.1 2.4 3.2 2.7 2.5 2.9 2.9 2.8 2.7 2.7 2.7
Switzerland % 1.1 3.0 2.2 2.0 1.6 1.4 1.4 1.4 1.4 1.4 1.4
Turkey % 4.5 6.1 5.3 6.3 7.5 7.1 7.1 7.3 7.3 7.3 7.3
United States % 2.4 3.3 2.4 2.7 2.8 2.7 2.7 2.7 2.6 2.6 2.6
Argentina % 2.3 7.7 5.6 4.0 4.6 4.4 4.1 3.9 3.7 3.4 3.2
Brazil % 2.2 3.5 3.4 3.8 3.8 3.7 3.7 3.6 3.6 3.5 3.5
China % 9.5 10.4 9.6 8.7 8.4 8.1 7.8 7.5 7.1 6.8 6.5
India % 7.0 8.7 7.7 7.2 6.9 6.7 6.4 6.1 5.9 5.6 5.3
Russia % 6.1 6.8 6.0 5.5 5.1 4.7 4.3 3.9 3.5 3.1 2.7
South Africa % 3.8 4.6 3.9 4.3 4.2 4.0 3.9 3.8 3.7 3.5 3.4
OECDc, d % 2.0 3.2 2.5 2.7 2.6 2.5 2.5 2.4 2.4 2.4 2.4
PCE DEFLATORb
Australia % 2.3 2.8 2.6 2.7 2.4 2.4 2.4 2.4 2.4 2.4 2.4
Canada % 2.6 1.4 1.3 1.7 1.8 1.9 1.9 1.9 1.9 1.9 1.9
EU15 % 2.0 2.1 1.9 1.8 1.8 1.7 1.7 1.7 1.7 1.7 1.7
Japan % –1.0 –0.4 0.4 0.8 0.9 1.0 1.0 1.0 1.0 1.0 1.0
Korea % 3.4 2.1 2.9 3.0 2.6 2.4 2.4 2.4 2.4 2.4 2.4
Mexico % 5.9 3.1 3.4 3.2 3.1 3.1 3.1 3.1 3.1 3.1 3.1
New Zealand % 1.4 2.7 2.7 2.0 1.8 1.9 1.9 1.9 1.9 1.9 1.9
Norway % 1.7 2.2 2.1 2.6 2.6 2.4 2.4 2.4 2.4 2.4 2.4
Switzerland % 0.8 1.4 0.9 1.2 0.9 0.7 0.7 0.7 0.7 0.7 0.7
Turkey % 27.1 10.2 7.3 6.0 5.1 4.6 4.6 4.6 4.6 4.6 4.6
United States % 2.2 2.8 2.2 2.2 2.0 1.9 1.8 1.8 1.8 1.8 1.8
Argentina % 10.6 9.8 9.7 9.0 8.2 7.5 7.0 6.4 5.8 5.2 4.6
Brazil % 9.1 5.5 5.2 5.2 3.9 4.7 4.6 4.6 4.6 4.6 4.6
China % 1.4 1.4 2.0 2.8 2.4 2.5 2.5 2.5 2.5 2.5 2.5
India % 3.6 6.2 5.8 5.0 5.7 5.7 5.7 5.7 5.7 5.7 5.7
Russia % 6.1 10.0 8.5 8.0 6.5 5.7 5.2 5.0 4.7 4.5 4.3
South Africa % 3.8 4.8 5.6 4.7 5.1 5.1 5.1 5.1 5.1 5.1 5.1
OECDc, d % 2.5 2.4 2.2 2.2 2.0 2.0 1.9 1.9 1.9 2.0 2.0
For notes, see end of the table.Source: OECD and FAO Secretariats.
OECD-FAO AGRICULTURAL OUTLOOK 2007-2016 – © OECD/FAO 200748

ANNEX A
2016
0.96
0.79
0.02
–0.15
0.16
0.96
0.57
0.47
0.09
1.04
0.80
0.88
0.98
0.51
1.18
–0.51
0.06
0.40
2016
1.42
1.15
0.77
105.6
0.83
11.91
1.50
3.67
3.25
7.82
64.69
31.0
9.39
60.85
ge rateic data-term
re sentspects
hasing
Table A.1. Economic assumptions (cont.)
Calendar yeara 2006 est. (million)
2007 2008 2009 2010 2011 2012 2013 2014 2015
POPULATION
Australia % 20.5 1.03 1.01 1.01 0.99 0.98 0.98 0.96 0.97 0.96
Canada % 32.6 0.88 0.85 0.83 0.82 0.82 0.80 0.80 0.79 0.79
EU27 % 490.6 0.15 0.12 0.10 0.08 0.07 0.06 0.05 0.04 0.03
Japan % 127.9 0.08 0.06 0.03 0.01 –0.02 –0.05 –0.07 –0.10 –0.13
Korea % 48.5 0.33 0.31 0.29 0.27 0.25 0.23 0.22 0.20 0.18
Mexico % 105.4 1.17 1.13 1.10 1.08 1.06 1.04 1.01 1.00 0.98
New Zealand % 4.1 0.73 0.67 0.62 0.64 0.61 0.61 0.65 0.60 0.60
Norway % 4.6 0.47 0.47 0.45 0.47 0.46 0.46 0.46 0.46 0.48
Switzerland % 7.4 0.15 0.12 0.12 0.11 0.09 0.11 0.08 0.08 0.09
Turkey % 73.0 1.33 1.31 1.28 1.25 1.21 1.18 1.14 1.11 1.07
United States % 299.2 0.94 0.93 0.91 0.90 0.88 0.86 0.85 0.83 0.82
Argentina % 39.1 0.91 0.89 1.01 0.99 0.97 0.95 0.93 0.92 0.90
Brazil % 188.2 1.14 1.12 1.23 1.19 1.15 1.11 1.07 1.04 1.01
China % 1 301.2 0.63 0.63 0.58 0.58 0.58 0.58 0.58 0.56 0.53
India % 1 117.7 1.26 1.22 1.38 1.35 1.33 1.30 1.27 1.24 1.21
Russia % 142.5 –0.53 –0.53 –0.44 –0.45 –0.46 –0.47 –0.48 –0.49 –0.50
South Africa % 47.6 0.37 0.39 0.08 0.05 0.04 0.03 0.03 0.04 0.04
OECDc % 1 213.9 00.54 0.52 0.50 0.49 0.47 0.46 0.44 0.43 0.41
Calendar yeara Average 2001-05
2006 est. 2007 2008 2009 2010 2011 2012 2013 2014 2015
EXCHANGE RATE
Australia AUD/USD 1.60 1.33 1.31 1.32 1.33 1.34 1.35 1.37 1.38 1.39 1.40
Canada CAD/USD 1.41 1.13 1.14 1.13 1.13 1.13 1.13 1.13 1.14 1.14 1.15
European Union EUR/USD 0.93 0.80 0.78 0.78 0.77 0.77 0.77 0.77 0.77 0.77 0.77
Japan JPY/USD 116.2 116.5 118.1 115.9 114.2 112.8 111.5 110.3 109.1 107.9 106.7
Korea ‘000 KRW/USD 1.18 0.95 0.94 0.92 0.90 0.89 0.88 0.87 0.86 0.85 0.84
Mexico MXN/USD 10.39 10.91 10.92 10.99 11.08 11.18 11.31 11.42 11.54 11.67 11.79
New Zealand NZD/USD 1.84 1.55 1.52 1.50 1.50 1.49 1.49 1.49 1.49 1.49 1.49
Argentina ARS/USD 2.56 2.87 2.79 2.65 2.78 2.92 3.06 3.19 3.32 3.44 3.56
Brazil BRL/USD 2.78 2.47 2.60 2.73 2.79 2.85 2.91 2.98 3.04 3.11 3.18
China CNY/USD 8.24 7.85 7.64 7.44 7.46 7.50 7.55 7.60 7.65 7.71 7.76
India INR/USD 46.30 45.70 47.20 48.11 49.78 51.62 53.60 55.65 57.78 60.00 62.30
Russia RUB/USD 29.7 27.3 26.4 25.5 26.3 27.1 27.9 28.6 29.3 29.9 30.5
South Africa ZAR/USD 8.85 6.97 7.10 7.37 7.57 7.80 8.04 8.30 8.56 8.82 9.10
WORLD OIL PRICE
Brent crude oil price USD/barrel 34.18 65.22 67.16 65.50 61.31 58.38 55.59 54.64 56.13 57.66 59.24
a) For OECD member countries, historical data for population, real GDP, private consumption expenditure deflator and exchanwere obtained from the OECD Economic Outlook, No. 80, December 2006. For non-member economies, historical macroeconomwere obtained from the World Bank, November 2006. Assumptions for the projection period draw on the recent mediummacroeconomic projections of the OECD Economics Department, projections of the World Bank, responses to a questionnaito member country agricultural experts and for population, projections from the United Nations World Population ProDatabase, 2004 Revision (medium variant). Data for the European Union are for the euro area aggregates.
b) Annual per cent change. The price index used is the private consumption expenditure deflator.c) Excludes Iceland.d) Annual weighted average real GDP and CPI growth rates in OECD countries are based on weights using 1995 GDP and purc
power parities (PPPs).For a complete description of the technical assumptions made, please see the Methodology section.est.: Estimate.Source: OECD and FAO Secretariats.
OECD-FAO AGRICULTURAL OUTLOOK 2007-2016 – © OECD/FAO 2007 49

ANNEX A
16/17
183.2
138.2
326.0
299.6
200.8
613.9
242.5
308.6
260.9
297.7
480.3
142.3
160.6
361.2
111.3
177.5
404.7
222.6
307.3
251.7
Table A.2. World pricesa
Average01/02-05/06
06/07 est. 07/08 08/09 09/10 10/11 11/12 12/13 13/14 14/15 15/16
WHEAT
Priceb USD/t 152.0 204.0 204.5 197.5 191.8 186.1 184.6 184.5 183.1 181.7 182.4
COARSE GRAINS
Pricec USD/t 103.6 140.4 158.9 157.6 147.1 143.3 144.0 140.8 138.4 138.6 139.5
RICE
Priced USD/t 238.4 311.4 352.1 360.3 347.8 331.9 331.0 336.3 336.3 330.2 326.2
OILSEEDS
Pricee USD/t 266.0 289.8 310.4 311.7 306.5 300.8 297.4 297.7 295.4 295.1 298.4
OILSEED MEALS
Pricef USD/t 201.0 204.9 215.2 217.0 212.8 207.5 204.6 203.1 198.4 196.3 199.1
VEGETABLE OILS
Priceg USD/t 520.6 590.7 618.0 619.7 622.9 611.9 610.8 608.5 612.4 613.9 615.4
SUGAR
Price, raw sugarh USD/t 217.6 253.5 242.5 235.9 231.5 235.9 240.3 238.1 238.1 240.3 241.4
Price, refined sugari USD/t 269.7 360.5 341.7 330.7 319.7 319.7 319.7 314.2 310.9 310.9 309.7
BEEF AND VEAL
Price, EUj EUR/100 kg dw 244.1 285.2 250.4 258.4 258.0 257.0 259.2 258.8 258.7 259.4 259.8
Price, USAk USD/100 kg dw 282.0 303.6 303.4 299.0 297.1 288.5 285.0 279.4 279.0 286.2 293.8
Price, Argentinal ARS/100 kg dw 307.1 427.3 323.2 352.2 354.9 361.1 374.6 384.4 406.6 436.0 455.4
PIG MEAT
Price, EUm EUR/100 kg dw 134.9 141.4 142.4 153.6 148.6 139.2 143.9 137.3 136.7 138.2 139.9
Price, USAn USD/100 kg dw 136.4 145.0 126.2 154.4 165.4 165.4 157.8 160.8 162.5 158.8 161.3
Price, Brazilo BRL/100 kg dw 187.7 216.2 202.2 280.2 302.5 313.3 306.1 316.3 332.6 339.2 347.1
POULTRY MEAT
Price, EUp EUR/100 kg rtc 102.8 101.5 100.5 104.3 106.7 108.8 105.9 104.2 108.3 109.3 110.3
Price, USAq USD/100 kg rtc 141.8 140.9 159.5 164.8 171.5 179.3 183.0 182.1 180.4 176.6 178.0
SHEEP MEAT
Price, New Zealandr NZD/100 kg dw 390.1 330.0 325.4 333.8 343.6 351.9 361.0 370.0 378.8 387.5 396.1
BUTTER
Prices USD/100 kg 155.9 186.5 196.2 193.0 188.3 188.3 195.1 200.9 209.7 215.1 220.2
CHEESE
Pricet USD/100 kg 231.3 272.8 300.4 310.9 303.2 300.0 301.0 300.5 301.9 304.2 305.9
SKIM MILK POWDER
Priceu USD/100 kg 185.7 234.9 259.4 269.0 266.3 259.3 253.6 250.3 247.9 249.6 249.0
For notes, see end of the table.Source: OECD and FAO Secretariats.
OECD-FAO AGRICULTURAL OUTLOOK 2007-2016 – © OECD/FAO 200750

ANNEX A
16/17
253.1
89.2
439.4
ops are
Table A.2. World pricesa (cont.)
Average01/02-05/06
06/07 est. 07/08 08/09 09/10 10/11 11/12 12/13 13/14 14/15 15/16
WHOLE MILK POWDER
Pricev USD/100 kg 190.8 229.4 254.6 262.7 256.7 248.2 250.3 249.0 251.0 252.4 252.8
WHEY POWDER
Wholesale price, USAw USD/100 kg 50.6 74.5 79.0 83.5 90.7 91.3 92.4 91.4 90.6 90.3 89.0
CASEIN
Pricex USD/100 kg 438.8 486.0 480.3 481.9 468.2 457.9 442.5 451.0 440.2 444.9 439.8
a) This table is a compilation of price information presented in the detailed commodity tables further in this annex. Prices for cron marketing year basis and those for meat and dairy products on calendar year basis (e.g. 05/06 is calendar year 2005).
b) No. 2 hard red winter wheat, ordinary protein, USA f.o.b. Gulf Ports (June/May); less EEP payments where applicable.c) No. 2 yellow corn, US f.o.b. Gulf Ports (September/August).d) Milled, 100%, grade b, Nominal Price Quote, NPQ, f.o.b. Bangkok (August/July).e) Weighted average oilseed price, European port.f) Weighted average meal price, European port.g) Weighted average price of oilseed oils and palm oil, European port.h) Raw sugar world price, New York, No. 11, f.o.b. stowed Caribbean port (including Brazil), bulk spot price.i) Refined sugar price, London, No. 5 , f.o.b. Europe, spot.j) Producer price.k) Choice steers, 1 100-1 300 lb lw, Nebraska – lw to dw conversion factor 0.63.l) Buenos Aires wholesale price linier, young bulls.m) Pig producer pricen) Barrows and gilts, No. 1-3, 230-250 lb lw, Iowa/South Minnesota – lw to dw conversion factor 0.74.o) Producer price.p) Weighted average farm gate live chickens, first choice, lw to rtc conversion of 0.75, EU15 starting in 1995.q) Wholesale weighted average broiler price 12 cities.r) Lamb schedule price, all grade average.s) F.o.b. export price, butter, 82% butterfat, northern Europe.t) F.o.b. export price, cheddar cheese, 40 lb blocks, northern Europe.u) F.o.b. export price, non-fat dry milk, extra grade, northern Europe.v) F.o.b. export price, WMP 26% butterfat, northern Europe.w) Edible dry whey, Wisconsin, plant.x) Export price, New Zealand.est.: Estimate.Source: OECD and FAO Secretariats.
OECD-FAO AGRICULTURAL OUTLOOK 2007-2016 – © OECD/FAO 2007 51

ANNEX A
2016
127 97125 278
104 50510 511
118 22749 14384 887
3 663
37 9546 020
31 6766 750
93 59731 79969 278
141
67 86734 55934 255
72
58 45016 05043 094
2 866
9 3374 6104 040
324
5 9013 2972 134
71
10 5882 6696 620
593
878155492
22
1 876944741
47
2 20382
2 128167
1 244244
1 11112
Table A.3. World trade projections
IMPORTSAverage 2001-05
2006 est. 2007 2008 2009 2010 2011 2012 2013 2014 2015
Wheat World trade kt 109 435 108 532 111 184 114 743 113 869 116 054 117 340 119 508 121 518 123 416 125 639OECD kt 25 721 23 464 24 058 23 884 23 972 24 210 24 358 24 558 24 633 24 856 25 082Developing kt 84 367 86 006 88 651 92 236 91 204 93 291 94 466 96 487 98 461 100 205 102 290Least Developed Countries kt 8 121 7 298 8 025 8 207 8 396 8 762 8 974 9 279 9 618 9 942 10 204
Coarse grains World trade kt 104 995 106 537 102 205 107 308 108 919 108 723 109 776 111 531 113 116 114 841 116 115OECD kt 50 254 50 243 45 898 48 230 49 334 49 193 48 622 48 501 49 000 49 230 49 072Developing kt 72 159 72 214 70 810 74 307 74 977 75 101 76 785 78 773 79 816 81 184 82 751Least Developed Countries kt 1 952 2 046 2 484 2 645 2 778 2 871 2 942 2 446 2 691 2 965 3 267
Rice World trade kt 29 810 29 300 30 979 31 831 32 849 33 512 34 097 34 352 35 259 36 074 37 093OECD kt 4 951 4 661 4 989 5 290 5 445 5 573 5 640 5 695 5 790 5 907 5 967Developing kt 24 595 24 490 25 714 26 391 27 287 27 790 28 285 28 479 29 303 29 995 30 910Least Developed Countries kt 4 339 4 668 4 821 5 055 5 187 5 370 5 456 5 580 5 888 6 127 6 425
Oilseeds World trade kt 68 035 79 704 81 635 83 941 84 622 85 183 86 751 88 158 89 394 90 741 91 847OECD kt 34 213 33 157 32 550 31 745 33 169 32 019 32 894 32 435 31 497 30 989 31 240Developing kt 41 131 53 707 55 949 59 086 58 521 60 314 61 152 63 020 65 250 67 159 68 036Least Developed Countries kt 90 90 112 113 117 121 124 128 133 137 140
Oilseed meals World trade kt 49 457 58 423 59 698 60 815 61 421 61 933 63 273 64 180 64 826 65 756 66 708OECD kt 31 182 35 397 35 855 36 026 35 334 35 170 34 665 34 742 34 932 35 222 34 944Developing kt 19 169 24 166 25 176 26 117 27 448 28 036 29 825 30 621 30 913 31 510 32 780Least Developed Countries kt 95 93 76 64 63 65 68 69 70 72 72
Vegetable oils World trade kt 34 584 43 320 45 117 46 593 47 740 48 971 50 462 52 407 54 157 55 791 57 121OECD kt 7 658 11 021 11 601 12 105 12 298 12 995 13 258 14 276 14 956 15 485 15 779Developing kt 26 681 32 367 33 856 34 738 35 752 36 277 37 490 38 435 39 544 40 718 41 885Least Developed Countries kt 1 701 2 061 2 131 2 207 2 280 2 370 2 451 2 535 2 615 2 697 2 780
Beefa World trade kt 5 963 6 424 6 969 7 176 7 584 7 851 8 062 8 321 8 613 8 843 9 097OECD kt 3 578 3 230 3 677 3 840 3 974 4 050 4 171 4 268 4 381 4 491 4 554Developing kt 2 176 2 691 2 924 3 008 3 215 3 372 3 466 3 587 3 764 3 829 3 979Least Developed Countries kt 87 119 150 171 222 258 278 297 313 317 323
Pigmeata World trade kt 3 999 4 301 4 700 4 927 5 055 5 130 5 279 5 443 5 576 5 680 5 766OECD kt 2 304 2 320 2 430 2 507 2 541 2 615 2 721 2 840 2 957 3 078 3 181Developing kt 1 352 1 488 1 762 1 849 1 866 1 868 1 941 2 010 2 083 2 106 2 115Least Developed Countries kt 33 44 57 75 64 65 74 83 85 78 71
Poultry World trade kt 7 563 7 479 8 060 8 353 8 541 8 783 9 077 9 475 9 741 9 948 10 180OECD kt 1 994 1 908 2 044 1 964 1 769 1 866 2 031 2 193 2 335 2 464 2 511Developing kt 4 247 4 129 4 562 4 887 5 255 5 410 5 517 5 819 6 027 6 177 6 321Least Developed Countries kt 363 383 435 461 511 537 544 555 564 565 583
Butter World trade kt 697 708 760 799 818 833 842 852 855 863 867OECD kt 145 129 133 137 138 140 144 147 150 152 153Developing kt 399 430 452 460 459 471 474 479 478 482 486Least Developed Countries kt 10 10 19 19 19 20 21 21 21 21 22
Cheese World trade kt 1 401 1 459 1 497 1 545 1 593 1 624 1 666 1 710 1 750 1 792 1 833OECD kt 758 725 767 785 804 822 843 863 883 903 923Developing kt 550 589 595 615 624 640 656 672 686 703 722Least Developed Countries kt 15 18 27 32 34 35 36 38 39 42 45
Whole milk powder World trade kt 1 396 1 582 1 642 1 661 1 726 1 815 1 872 1 950 2 012 2 076 2 139OECD kt 88 85 82 80 81 81 80 81 81 81 81Developing kt 1 340 1 525 1 582 1 598 1 661 1 750 1 806 1 882 1 943 2 005 2 066Least Developed Countries kt 86 112 115 120 126 132 138 144 150 155 161
Skim milk powder World trade kt 1 167 1 196 1 190 1 178 1 161 1 169 1 182 1 184 1 205 1 198 1 210OECD kt 223 191 196 195 199 204 211 218 224 228 237Developing kt 1 039 1 097 1 081 1 067 1 046 1 052 1 063 1 063 1 082 1 072 1 080Least Developed Countries kt 42 23 22 23 24 25 26 22 18 16 14
For notes, see end of the table.Source: OECD and FAO Secretariats.
OECD-FAO AGRICULTURAL OUTLOOK 2007-2016 – © OECD/FAO 200752
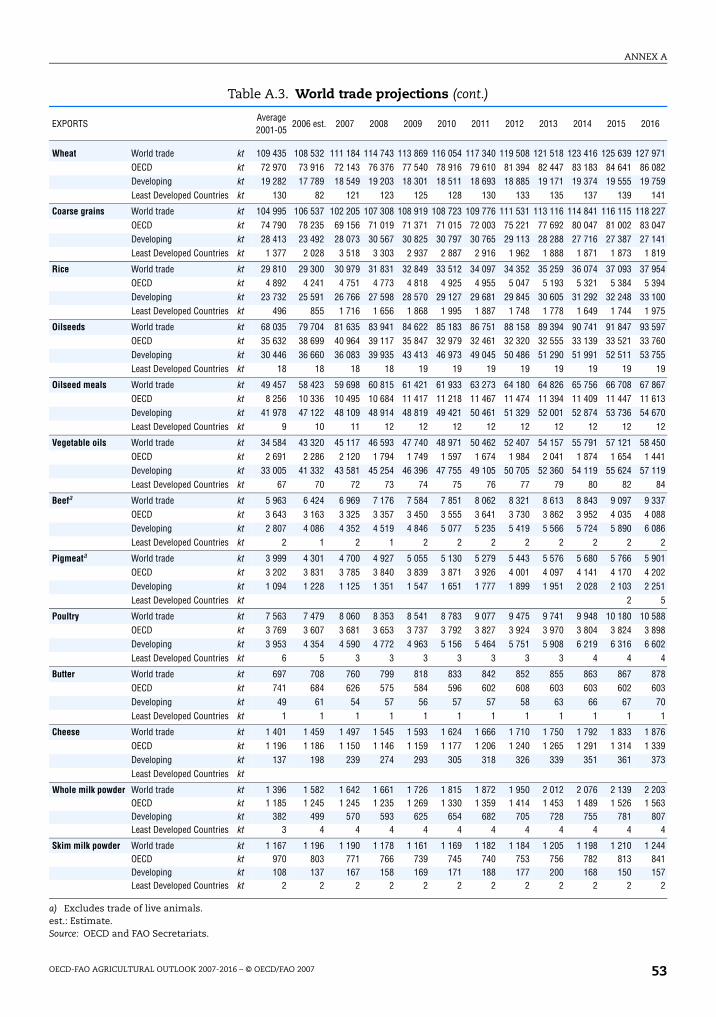
ANNEX A
2016
127 97186 08219 759
141
118 22783 04727 141
1 819
37 9545 394
33 1001 975
93 59733 76053 755
19
67 86711 61354 670
12
58 4501 441
57 11984
9 3374 0886 086
2
5 9014 2022 251
5
10 5883 8986 602
4
878603
701
1 8761 339
373
2 2031 563
8074
1 244841157
2
Table A.3. World trade projections (cont.)
EXPORTSAverage 2001-05
2006 est. 2007 2008 2009 2010 2011 2012 2013 2014 2015
Wheat World trade kt 109 435 108 532 111 184 114 743 113 869 116 054 117 340 119 508 121 518 123 416 125 639OECD kt 72 970 73 916 72 143 76 376 77 540 78 916 79 610 81 394 82 447 83 183 84 641Developing kt 19 282 17 789 18 549 19 203 18 301 18 511 18 693 18 885 19 171 19 374 19 555Least Developed Countries kt 130 82 121 123 125 128 130 133 135 137 139
Coarse grains World trade kt 104 995 106 537 102 205 107 308 108 919 108 723 109 776 111 531 113 116 114 841 116 115OECD kt 74 790 78 235 69 156 71 019 71 371 71 015 72 003 75 221 77 692 80 047 81 002Developing kt 28 413 23 492 28 073 30 567 30 825 30 797 30 765 29 113 28 288 27 716 27 387Least Developed Countries kt 1 377 2 028 3 518 3 303 2 937 2 887 2 916 1 962 1 888 1 871 1 873
Rice World trade kt 29 810 29 300 30 979 31 831 32 849 33 512 34 097 34 352 35 259 36 074 37 093OECD kt 4 892 4 241 4 751 4 773 4 818 4 925 4 955 5 047 5 193 5 321 5 384Developing kt 23 732 25 591 26 766 27 598 28 570 29 127 29 681 29 845 30 605 31 292 32 248Least Developed Countries kt 496 855 1 716 1 656 1 868 1 995 1 887 1 748 1 778 1 649 1 744
Oilseeds World trade kt 68 035 79 704 81 635 83 941 84 622 85 183 86 751 88 158 89 394 90 741 91 847OECD kt 35 632 38 699 40 964 39 117 35 847 32 979 32 461 32 320 32 555 33 139 33 521Developing kt 30 446 36 660 36 083 39 935 43 413 46 973 49 045 50 486 51 290 51 991 52 511Least Developed Countries kt 18 18 18 18 19 19 19 19 19 19 19
Oilseed meals World trade kt 49 457 58 423 59 698 60 815 61 421 61 933 63 273 64 180 64 826 65 756 66 708OECD kt 8 256 10 336 10 495 10 684 11 417 11 218 11 467 11 474 11 394 11 409 11 447Developing kt 41 978 47 122 48 109 48 914 48 819 49 421 50 461 51 329 52 001 52 874 53 736Least Developed Countries kt 9 10 11 12 12 12 12 12 12 12 12
Vegetable oils World trade kt 34 584 43 320 45 117 46 593 47 740 48 971 50 462 52 407 54 157 55 791 57 121OECD kt 2 691 2 286 2 120 1 794 1 749 1 597 1 674 1 984 2 041 1 874 1 654Developing kt 33 005 41 332 43 581 45 254 46 396 47 755 49 105 50 705 52 360 54 119 55 624Least Developed Countries kt 67 70 72 73 74 75 76 77 79 80 82
Beefa World trade kt 5 963 6 424 6 969 7 176 7 584 7 851 8 062 8 321 8 613 8 843 9 097OECD kt 3 643 3 163 3 325 3 357 3 450 3 555 3 641 3 730 3 862 3 952 4 035Developing kt 2 807 4 086 4 352 4 519 4 846 5 077 5 235 5 419 5 566 5 724 5 890Least Developed Countries kt 2 1 2 1 2 2 2 2 2 2 2
Pigmeata World trade kt 3 999 4 301 4 700 4 927 5 055 5 130 5 279 5 443 5 576 5 680 5 766OECD kt 3 202 3 831 3 785 3 840 3 839 3 871 3 926 4 001 4 097 4 141 4 170Developing kt 1 094 1 228 1 125 1 351 1 547 1 651 1 777 1 899 1 951 2 028 2 103Least Developed Countries kt 2
Poultry World trade kt 7 563 7 479 8 060 8 353 8 541 8 783 9 077 9 475 9 741 9 948 10 180OECD kt 3 769 3 607 3 681 3 653 3 737 3 792 3 827 3 924 3 970 3 804 3 824Developing kt 3 953 4 354 4 590 4 772 4 963 5 156 5 464 5 751 5 908 6 219 6 316Least Developed Countries kt 6 5 3 3 3 3 3 3 3 4 4
Butter World trade kt 697 708 760 799 818 833 842 852 855 863 867OECD kt 741 684 626 575 584 596 602 608 603 603 602Developing kt 49 61 54 57 56 57 57 58 63 66 67Least Developed Countries kt 1 1 1 1 1 1 1 1 1 1 1
Cheese World trade kt 1 401 1 459 1 497 1 545 1 593 1 624 1 666 1 710 1 750 1 792 1 833OECD kt 1 196 1 186 1 150 1 146 1 159 1 177 1 206 1 240 1 265 1 291 1 314Developing kt 137 198 239 274 293 305 318 326 339 351 361Least Developed Countries kt
Whole milk powder World trade kt 1 396 1 582 1 642 1 661 1 726 1 815 1 872 1 950 2 012 2 076 2 139OECD kt 1 185 1 245 1 245 1 235 1 269 1 330 1 359 1 414 1 453 1 489 1 526Developing kt 382 499 570 593 625 654 682 705 728 755 781Least Developed Countries kt 3 4 4 4 4 4 4 4 4 4 4
Skim milk powder World trade kt 1 167 1 196 1 190 1 178 1 161 1 169 1 182 1 184 1 205 1 198 1 210OECD kt 970 803 771 766 739 745 740 753 756 782 813Developing kt 108 137 167 158 169 171 188 177 200 168 150Least Developed Countries kt 2 2 2 2 2 2 2 2 2 2 2
a) Excludes trade of live animals.est.: Estimate.Source: OECD and FAO Secretariats.
OECD-FAO AGRICULTURAL OUTLOOK 2007-2016 – © OECD/FAO 2007 53

ANNEX A
16/17
20
10
350
1.1
62
399
0.7
58
101
31
150
10
31
470
3 780
3 469
15.4
10.8
1 020
119
100
5 740
0.0
55
1 369
0
39
682
0
341
5.4
6 102
1.7
404
54
23
359
205
5
Table A.4. Main policy assumptions for cereal markets
Crop yeara Average01/02-05/06
06/07 est. 07/08 08/09 09/10 10/11 11/12 12/13 13/14 14/15 15/16
ARGENTINA
Crops export tax % 16 20 20 20 20 20 20 20 20 20 20
Rice export tax % 8 10 10 10 10 10 10 10 10 10 10
CANADA
Tariff-quotasb
Wheat kt 350 350 350 350 350 350 350 350 350 350 350
in-quota tariff % 1.1 1.1 1.1 1.1 1.1 1.1 1.1 1.1 1.1 1.1 1.1
out-of-quota tariff % 62 62 62 62 62 62 62 62 62 62 62
Barley kt 399 399 399 399 399 399 399 399 399 399 399
in-quota tariff % 0.7 0.7 0.7 0.7 0.7 0.7 0.7 0.7 0.7 0.7 0.7
out-of-quota tariff % 58 58 58 58 58 58 58 58 58 58 58
EUROPEAN UNIONc, d
Cereal support pricee EUR/t 101 101 101 101 101 101 101 101 101 101 101
Cereal compensationf, g EUR/ha 261 31 31 31 31 31 31 31 31 31 31
Rice support priceh EUR/t 239 150 150 150 150 150 150 150 150 150 150
Compulsory set-aside rate % 9 10 10 10 10 10 10 10 10 10 10
Set-aside paymentg EUR/ha 261 31 31 31 31 31 31 31 31 31 31
Direct payment for rice EUR/ha 564 470 470 470 470 470 470 470 470 470 470
Wheat tariff-quotab kt 2 587 3 780 3 780 3 780 3 780 3 780 3 780 3 780 3 780 3 780 3 780
Coarse grain tariff-quotab kt 3 349 3 469 3 469 3 469 3 469 3 469 3 469 3 469 3 469 3 469 3 469
Subsidised export limitsb
Wheat mt 15.4 15.4 15.4 15.4 15.4 15.4 15.4 15.4 15.4 15.4 15.4
Coarse grainsi mt 10.8 10.8 10.8 10.8 10.8 10.8 10.8 10.8 10.8 10.8 10.8
JAPAN
Rice land diversion program ’000 ha 1 008 1 020 1 020 1 020 1 020 1 020 1 020 1 020 1 020 1 020 1 020
Wheat support pricej ’000 JPY/t 138 119 119 119 119 119 119 119 119 119 119
Barley support pricek ’000 JPY/t 119 100 100 100 100 100 100 100 100 100 100
Wheat tariff-quota kt 5 740 5 740 5 740 5 740 5 740 5 740 5 740 5 740 5 740 5 740 5 740
in-quota tariff ’000 JPY/t 0.0 0.0 0.0 0.0 0.0 0.0 0.0 0.0 0.0 0.0 0.0
out-of-quota tariff ’000 JPY/t 55 55 55 55 55 55 55 55 55 55 55
Barley tariff-quota kt 1 369 1 369 1 369 1 369 1 369 1 369 1 369 1 369 1 369 1 369 1 369
in-quota tariff ’000 JPY/t 0 0 0 0 0 0 0 0 0 0 0
out-of-quota tariff ’000 JPY/t 39 39 39 39 39 39 39 39 39 39 39
Rice tariff-quotal kt 682 682 682 682 682 682 682 682 682 682 682
in-quota tariff ’000 JPY/t 0 0 0 0 0 0 0 0 0 0 0
out-of-quota tariff ’000 JPY/t 341 341 341 341 341 341 341 341 341 341 341
KOREA
Wheat tariff % 6.4 5.4 5.4 5.4 5.4 5.4 5.4 5.4 5.4 5.4 5.4
Maize tariff-quota kt 6 102 6 102 6 102 6 102 6 102 6 102 6 102 6 102 6 102 6 102 6 102
in-quota tariff % 1.7 1.7 1.7 1.7 1.7 1.7 1.7 1.7 1.7 1.7 1.7
out-of-quota tariff % 409 404 404 404 404 404 404 404 404 404 404
Barley tariff-quota kt 52 54 54 54 54 54 54 54 54 54 54
in-quota tariff % 23 23 23 23 23 23 23 23 23 23 23
out-of-quota tariff % 364 359 359 359 359 359 359 359 359 359 359
Rice quotal kt 185 205 205 205 205 205 205 205 205 205 205
in-quota tariff % 5 5 5 5 5 5 5 5 5 5 5
For notes, see end of the table.Source: OECD and FAO Secretariats.
OECD-FAO AGRICULTURAL OUTLOOK 2007-2016 – © OECD/FAO 200754

ANNEX A
16/17
10
8
10
1 332
0.0
0
0
2 501
50
194
5
50
115
101.0
76.8
16.9
10.3
7.5
3.8
3.7
14.5
1.6
0.0
0
0
0
9 636
2.3
65.0
2
7 200
3.7
41.7
5 320
2.3
51.7
Table A.4. Main policy assumptions for cereal markets (cont.)
Crop yeara Average01/02-05/06
06/07 est. 07/08 08/09 09/10 10/11 11/12 12/13 13/14 14/15 15/16
MERCOSUR
Wheat tariff % 11 10 10 10 10 10 10 10 10 10 10
Coarse grain tariff % 8 8 8 8 8 8 8 8 8 8 8
Rice tariff % 11 10 10 10 10 10 10 10 10 10 10
MEXICO
Cereal income paymentm MXN/ha 906 980 1 013 1 045 1 078 1 111 1 145 1 180 1 217 1 254 1 293
Wheat NAFTA tariff % 0.9 0.0 0.0 0.0 0.0 0.0 0.0 0.0 0.0 0.0 0.0
Fidelist social program MXN mn 425 0 0 0 0 0 0 0 0 0 0
Tortilla consumption subsidy MXN mn 0 0 0 0 0 0 0 0 0 0 0
Maize tariff-quota kt 2 501 2 501 2 501 2 501 2 501 2 501 2 501 2 501 2 501 2 501 2 501
in-quota tariff % 50 50 50 50 50 50 50 50 50 50 50
out-of-quota tariff % 197 194 194 194 194 194 194 194 194 194 194
Barley tariff-quota kt 5 5 5 5 5 5 5 5 5 5 5
in-quota tariff % 50 50 50 50 50 50 50 50 50 50 50
out-of-quota tariff % 117 115 115 115 115 115 115 115 115 115 115
UNITED STATES
Wheat loan rate USD/t 100.5 101.0 101.0 101.0 101.0 101.0 101.0 101.0 101.0 101.0 101.0
Maize loan rate USD/t 76.8 76.8 76.8 76.8 76.8 76.8 76.8 76.8 76.8 76.8 76.8
Prod. flex. contract payment
Wheat USD/t 17.0 16.9 16.9 16.9 16.9 16.9 16.9 16.9 16.9 16.9 16.9
Maize USD/t 10.3 10.3 10.3 10.3 10.3 10.3 10.3 10.3 10.3 10.3 10.3
CRP areasn Mha 6.1 6.9 7.2 6.6 6.3 6.5 6.7 6.9 7.2 7.3 7.4
Wheat Mha 2.9 3.5 3.6 3.3 3.2 3.3 3.4 3.5 3.6 3.7 3.7
Coarse grains Mha 3.2 3.4 3.5 3.2 3.1 3.2 3.3 3.4 3.5 3.6 3.7
Subsidised export limitsb
Wheat Mt 14.5 14.5 14.5 14.5 14.5 14.5 14.5 14.5 14.5 14.5 14.5
Coarse grains Mt 1.6 1.6 1.6 1.6 1.6 1.6 1.6 1.6 1.6 1.6 1.6
Wheat EEP paymento USD/t 0.0 0.0 0.0 0.0 0.0 0.0 0.0 0.0 0.0 0.0 0.0
CHINA
Wheat support price CNY/t 135 0 0 0 0 0 0 0 0 0 0
Coarse grains support price CNY/t 117 0 0 0 0 0 0 0 0 0 0
Rice support price CNY/t 440 0 0 0 0 0 0 0 0 0 0
Wheat tariff-quota kt 8 935 9 636 9 636 9 636 9 636 9 636 9 636 9 636 9 636 9 636 9 636
in-quota tariff % 1.8 2.3 2.3 2.3 2.3 2.3 2.3 2.3 2.3 2.3 2.3
out-of-quota tariff % 65.9 65.0 65.0 65.0 65.0 65.0 65.0 65.0 65.0 65.0 65.0
Coarse grains tariff % 4 2 2 2 2 2 2 2 2 2 2
Maize tariff-quota kt 6 390 7 200 7 200 7 200 7 200 7 200 7 200 7 200 7 200 7 200 7 200
in-quota tariff % 2.9 3.7 3.7 3.7 3.7 3.7 3.7 3.7 3.7 3.7 3.7
out-of-quota tariff % 45.8 41.7 41.7 41.7 41.7 41.7 41.7 41.7 41.7 41.7 41.7
Rice tariff-quota % 4 522 5 320 5 320 5 320 5 320 5 320 5 320 5 320 5 320 5 320 5 320
in-quota tariff % 1.9 2.3 2.3 2.3 2.3 2.3 2.3 2.3 2.3 2.3 2.3
out-of-quota tariff % 53.7 51.7 51.7 51.7 51.7 51.7 51.7 51.7 51.7 51.7 51.7
For notes, see end of the table.Source: OECD and FAO Secretariats.
OECD-FAO AGRICULTURAL OUTLOOK 2007-2016 – © OECD/FAO 2007 55
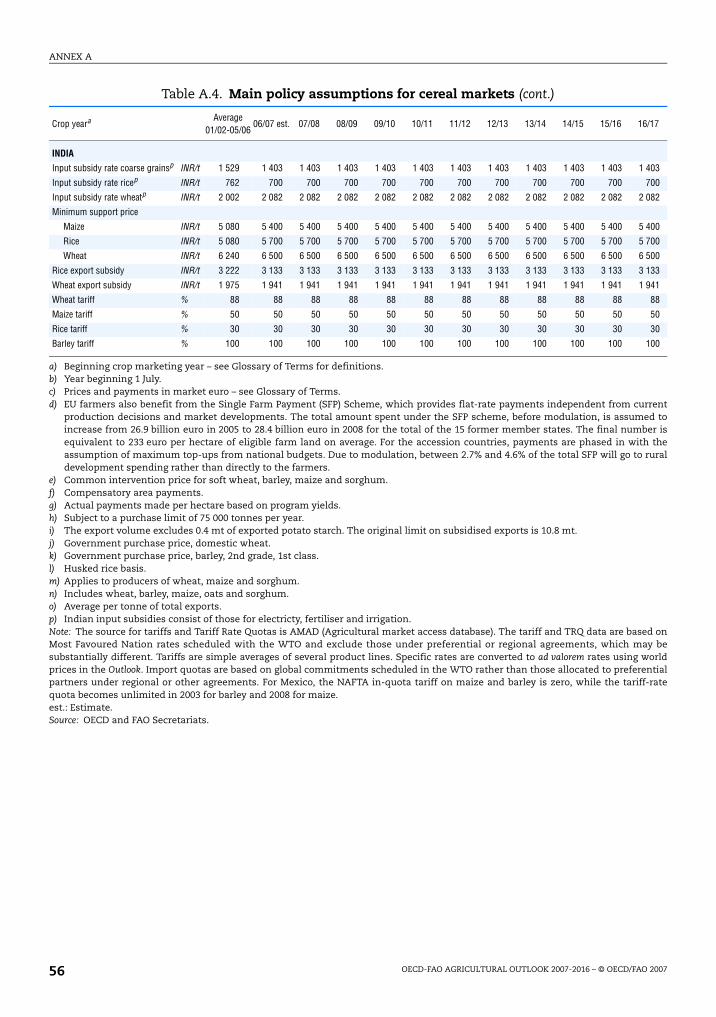
ANNEX A
16/17
1 403
700
2 082
5 400
5 700
6 500
3 133
1 941
88
50
30
100
urrentmed to
ber isith theo rural
sed onay be
worldrentialiff-rate
Table A.4. Main policy assumptions for cereal markets (cont.)
Crop yeara Average01/02-05/06
06/07 est. 07/08 08/09 09/10 10/11 11/12 12/13 13/14 14/15 15/16
INDIA
Input subsidy rate coarse grainsp INR/t 1 529 1 403 1 403 1 403 1 403 1 403 1 403 1 403 1 403 1 403 1 403
Input subsidy rate ricep INR/t 762 700 700 700 700 700 700 700 700 700 700
Input subsidy rate wheatp INR/t 2 002 2 082 2 082 2 082 2 082 2 082 2 082 2 082 2 082 2 082 2 082
Minimum support price
Maize INR/t 5 080 5 400 5 400 5 400 5 400 5 400 5 400 5 400 5 400 5 400 5 400
Rice INR/t 5 080 5 700 5 700 5 700 5 700 5 700 5 700 5 700 5 700 5 700 5 700
Wheat INR/t 6 240 6 500 6 500 6 500 6 500 6 500 6 500 6 500 6 500 6 500 6 500
Rice export subsidy INR/t 3 222 3 133 3 133 3 133 3 133 3 133 3 133 3 133 3 133 3 133 3 133
Wheat export subsidy INR/t 1 975 1 941 1 941 1 941 1 941 1 941 1 941 1 941 1 941 1 941 1 941
Wheat tariff % 88 88 88 88 88 88 88 88 88 88 88
Maize tariff % 50 50 50 50 50 50 50 50 50 50 50
Rice tariff % 30 30 30 30 30 30 30 30 30 30 30
Barley tariff % 100 100 100 100 100 100 100 100 100 100 100
a) Beginning crop marketing year – see Glossary of Terms for definitions.b) Year beginning 1 July.c) Prices and payments in market euro – see Glossary of Terms.d) EU farmers also benefit from the Single Farm Payment (SFP) Scheme, which provides flat-rate payments independent from c
production decisions and market developments. The total amount spent under the SFP scheme, before modulation, is assuincrease from 26.9 billion euro in 2005 to 28.4 billion euro in 2008 for the total of the 15 former member states. The final numequivalent to 233 euro per hectare of eligible farm land on average. For the accession countries, payments are phased in wassumption of maximum top-ups from national budgets. Due to modulation, between 2.7% and 4.6% of the total SFP will go tdevelopment spending rather than directly to the farmers.
e) Common intervention price for soft wheat, barley, maize and sorghum.f) Compensatory area payments.g) Actual payments made per hectare based on program yields.h) Subject to a purchase limit of 75 000 tonnes per year.i) The export volume excludes 0.4 mt of exported potato starch. The original limit on subsidised exports is 10.8 mt.j) Government purchase price, domestic wheat.k) Government purchase price, barley, 2nd grade, 1st class.l) Husked rice basis.m) Applies to producers of wheat, maize and sorghum.n) Includes wheat, barley, maize, oats and sorghum.o) Average per tonne of total exports.p) Indian input subsidies consist of those for electricty, fertiliser and irrigation.Note: The source for tariffs and Tariff Rate Quotas is AMAD (Agricultural market access database). The tariff and TRQ data are baMost Favoured Nation rates scheduled with the WTO and exclude those under preferential or regional agreements, which msubstantially different. Tariffs are simple averages of several product lines. Specific rates are converted to ad valorem rates usingprices in the Outlook. Import quotas are based on global commitments scheduled in the WTO rather than those allocated to prefepartners under regional or other agreements. For Mexico, the NAFTA in-quota tariff on maize and barley is zero, while the tarquota becomes unlimited in 2003 for barley and 2008 for maize.est.: Estimate.Source: OECD and FAO Secretariats.
OECD-FAO AGRICULTURAL OUTLOOK 2007-2016 – © OECD/FAO 200756

ANNEX A
16/17
291.6
230.3
54.5
381.0
443.7
125.4
672.6
674.0
179.9
183.2
622.2
587.9
84.9
562.1
587.0
140.9
184.3
174.9
225.8
138.2
22.1
22.7
7.0
447.0
446.0
80.0
469.0
468.6
86.9
326.0
Table A.5. World cereal projections
Crop yeara Average01/02-05/06
06/07 est. 07/08 08/09 09/10 10/11 11/12 12/13 13/14 14/15 15/16
WHEAT
OECDb
Production mt 253.5 236.3 265.5 271.5 271.9 276.5 279.0 281.9 284.7 287.0 289.1
Consumption mt 205.0 209.1 212.6 216.2 218.1 220.9 223.9 225.0 226.3 228.1 229.3
Closing stocks mt 56.6 44.1 48.9 51.6 51.9 52.8 52.6 52.7 53.3 53.9 54.1
Non-OECD
Production mt 341.0 359.7 362.8 368.8 368.0 369.5 370.6 373.6 375.4 378.3 378.9
Consumption mt 403.8 412.3 411.1 417.5 421.6 426.2 428.1 431.7 434.2 438.2 440.8
Closing stocks mt 138.5 117.1 118.7 124.2 125.8 125.5 124.9 125.4 126.0 126.2 125.5
WORLDc
Production mt 594.5 596.0 628.3 640.3 639.9 646.1 649.5 655.5 660.0 665.3 668.0
Consumption mt 608.8 621.4 623.7 633.8 639.7 647.1 652.0 656.6 660.5 666.2 670.1
Closing stocks mt 195.1 161.2 167.6 175.8 177.7 178.3 177.6 178.1 179.3 180.1 179.6
Priced USD/t 152.0 204.0 204.5 197.5 191.8 186.1 184.6 184.5 183.1 181.7 182.4
COARSE GRAINS
OECDb
Production mt 509.0 498.4 551.4 573.3 584.1 586.6 592.2 600.9 606.0 610.2 615.9
Consumption mt 479.9 510.2 534.9 549.7 558.6 564.5 569.1 573.8 576.9 579.6 584.1
Closing stocks mt 107.6 86.5 79.7 80.6 84.1 84.4 84.1 84.5 84.9 84.7 84.6
Non-OECD
Production mt 441.3 482.1 494.1 508.6 520.1 525.6 533.5 540.0 545.6 549.6 556.6
Consumption mt 468.8 505.3 514.5 521.1 532.8 540.3 549.7 558.0 566.0 572.4 580.0
Closing stocks mt 133.9 117.6 114.8 119.5 123.2 124.8 126.4 129.5 132.1 134.5 137.4
WORLDc
Production mt 950.2 980.5 1 045.5 1 081.9 1 104.3 1 112.2 1 125.6 1 140.9 1 151.6 1 159.7 1 172.5 1
Consumption mt 948.7 1 015.5 1 049.4 1 070.8 1 091.4 1 104.7 1 118.8 1 131.8 1 143.0 1 152.0 1 164.0 1
Closing stocks mt 241.5 204.1 194.5 200.1 207.3 209.2 210.5 214.0 217.0 219.1 222.0
Pricee USD/t 103.6 140.4 158.9 157.6 147.1 143.3 144.0 140.8 138.4 138.6 139.5
RICE
OECDb
Production mt 22.5 21.2 22.3 21.9 21.8 22.0 21.9 21.9 22.1 22.2 22.1
Consumption mt 22.4 22.2 22.4 22.5 22.7 22.7 22.8 22.8 22.7 22.7 22.7
Closing stocks mt 8.3 7.6 7.7 7.7 7.4 7.3 7.1 6.9 6.9 6.9 7.0
Non-OECD
Production mt 381.2 403.6 407.1 413.7 417.6 423.4 422.4 428.8 431.1 438.7 440.5
Consumption mt 395.8 404.6 408.4 411.3 414.6 421.4 423.0 427.4 429.8 436.5 440.5
Closing stocks mt 97.0 79.5 77.5 78.9 80.7 81.5 79.6 79.9 80.0 81.2 80.1
WORLDc
Production mt 403.6 424.8 429.4 435.6 439.4 445.4 444.3 450.8 453.2 460.9 462.7
Consumption mt 418.2 426.8 430.7 433.8 437.3 444.1 445.8 450.1 452.6 459.2 463.1
Closing stocks mt 105.2 87.1 85.2 86.5 88.1 88.8 86.7 86.8 86.9 88.1 87.1
Pricef USD/t 238.4 311.4 352.1 360.3 347.8 331.9 331.0 336.3 336.3 330.2 326.2
a) Beginning crop marketing year – see Glossary of Terms for definitions.b) Excludes Iceland but includes the 8 EU members that are not members of the OECD.c) Source of historic data is USDA.d) No. 2 hard red winter wheat, ordinary protein, USA f.o.b. Gulf Ports (June/May); less EEP payments where applicable.e) No. 2 yellow corn, US f.o.b. Gulf Ports (September/August).f) Milled, 100%, grade b, Nominal Price Quote, NPQ, f.o.b. Bangkok (August/July).est.: Estimate.Source: OECD and FAO Secretariats.
OECD-FAO AGRICULTURAL OUTLOOK 2007-2016 – © OECD/FAO 2007 57

ANNEX A
16/17
27.5
24.0
24.0
8.0
8.0
6.4
31
10
31
6.0
6.0
23.5
10.9
10.9
1 032
5
487
138
1 332
33.0
23.8
45.0
183.7
1.9
3.0
2.2
1.2
12.7
3.2
141
Table A.6. Main policy assumptions for oilseed markets
Crop yeara Average01/02-05/06
06/07 est. 07/08 08/09 09/10 10/11 11/12 12/13 13/14 14/15 15/16
ARGENTINA
Oilseed export tax % 19.5 27.5 27.5 27.5 27.5 27.5 27.5 27.5 27.5 27.5 27.5
Oilseed meal export tax % 16.0 24.0 24.0 24.0 24.0 24.0 24.0 24.0 24.0 24.0 24.0
Oilseed oil export tax % 16.0 24.0 24.0 24.0 24.0 24.0 24.0 24.0 24.0 24.0 24.0
AUSTRALIA
Tariffs
Soybean oil % 8.0 8.0 8.0 8.0 8.0 8.0 8.0 8.0 8.0 8.0 8.0
Rapeseed oil % 8.0 8.0 8.0 8.0 8.0 8.0 8.0 8.0 8.0 8.0 8.0
CANADA
Tariffs
Rapeseed oil % 6.4 6.4 6.4 6.4 6.4 6.4 6.4 6.4 6.4 6.4 6.4
EUROPEAN UNIONc, d
Oilseed compensatione, f EUR/ha 261 31 31 31 31 31 31 31 31 31 31
Compulsory set-aside rate % 9.0 10 10 10 10 10 10 10 10 10 10
Set-aside paymentf EUR/ha 260.5 31 31 31 31 31 31 31 31 31 31
Tariffs
Soybean oil % 6.0 6.0 6.0 6.0 6.0 6.0 6.0 6.0 6.0 6.0 6.0
Rapeseed oil % 6.0 6.0 6.0 6.0 6.0 6.0 6.0 6.0 6.0 6.0 6.0
JAPAN
New output payments
Soybeans bn JPY 23.6 23.5 23.5 23.5 23.5 23.5 23.5 23.5 23.5 23.5 23.5
Tariffs
Soybean oil JPY/kg 10.9 10.9 10.9 10.9 10.9 10.9 10.9 10.9 10.9 10.9 10.9
Rapeseed oil JPY/kg 10.9 10.9 10.9 10.9 10.9 10.9 10.9 10.9 10.9 10.9 10.9
KOREA
Soybean tariff-quota kt 1 032 1 032 1 032 1 032 1 032 1 032 1 032 1 032 1 032 1 032 1 032
in-quota tariff % 5 5 5 5 5 5 5 5 5 5 5
out-of-quota tariff % 493 487 487 487 487 487 487 487 487 487 487
Soybean (for food) mark up ’000 KRW/t 183 142 155 150 147 144 142 141 139 138 138
MEXICO
Soybeans income paymentg MXN/ha 906 980 1 013 1 045 1 078 1 111 1 145 1 180 1 217 1 254 1 293
Tariffs
Soybeans % 33.4 33.0 33.0 33.0 33.0 33.0 33.0 33.0 33.0 33.0 33.0
Soybean meal % 25.4 23.8 23.8 23.8 23.8 23.8 23.8 23.8 23.8 23.8 23.8
Soybean oil % 45.6 45.0 45.0 45.0 45.0 45.0 45.0 45.0 45.0 45.0 45.0
UNITED STATES
Soybeans loan rate USD/t 185.6 183.7 183.7 183.7 183.7 183.7 183.7 183.7 183.7 183.7 183.7
CRP area
Soybeans mha 2.1 2.3 2.4 2.2 2.1 2.2 2.1 2.0 2.0 2.0 1.9
Tariffs
Rapeseed % 3.0 3.0 3.0 3.0 3.0 3.0 3.0 3.0 3.0 3.0 3.0
Soybean meal % 2.2 2.2 2.2 2.2 2.2 2.2 2.2 2.2 2.2 2.2 2.2
Rapeseed meal % 1.2 1.2 1.2 1.2 1.2 1.2 1.2 1.2 1.2 1.2 1.2
Soybean oil % 12.7 12.7 12.7 12.7 12.7 12.7 12.7 12.7 12.7 12.7 12.7
Rapeseed oil % 3.2 3.2 3.2 3.2 3.2 3.2 3.2 3.2 3.2 3.2 3.2
Subsidised export limitsb
Oilseed oils kt 141 141 141 141 141 141 141 141 141 141 141
For notes, see end of the table.Source: OECD and FAO Secretariats.
OECD-FAO AGRICULTURAL OUTLOOK 2007-2016 – © OECD/FAO 200758

ANNEX A
16/17
058.7
2.4
6.3
9.0
7 998
3 360
100
100
100
100
125
100
100
45
45
300
300
198
urrentmed to
ber isith theo rural
sed onay be
worldrential2003.
Table A.6. Main policy assumptions for oilseed markets (cont.)
Crop yeara Average01/02-05/06
06/07 est. 07/08 08/09 09/10 10/11 11/12 12/13 13/14 14/15 15/16
CHINA
Soybeans support price CNY/t 1 332.6 1 501.0 1 549.2 1 597.7 1 647.4 1 700.7 1 754.9 1 810.8 1 868.2 1 929.0 1 992.1 2
Tariffsb
Soybeans % 14.9 2.4 2.4 2.4 2.4 2.4 2.4 2.4 2.4 2.4 2.4
Soybean meal % 8.0 6.3 6.3 6.3 6.3 6.3 6.3 6.3 6.3 6.3 6.3
Soybean oil in-quota tariff % 7.2 9.0 9.0 9.0 9.0 9.0 9.0 9.0 9.0 9.0 9.0
Vegetable oil tariff-quota kt 6 426 7 998 7 998 7 998 7 998 7 998 7 998 7 998 7 998 7 998 7 998
INDIA
Input subsidy rate, oilseedsh R/T 3 596 3 360 3 360 3 360 3 360 3 360 3 360 3 360 3 360 3 360 3 360
Soybean tariff % 100 100 100 100 100 100 100 100 100 100 100
Rapeseed tariff % 100 100 100 100 100 100 100 100 100 100 100
Sunflower tariff % 100 100 100 100 100 100 100 100 100 100 100
Oilseed tariff % 100 100 100 100 100 100 100 100 100 100 100
Soybean meal tariff % 125 125 125 125 125 125 125 125 125 125 125
Rapeseed meal tariff % 100 100 100 100 100 100 100 100 100 100 100
Sunflower meal tariff % 100 100 100 100 100 100 100 100 100 100 100
Soybean oil tariff % 45 45 45 45 45 45 45 45 45 45 45
Rapeseed oil tariff % 45 45 45 45 45 45 45 45 45 45 45
Sunflower oil tariff % 300 300 300 300 300 300 300 300 300 300 300
Palm oil tariff % 300 300 300 300 300 300 300 300 300 300 300
Vegetables oil tariff % 198 198 198 198 198 198 198 198 198 198 198
a) Beginning crop marketing year – see Glossary of Terms for definitions.b) Calendar year, except for China and subsidised export limit in USA, beginning 1 July.c) Prices and payments in market euro – see Glossary of Terms.d) EU farmers also benefit from the Single Farm Payment (SFP) Scheme, which provides flat-rate payments independent from c
production decisions and market developments. The total amount spent under the SFP scheme, before modulation, is assuincrease from 26.9 billion euro in 2005 to 28.4 billion euro in 2008 for the total of the 15 former member states. The final numequivalent to 233 euro per hectare of eligible farm land on average. For the accession countries, payments are phased in wassumption of maximum top-ups from national budgets. Due to modulation, between 2.7% and 4.6% of the total SFP will go tdevelopment spending rather than directly to the farmers.
e) Compensatory area payments, before penalties.f) Payments made per hectare based on regional yields.g) Weighted average of autumn/winter and spring/summer.h) Indian input subsidies consist of those for electricty, fertiliser and irrigation.Note: The source for tariffs and Tariff Rate Quotas is AMAD (Agricultural market access database). The tariff and TRQ data are baMost Favoured Nation rates scheduled with the WTO and exclude those under preferential or regional agreements, which msubstantially different. Tariffs are simple averages of several product lines. Specific rates are converted to ad valorem rates usingprices in the Outlook. Import quotas are based on global commitments scheduled in the WTO rather than those allocated to prefepartners under regional or other agreements. For Mexico, the NAFTA tariffs on soybeans, oil meals and soybean oil are zero afterest.: Estimate.Source: OECD and FAO Secretariats.
OECD-FAO AGRICULTURAL OUTLOOK 2007-2016 – © OECD/FAO 2007 59
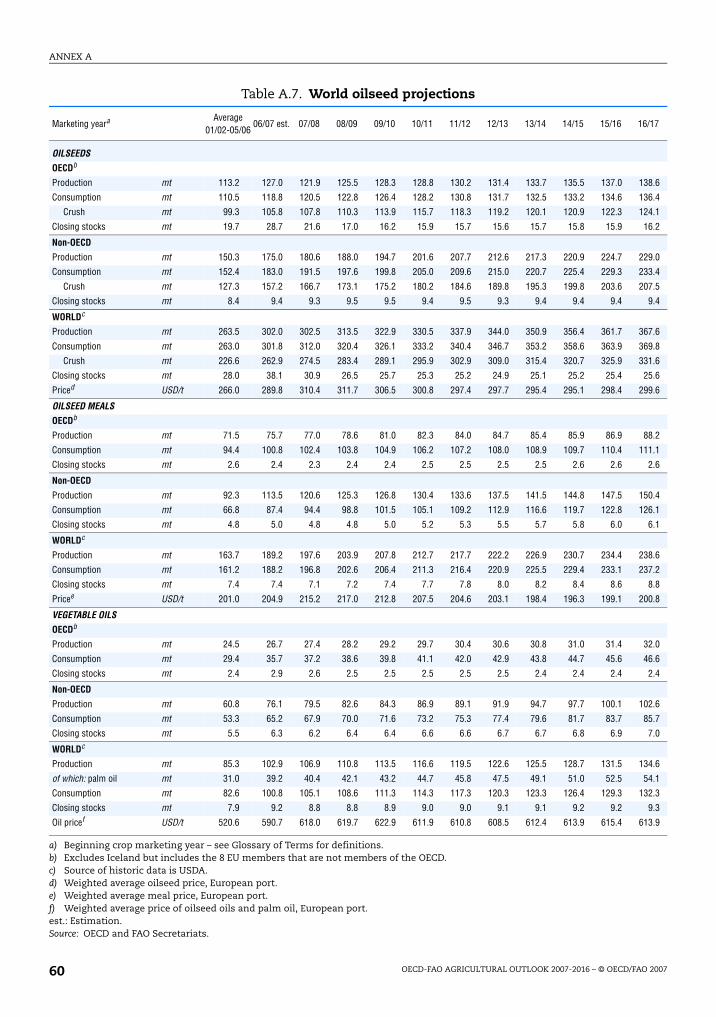
ANNEX A
16/17
138.6
136.4
124.1
16.2
229.0
233.4
207.5
9.4
367.6
369.8
331.6
25.6
299.6
88.2
111.1
2.6
150.4
126.1
6.1
238.6
237.2
8.8
200.8
32.0
46.6
2.4
102.6
85.7
7.0
134.6
54.1
132.3
9.3
613.9
Table A.7. World oilseed projections
Marketing yeara Average01/02-05/06
06/07 est. 07/08 08/09 09/10 10/11 11/12 12/13 13/14 14/15 15/16
OILSEEDS
OECDb
Production mt 113.2 127.0 121.9 125.5 128.3 128.8 130.2 131.4 133.7 135.5 137.0
Consumption mt 110.5 118.8 120.5 122.8 126.4 128.2 130.8 131.7 132.5 133.2 134.6
Crush mt 99.3 105.8 107.8 110.3 113.9 115.7 118.3 119.2 120.1 120.9 122.3
Closing stocks mt 19.7 28.7 21.6 17.0 16.2 15.9 15.7 15.6 15.7 15.8 15.9
Non-OECD
Production mt 150.3 175.0 180.6 188.0 194.7 201.6 207.7 212.6 217.3 220.9 224.7
Consumption mt 152.4 183.0 191.5 197.6 199.8 205.0 209.6 215.0 220.7 225.4 229.3
Crush mt 127.3 157.2 166.7 173.1 175.2 180.2 184.6 189.8 195.3 199.8 203.6
Closing stocks mt 8.4 9.4 9.3 9.5 9.5 9.4 9.5 9.3 9.4 9.4 9.4
WORLDc
Production mt 263.5 302.0 302.5 313.5 322.9 330.5 337.9 344.0 350.9 356.4 361.7
Consumption mt 263.0 301.8 312.0 320.4 326.1 333.2 340.4 346.7 353.2 358.6 363.9
Crush mt 226.6 262.9 274.5 283.4 289.1 295.9 302.9 309.0 315.4 320.7 325.9
Closing stocks mt 28.0 38.1 30.9 26.5 25.7 25.3 25.2 24.9 25.1 25.2 25.4
Priced USD/t 266.0 289.8 310.4 311.7 306.5 300.8 297.4 297.7 295.4 295.1 298.4
OILSEED MEALS
OECDb
Production mt 71.5 75.7 77.0 78.6 81.0 82.3 84.0 84.7 85.4 85.9 86.9
Consumption mt 94.4 100.8 102.4 103.8 104.9 106.2 107.2 108.0 108.9 109.7 110.4
Closing stocks mt 2.6 2.4 2.3 2.4 2.4 2.5 2.5 2.5 2.5 2.6 2.6
Non-OECD
Production mt 92.3 113.5 120.6 125.3 126.8 130.4 133.6 137.5 141.5 144.8 147.5
Consumption mt 66.8 87.4 94.4 98.8 101.5 105.1 109.2 112.9 116.6 119.7 122.8
Closing stocks mt 4.8 5.0 4.8 4.8 5.0 5.2 5.3 5.5 5.7 5.8 6.0
WORLDc
Production mt 163.7 189.2 197.6 203.9 207.8 212.7 217.7 222.2 226.9 230.7 234.4
Consumption mt 161.2 188.2 196.8 202.6 206.4 211.3 216.4 220.9 225.5 229.4 233.1
Closing stocks mt 7.4 7.4 7.1 7.2 7.4 7.7 7.8 8.0 8.2 8.4 8.6
Pricee USD/t 201.0 204.9 215.2 217.0 212.8 207.5 204.6 203.1 198.4 196.3 199.1
VEGETABLE OILS
OECDb
Production mt 24.5 26.7 27.4 28.2 29.2 29.7 30.4 30.6 30.8 31.0 31.4
Consumption mt 29.4 35.7 37.2 38.6 39.8 41.1 42.0 42.9 43.8 44.7 45.6
Closing stocks mt 2.4 2.9 2.6 2.5 2.5 2.5 2.5 2.5 2.4 2.4 2.4
Non-OECD
Production mt 60.8 76.1 79.5 82.6 84.3 86.9 89.1 91.9 94.7 97.7 100.1
Consumption mt 53.3 65.2 67.9 70.0 71.6 73.2 75.3 77.4 79.6 81.7 83.7
Closing stocks mt 5.5 6.3 6.2 6.4 6.4 6.6 6.6 6.7 6.7 6.8 6.9
WORLDc
Production mt 85.3 102.9 106.9 110.8 113.5 116.6 119.5 122.6 125.5 128.7 131.5
of which: palm oil mt 31.0 39.2 40.4 42.1 43.2 44.7 45.8 47.5 49.1 51.0 52.5
Consumption mt 82.6 100.8 105.1 108.6 111.3 114.3 117.3 120.3 123.3 126.4 129.3
Closing stocks mt 7.9 9.2 8.8 8.8 8.9 9.0 9.0 9.1 9.1 9.2 9.2
Oil pricef USD/t 520.6 590.7 618.0 619.7 622.9 611.9 610.8 608.5 612.4 613.9 615.4
a) Beginning crop marketing year – see Glossary of Terms for definitions.b) Excludes Iceland but includes the 8 EU members that are not members of the OECD.c) Source of historic data is USDA.d) Weighted average oilseed price, European port.e) Weighted average meal price, European port.f) Weighted average price of oilseed oils and palm oil, European port.est.: Estimation.Source: OECD and FAO Secretariats.
OECD-FAO AGRICULTURAL OUTLOOK 2007-2016 – © OECD/FAO 200760

ANNEX A
2016
15
76
0
27
45
2
197
2.22
1.56
1.51
5.04
21.0
0
0
0
0
216
167
96
285
990
588
431
1 010
780
39
480
365
4
410
7
40
0
22
21
45
0
41
50
228
Table A.8. Main policy assumptions for meat markets
Average2001-05
2006 est. 2007 2008 2009 2010 2011 2012 2013 2014 2015
ARGENTINA
Beef export tax % 4 15 15 15 15 15 15 15 15 15 15
CANADA
Beef tariff-quota kt pw 76 76 76 76 76 76 76 76 76 76 76
in-quota tariff % 0 0 0 0 0 0 0 0 0 0 0
out-of-quota tariff % 27 27 27 27 27 27 27 27 27 27 27
Poultry meat tariff-quota kt pw 45 45 45 45 45 45 45 45 45 45 45
in-quota tariff % 2 2 2 2 2 2 2 2 2 2 2
out-of-quota tariff % 197 197 197 197 197 197 197 197 197 197 197
EUROPEAN UNIONa, b
Beef basic pricec, d, e EUR/kg dw 2.38 2.22 2.22 2.22 2.22 2.22 2.22 2.22 2.22 2.22 2.22
Beef buy-in pricec, f EUR/kg dw n.a. 1.56 1.56 1.56 1.56 1.56 1.56 1.56 1.56 1.56 1.56
Pig meat basic priced EUR/kg dw 1.51 1.51 1.51 1.51 1.51 1.51 1.51 1.51 1.51 1.51 1.51
Sheep meat basic price EUR/kg dw 5.04 5.04 5.04 5.04 5.04 5.04 5.04 5.04 5.04 5.04 5.04
Sheep basic rateg EUR/head n.a. 21.00 21.0 21.0 21.0 21.0 21.0 21.0 21.0 21.0 21.0
Male bovine premiumh EUR/head 178 0 0 0 0 0 0 0 0 0 0
Adult bovine slaughter premiumi EUR/head 76 0 0 0 0 0 0 0 0 0 0
Calf slaughter premium EUR/head 37 0 0 0 0 0 0 0 0 0 0
Suckler cow premium EUR/head 156 0 0 0 0 0 0 0 0 0 0
Beef tariff-quota kt pw 216 216 216 216 216 216 216 216 216 216 216
Pig meat tariff-quota kt pw 167 167 167 167 167 167 167 167 167 167 167
Poultry meat tariff-quota kt pw 96 96 96 96 96 96 96 96 96 96 96
Sheep meat tariff-quota kt cwe 285 285 285 285 285 285 285 285 285 285 285
Subsidised export limitsd
Beefj kt cwe 990 990 990 990 990 990 990 990 990 990 990
Pig meatj kt cwe 588 588 588 588 588 588 588 588 588 588 588
Poultry meat kt cwe 431 431 431 431 431 431 431 431 431 431 431
JAPANk
Beef stabilisation prices
Upper price JPY/kg dw 1 010 1 010 1 010 1 010 1 010 1 010 1 010 1 010 1 010 1 010 1 010
Lower price JPY/kg dw 780 780 780 780 780 780 780 780 780 780 780
Beef tariff % 39 39 39 39 39 39 39 39 39 39 39
Pig meat stabilisation prices
Upper price JPY/kg dw 480 480 480 480 480 480 480 480 480 480 480
Lower price JPY/kg dw 365 365 365 365 365 365 365 365 365 365 365
Pig meat import systeml
Tariff % 4 4 4 4 4 4 4 4 4 4 4
Standard import price JPY/kg dw 410 410 410 410 410 410 410 410 410 410 410
Poultry meat tariff % 7 7 7 7 7 7 7 7 7 7 7
KOREA
Beef tariff % 40 40 40 40 40 40 40 40 40 40 40
Beef mark-up % 0 0 0 0 0 0 0 0 0 0 0
Pig meat tariff % 23 22 22 22 22 22 22 22 22 22 22
Poultry meat tariff % 21 21 21 21 21 21 21 21 21 21 21
MEXICO
Pig meat tariff % 46 45 45 45 45 45 45 45 45 45 45
Pig meat NAFTA tariff % 1 0 0 0 0 0 0 0 0 0 0
Poultry meat tariff-quota kt pw 41 41 41 41 41 41 41 41 41 41 41
in-quota tariff % 50 50 50 50 50 50 50 50 50 50 50
out-of-quota tariff % 231 228 228 228 228 228 228 228 228 228 228
For notes, see end of the table.Source: OECD and FAO Secretariats.
OECD-FAO AGRICULTURAL OUTLOOK 2007-2016 – © OECD/FAO 2007 61

ANNEX A
2016
480
15
40
502
15
40
1 252
25
697
5
26
16
16
15
19
100
100
92
87
150
6
20
96
urrentmed to
ber isith theo rural
at.
, from
d TRQments,
ratesated to tariff-
Table A.8. Main policy assumptions for meat markets (cont.)
Average2001-05
2006 est. 2007 2008 2009 2010 2011 2012 2013 2014 2015
RUSSIA
Beef tariff-quota kt pw 458 463 468 474 480 480 480 480 480 480 480
in-quota tariff % 15 15 15 15 15 15 15 15 15 15 15
out-of-quota tariff % 58 40 52 50 40 40 40 40 40 40 40
Pigmeat tariff-quota kt pw n.a. 476 485 494 502 502 502 502 502 502 502
in-quota tariff % 15 15 15 15 15 15 15 15 15 15 15
out-of-quota tariff % 80 60 55 50 40 40 40 40 40 40 40
Poultry meat tariff-quota kt pw 618 1 131 1 171 1 212 1 252 1 252 1 252 1 252 1 252 1 252 1 252
in-quota tariff % 25 25 25 25 25 25 25 25 25 25 25
UNITED STATES
Beef tariff-quota kt pw 657 657 697 697 697 697 697 697 697 697 697
in-quota tariff % 5 5 5 5 5 5 5 5 5 5 5
out-of-quota tariff % 26 26 26 26 26 26 26 26 26 26 26
CHINA
Beef tariff % 23 16 16 16 16 16 16 16 16 16 16
Pig meat tariff % 17 16 16 16 16 16 16 16 16 16 16
Sheep meat tariff % 17 15 15 15 15 15 15 15 15 15 15
Poultry meat tariff % 19 19 19 19 19 19 19 19 19 19 19
INDIA
Beef tariff % 105 100 100 100 100 100 100 100 100 100 100
Pig meat tariff % 105 100 100 100 100 100 100 100 100 100 100
Sheep meat tariff % 96 92 92 92 92 92 92 92 92 92 92
Poultry meat tariff % 93 87 87 87 87 87 87 87 87 87 87
Eggs tariff % 150 150 150 150 150 150 150 150 150 150 150
SOUTH AFRICA
Sheepmeat tariff-quota kt pw 6 6 6 6 6 6 6 6 6 6 6
in-quota tariff % 20 20 20 20 20 20 20 20 20 20 20
out-of-quota tariff % 110 96 96 96 96 96 96 96 96 96 96
a) Prices and payments in market euro – see Glossary of Terms.b) EU farmers also benefit from the Single Farm Payment (SFP) Scheme, which provides flat-rate payments independent from c
production decisions and market developments. The total amount spent under the SFP scheme, before modulation, is assuincrease from 26.9 billion euro in 2005 to 28.4 billion euro in 2008 for the total of the 15 former member states. The final numequivalent to 233 euro per hectare of eligible farm land on average. For the accession countries, payments are phased in wassumption of maximum top-ups from national budgets. Due to modulation, between 2.7% and 4.6% of the total SFP will go tdevelopment spending rather than directly to the farmers.
c) Price for R3 grade male cattle.d) Year beginning 1 July, except for E10 which is calendar year. Poland has a commitment on export subsidies on unspecified mee) Ending 1 July 2002, replaced by basic price for storage.f) Starting 1 July 2002.g) A supplementary payment of 7 euro per head is provided for Less Favoured Areas.h) Weighted average of all bull and steers payments.i) Includes national envelopes for beef.j) Includes live trade.k) Year beginning 1 April.l) Pig carcass imports. Emergency import procedures triggered from November 1995 to March 1996, from July 1996 to June 1997
August 2001 to March 2002, from August 2002 to March 2003 and from August 2003 to March 2004.Note: The source for tariffs and Tariff Rate Quotas (excluding Russia) is AMAD (Agricultural market access database). The tariff andata are based on Most Favoured Nation rates scheduled with the WTO and exclude those under preferential or regional agreewhich may be substantially different. Tariffs are simple averages of several product lines. Specific rates are converted to ad valoremusing world prices in the Outlook. Import quotas are based on global commitments scheduled in the WTO rather than those allocpreferential partners under regional or other agreements. For Mexico, the NAFTA in-quota tariff on poultry meat is zero and therate quota is unlimited from 2003.est.: Estimate.n.a.: Not available.Source: OECD and FAO Secretariats.
OECD-FAO AGRICULTURAL OUTLOOK 2007-2016 – © OECD/FAO 200762
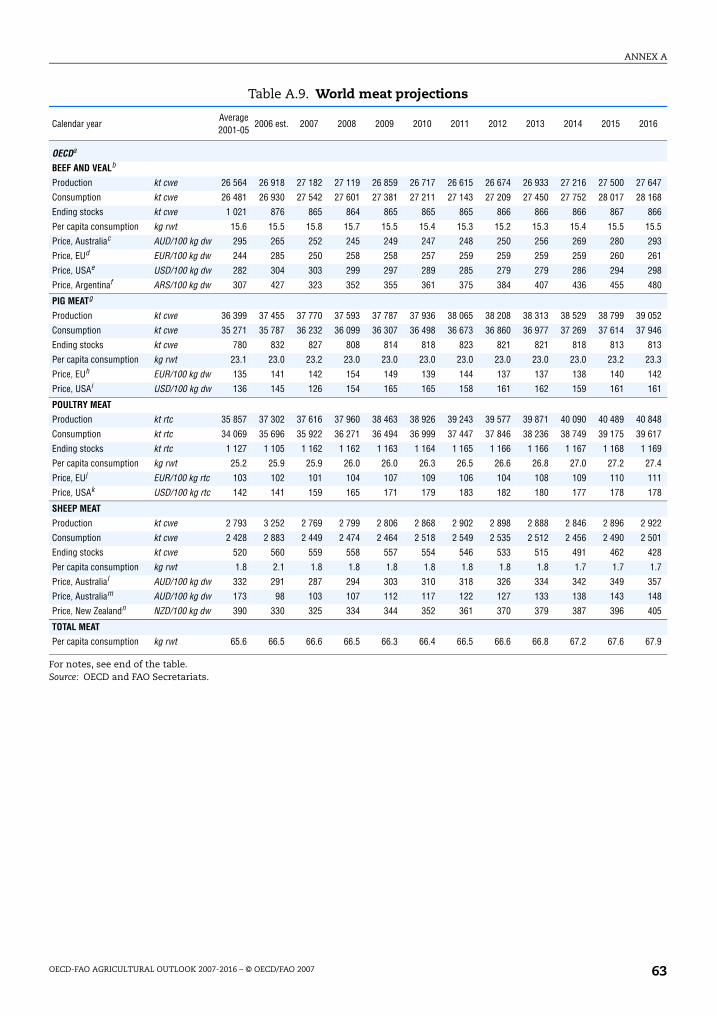
ANNEX A
2016
27 647
28 168
866
15.5
293
261
298
480
39 052
37 946
813
23.3
142
161
40 848
39 617
1 169
27.4
111
178
2 922
2 501
428
1.7
357
148
405
67.9
Table A.9. World meat projections
Calendar yearAverage 2001-05
2006 est. 2007 2008 2009 2010 2011 2012 2013 2014 2015
OECDa
BEEF AND VEALb
Production kt cwe 26 564 26 918 27 182 27 119 26 859 26 717 26 615 26 674 26 933 27 216 27 500
Consumption kt cwe 26 481 26 930 27 542 27 601 27 381 27 211 27 143 27 209 27 450 27 752 28 017
Ending stocks kt cwe 1 021 876 865 864 865 865 865 866 866 866 867
Per capita consumption kg rwt 15.6 15.5 15.8 15.7 15.5 15.4 15.3 15.2 15.3 15.4 15.5
Price, Australiac AUD/100 kg dw 295 265 252 245 249 247 248 250 256 269 280
Price, EUd EUR/100 kg dw 244 285 250 258 258 257 259 259 259 259 260
Price, USAe USD/100 kg dw 282 304 303 299 297 289 285 279 279 286 294
Price, Argentinaf ARS/100 kg dw 307 427 323 352 355 361 375 384 407 436 455
PIG MEATg
Production kt cwe 36 399 37 455 37 770 37 593 37 787 37 936 38 065 38 208 38 313 38 529 38 799
Consumption kt cwe 35 271 35 787 36 232 36 099 36 307 36 498 36 673 36 860 36 977 37 269 37 614
Ending stocks kt cwe 780 832 827 808 814 818 823 821 821 818 813
Per capita consumption kg rwt 23.1 23.0 23.2 23.0 23.0 23.0 23.0 23.0 23.0 23.0 23.2
Price, EUh EUR/100 kg dw 135 141 142 154 149 139 144 137 137 138 140
Price, USAi USD/100 kg dw 136 145 126 154 165 165 158 161 162 159 161
POULTRY MEAT
Production kt rtc 35 857 37 302 37 616 37 960 38 463 38 926 39 243 39 577 39 871 40 090 40 489
Consumption kt rtc 34 069 35 696 35 922 36 271 36 494 36 999 37 447 37 846 38 236 38 749 39 175
Ending stocks kt rtc 1 127 1 105 1 162 1 162 1 163 1 164 1 165 1 166 1 166 1 167 1 168
Per capita consumption kg rwt 25.2 25.9 25.9 26.0 26.0 26.3 26.5 26.6 26.8 27.0 27.2
Price, EUj EUR/100 kg rtc 103 102 101 104 107 109 106 104 108 109 110
Price, USAk USD/100 kg rtc 142 141 159 165 171 179 183 182 180 177 178
SHEEP MEAT
Production kt cwe 2 793 3 252 2 769 2 799 2 806 2 868 2 902 2 898 2 888 2 846 2 896
Consumption kt cwe 2 428 2 883 2 449 2 474 2 464 2 518 2 549 2 535 2 512 2 456 2 490
Ending stocks kt cwe 520 560 559 558 557 554 546 533 515 491 462
Per capita consumption kg rwt 1.8 2.1 1.8 1.8 1.8 1.8 1.8 1.8 1.8 1.7 1.7
Price, Australial AUD/100 kg dw 332 291 287 294 303 310 318 326 334 342 349
Price, Australiam AUD/100 kg dw 173 98 103 107 112 117 122 127 133 138 143
Price, New Zealandn NZD/100 kg dw 390 330 325 334 344 352 361 370 379 387 396
TOTAL MEAT
Per capita consumption kg rwt 65.6 66.5 66.6 66.5 66.3 66.4 66.5 66.6 66.8 67.2 67.6
For notes, see end of the table.Source: OECD and FAO Secretariats.
OECD-FAO AGRICULTURAL OUTLOOK 2007-2016 – © OECD/FAO 2007 63

ANNEX A
2016
48 780
47 657
5.6
66
90 269
90 772
11.8
50
57 692
58 991
8.7
182
11 519
12 002
1.8
5
27.8
factors
Table A.9. World meat projections (cont.)
Calendar yearAverage 2001-05
2006 est. 2007 2008 2009 2010 2011 2012 2013 2014 2015
Non-OECD
BEEF AND VEAL
Productiono kt cwe 35 018 38 676 39 519 40 562 41 653 42 983 44 228 45 151 45 974 46 913 47 926
Consumption kt cwe 34 663 37 959 38 613 39 532 40 586 41 916 43 103 44 019 44 864 45 800 46 813
Per capita consumption kg rwt 4.7 5.0 5.0 5.1 5.2 5.3 5.3 5.4 5.4 5.5 5.5
Ending stocks kt cwe 78 66 66 66 66 66 66 66 66 66 66
PIG MEAT
Productiono kt cwe 60 572 69 964 73 027 74 295 76 128 78 478 79 241 81 642 83 596 85 170 87 454
Consumption kt cwe 61 332 70 834 74 344 75 528 77 256 79 512 80 192 82 518 84 438 85 903 88 077
Per capita consumption kg rwt 9.3 10.4 10.8 10.8 10.9 11.1 11.1 11.2 11.4 11.4 11.6
Ending stocks kt cwe 52 50 50 50 50 50 50 50 50 50 50
POULTRY MEAT
Production kt rtc 41 581 44 638 45 653 47 340 48 867 50 614 51 891 52 966 54 428 55 818 56 721
Consumption kt rtc 43 128 45 894 47 085 48 971 50 690 52 391 53 486 54 512 55 939 57 095 58 055
Per capita consumption kg rwt 7.4 7.6 7.7 7.9 8.1 8.3 8.3 8.4 8.5 8.6 8.6
Ending stocks kt rtc 244 165 174 174 176 177 178 179 180 182 182
SHEEP MEAT
Production kt cwe 8 541 9 311 9 548 9 784 10 007 10 232 10 463 10 676 10 897 11 106 11 319
Consumption kt cwe 8 867 9 657 9 914 10 179 10 418 10 652 10 893 11 112 11 340 11 558 11 782
Per capita consumption kg rwt 1.5 1.6 1.6 1.6 1.7 1.7 1.7 1.7 1.7 1.7 1.7
Ending stocks kt cwe 4 5 5 5 5 5 5 5 5 5 5
TOTAL MEAT
Per capita consumption kg rwt 23.0 24.6 25.1 25.5 25.8 26.3 26.4 26.7 27.0 27.2 27.5
a) Excludes Iceland but includes the 8 EU members that are not members of the OECD. Carcass weight to retail weight conversion of 0.7 for beef and veal, 0.78 for pig meat and 0.88 for sheep meat. Rtc to retail weight conversion factor 0.88 for poultry meat.
b) Do not balance due to statistical differences in New Zealand.c) Weighted average price of cows 201-260 kg, steers 301-400 kg, yearling < 200 kg dw.d) Producer price.e) Choice steers, 1 100-1 300 lb lw, Nebraska – lw to dw conversion factor 0.63.f) Buenos Aires wholesale price linier, young bulls.g) Do not balance due to consumption in Canada which excludes non-food parts.h) Pig producer price.i) Barrows and gilts, No. 1-3, 230-250 lb lw, Iowa/South Minnesota – lw to dw conversion factor 0.74.j) Weighted average farmgate live fowls, top quality, (lw to rtc conversion of 0.75), EU15 starting in 1995.k) Wholesale weighted average broiler price 12 cities.l) Saleyard price, lamb, 16-20 kg dw.m) Saleyard price, wethers, < 22 kg dw.n) Lamb schedule price, all grade average.o) Includes trade of live animals.est.: Estimate.Source: OECD and FAO Secretariats.
OECD-FAO AGRICULTURAL OUTLOOK 2007-2016 – © OECD/FAO 200764

ANNEX A
2016
5
80
7 728
6 451
0.00
20
1
246
9
45
144
2 464
1 747
90
103
71
412
332
323
10
31
2
35
733
116
16
210
0.3
24
316
Table A.10. Main policy assumptions for dairy markets
Average 2001-05
2006 est. 2007 2008 2009 2010 2011 2012 2013 2014 2015
ARGENTINA
Dairy export tax % 6 5 5 5 5 5 5 5 5 5 5
CANADA
Milk target priceb CADc/litre 62 71 72 75 76 76 77 77 78 78 79
Butter support price CAD/t 6 161 6 992 7 077 7 233 7 309 7 367 7 426 7 485 7 545 7 606 7 666
SMP support price CAD/t 5 227 5 834 5 760 6 044 6 180 6 165 6 151 6 181 6 237 6 308 6 377
Dairy subsidy CAD/hl 0.37 0.00 0.00 0.00 0.00 0.00 0.00 0.00 0.00 0.00 0.00
Cheese tariff-quota kt pw 20 20 20 20 20 20 20 20 20 20 20
in-quota tariff % 1 1 1 1 1 1 1 1 1 1 1
out-of-quota tariff % 246 246 246 246 246 246 246 246 246 246 246
Subsidised export limitsc
Cheese kt pw 9 9 9 9 9 9 9 9 9 9 9
SMP kt pw 45 45 45 45 45 45 45 45 45 45 45
EUROPEAN UNIONd, e
Milk quotaf mt pw 139 143 143 143 144 144 144 144 144 144 144
Butter intervention price EUR/t 3 190 2 708 2 528 2 462 2 462 2 462 2 464 2 464 2 464 2 464 2 464
SMP intervention price EUR/t 2 014 1 798 1 747 1 747 1 747 1 747 1 747 1 747 1 747 1 747 1 747
Butter tariff-quotas kt pw 90 90 90 90 90 90 90 90 90 90 90
Cheese tariff-quota kt pw 103 103 103 103 103 103 103 103 103 103 103
SMP tariff-quota kt pw 71 71 71 71 71 71 71 71 71 71 71
Subsidised export limitsa
Butter kt pw 412 412 412 412 412 412 412 412 412 412 412
Cheese kt pw 332 332 332 332 332 332 332 332 332 332 332
SMP kt pw 323 323 323 323 323 323 323 323 323 323 323
JAPAN
Direct payments JPY/kg 11 10 10 10 10 10 10 10 10 10 10
Cheese tariffg % 31 31 31 31 31 31 31 31 31 31 31
Tariff-quotas
Butter kt pw 2 2 2 2 2 2 2 2 2 2 2
in-quota tariff % 35 35 35 35 35 35 35 35 35 35 35
out-of-quota tariff % 733 733 733 733 733 733 733 733 733 733 733
SMP kt pw 116 116 116 116 116 116 116 116 116 116 116
in-quota tariff % 16 16 16 16 16 16 16 16 16 16 16
out-of-quota tariff % 210 210 210 210 210 210 210 210 210 210 210
WMP t pw 0.3 0.3 0.3 0.3 0.3 0.3 0.3 0.3 0.3 0.3 0.3
in-quota tariff % 24 24 24 24 24 24 24 24 24 24 24
out-of-quota tariff % 316 316 316 316 316 316 316 316 316 316 316
For notes, see end of the table.Source: OECD and FAO Secretariats.
OECD-FAO AGRICULTURAL OUTLOOK 2007-2016 – © OECD/FAO 2007 65
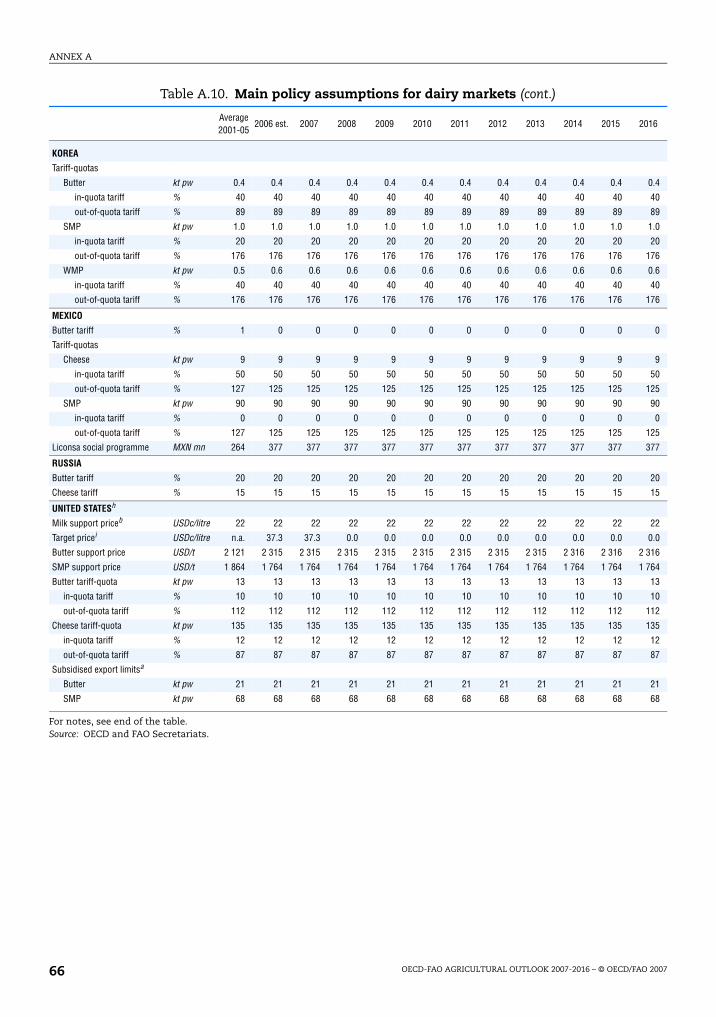
ANNEX A
2016
0.4
40
89
1.0
20
176
0.6
40
176
0
9
50
125
90
0
125
377
20
15
22
0.0
2 316
1 764
13
10
112
135
12
87
21
68
Table A.10. Main policy assumptions for dairy markets (cont.)
Average 2001-05
2006 est. 2007 2008 2009 2010 2011 2012 2013 2014 2015
KOREA
Tariff-quotas
Butter kt pw 0.4 0.4 0.4 0.4 0.4 0.4 0.4 0.4 0.4 0.4 0.4
in-quota tariff % 40 40 40 40 40 40 40 40 40 40 40
out-of-quota tariff % 89 89 89 89 89 89 89 89 89 89 89
SMP kt pw 1.0 1.0 1.0 1.0 1.0 1.0 1.0 1.0 1.0 1.0 1.0
in-quota tariff % 20 20 20 20 20 20 20 20 20 20 20
out-of-quota tariff % 176 176 176 176 176 176 176 176 176 176 176
WMP kt pw 0.5 0.6 0.6 0.6 0.6 0.6 0.6 0.6 0.6 0.6 0.6
in-quota tariff % 40 40 40 40 40 40 40 40 40 40 40
out-of-quota tariff % 176 176 176 176 176 176 176 176 176 176 176
MEXICO
Butter tariff % 1 0 0 0 0 0 0 0 0 0 0
Tariff-quotas
Cheese kt pw 9 9 9 9 9 9 9 9 9 9 9
in-quota tariff % 50 50 50 50 50 50 50 50 50 50 50
out-of-quota tariff % 127 125 125 125 125 125 125 125 125 125 125
SMP kt pw 90 90 90 90 90 90 90 90 90 90 90
in-quota tariff % 0 0 0 0 0 0 0 0 0 0 0
out-of-quota tariff % 127 125 125 125 125 125 125 125 125 125 125
Liconsa social programme MXN mn 264 377 377 377 377 377 377 377 377 377 377
RUSSIA
Butter tariff % 20 20 20 20 20 20 20 20 20 20 20
Cheese tariff % 15 15 15 15 15 15 15 15 15 15 15
UNITED STATESh
Milk support priceb USDc/litre 22 22 22 22 22 22 22 22 22 22 22
Target pricei USDc/litre n.a. 37.3 37.3 0.0 0.0 0.0 0.0 0.0 0.0 0.0 0.0
Butter support price USD/t 2 121 2 315 2 315 2 315 2 315 2 315 2 315 2 315 2 315 2 316 2 316
SMP support price USD/t 1 864 1 764 1 764 1 764 1 764 1 764 1 764 1 764 1 764 1 764 1 764
Butter tariff-quota kt pw 13 13 13 13 13 13 13 13 13 13 13
in-quota tariff % 10 10 10 10 10 10 10 10 10 10 10
out-of-quota tariff % 112 112 112 112 112 112 112 112 112 112 112
Cheese tariff-quota kt pw 135 135 135 135 135 135 135 135 135 135 135
in-quota tariff % 12 12 12 12 12 12 12 12 12 12 12
out-of-quota tariff % 87 87 87 87 87 87 87 87 87 87 87
Subsidised export limitsa
Butter kt pw 21 21 21 21 21 21 21 21 21 21 21
SMP kt pw 68 68 68 68 68 68 68 68 68 68 68
For notes, see end of the table.Source: OECD and FAO Secretariats.
OECD-FAO AGRICULTURAL OUTLOOK 2007-2016 – © OECD/FAO 200766
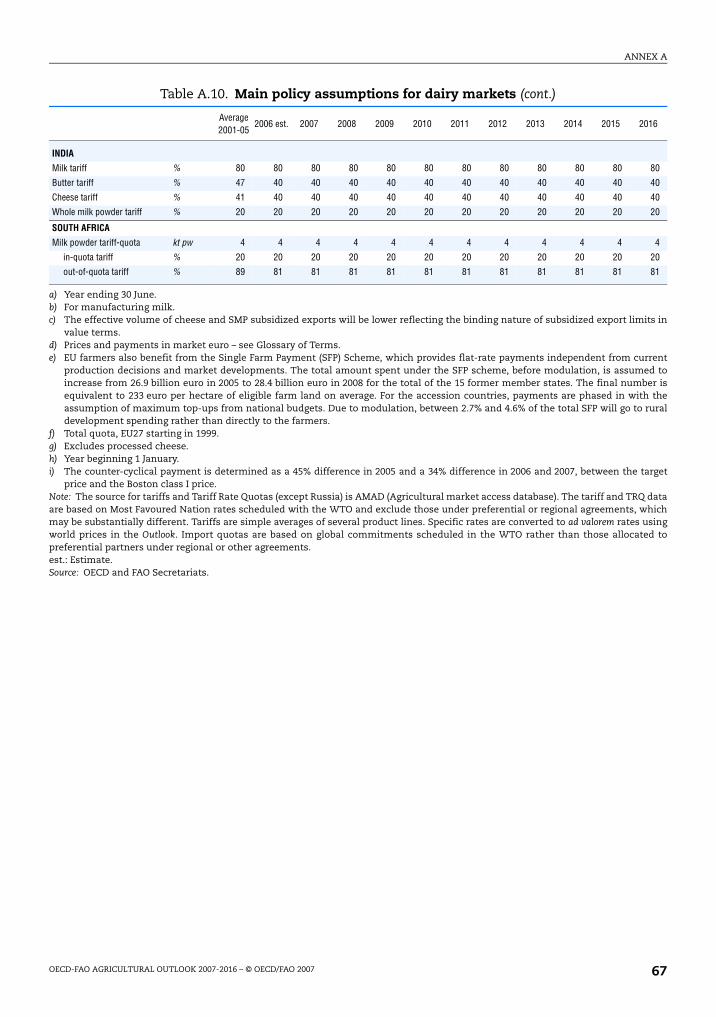
ANNEX A
2016
80
40
40
20
4
20
81
mits in
urrentmed to
ber isith theo rural
target
Q data whichs usingted to
Table A.10. Main policy assumptions for dairy markets (cont.)
Average 2001-05
2006 est. 2007 2008 2009 2010 2011 2012 2013 2014 2015
INDIA
Milk tariff % 80 80 80 80 80 80 80 80 80 80 80
Butter tariff % 47 40 40 40 40 40 40 40 40 40 40
Cheese tariff % 41 40 40 40 40 40 40 40 40 40 40
Whole milk powder tariff % 20 20 20 20 20 20 20 20 20 20 20
SOUTH AFRICA
Milk powder tariff-quota kt pw 4 4 4 4 4 4 4 4 4 4 4
in-quota tariff % 20 20 20 20 20 20 20 20 20 20 20
out-of-quota tariff % 89 81 81 81 81 81 81 81 81 81 81
a) Year ending 30 June.b) For manufacturing milk.c) The effective volume of cheese and SMP subsidized exports will be lower reflecting the binding nature of subsidized export li
value terms.d) Prices and payments in market euro – see Glossary of Terms.e) EU farmers also benefit from the Single Farm Payment (SFP) Scheme, which provides flat-rate payments independent from c
production decisions and market developments. The total amount spent under the SFP scheme, before modulation, is assuincrease from 26.9 billion euro in 2005 to 28.4 billion euro in 2008 for the total of the 15 former member states. The final numequivalent to 233 euro per hectare of eligible farm land on average. For the accession countries, payments are phased in wassumption of maximum top-ups from national budgets. Due to modulation, between 2.7% and 4.6% of the total SFP will go tdevelopment spending rather than directly to the farmers.
f) Total quota, EU27 starting in 1999.g) Excludes processed cheese.h) Year beginning 1 January.i) The counter-cyclical payment is determined as a 45% difference in 2005 and a 34% difference in 2006 and 2007, between the
price and the Boston class I price.Note: The source for tariffs and Tariff Rate Quotas (except Russia) is AMAD (Agricultural market access database). The tariff and TRare based on Most Favoured Nation rates scheduled with the WTO and exclude those under preferential or regional agreements,may be substantially different. Tariffs are simple averages of several product lines. Specific rates are converted to ad valorem rateworld prices in the Outlook. Import quotas are based on global commitments scheduled in the WTO rather than those allocapreferential partners under regional or other agreements.est.: Estimate.Source: OECD and FAO Secretariats.
OECD-FAO AGRICULTURAL OUTLOOK 2007-2016 – © OECD/FAO 2007 67

ANNEX A
2016
3 540
3 122
–28
7 375
7 916
10 914
11 038
–32
223
16 355
15 950
10
4 914
5 341
21 269
21 292
3
307
Table A.11. World dairy projections (butter and cheese)
Calendar yeara Average 2001-05
2006 est. 2007 2008 2009 2010 2011 2012 2013 2014 2015
BUTTER
OECDb
Production kt pw 3 694 3 592 3 627 3 580 3 549 3 536 3 545 3 544 3 536 3 537 3 536
Consumption kt pw 3 079 3 094 3 138 3 121 3 107 3 108 3 114 3 112 3 113 3 115 3 117
Stock changes kt pw 9 –28 28 25 –1 –24 –24 –26 –27 –28 –28
Non-OECD
Production kt pw 4 454 5 104 5 388 5 480 5 761 5 997 6 272 6 469 6 726 6 910 7 165
Consumption kt pw 4 890 5 547 5 891 6 009 6 300 6 544 6 823 7 023 7 272 7 454 7 707
WORLD
Production kt pw 8 148 8 696 9 014 9 060 9 310 9 533 9 816 10 013 10 262 10 446 10 701
Consumption kt pw 7 969 8 642 9 029 9 130 9 407 9 653 9 936 10 135 10 385 10 569 10 824
Stock changes kt pw 3 –25 27 24 –3 –26 –27 –29 –31 –31 –31
Pricec USD/100 kg 156 186 196 193 188 188 195 201 210 215 220
CHEESE
OECDb
Production kt pw 13 849 14 702 14 789 14 984 15 160 15 326 15 454 15 652 15 820 15 993 16 168
Consumption kt pw 13 410 14 218 14 470 14 660 14 825 14 978 15 098 15 277 15 436 15 601 15 770
Stock changes kt pw 0 22 –64 –38 –20 –7 –7 –2 2 5 7
Non-OECD
Production kt pw 3 787 4 047 4 076 4 151 4 252 4 358 4 456 4 549 4 644 4 735 4 827
Consumption kt pw 4 194 4 491 4 490 4 544 4 640 4 746 4 851 4 958 5 058 5 155 5 250
WORLD
Production kt pw 17 636 18 749 18 864 19 135 19 412 19 684 19 910 20 201 20 465 20 728 20 995
Consumption kt pw 17 605 18 709 18 960 19 204 19 465 19 723 19 949 20 235 20 494 20 755 21 020
Stock changes kt pw –8 15 –71 –45 –27 –14 –14 –9 –5 –2 0
Priced USD/100 kg 231 273 300 311 303 300 301 301 302 304 306
a) Year ending 30 June for Australia and 31 May for New Zealand in OECD aggregate.b) Excludes Iceland but includes the 8 EU members that are not members of the OECD.c) F.o.b. export price, butter, 82% butterfat, northern Europe.d) F.o.b. export price, cheddar cheese, 40 lb blocks, northern Europe.est.: Estimate.Source: OECD and FAO Secretariats.
OECD-FAO AGRICULTURAL OUTLOOK 2007-2016 – © OECD/FAO 200768

ANNEX A
2016
2 552
1 948
0
912
1 653
3 463
3 601
2
252
2 341
860
3 010
4 296
5 352
5 155
253
89
439
Table A.12. World dairy projections (powders and casein)
Calendar yeara Average 2001-05
2006 est. 2007 2008 2009 2010 2011 2012 2013 2014 2015
SKIM MILK POWDER
OECDb
Production kt pw 2 741 2 397 2 481 2 390 2 359 2 370 2 391 2 425 2 444 2 484 2 518
Consumption kt pw 1 984 1 783 1 852 1 762 1 771 1 792 1 824 1 858 1 887 1 912 1 929
Stock changes kt pw –30 –46 8 3 1 1 1 1 1 –1 0
Non-OECD
Production kt pw 742 727 771 791 826 844 885 900 931 920 925
Consumption kt pw 1 473 1 483 1 489 1 505 1 509 1 528 1 556 1 578 1 606 1 618 1 644
WORLD
Production kt pw 3 484 3 124 3 251 3 181 3 185 3 214 3 276 3 325 3 375 3 404 3 443
Consumption kt pw 3 457 3 266 3 341 3 268 3 280 3 320 3 381 3 437 3 493 3 530 3 573
Stock changes kt pw –30 –44 10 4 3 3 3 3 3 0 2
Pricec USD/100 kg 186 235 259 269 266 259 254 250 248 250 249
WHOLE MILK POWDER
OECDb
Production kt pw 1 819 1 946 1 945 1 946 1 990 2 057 2 093 2 154 2 205 2 250 2 295
Consumption kt pw 720 785 782 790 801 806 814 820 832 841 850
Non-OECD
Production kt pw 1 801 2 277 2 377 2 472 2 559 2 633 2 708 2 769 2 831 2 895 2 952
Consumption kt pw 2 712 3 245 3 352 3 432 3 551 3 687 3 791 3 907 4 007 4 108 4 200
WORLD
Production kt pw 3 620 4 223 4 321 4 418 4 549 4 690 4 801 4 923 5 036 5 145 5 246
Consumption kt pw 3 432 4 030 4 133 4 222 4 352 4 494 4 605 4 727 4 840 4 949 5 050
Priced USD/100 kg 191 229 255 263 257 248 250 249 251 252 253
WHEY POWDER
Non-OECD
Wholesale price, USAe USD/100 kg 51 74 79 83 91 91 92 91 91 90 89
CASEIN
Pricef USD/100 kg 439 486 480 482 468 458 442 451 440 445 440
a) Year ending 30 June for Australia and 31 May for New Zealand in OECD aggregate.b) Excludes Iceland but includes the 8 EU members that are not members of the OECD.c) F.o.b. export price, non-fat dry milk, extra grade, northern Europe.d) F.o.b. export price, WMP 26% butterfat, northern Europe.e) Edible dry whey, Wisconsin, plant.f) Export price, New Zealand.est.: Estimate.Source: OECD and FAO Secretariats.
OECD-FAO AGRICULTURAL OUTLOOK 2007-2016 – © OECD/FAO 2007 69

ANNEX A
16/17
35.0
39.8
35.0
35.0
25.0
27.7
35.4
1 954
15.0
50.0
50.0
20.0
404
16 188
1 431
531 660
340
419
40.0
750
60.0
25.0
40.0
150
71.8
103.1
18.0
17.0
4 705
4 705
Table A.13. Main policy assumptions for sugar markets
Crop yeara 05/06 06/07 est. 07/08 08/09 09/10 10/11 11/12 12/13 13/14 14/15 15/16
MAIN ASSUMPTIONS FOR SUGAR MARKETS
ARGENTINA
Tariff, sugar ARS/t 35.0 35.0 35.0 35.0 35.0 35.0 35.0 35.0 35.0 35.0 35.0
BRAZIL
Cane allocation to sugar % 50.0 50.2 49.1 48.0 47.0 45.8 44.5 43.3 42.3 41.4 40.6
Tariff, raw sugar % 35.0 35.0 35.0 35.0 35.0 35.0 35.0 35.0 35.0 35.0 35.0
Tariff, white sugar % 35.0 35.0 35.0 35.0 35.0 35.0 35.0 35.0 35.0 35.0 35.0
Ethanol blending ratio with gazoline % 25.0 23.0 25.0 25.0 25.0 25.0 25.0 25.0 25.0 25.0 25.0
CANADA
Tariff, raw sugar CAD/t 27.7 27.7 27.7 27.7 27.7 27.7 27.7 27.7 27.7 27.7 27.7
Tariff, white sugar CAD/t 35.4 35.4 35.4 35.4 35.4 35.4 35.4 35.4 35.4 35.4 35.4
CHINAb
TRQ sugar kt 1 954 1 954 1 954 1 954 1 954 1 954 1 954 1 954 1 954 1 954 1 954
Tariff, in-quota, raw sugar % 15.0 15.0 15.0 15.0 15.0 15.0 15.0 15.0 15.0 15.0 15.0
Tariff, in-quota, white sugar % 50.0 50.0 50.0 50.0 50.0 50.0 50.0 50.0 50.0 50.0 50.0
Tariff, over-quota % 50.0 50.0 50.0 50.0 50.0 50.0 50.0 50.0 50.0 50.0 50.0
DOMINICAN REPUBLIC
Applied tariff, white sugar % 20.0 20.0 20.0 20.0 20.0 20.0 20.0 20.0 20.0 20.0 20.0
EUe
Reference price, white sugarc EUR/t 632 632 632 542 404 404 404 404 404 404 404
Effective quotad kt rse 18 803 15 910 17 427 17 485 17 143 17 057 16 924 16 773 16 583 16 361 16 108
Subsidised export limits
Quantity limit kt rse 1 431 1 431 1 431 1 431 1 431 1 431 1 431 1 431 1 431 1 431 1 431
Value limit 000 EUR 531 660 531 660 531 660 531 660 531 660 531 660 531 660 531 660 531 660 531 660 531 660
Tariff, raw sugar EUR/t 339 339 339 339 339 339 339 339 339 339 340
Tariff, white sugar EUR/t 419 419 419 419 419 419 419 419 419 419 419
FIJI
Applied tariff, white sugar % 40.0 40.0 40.0 40.0 40.0 40.0 40.0 40.0 40.0 40.0 40.0
INDIA
Intervention price, sugar cane INR/t 750 750 750 750 750 750 750 750 750 750 750
Applied tariff, raw sugar % 60.0 60.0 60.0 60.0 60.0 60.0 60.0 60.0 60.0 60.0 60.0
INDONESIA
Tariff, white sugar % 25.0 25.0 25.0 25.0 25.0 25.0 25.0 25.0 25.0 25.0 25.0
JAMAICA
Applied tariff, white sugar % 40.0 40.0 40.0 40.0 40.0 40.0 40.0 40.0 40.0 40.0 40.0
JAPAN
Minimum stabilisation price, raw sugar JPY/kg 150 150 150 150 150 150 150 150 150 150 150
Tariff, raw sugar JPY/kg 71.8 71.8 71.8 71.8 71.8 71.8 71.8 71.8 71.8 71.8 71.8
Tariff, white sugar JPY/kg 103.1 103.1 103.1 103.1 103.1 103.1 103.1 103.1 103.1 103.1 103.1
KOREA
Tariff, raw sugar % 18.0 18.0 18.0 18.0 18.0 18.0 18.0 18.0 18.0 18.0 18.0
MADAGASCAR
Applied tariff, white sugar % 17.0 17.0 17.0 17.0 17.0 17.0 17.0 17.0 17.0 17.0 17.0
MEXICO
Mexico common external tariff, raw sugar MXN/t 4 301 4 308 4 315 4 340 4 377 4 418 4 466 4 512 4 560 4 608 4 656
Mexico common external tariff, white sugar MXN/t 4 301 4 308 4 315 4 340 4 377 4 418 4 466 4 512 4 560 4 608 4 656
For notes, see end of the table.Source: OECD and FAO Secretariats.
OECD-FAO AGRICULTURAL OUTLOOK 2007-2016 – © OECD/FAO 200770

ANNEX A
16/17
75.7
340.0
397
504.9
1 080
49
339
357
0
105.0
25.0
40.0
16/17
39 429
2 236
43 271
12 954
47 971
43 774
42 736
69 142
87 400
86 007
82 096
242.5
308.6
Table A.13. Main policy assumptions for sugar markets (cont.)
Crop yeara 05/06 06/07 est. 07/08 08/09 09/10 10/11 11/12 12/13 13/14 14/15 15/16
RUSSIA
Tariff, raw sugarf % 26.5 68.7 75.7 80.1 83.2 80.1 77.2 78.6 78.6 77.2 76.4
Tariff, white sugarf USD/t 340.0 340.0 340.0 340.0 340.0 340.0 340.0 340.0 340.0 340.0 340.0
UNITED STATESe
Loan rate, cane sugar USD/t 397 397 397 397 397 397 397 397 397 397 397
Loan rate, beet sugar USD/t 504.9 504.9 504.9 504.9 504.9 504.9 504.9 504.9 504.9 504.9 504.9
TRQ, raw sugar kt rse 2 549 1 853 1 755 1 080 1 080 1 080 1 080 1 080 1 080 1 080 1 080
TRQ, refined sugar kt rse 49 49 49 49 49 49 49 49 49 49 49
Raw sugar 2nd tier WTO tariff USD/t 339 339 339 339 339 339 339 339 339 339 339
White sugar 2nd tier WTO tariff USD/t 357 357 357 357 357 357 357 357 357 357 357
Raw sugar 2nd tier NAFTA tariff USD/t 100 67 33 0 0 0 0 0 0 0 0
SOUTH AFRICA
Tariff, raw sugar % 105.0 105.0 105.0 105.0 105.0 105.0 105.0 105.0 105.0 105.0 105.0
TANZANIA
Applied tariff, white sugar % 25.0 25.0 25.0 25.0 25.0 25.0 25.0 25.0 25.0 25.0 25.0
VIET NAM
Applied tariff, white sugar % 40.0 40.0 40.0 40.0 40.0 40.0 40.0 40.0 40.0 40.0 40.0
a) Beginning crop marketing year – see the Glossary of Terms for definitions.b) Refers to mainland only.c) Reference price for consumers.d) Production that receives official support. Includes the 10 new member countries from May 2004, Bulgaria and Romania.e) In addition, price based special safeguard actions may apply.f) Assumes a wholesale price target of USD 470 per tonne as the basis for setting the floating tariff duty.The source for tariffs (except United States and Russia) is AMAD. The source for Russia and United States tariffs is ERS, USDA.est.: Estimate.rse: Raw sugar equivalent.Source: OECD and FAO Secretariats.
Table A.14. World sugar projections (in raw sugar equivalent)
Crop yeara Average01/02-05/06
06/07 est. 07/08 08/09 09/10 10/11 11/12 12/13 13/14 14/15 15/16
OECD
Production kt rse 41 974 38 769 38 360 38 099 38 395 38 471 38 273 38 522 38 780 38 999 39 206
EU bio-ethanol kL 889 973 921 1 047 1 132 1 288 1 463 1 621 1 777 1 930 2 082
Consumption kt rse 40 734 41 036 41 178 41 459 41 702 41 943 42 185 42 406 42 624 42 840 43 056
Closing stocks kt rse 18 755 17 323 17 337 16 443 16 033 15 649 14 787 14 156 13 668 13 328 13 193
NON-OECD
Production kt rse 103 147 123 023 124 850 123 881 122 870 127 670 132 744 137 145 138 893 142 201 145 136 1
Brazil bio-ethanol kL 13 943 19 398 21 486 23 573 25 661 28 248 30 836 33 423 36 011 38 599 41 186
Consumption kt rse 103 334 111 738 117 411 119 973 122 694 125 454 128 246 131 093 133 972 136 876 139 798 1
Closing stocks kt rse 45 094 55 795 60 401 61 843 59 121 58 250 59 699 62 498 64 063 65 887 67 511
WORLD
Production kt rse 145 120 161 792 163 210 161 980 161 265 166 141 171 017 175 667 177 673 181 200 184 343 1
Consumption kt rse 144 068 152 774 158 589 161 432 164 397 167 396 170 431 173 499 176 596 179 716 182 854 1
Closing stocks kt rse 63 848 73 118 77 738 78 286 75 155 73 899 74 486 76 654 77 731 79 215 80 704
Price, raw sugarb USD/t 217.6 253.5 242.5 235.9 231.5 235.9 240.3 238.1 238.1 240.3 241.4
Price, white sugarc USD/t 269.7 360.5 341.7 330.7 319.7 319.7 319.7 314.2 310.9 310.9 309.7
a) Beginning crop marketing year – see the Glossary of Terms for definitions.b) Raw sugar world price, New York No. 11, f.o.b. stowed Caribbean port (including Brazil), bulk spot price, September/August.c) Refined sugar price, London No. 5, f.o.b. Europe, spot, September/August.est.: Estimate.Source: OECD and FAO Secretariats.
OECD-FAO AGRICULTURAL OUTLOOK 2007-2016 – © OECD/FAO 2007 71

ANNEX B
ANNEX B
Trade Annex Tables
OECD-FAO AGRICULTURAL OUTLOOK 2007-2016 – © OECD/FAO 200772
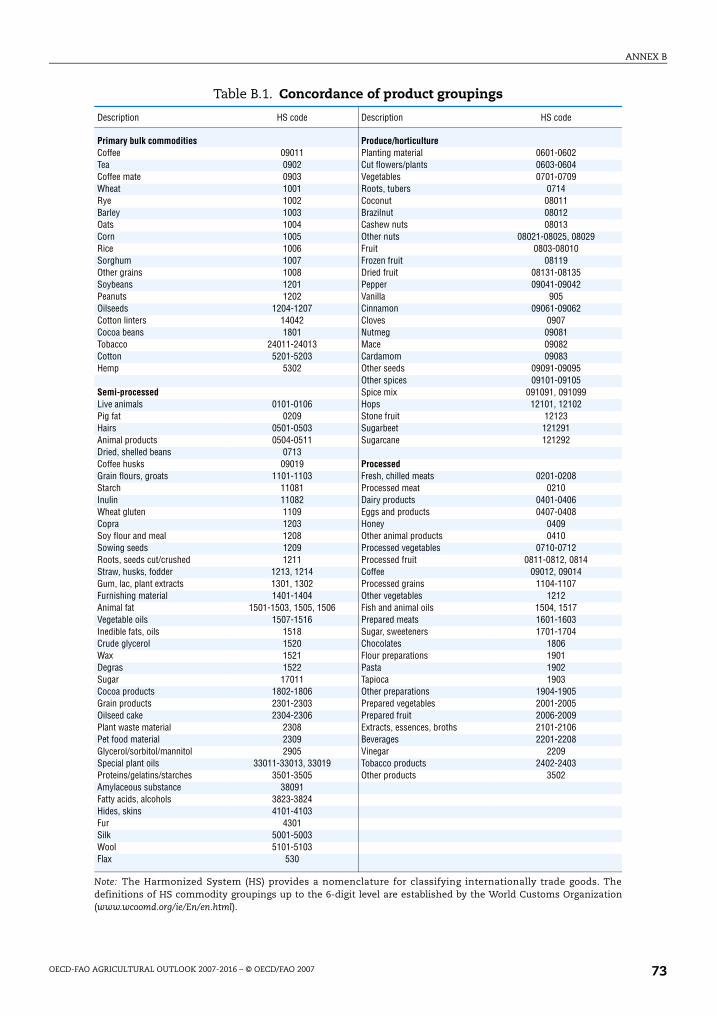
ANNEX B
Table B.1. Concordance of product groupings
Description HS code Description HS code
Primary bulk commodities Produce/horticultureCoffee 09011 Planting material 0601-0602Tea 0902 Cut flowers/plants 0603-0604Coffee mate 0903 Vegetables 0701-0709Wheat 1001 Roots, tubers 0714Rye 1002 Coconut 08011Barley 1003 Brazilnut 08012Oats 1004 Cashew nuts 08013Corn 1005 Other nuts 08021-08025, 08029Rice 1006 Fruit 0803-08010Sorghum 1007 Frozen fruit 08119Other grains 1008 Dried fruit 08131-08135Soybeans 1201 Pepper 09041-09042Peanuts 1202 Vanilla 905Oilseeds 1204-1207 Cinnamon 09061-09062Cotton linters 14042 Cloves 0907Cocoa beans 1801 Nutmeg 09081Tobacco 24011-24013 Mace 09082Cotton 5201-5203 Cardamom 09083Hemp 5302 Other seeds 09091-09095
Other spices 09101-09105Semi-processed Spice mix 091091, 091099Live animals 0101-0106 Hops 12101, 12102Pig fat 0209 Stone fruit 12123Hairs 0501-0503 Sugarbeet 121291Animal products 0504-0511 Sugarcane 121292Dried, shelled beans 0713Coffee husks 09019 ProcessedGrain flours, groats 1101-1103 Fresh, chilled meats 0201-0208Starch 11081 Processed meat 0210Inulin 11082 Dairy products 0401-0406Wheat gluten 1109 Eggs and products 0407-0408Copra 1203 Honey 0409Soy flour and meal 1208 Other animal products 0410Sowing seeds 1209 Processed vegetables 0710-0712Roots, seeds cut/crushed 1211 Processed fruit 0811-0812, 0814Straw, husks, fodder 1213, 1214 Coffee 09012, 09014Gum, lac, plant extracts 1301, 1302 Processed grains 1104-1107Furnishing material 1401-1404 Other vegetables 1212Animal fat 1501-1503, 1505, 1506 Fish and animal oils 1504, 1517Vegetable oils 1507-1516 Prepared meats 1601-1603Inedible fats, oils 1518 Sugar, sweeteners 1701-1704Crude glycerol 1520 Chocolates 1806Wax 1521 Flour preparations 1901Degras 1522 Pasta 1902Sugar 17011 Tapioca 1903Cocoa products 1802-1806 Other preparations 1904-1905Grain products 2301-2303 Prepared vegetables 2001-2005Oilseed cake 2304-2306 Prepared fruit 2006-2009Plant waste material 2308 Extracts, essences, broths 2101-2106Pet food material 2309 Beverages 2201-2208Glycerol/sorbitol/mannitol 2905 Vinegar 2209Special plant oils 33011-33013, 33019 Tobacco products 2402-2403Proteins/gelatins/starches 3501-3505 Other products 3502Amylaceous substance 38091Fatty acids, alcohols 3823-3824Hides, skins 4101-4103Fur 4301Silk 5001-5003Wool 5101-5103Flax 530
Note: The Harmonized System (HS) provides a nomenclature for classifying internationally trade goods. Thedefinitions of HS commodity groupings up to the 6-digit level are established by the World Customs Organization(www.wcoomd.org/ie/En/en.html).
OECD-FAO AGRICULTURAL OUTLOOK 2007-2016 – © OECD/FAO 2007 73

ANNEX B
Table B.2. Top 20 exporters and importers of bulk products (excludes intra-EU)
Average bulk exports (1985-89) Average bulk imports (1985-89)
USD billion Share USD billion Share
United States 17.16 37.16 EU15 15.42 32.15
Canada 3.78 8.18 of which:
EU15 3.22 6.98 Germanya 3.96 8.26
of which: Netherlands 1.92 4.00
France 1.30 2.83 Italy 1.91 3.99
Germanya 0.52 1.13 Spain 1.57 3.26
United Kingdom 0.51 1.11 France 1.52 3.16
Australia 2.42 5.23 United Kingdom 1.48 3.09
Brazil 2.24 4.86 Belgium-Luxembourg 0.81 1.68
Colombia 2.00 4.32 Portugal 0.75 1.57
China 1.87 4.05 Japan 7.64 15.93
Argentina 1.82 3.93 United States 4.09 8.53
Thailand 1.39 3.01 Korea, Republic of 1.92 4.01
Côte d'Ivoire 1.36 2.95 Chinese Taipei 1.90 3.95
India 1.07 2.31 China 1.57 3.27
Pakistan 0.88 1.90 Mexico 1.04 2.17
Mexico 0.74 1.61 Algeria 0.85 1.77
Kenya 0.57 1.23 Egypt, Arab Republic of 0.75 1.57
Indonesia 0.57 1.23 Saudi Arabia 0.72 1.50
Zimbabwe 0.41 0.89 Brazil 0.67 1.40
Sri Lanka 0.39 0.84 Indonesia 0.67 1.39
Cameroon 0.37 0.79 Canada 0.61 1.27
Total of above 42.24 91.47 Total of above 37.84 78.91
Average bulk exports (2000-04) Average bulk imports (2000-04)
USD billion Share USD billion Share
United States 20.16 30.74 EU15 14.05 18.99
Brazil 5.58 8.50 of which:
Canada 4.13 6.30 Germanya 3.06 4.13
Australia 4.09 6.24 Netherlands 2.33 3.15
Argentina 3.88 5.91 Italy 1.95 2.64
EU15 3.25 4.96 Spain 1.72 2.33
of which: United Kingdom 1.19 1.61
France 1.19 1.82 France 1.13 1.53
Germanya 0.86 1.32 Japan 7.55 10.20
China 2.28 3.47 China 6.19 8.36
India 2.12 3.23 United States 3.84 5.19
Thailand 2.05 3.13 Mexico 3.60 4.87
Côte d'Ivoire 1.74 2.65 Korea, Republic of 2.67 3.61
Viet Nam 1.20 1.82 Indonesia 2.11 2.85
Colombia 0.88 1.35 Chinese Taipei 1.87 2.53
Indonesia 0.76 1.16 Brazil 1.71 2.31
Pakistan 0.74 1.13 Turkey 1.48 2.00
Russian Federation 0.71 1.08 Egypt, Arab Republic of 1.46 1.97
Ukraine 0.71 1.08 Iran, Islamic Republic of 1.36 1.84
Sri Lanka 0.69 1.05 Algeria 1.31 1.77
Kazakhstan 0.58 0.89 Saudi Arabia 1.28 1.73
Ghana 0.58 0.88 Canada 1.17 1.59
Total of above 56.13 85.57 Total of above 51.64 69.81
a) Excludes data for the German Democratic Republic.
OECD-FAO AGRICULTURAL OUTLOOK 2007-2016 – © OECD/FAO 200774

ANNEX B
Table B.3. Top 20 exporters and importers of horticultural products (excludes intra-EU)
Average horticulture exports (1985-89) Average horticulture imports (1985-89)
USD billion Share USD billion Share
United States 2.15 15.52 EU15 7.25 37.54
EU15 1.65 11.85 of which:
of which: Germanya 1.87 9.67
Netherlands 0.56 4.03 France 1.32 6.83
Italy 0.31 2.20 United Kingdom 1.04 5.38
Turkey 0.78 5.60 Netherlands 1.02 5.30
Thailand 0.75 5.37 Italy 0.51 2.62
Mexico 0.67 4.84 Belgium-Luxembourg 0.33 1.70
India 0.52 3.74 Sweden 0.28 1.47
Chile 0.47 3.39 Austria 0.23 1.20
China 0.44 3.15 Spain 0.20 1.02
Israel 0.42 3.06 United States 3.70 19.18
Colombia 0.39 2.82 Japan 1.83 9.46
New Zealand 0.39 2.77 Canada 1.57 8.14
Costa Rica 0.34 2.43 Switzerland 0.79 4.11
Indonesia 0.30 2.15 Hong Kong, China 0.59 3.06
Brazil 0.28 2.02 Singapore 0.44 2.27
Singapore 0.28 2.02 Saudi Arabia 0.32 1.65
Morocco 0.27 1.93 Norway 0.28 1.47
Honduras 0.27 1.91 Kuwait 0.23 1.21
Philippines 0.25 1.79 Chinese Taipei 0.21 1.08
Ecuador 0.24 1.72 Malaysia 0.18 0.92
Total of above 10.84 78.07 Total of above 17.40 90.10
Average horticulture exports (2000-04) Average horticulture imports (2000-04)
USD billion Share USD billion Share
United States 6.20 16.32 EU15 13.82 29.64
EU15 5.05 13.29 of which:
of which: Germanya 2.94 6.31
Netherlands 2.06 5.41 United Kingdom 2.26 4.85
Spain 0.79 2.09 Netherlands 2.08 4.46
Italy 0.71 1.86 France 1.76 3.78
Mexico 3.13 8.23 Belgium-Luxembourg 1.66 3.57
China 1.68 4.41 Italy 0.99 2.13
Turkey 1.56 4.10 Spain 0.96 2.07
Chile 1.47 3.87 United States 10.03 21.51
Ecuador 1.27 3.35 Japan 3.51 7.52
Colombia 1.13 2.98 Canada 2.99 6.42
Canada 1.05 2.75 Russian Federation 1.37 2.95
Costa Rica 1.00 2.63 Switzerland 1.31 2.80
India 0.96 2.54 Hong Kong, China 1.20 2.57
South Africa 0.83 2.19 Poland 0.75 1.62
New Zealand 0.74 1.96 Mexico 0.73 1.57
Iran, Islamic Republic of 0.72 1.89 China 0.66 1.42
Thailand 0.63 1.66 Singapore 0.65 1.39
Argentina 0.60 1.57 Saudi Arabia 0.56 1.19
Israel 0.59 1.54 Norway 0.53 1.15
Brazil 0.55 1.45 India 0.52 1.11
Total of above 29.17 76.74 Total of above 38.64 82.85
a) Excludes data for the German Democratic Republic.
OECD-FAO AGRICULTURAL OUTLOOK 2007-2016 – © OECD/FAO 2007 75

ANNEX B
Table B.4. Top 20 exporters and importers of semi-processed products (excludes intra-EU)
Average semi processed exports (1985-89) Average semi processed imports (1985-89)
USD billion Share USD billion share
United States 8.02 19.55 EU15 14.24 32.08
EU15 6.68 16.30 of which:
of which: Germanya 2.75 6.20
Germanya 1.34 3.26 Italy 2.73 6.14
France 1.07 2.60 France 2.36 5.32
Netherlands 1.03 2.52 United Kingdom 1.72 3.87
Italy 0.69 1.69 Netherlands 1.65 3.73
United Kingdom 0.59 1.44 Spain 0.89 1.99
Australia 4.09 9.98 Belgium-Luxembourg 0.62 1.41
China 2.41 5.88 Japan 4.68 10.54
Malaysia 2.17 5.29 United States 4.33 9.75
Brazil 2.05 4.99 Korea, Republic of 1.84 4.15
New Zealand 1.68 4.10 Hong Kong, China 1.55 3.50
Argentina 1.44 3.52 Taiwan, China 1.42 3.20
Canada 1.41 3.45 China 1.28 2.89
Hong Kong, China 0.95 2.31 Canada 1.11 2.50
Singapore 0.91 2.23 India 0.94 2.11
Indonesia 0.91 2.21 Singapore 0.87 1.95
Turkey 0.73 1.77 Mexico 0.81 1.82
Japan 0.60 1.47 Algeria 0.71 1.59
Philippines 0.56 1.37 Switzerland 0.63 1.41
Chile 0.54 1.31 Egypt, Arab Republic of 0.62 1.39
Total of above 35.15 85.72 Total of above 35.01 78.86
Average semi processed exports (2000-04) Average semi processed imports (2000-04)
USD billion Share USD billion Share
EU15 13.40 16.77 EU15 17.70 20.72
of which: of which:
Germanya 3.13 3.97 Italy 3.19 3.73
Netherlands 2.14 2.71 Germanya 2.97 3.48
France 1.63 2.07 Netherlands 2.51 2.93
Denmark 1.02 1.29 France 2.39 2.80
Italy 1.42 1.80 United Kingdom 2.14 2.50
United Kingdom 0.97 1.22 Spain 1.62 1.89
Belgium 0.92 1.16 United States 9.01 10.55
United States 13.01 16.49 China 6.44 7.54
Malaysia 5.86 7.43 Japan 5.92 6.93
Argentina 5.76 7.30 India 3.13 3.67
Brazil 4.07 5.15 Korea, Republic of 2.66 3.12
Australia 3.98 5.05 Canada 2.59 3.03
Canada 3.95 5.01 Mexico 2.34 2.73
China 3.43 4.34 Hong Kong, China 2.23 2.61
Indonesia 3.30 4.18 Chinese Taipei 1.61 1.88
India 1.60 0.02 Poland 1.44 1.68
New Zealand 1.55 0.02 Turkey 1.38 1.62
Hong Kong, China 1.26 0.02 Thailand 1.24 1.45
Japan 0.97 0.01 Russian Federation 1.21 1.42
Peru 0.95 0.01 Indonesia 1.15 1.35
Total of above 63.10 74.20 Total of above 60.05 91.02
a) Excludes data for the German Democratic Republic.
OECD-FAO AGRICULTURAL OUTLOOK 2007-2016 – © OECD/FAO 200776
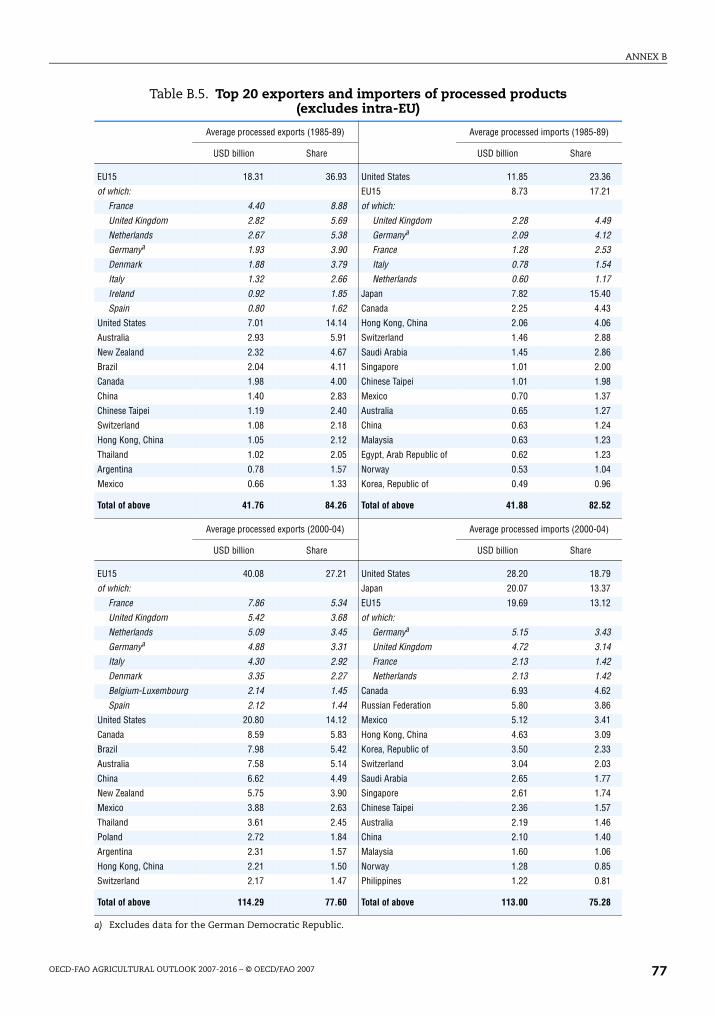
ANNEX B
Table B.5. Top 20 exporters and importers of processed products (excludes intra-EU)
Average processed exports (1985-89) Average processed imports (1985-89)
USD billion Share USD billion Share
EU15 18.31 36.93 United States 11.85 23.36
of which: EU15 8.73 17.21
France 4.40 8.88 of which:
United Kingdom 2.82 5.69 United Kingdom 2.28 4.49
Netherlands 2.67 5.38 Germanya 2.09 4.12
Germanya 1.93 3.90 France 1.28 2.53
Denmark 1.88 3.79 Italy 0.78 1.54
Italy 1.32 2.66 Netherlands 0.60 1.17
Ireland 0.92 1.85 Japan 7.82 15.40
Spain 0.80 1.62 Canada 2.25 4.43
United States 7.01 14.14 Hong Kong, China 2.06 4.06
Australia 2.93 5.91 Switzerland 1.46 2.88
New Zealand 2.32 4.67 Saudi Arabia 1.45 2.86
Brazil 2.04 4.11 Singapore 1.01 2.00
Canada 1.98 4.00 Chinese Taipei 1.01 1.98
China 1.40 2.83 Mexico 0.70 1.37
Chinese Taipei 1.19 2.40 Australia 0.65 1.27
Switzerland 1.08 2.18 China 0.63 1.24
Hong Kong, China 1.05 2.12 Malaysia 0.63 1.23
Thailand 1.02 2.05 Egypt, Arab Republic of 0.62 1.23
Argentina 0.78 1.57 Norway 0.53 1.04
Mexico 0.66 1.33 Korea, Republic of 0.49 0.96
Total of above 41.76 84.26 Total of above 41.88 82.52
Average processed exports (2000-04) Average processed imports (2000-04)
USD billion Share USD billion Share
EU15 40.08 27.21 United States 28.20 18.79
of which: Japan 20.07 13.37
France 7.86 5.34 EU15 19.69 13.12
United Kingdom 5.42 3.68 of which:
Netherlands 5.09 3.45 Germanya 5.15 3.43
Germanya 4.88 3.31 United Kingdom 4.72 3.14
Italy 4.30 2.92 France 2.13 1.42
Denmark 3.35 2.27 Netherlands 2.13 1.42
Belgium-Luxembourg 2.14 1.45 Canada 6.93 4.62
Spain 2.12 1.44 Russian Federation 5.80 3.86
United States 20.80 14.12 Mexico 5.12 3.41
Canada 8.59 5.83 Hong Kong, China 4.63 3.09
Brazil 7.98 5.42 Korea, Republic of 3.50 2.33
Australia 7.58 5.14 Switzerland 3.04 2.03
China 6.62 4.49 Saudi Arabia 2.65 1.77
New Zealand 5.75 3.90 Singapore 2.61 1.74
Mexico 3.88 2.63 Chinese Taipei 2.36 1.57
Thailand 3.61 2.45 Australia 2.19 1.46
Poland 2.72 1.84 China 2.10 1.40
Argentina 2.31 1.57 Malaysia 1.60 1.06
Hong Kong, China 2.21 1.50 Norway 1.28 0.85
Switzerland 2.17 1.47 Philippines 1.22 0.81
Total of above 114.29 77.60 Total of above 113.00 75.28
a) Excludes data for the German Democratic Republic.
OECD-FAO AGRICULTURAL OUTLOOK 2007-2016 – © OECD/FAO 2007 77

ANNEX C
ANNEX C
Glossary of Terms
AMADAgricultural Market Access database. A co-operative effort between Agriculture and
Agri-food Canada, EU Commission-Agriculture Directorate-General, FAO, OECD, The World
Bank, UNCTAD and the United States Department of Agriculture, Economic Research
Service. Data in the database is obtained from countries’ schedules and notifications
submitted to the WTO.
Avian influenzaAvian influenza is an infectious disease of birds caused by type A strains of the
influenza virus. The disease, which was first identified in Italy more than 100 years ago,
occurs worldwide. The quarantining of infected farms, destruction of infected or
potentially exposed flocks, and recently inoculation are standard control measures.
Atlantic beef/pigmeat marketBeef/pigmeat trade between countries in the Atlantic Rim.
BaselineThe set of market projections used for the outlook analysis in this report and as a
benchmark for the analysis of the impact of different economic and policy scenarios. A
detailed description of the generation of the baseline is provided in the chapter on
Methodology in this report.
BiofuelsIn the wider sense defined as all solid, fluid or gaseous fuels produced from biomass.
More narrowly, the term biofuels comprises those that replace petroleum-based road-
transport fuels, i.e. bio-ethanol produced from sugar crops, cereals and other starchy crops
that can be used as an additive to, in a blend with or as a replacement of gasoline, and
bio-diesel produced mostly from vegetable oils, but also from waste oils and animal fats,
that can be used in blends with or as a replacement of petroleum-based diesel.
BiomassBiomass is defined as any plant matter used directly as fuel or converted into other
forms before combustion. Included are wood, vegetal waste (including wood waste and
OECD-FAO AGRICULTURAL OUTLOOK 2007-2016 – © OECD/FAO 200778

ANNEX C
crops used for energy production), animal materials/wastes and industrial and urban
wastes, used as feedstocks for producing bioproducts.
Bovine Spongiform Encephalopathy (BSE)A fatal disease of the central nervous system of cattle, first identified in the United
Kingdom in 1986. On 20 March 1996 the UK Spongiform Encephalopathy Advisory
Committee (SEAC) announced the discovery of a new variant of Creutzfeldt-Jacob Disease
(vCJD), a fatal disease of the central nervous system in humans, which might be linked to
consumption of beef affected by exposure to BSE.
CerealsDefined as wheat, coarse grains and rice.
CAFTACAFTA is a comprehensive trade agreement between Costa Rica, the Dominican
Republic, El Salvador, Guatemala, Honduras, Nicaragua and the United States.
Common Agricultural Policy (CAP)The European Union’s agricultural policy, first defined in Article 39 of the Treaty of
Rome signed in 1957.
CAP reformThe EU Commission has published a Communication on the Mid-Term Review on the
Common Agricultural Policy in July 2002, in January 2003 the Commission adopted a formal
proposal. A formal decision on the “CAP reform – a long-term perspective for sustainable
agriculture” was taken by the EU farm ministers. The reform includes far-reaching
amendments of current policies, including further reductions in support prices, partly offset by
direct payments, and a further decoupling of most direct payments from current production.
Coarse grainsDefined as barley, maize, oats, sorghum and other coarse grains in all countries except
Australia, where it includes triticale and in the European Union where it includes rye and
other mixed grains.
Conservation Reserve Program (CRP)A major provision of the United States’ Food Security Act of 1985 and extended under
the Food and Agriculture Conservation and Trade Act of 1990, the Food and Agriculture
Improvement and Reform Act of 1996, and the Farm Security and Rural Investment Act
of 2002 is designed to reduce erosion on 40 to 45 million acres (16 to 18 million hectares) of
farm land. Under the programme, producers who sign contracts agree to convert erodable
crop land to approved conservation uses for ten years. Participating producers receive
annual rental payments and cash or payment in kind to share up to 50% of the cost of
establishing permanent vegetative cover. The CRP is part of the Environmental Conservation
Acreage Reserve Program. The 1996 FAIR Act authorised a 36.4 million acre (14.7 million
hectares) maximum under CRP, its 1995 level. The maximum area enrolled in the CRP was
increased to 39.2 million acres in the 2002 FSRI Act.
OECD-FAO AGRICULTURAL OUTLOOK 2007-2016 – © OECD/FAO 2007 79

ANNEX C
Commonwealth of Independent States (CIS)The heads of twelve sovereign states (except the Baltic states) have signed the Treaty
on establishment of the Economic Union, in which they stressed that the Republic of
Azerbaijan, Republic of Armenia, Republic of Belarus, Republic of Georgia, Republic of
Kazakhstan, Kyrgyz Republic, Republic of Moldova, Russian Federation, Republic of
Tajikistan, Turkmenistan, Republic of Uzbekistan and Ukraine on equality basis
established the Commonwealth of Independent States.
Common Market Organisation (CMO) for sugarThe common organisation of the sugar market (CMO) in the European Union was
established in 1968 to ensure a fair income to community sugar producers and self-supply
of the Community market. At present the CMO is governed by Council Regulation (EC)
No. 318/2006 (the basic regulation) which establishes a restructuring fund financed by
sugar producers to assist the restructuring process needed to render the industry more
competitive.
Crop year, coarse grainsRefers to the crop marketing year beginning 1 April for Japan, 1 July for the European
Union and New Zealand, 1 August for Canada and 1 October for Australia. The US crop year
begins 1 June for barley and oats and 1 September for maize and sorghum.
Crop year, oilseedsRefers to the crop marketing year beginning 1 April for Japan, 1 July for the European
Union and New Zealand, 1 August for Canada and 1 October for Australia. The US crop year
begins 1 June for rapeseed, 1 September for soyabeans and for sunflower seed.
Crop year, riceRefers to the crop marketing year beginning 1 April for Japan, Australia, 1 August for
the United States, 1 September for the European Union, 1 October for Mexico, 1 November
for Korea and 1 January for other countries.
Crop year, sugarA common crop marketing year beginning 1 September and extending to 31 August,
used by FO Licht, the primary data source for sugar supply and demand balances for the
OECD’s World Sugar Model.
Crop year, wheatRefers to the crop marketing year beginning 1 April for Japan, 1 June for the
United States, 1 July for the European Union and New Zealand, 1 August for Canada and
1 October for Australia.
Decoupled paymentsBudgetary payments paid to eligible recipients who are not linked to current production
of specific commodities or livestock numbers or the use of specific factors of production.
OECD-FAO AGRICULTURAL OUTLOOK 2007-2016 – © OECD/FAO 200780

ANNEX C
Direct paymentsPayments made directly by governments to producers.
Doha Development AgendaThe current round of multilateral trade negotiations in the World Trade Organisation
that were initiated in November 2001, in Doha, Qatar.
Domestic supportRefers to the annual level of support, expressed in monetary terms, provided to
agricultural production. It is one of the three pillars of the Uruguay Round Agreement on
Agriculture targeted for reduction.
Economic Partnership Agreements (EPAs)Trade negotiations currently being negotiated between the EU and the African,
Caribbean Pacific (ACP) group of developing countries. The outcome of the negotiations will
be a series of new Free Trade Agreements (FTA) replacing the Lomé system of preferential
access to the European market for the ACP countries from 2008.
EthanolA biofuel that can be used as a fuel substitute (hydrous ethanol) or a fuel extender
(anhydrous ethanol) in mixes with petroleum, and which is produced from agricultural
feed-stocks such as sugar cane and maize.
Everything But Arms (EBA)The Everything But Arms (EBA) Initiative eliminates EU import tariffs for numerous
goods, including agricultural products, from the least developed countries. The tariff
elimination is scheduled in four steps from 2006/07 to 2009/10.
Export credits (with official support)Government financial support, direct financing, guarantees, insurance or interest rate
support provided to foreign buyers to assist in the financing of the purchase of goods from
national exporters.
Export restitutions (refunds)EU export subsidies provided to cover the difference between internal prices and world
market prices for particular commodities.
Export subsidiesSubsidies given to traders to cover the difference between internal market prices and
world market prices, such as for example the EU export restitutions. Export subsidies are now
subject to value and volume restrictions under the Uruguay Round Agreement on Agriculture.
Foot and Mouth Disease (FMD)Foot and mouth disease is a highly contagious disease, which chiefly affects
cloven-hoofed animal species (cattle, sheep, goats and pigs). Its symptoms are the
appearance of vesicles (aphthae) on the animals’ mouths (with a consequent reduction in
OECD-FAO AGRICULTURAL OUTLOOK 2007-2016 – © OECD/FAO 2007 81

ANNEX C
appetite) and feet. It is caused by a virus which may be found in the animals’ blood, saliva
and milk. The virus is transmitted in a number of ways, via humans, insects, most meat
products, urine and faeces, feed, water or soil. Although the mortality rate in adult animals
from this disease is generally low and the disease presents no risk for humans, because it
is highly contagious, infected animals in a given country are generally put down and other
countries place an embargo on imports of live animals and fresh, chilled or frozen meat
from the country of infection; in that case, only smoked, salted or dried meat and meat
preserves may be imported from the country concerned. In addition, given the possibility
of contagion between different species of cloven-hoofed animals, when foot and mouth
disease breaks out in one species in a given country, exports of meat from all four types of
animal are suspended
G10Members of the G10 are: Bulgaria, Chinese Taipei, Iceland, Israel, Japan, Korea
Republic, Liechtenstein, Mauritius, Norway and Switzerland.
G20Members of the G20 are: Argentina, Bolivia, Brazil, Chile, China, Cuba, Egypt (Arab
Republic of), Guatemala, India, Indonesia, Mexico, Nigeria, Pakistan, Paraguay, Philippines,
South Africa, Tanzania, Thailand, Uruguay, Venezuela RB and Zimbabwe.
FSRI Act, 2002Officially known as the Farm Security and Rural Investment Act of 2002. This US farm
legislation replaces the FAIR Act of 1996, covering a wide range of commodity programmes
and policies for US agriculture for the period 2002-07.
Gur, khandasariSemi-processed sugars (plantation whites) extracted from sugarcane in India.
Industrial oilseedsA category of oilseed production in the European Union for industrial use (i.e. biofuels).
Intervention purchasesPurchases by the EC Commission of certain commodities to support internal market
prices.
Intervention purchase pricePrice at which the European Commission will purchase produce to support internal
market prices. It usually is below 100% of the intervention price, which is an annually
decided policy price.
Intervention stocksStocks held by national intervention agencies in the European Union as a result of
intervention buying of commodities subject to market price support. Intervention stocks
may be released onto the internal markets if internal prices exceed intervention prices;
otherwise, they may be sold on the world market with the aid of export restitutions.
OECD-FAO AGRICULTURAL OUTLOOK 2007-2016 – © OECD/FAO 200782

ANNEX C
InulinInulin syrups are extracted from chicory through a process commercially developed in
the 1980s. They usually contain 83 per cent fructose. Inulin syrup production in the
European Union is covered by the sugar regime and subject to a production quota.
IsoglucoseIsoglucose is a starch-based fructose sweetener, produced by the action of glucose
isomerase enzyme on dextrose. This isomerisation process can be used to produce
glucose/fructose blends containing up to 42% fructose. Application of a further process can
raise the fructose content to 55%. Where the fructose content is 42%, isoglucose is
equivalent in sweetness to sugar. Isoglucose production in the European Union is covered
by the sugar regime and subject to a production quota.
Least squares growth rateThe least-squares growth rate, r, is estimated by fitting a linear regression trend line
to the logarithmic annual values of the variable in the relevant period, as follows:
Ln(xt) = a + r * t.
Loan deficiency payments (United States)Loan deficiency payments are a type of support whereby, for wheat, feed grain, upland
cotton, rice and oilseeds, a producer may agree to forgo loan eligibility and receive an
output subsidy, the rate of payment of which is the amount by which the applicable
county’s loan rate exceeds the marketing loan repayment rate. Producers may elect to
apply for this payment during the loan availability period on a quantity of the programme
crop not exceeding their loan-eligible production. This, combined with marketing loan
gains, represent the benefits made available to US farmers when commodity prices fall
relative to loan rates.
Loan rateThe commodity price at which the Commodity Credit Corporation (CCC) offers non-
recourse loans to participating farmers. The crops covered by the programme are used as
collateral for these loans. The loan rate serves as a floor price, with the effective level lying
somewhat above the announced rate, for participating farmers in the sense that they can
default on their loan and forfeit their crop to the CCC rather than sell it in the open market
at a lower price.
Luxembourg agreementA formal decision on further “CAP reform – a long-term perspective for sustainable
agriculture” was taken by the EU Council of farm ministers meeting in Luxembourg on
26 June 2003. The reform includes far-reaching amendments of current policies, including
further reductions in support prices, partly offset by direct payments and a further
decoupling of most direct payments, such as the new single farm payment from current
production. The different elements of the reform will enter into force in 2004 and 2005. A
single farm payment will enter into force in 2005. If a member state needs a transitional
period due to its specific agricultural conditions, it may apply the single farm payment
from 2007 at the latest.
OECD-FAO AGRICULTURAL OUTLOOK 2007-2016 – © OECD/FAO 2007 83

ANNEX C
Market accessGoverned by provisions of the Uruguay Round Agreement on Agriculture which refer to
concessions contained in the country schedules with respect to bindings and reductions of
tariffs and to other minimum import commitments.
Marketing allotments (US sugar programme)Marketing allotments designate how much sugar can be sold by sugar millers and
processors on the US internal market and were established by the 2002 FSRI Act as a way
to guarantee the US sugar loan programme operates at no cost to the Federal Government.
Marketing Assistance Loan ProgrammeUS loan programme, in operation since 1986 and designed to provide producers of
certain crops with financial assistance when prices are low while avoiding a disadvantage
of the traditional loan programme (see loan rate), i.e. the accumulation of government
stocks that depress prices when disposed of. The programme effectively guarantees
farmers a minimum price. Farmers can obtain payments in two ways. They can sell the
crop and repay the loan at the posted county price (a USDA estimate of the local market
price) and keep the difference known as “marketing gain”. They can also obtain a payment
without taking out a loan – see loan deficiency payments.
Marketing year, oilseed mealRefers to the marketing year beginning 1 October.
Marketing year, oilseed oilRefers to the marketing year beginning 1 October.
MERCOSURA multilateral agreement on trade, including agricultural trade between Argentina,
Brazil, Paraguay and Uruguay. The agreement was signed in 1991 and came into effect on
1 January 1995. Its main goal is to create a customs union between the four countries
by 2006.
Market Price Support (MPS) PaymentIndicator of the annual monetary value of gross transfers from consumers and
taxpayers to agricultural producers arising from policy measures creating a gap between
domestic market prices and border prices of a specific agricultural commodity, measured at
the farm gate level. Conditional on the production of a specific commodity, MPS includes
the transfer to producers associated with both production for domestic use and exports,
and is measured by the price gap applied to current production. The MPS is net of financial
contributions from individual producers through producer levies on sales of the specific
commodity or penalties for not respecting regulations such as production quotas (Price
levies), and in the case of livestock production is net of the market price support on
domestically produced coarse grains and oilseeds used as animal feed (Excess feed cost).
OECD-FAO AGRICULTURAL OUTLOOK 2007-2016 – © OECD/FAO 200784

ANNEX C
Methyl Tertiary Butyl Ether (MTBE)A chemical gasoline additive that can be used to boost the octane number and oxygen
content of the fuel, but can render contaminated water undrinkable.
Mid-Term ReviewSee Luxembourg agreement on CAP reform.
Milk quota schemeA supply control measure to limit the volume of milk produced or supplied. Quantities
up to a specified quota amount benefit from full market price support. Over-quota volumes
may be penalised by a levy (as in the European Union, where the “super levy” is 115% of the
target price) or may receive a lower price. Allocations are usually fixed at individual
producer level. Other features, including arrangements for quota reallocation, differ
according to scheme.
ModulationA partial transfer of support from the first (support to agriculture) to the second pillar
(support to other rural activities) of the EU Common Agricultural Policy (CAP). With the
latest reform of the CAP, modulation was made compulsory, resulting in a gradual
reduction of payments directly to farmers with the aim of boosting rural development.
North American Free Trade Agreement (NAFTA)A trilateral agreement on trade, including agricultural trade, between Canada, Mexico
and the United States, phasing out tariffs and revising other trade rules between the three
countries over a 15-year period. The agreement was signed in December 1992 and came
into effect on 1 January 1994.
Oilseed mealDefined as rapeseed meal (canola), soyabean meal, and sunflower meal in all
countries, except in Japan where it excludes sunflower meal.
OilseedsDefined as rapeseed (canola), soyabeans, and sunflower seed in all countries, except in
Japan where it excludes sunflower seed.
Pacific beef/pigmeat marketBeef/pigmeat trade between countries in the Pacific Rim where foot and mouth
disease is not endemic.
PROCAMPOA programme of direct support to farmers in Mexico. It provides for direct payments
per hectare on a historical basis.
Producer Support Estimate (PSE)Indicator of the annual monetary value of gross transfers from consumers and
taxpayers to agricultural producers, measured at farm gate level, arising from policy
OECD-FAO AGRICULTURAL OUTLOOK 2007-2016 – © OECD/FAO 2007 85

ANNEX C
measure, regardless of their nature, objectives or impacts on farm production or income.
The PSE measure support arising from policies targeted to agriculture relative to a situation
without such policies, i.e. when producers are subject only to general policies (including
economic, social, environmental and tax policies) of the country. The PSE is a gross notion
implying that any costs associated with those policies and incurred by individual
producers are not deducted. It is also a nominal assistance notion meaning that increased
costs associated with import duties on inputs are not deducted. But it is an indicator net of
producer contributions to help finance the policy measure (e.g. producer levies) providing a
given transfer to producers. The PSE includes implicit and explicit payments. The
percentage PSE is the ration of the PSE to the value of total gross farm receipts, measured
by the value of total production (at farm gate prices), plus budgetary support. The
nomenclature and definitions of this indicator replaced the former Producer Subsidy
Equivalent in 1999.
Purchasing Power Parity (PPP)Purchasing power parities (PPPs) are the rates of currency conversion that eliminate
the differences in price levels between countries. The PPPs are given in national currency
units per US dollar.
Recourse loan programmeProgramme to be implemented under the US FAIR Act of 1996 for butter, non-fat dry
milk and cheese after 1999 in which loans must be repaid with interest to processors to
assist them in the management of dairy product inventories.
SaccharinA low calorie, artificial sweetener used as a substitute for sugar mainly in beverage
preparations.
ScenarioA model-generated set of market projections based on alternative assumptions than
those used in the baseline. Used to provide quantitative information on the impact of
changes in assumptions on the outlook.
Set-aside programmeEuropean Union programme for cereal, oilseed and protein crops that both requires
and allows producers to set-aside a portion of their historical base acreage from current
production. Mandatory set-aside rates for commercial producers are set at 10% until 2006.
Single Farm PaymentWith the 2003 CAP reform, the EU introduced a farm-based payment largely
independent of current production decisions and market developments, but based on the
level of former payments received by farmers. To facilitate land transfers, entitlements are
calculated by dividing the reference amount of payment by the number of eligible hectares
(incl. forage area) in the reference year. Farmers receiving the new SFP are obliged to keep
their land in good agricultural and environmental condition and have the flexibility to
produce any commodity on their land except fruits, vegetables and table potatoes.
OECD-FAO AGRICULTURAL OUTLOOK 2007-2016 – © OECD/FAO 200786

ANNEX C
SPS AgreementWTO Agreement on Sanitary and Phyto-sanitary measures, including standards used
to protect human, animal or plant life and health.
Support pricePrices fixed by government policy makers in order to determine, directly or indirectly,
domestic market or producer prices. All administered price schemes set a minimum
guaranteed support price or a target price for the commodity, which is maintained by
associated policy measures, such as quantitative restrictions on production and imports;
taxes, levies and tariffs on imports; export subsidies; and public stockholding.
Tariff-rate quota (TRQ)Resulted from the Uruguay Round Agreement on Agriculture. Certain countries agreed
to provide minimum import opportunities for products previously protected by non-tariff
barriers. This import system established a quota and a two-tier tariff regime for affected
commodities. Imports within the quota enter at a lower (in-quota) tariff rate while a higher
(out-of-quota) tariff rate is used for imports above the concessionary access level.
Uruguay Round Agreement on Agriculture (URAA)The terms of the URAA are contained in the section entitled the “Agreement on
Agriculture” of the Final Act Embodying the Results of the Uruguay Round of Multilateral
Trade Negotiations. This text contains commitments in the areas of market access, domestic
support, and export subsidies, and general provisions concerning monitoring and
continuation. In addition, each country’s schedule is an integral part of its contractual
commitment under the URAA. There is a separate agreement entitled the Agreement on
the Application of Sanitary and Phyto-sanitary Measures. This agreement seeks
establishing a multilateral framework of rules and disciplines to guide the adoption,
development and the enforcement of sanitary and phyto-sanitary measures in order to
minimise their negative effects on trade. See also Phyto-sanitary regulations and Sanitary
regulations.
Vegetable oilDefined as rapeseed oil (canola), soyabean oil, sunflower seed oil and palm oil, except
in Japan where it excludes sunflower seed oil.
Voluntary Quota Restructuring SchemeEstablished as part of the reform of the European Union’s Common Market Organisation
(CMO) for sugar in February 2006 to apply for four years from 1 July 2006. Under the scheme,
sugar producers receive a degressive payment for permanently surrendering sugar
production quota, in part or in entirety, over the period 2006-07 to 2009-10.
WTOWorld Trade Organisation created by the Uruguay Round agreement.
OECD-FAO AGRICULTURAL OUTLOOK 2007-2016 – © OECD/FAO 2007 87

OECD PUBLICATIONS, 2, rue André-Pascal, 75775 PARIS CEDEX 16
PRINTED IN FRANCE
(00 2007 1M 1 P) – No. 88353 2007


