Room Document No 1 (English only) OECD Global Insurance Statistics and results of a stocktaking of other existing international insurance statistics exercises A preliminary version of this stocktaking paper was presented at the first OECD-Asia regional seminar on enhancing transparency and monitoring of insurance markets, held on 23-24 September 2010 in Kuala Lumpur, Malaysia. It has been updated for the second OECD-Asia regional seminar being held on 26-27 January 2012 in Bangkok, Thailand. This paper will be circulated for discussion at the regional seminar and circulated more broadly for feedback and comments. Comments may be sent to Jean-Marc Salou ([email protected]), Project-Manager, OECD Global Insurance Statistics or Idris-Teoman Ozbiyik, OECD Consultant ([email protected])
Transcript
Room Document No 1
(English only)
OECD Global Insurance Statistics and results
of a stocktaking of other existing international insurance statistics exercises
A preliminary version of this stocktaking paper was presented at the first OECD-Asia regional seminar on enhancing
transparency and monitoring of insurance markets, held on 23-24 September 2010 in Kuala Lumpur, Malaysia.
It has been updated for the second OECD-Asia regional seminar being held on 26-27 January 2012 in Bangkok,
Thailand. This paper will be circulated for discussion at the regional seminar and circulated more broadly for
feedback and comments. Comments may be sent to Jean-Marc Salou ([email protected]), Project-Manager,
OECD Global Insurance Statistics or Idris-Teoman Ozbiyik, OECD Consultant ([email protected])
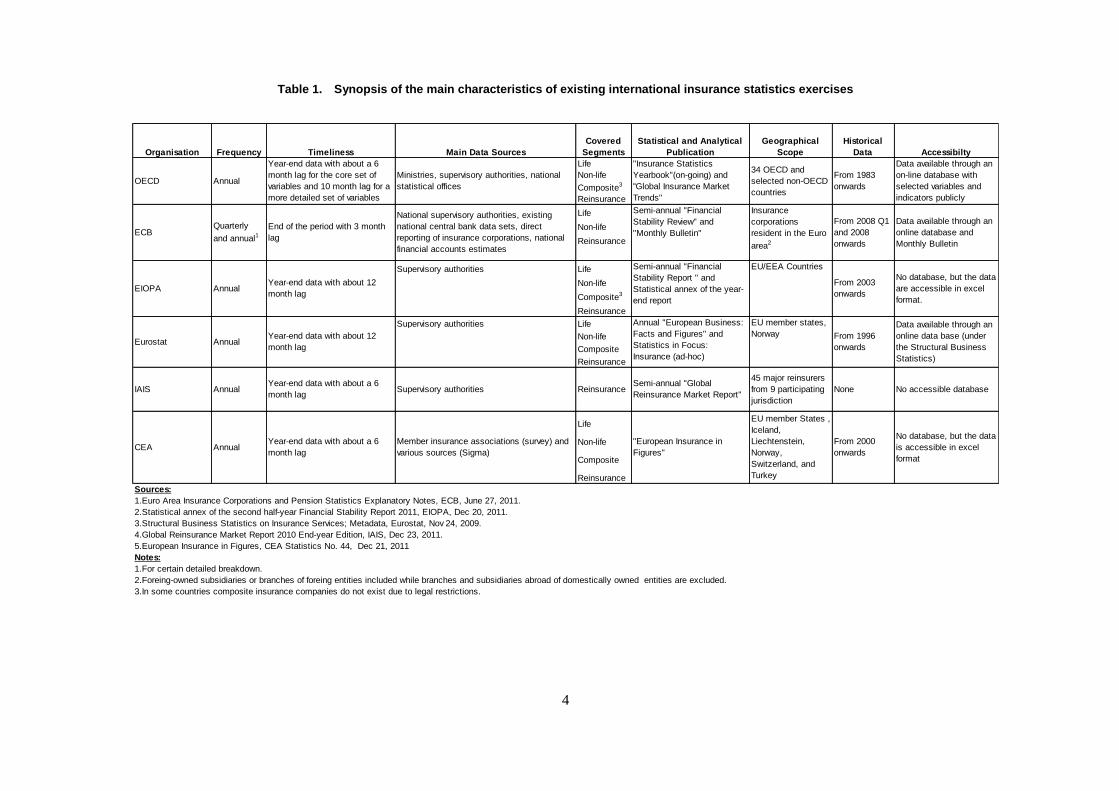
Table 1. Synopsis of the main characteristics of existing international insurance statistics exercises ...... 4
Table 2. Commonalities among existing insurance statistics exercises and selected elements
of specialisation ......................................................................................................................................... 5
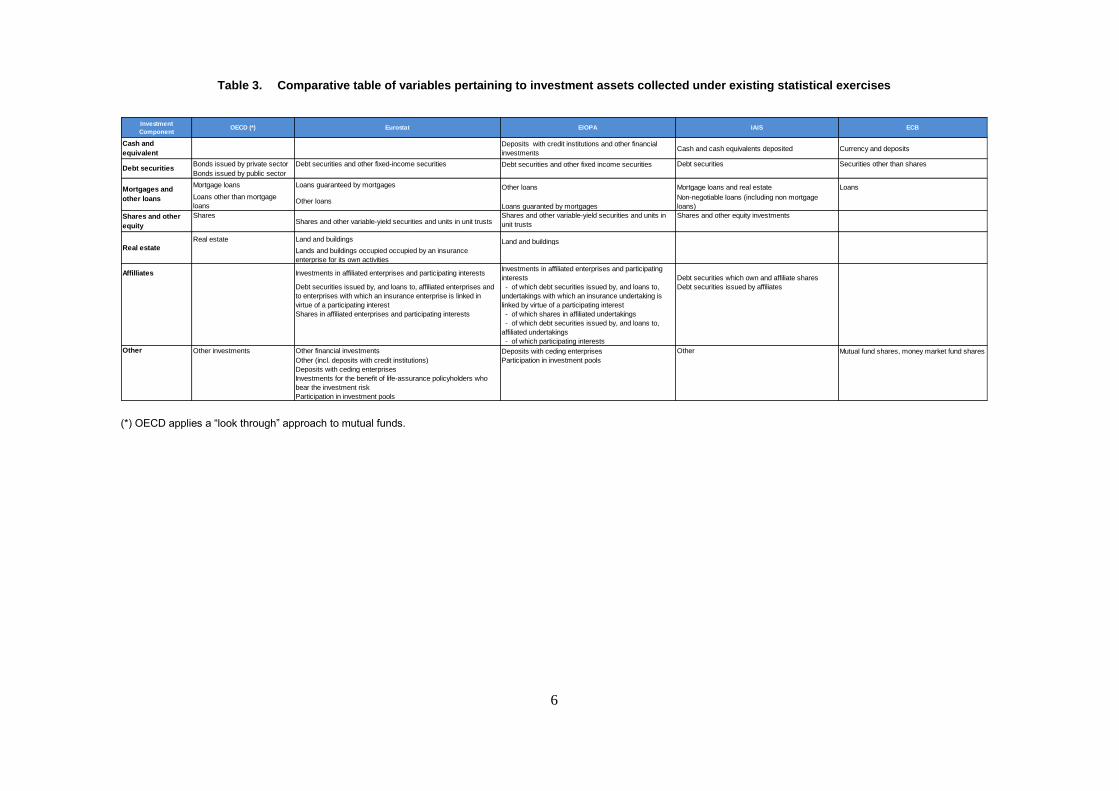
Table 3. Comparative table of variables pertaining to investment assets ....................................................
collected under existing statistical exercises ............................................................................................. 6
PART I. OECD GLOBAL INSURANCE STATISTICS EXERCISE ........................................................... 7
Tables 4 to 6. Synthesis of variables collected – OECD (Part 1 questionnaire) ....................................... 9
PART II. OTHER EXISTING INTERNATIONAL INSURANCE STATISTICS EXERCISES ................ 12
European Central Bank (ECB)…………………………………………………………………………....12
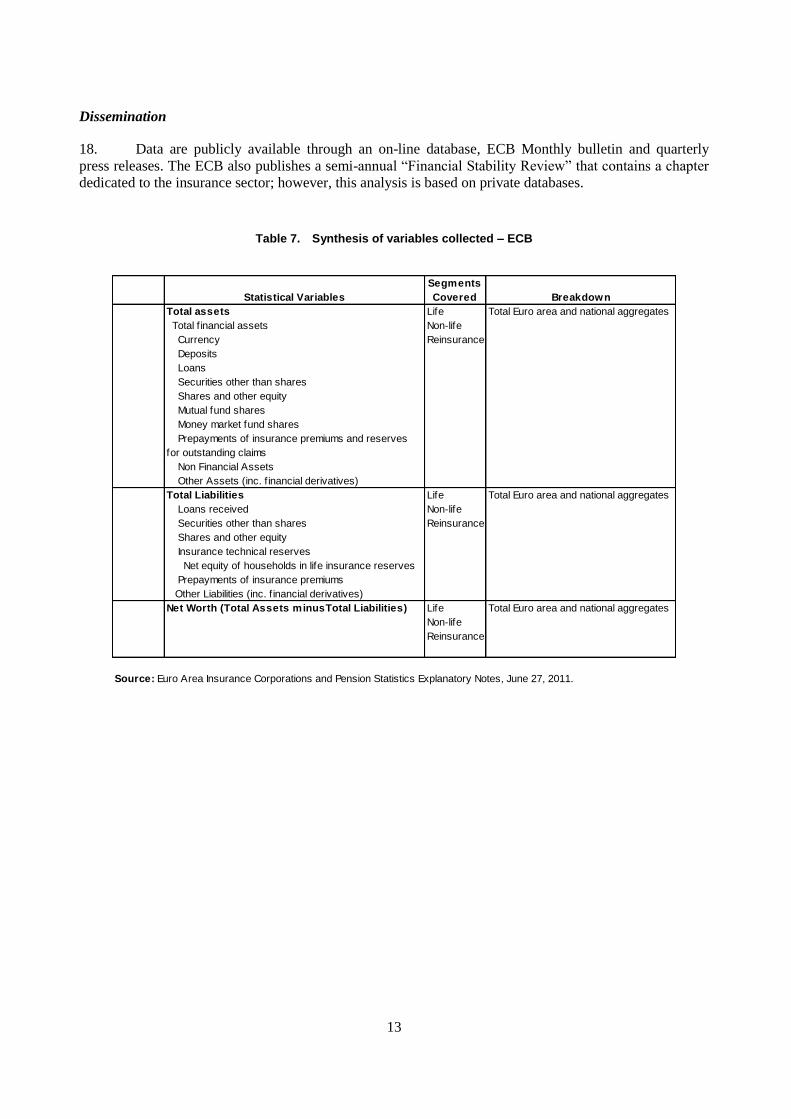
Table 7. Synthesis of variables collected .............................................................................................. 13
Eurostat: Insurance Statistics within Structural Business Statistics ........................................................... 14
Tables 8 to 11. Synthesis of variables collected ...................................................................................... 15
European Insurance and Occupational Pensions Authority (EIOPA) ........................................................ 19
Tables 12 and 13. Synthesis of variables collected ................................................................................. 20
International Association of Insurance Supervisors (IAIS) ........................................................................ 22
Tables 14 to 16. Synthesis of variables collected ..................................................................................... 23
PART III. OTHER RELATED EXERCISES ............................................................................................... 26
Other statistical initiatives for consideration ............................................................................................. 28
3
BACKGROUND
1. As key players in the management of risks in the economy and as one of the most prominent
types of institutional investors, insurers play a significant role in fulfilling the diverse needs of various
sectors of an economy and thus contribute to the economic development of a country as well as to the
deepening of its financial system. The ongoing financial crisis has underlined the importance of compiling
more timely and higher-frequency financial statistics to monitor the insurance sector, including more rapid
data collection and dissemination. The crisis has also revealed a lack of adequately comprehensive global
insurance statistics and indicators, notably relating to the financial position and soundness of the insurance
5.European Insurance in Figures, CEA Statistics No. 44, Dec 21, 2011
Notes:
1.For certain detailed breakdown.
2.Foreing-owned subsidiaries or branches of foreing entities included while branches and subsidiaries abroad of domestically owned entities are excluded.
3.In some countries composite insurance companies do not exist due to legal restrictions.
Data available through an
online data base (under
the Structural Business
Statistics)
From 1996
onwardsEurostat Annual
Year-end data with about 12
month lag
Annual "European Business:
Facts and Figures" and
Statistics in Focus:
Insurance (ad-hoc)
EU member states,
Norway
From 2003
onwards
No database, but the data
are accessible in excel
format.
EIOPA AnnualYear-end data with about 12
month lag
Semi-annual "Financial
Stability Report " and
Statistical annex of the year-
end report
EU/EEA Countries
From 2008 Q1
and 2008
onwards
34 OECD and
selected non-OECD
countries
From 1983
onwards
Data available through an
on-line database with
selected variables and
indicators publicly
available
OECD Annual
Year-end data with about a 6
month lag for the core set of
variables and 10 month lag for a
more detailed set of variables
Ministries, supervisory authorities, national
statistical offices
National supervisory authorities, existing
national central bank data sets, direct
reporting of insurance corporations, national
financial accounts estimates
IAIS AnnualYear-end data with about a 6
month lag Supervisory authorities Reinsurance
"Insurance Statistics
Yearbook"(on-going) and
''Global Insurance Market
Trends"
ECBEnd of the period with 3 month
lag
Quarterly
and annual1
Data available through an
online database and
Monthly Bulletin
Semi-annual "Financial
Stability Review" and
"Monthly Bulletin"
Insurance
corporations
resident in the Euro
area2
AnnualCEA"European Insurance in
Figures"
EU member States ,
Iceland,
Liechtenstein,
Norway,
Switzerland, and
Turkey
No accessible database
Member insurance associations (survey) and
various sources (Sigma)
Year-end data with about a 6
month lag
From 2000
onwards
No database, but the data
is accessible in excel
format
Semi-annual "Global
Reinsurance Market Report"
45 major reinsurers
from 9 participating
jurisdiction
None
5
Table 2. Commonalities among existing international insurance statistics exercises and selected elements of specialisation
OECD Eurostat EIOPA IAIS ECB
Scope Reinsurance only
Financial position
Assets and investment
Receivables
Intangibles
Technical reserves
Equity and capital
Income
Premiums
Fees
Investment income
Claims / losses / benefits incurred
Expenses
Tax
Capital structure
Cash flows
Selected indicators
Market share
Gross premiums / GDP
Gross premiums / population
Net written premiums / Total gross premiums
Reinsurance accepted / Total gross premiums
Loss ratio
Return on equity
Return on assets
Expense ratio
Combined ratio
Solvency ratio
Concentration
Selected elements of specialisation by
exercise (i.e. how each exercise distances
itself as regards other exercises)
- Business written by
localization of risk (i.e.
domestic vs. foreign);
- Business written in
the reporting country
on risks situated
outside the reporting
country;
- Business written on
annuity products and
pension contracts.
- Detailed data on the
number of
undertakings including
various breakdown
(e.g. by size class of
gross premiums
written, by size class
of gross technical
provisions);
- Data on the
geographical
breakdown of the
business written;
- Number of contracts
outstanding at the end
of the accounting year;
- Number of insured
vehicles at the end of
the accounting year;
- Number of claims
incurred during the
accounting year.
- Detailed data
pertaining to technical
provisions
- Gross written
premiums of the
largest 3, 5 and 10
companies, that
enable the calculation
of concentration
ratios.
- Counterparties
exposures (key
liabilities and paid up
capital) notably by
sector of counterparty;
- Investment data on
derivatives and on
participation in credit
default-swaps and
CDOs, both breakdown
according to their
notational and fair
value.
- Counterparty
breakdown is available
within the euro area
for loans and debt
securities. (available in
consolidation with
pension funds)
6
Table 3. Comparative table of variables pertaining to investment assets collected under existing statistical exercises
Investment
ComponentOECD (*) Eurostat EIOPA IAIS ECB
Cash and
equivalent
Deposits with credit institutions and other financial
investmentsCash and cash equivalents deposited Currency and deposits
Bonds issued by private sector Debt securities and other fixed-income securities Debt securities and other fixed income securities Debt securities Securities other than shares
Bonds issued by public sector
Mortgage loans Loans guaranteed by mortgages Other loans Mortgage loans and real estate Loans
Loans other than mortgage
loansOther loans
Loans guaranted by mortgages
Non-negotiable loans (including non mortgage
loans)
Shares and other
equity
SharesShares and other variable-yield securities and units in unit trusts
Shares and other variable-yield securities and units in
unit trusts
Shares and other equity investments
Real estate Land and buildings Land and buildings
Lands and buildings occupied occupied by an insurance
enterprise for its own activities
Affilliates Investments in affiliated enterprises and participating interestsInvestments in affiliated enterprises and participating
interests Debt securities which own and affiliate shares
Debt securities issued by, and loans to, affiliated enterprises and
to enterprises with which an insurance enterprise is linked in
virtue of a participating interest
- of which debt securities issued by, and loans to,
undertakings with which an insurance undertaking is
linked by virtue of a participating interest
Debt securities issued by affiliates
Shares in affiliated enterprises and participating interests - of which shares in affiliated undertakings
- of which debt securities issued by, and loans to,
affiliated undertakings
- of which participating interests
Other Other investments Other financial investments Deposits with ceding enterprises Other Mutual fund shares, money market fund shares
Other (incl. deposits with credit institutions) Participation in investment pools
Deposits with ceding enterprises
Investments for the benefit of life-assurance policyholders who
bear the investment risk
Participation in investment pools
Mortgages and
other loans
Debt securities
Real estate
(*) OECD applies a “look through” approach to mutual funds.
7
PART I. OECD GLOBAL INSURANCE STATISTICS EXERCISE
Main objectives and coverage
4. The 2008-2009 financial crisis reinforced the need for additional meaningful and timely variables
to be collected and revealed the need to obtain more comprehensive insurance statistics. With a view to
contributing to the development of macro-overview of the insurance market as part of its substantive work
and support for international efforts, the OECD Insurance and Private Pensions Committee decided to
expand the collection of current data using an augmented framework on an on-going basis. The new
framework is now undergoing an implementation phase.
5. The long-term goal of the OECD Global Insurance Statistics’ project is to further enhance the
monitoring of the insurance markets through the analysis of sound and reliable comparable international
official insurance statistical information. Ultimately, it should contribute to more efficient and transparent
insurance systems and promote the surveillance of insurance markets by industry and other stakeholders,
governments, and international organisations (including the OECD), and thereby promote economic
growth and enhance the quality of government decision-making. To fulfill this main long-term goal, the
objectives of the OECD’s Global Insurance Statistics (GIS) project are two-fold: (i) ensure the continued
relevance, quality and timeliness of global insurance statistics as a means to promote effective surveillance
and the development of insurance markets, (ii) augment the global reach of the statistical exercise by
expanding its geographical scope.
6. The augmented framework enables the provision of more detailed aggregated official data for
direct insurance and reinsurance sectors. Ultimately, it should allow the provision of more timely
indicators by the OECD (e.g., loss and combined ratio, return on equity, return on assets).
7. Data includes all insurance companies licensed or authorised in each country, including
professional reinsurers, whether or not these are controlled by the State, and excluding any statutory
system of social security. In 2009, balance sheet and income data were added to the OECD’s insurance
statistics’ framework. Efforts have been undertaken since the inception of this exercise to harmonise
definitions.
Source of data
8. Data are reported on an annual basis mostly by ministries, supervisory agencies or national
statistical offices. The historical datasets cover OECD countries. Under the revised framework of this
statistical activity, the OECD is seeking to enlarge the global reach of the GIS exercise by expanding its
geographical scope progressively. Accordingly, within this more global framework, the database now
covers selected Asian countries. Further efforts will be made to expand the global reach of the GIS.
Timeliness
9. Year-end data pertaining to the core set of variables (Part 1 of the GIS questionnaire) are released
with about a 6-month lag. Additional detailed year-end variables (Part 2) are released with about a 10-
month lag. Both Part 1 and Part 2 questionnaires are sent at the same time during the first quarter of the
following year. The deadline for Part 1 is approximately end of May, so as to permit the dissemination of
8
key statistical data and indicators in June. The deadline for Part 2 is approximately mid- to end of October,
so as to permit dissemination of preliminary statistical data in December.
List of statistical variables collected
10. The new insurance statistics framework contains two parts, each of them split in sections. Part 1
(sections 1.1 to 1.5) seeks advanced aggregate statistics, as well as qualitative information, and Part 2
(sections 2.1 to 2.15) requests more detailed statistics (for further details see Tables 4 to 6). The content of
each section can be described as follows:
Section 1.1 deals with business written in the reporting country and includes all business written,
whether in respect of domestic or foreign (world-wide) risks, and presents the data according to the
categories of insurers (“Domestic Enterprises”, “Foreign-controlled Undertakings” and “Branches and
agencies of foreign Undertakings”) while section 1.2 focuses on premiums of life insurance by type of
contracts (i.e. unit-linked, annuities, other life insurance contracts). The latter includes data on pension
insurance contracts, collected as a separate item.
Section 2.2 specifically deals with business written in the reporting country on risks situated
outside the reporting country (=foreign risks) while section 2.3 covers the breakdown of premiums
written between domestic and foreign risks on a net basis.
Section 2.4 covers business written abroad by branches, agencies and subsidiaries established
abroad of domestic undertakings and includes all business written outside a given country by these
entities (in both OECD and non-OECD countries) while the geographical breakdown of business
written by branches and agencies only (i.e. excluding subsidiaries) for life and non-life segment,
respectively, is given under sections 2.5 and 2.6. Breakdown of premiums written in terms of non-life
insurance segments are provided in section 2.7.
Sections 1.3 and 2.12 collect information pertaining to balance sheet and income statement variables
of direct insurers and reinsurers. These sections compile key aggregate statistics notably relating to total
assets, shareholder equity, technical provisions and net income.
Section 1.4 concerns investments by direct insurers, while section 2.13 covers investments by
reinsurers. Both sections cover the breakdown of investments according to the categories of insurance
enterprises (“Domestic Enterprises”, “Foreign-controlled Undertakings” and “Branches and agencies of
foreign Undertakings”). Data on the geographical destinations of investments by direct insurers (i.e. in
the reporting country vs. investments abroad) is also collected under section 2.8. Breakdown of
aggregated investments for all reinsurers according to their geographical destinations (i.e.
investments in the reporting country or investments abroad) are reported in section 2.14.
Section 2.1 deals with general information on the reporting country (e.g. number of undertakings and
employees).
Sections 2.9, 2.10 and 2.11 concern gross claims payments, gross operating expenses and
commissions, respectively.
Sections 1.5 and 2.10 seek comments on developments in the insurance sector, by segment, including
factors that might explain trends and/or variations.
Dissemination
11. Datasets of OECD Insurance Statistics can be retrieved online and in CD-ROM format, available
by subscription, although some selected variables and indicators are publicly available. The OECD now
9
publishes a monitoring report called Global Insurance Market Trends that analysis recent trends in
insurance markets based on the OECD’s GIS exercise, including the qualitative information obtained