Page 1
Please do not cite this paper
OECD Review of Innovation in Southeast Asia Country Profile of Innovation: Malaysia
This paper is part of a series of preliminary drafts for the OECD Review of Innovation in Southeast Asia
provided by the OECD Secretariat. It is provided for the purpose of discussion at the SEA-EU-NET
Chiang Mai Event (30 May – 1 June 2011) and for written comments by the relevant national authorities.
Comments – referring, if applicable, to the respective paragraph number(s) – should be provided by e-
mail as soon as possible but no later than 30 June 2011 to the contacts given below.
This draft prepared by the OECD Secretariat will be used in Part 2 of the report of the OECD Review of
Innovation in Southeast Asia which consists of Country Profiles. It draws upon a country background
note prepared by K. Thiruchelvam, V.G.R. Chandran, Ng Boon Kwee and Wong Chan Yuan. Full
acknowledgements will be provided in the published report.
Contacts:
[email protected] ; [email protected]
OECD Directorate for Science, Technology and Industry
Page 2
2
COUNTRY PROFILE OF INNOVATION: MALAYSIA
PRELIMINARY DRAFT
Summary
1. An industrial sector based on manufacture and export of the technology-based products of
multinational enterprises has fueled Malaysia’s growth into a middle-income country. Electronics,
particularly semiconductors, account for 40% of exports followed by automobiles and parts. Its fast-
growing services sector features tourism as well as Islamic banking and finance. Among Southeast Asian
countries, Malaysia’s economic competitiveness is generally ranked second after Singapore.
2. However, multinational enterprises in Malaysia confine themselves mostly to manufacture and
assembly activities rather than research and development (R&D). There is little technology transfer or
technical spillover from foreign to domestic firms who suffer from a continuing shortage of skilled labor.
Following the global economic crisis, the domestic economy has been marked by declining private
investment and stagnating productivity growth coupled with a lack of competition in sectors such as
services.
3. The 10th Malaysia Plan (2011-2015) and the New Economic Model (NEM) both stress human
capital development and improvements in innovation capacity. Substantial investments have been made in
telecommunications infrastructure such as the Multimedia Super Corridor (MSC). However, streamlining
of science and technology governance and public research is essential. There is a need to reform the
secondary and tertiary school system, and intensify research activities and outputs from universities and
public research institutes and their links to private companies to maximize commercialization
opportunities. Local content, R&D and technology transfer provisions for multinationals should be
strengthened as well as incentives for firm training. The positive implications for growth of the NEM
structural reform agenda are threatened by an increasing brain drain and the fiercely competitive regional
environment for trade and foreign investment.
SWOT Malaysia Strengths Weaknesses
Large presence of multinational enterprises in electronics and automotive sectors
Research capabilities in agricultural commodities
High competitiveness ranking
Relatively young population
Poor quality education and inadequate supply of skilled labor
Stagnant R&D and innovative capacity
Low absorptive capacity of SMEs
Few industry links to public research
Uncoordinated national S&T policy
Little entrepreneurship and venture capital
Opportunities Threats
High-technology exports
Islamic banking and finance center
Growing tourism industry
Sizeable Malaysian Diaspora
Competition from other Asian economies
Impacts of regional and global economic downturns
Increasing brain drain
Page 3
3
1. Macroeconomic performance and framework conditions for innovation
1.1. Performance and structure of the economy
4. Since independence in 1957, Malaysia has moved from an economy based on primary
commodities to one fuelled by manufacturing and services based on foreign investment. Malaysia
consistently achieved more than 7% annual growth in gross domestic product (GDP) along with low
inflation in the 1980s and the 1990s. However, following the Asian financial crisis of 1997, Malaysia lost
ground to many Southeast Asian economies as economic growth fell to 4.3%. Again in 2009, the global
financial crisis hit the country particularly hard with the reduction in GDP growth the steepest among
middle-income countries in the region. A fiscal stimulus is helping to put the economy back on track with
economic growth forecast at 5.3% in 2011 and 5.6% in 2012.
5. The 1970s witnessed aggressive efforts by the government to bring in foreign direct investment
(FDI) to spur the nation’s industrialization efforts. These included generous incentives, tax relief and
subsidized investment loans and succeeded in attracting a number of multinational enterprises (MNEs) to
locate in Malaysia. Based on foreign investment, the predominantly mining and agriculture-based
Malaysian economy began a transition towards a more diverse production profile including both heavy
manufacturing and services. However the 1997 Asian financial crisis caused significant outflows of both
foreign portfolio investment and foreign direct investment, which also dipped during the global recession
of 2008-2009.
6. Since the 1980s, the industrial sector has led Malaysia's growth. The government’s
industrialization programme targeted large-scale and capital-intensive projects including steel, machinery
and equipment, petrochemicals, cement, and automobile manufacturing. As a result, industry grew from
14% of GDP in 1970 to about 42% at present, while agriculture and mining which together had accounted
for 43% of GDP in 1970 dropped to 10-15% (Table 1.1). The remainder of GDP is contributed by the fast-
growing services sector, particularly trade, utilities and finance. Malaysia is the world's largest Islamic
banking and financial centre. Tourism has become Malaysia’s third largest source of foreign exchange
income, although it is threatened by pollution and deforestation resulting from the growing industrial
economy.
Table 1.1. Structural Change of Malaysia’s Economy, % of GDP, 2000-2010
Sector/Year 2000 2004 2008 2009 2010
Agriculture 8.33 7.97 7.32 7.45 7.08
Mining and Quarrying 10.23 9.73 7.69 7.50 7.02
Manufacturing 29.90 29.93 28.17 25.87 26.92
Construction 3.80 3.40 3.01 3.23 3.17
Electricity, Gas and Water 2.89 2.99 2.84 2.89 2.92
Wholesale and Retail Trade 10.86 10.71 12.63 12.95 13.06
Accommodation and Restaurant 2.17 2.17 2.33 2.42 2.38
Transport and Storage 3.77 3.56 3.74 3.68 3.68
Communication 3.00 3.51 3.75 4.03 4.09
Finance and Insurance 8.87 9.68 10.71 11.41 11.31
Real Estates and Business Services 4.26 4.19 5.09 5.28 5.31
Government Services 6.14 6.45 7.15 7.39 7.35
Other Services 5.80 5.71 5.56 5.89 5.72
Source: Thiruchelvam et al., (2011) calculation based on Monthly Statistical Bulletin, January 2011.
Page 4
4
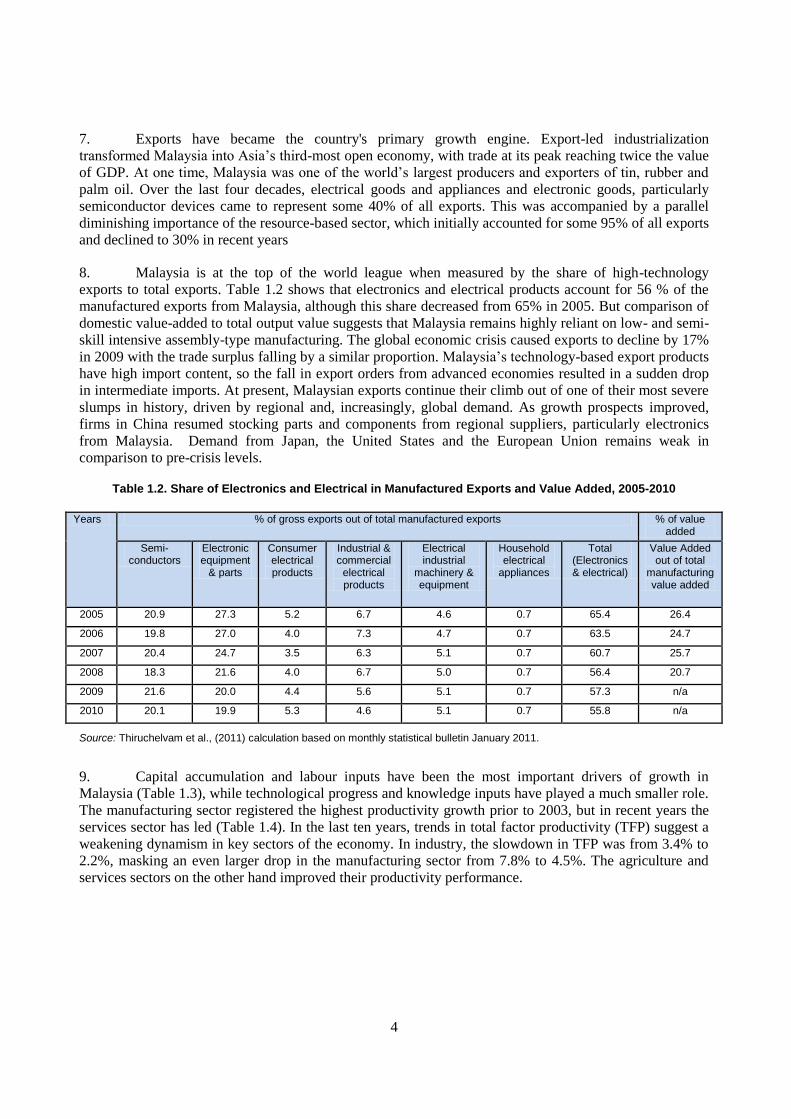
7. Exports have became the country's primary growth engine. Export-led industrialization
transformed Malaysia into Asia’s third-most open economy, with trade at its peak reaching twice the value
of GDP. At one time, Malaysia was one of the world’s largest producers and exporters of tin, rubber and
palm oil. Over the last four decades, electrical goods and appliances and electronic goods, particularly
semiconductor devices came to represent some 40% of all exports. This was accompanied by a parallel
diminishing importance of the resource-based sector, which initially accounted for some 95% of all exports
and declined to 30% in recent years
8. Malaysia is at the top of the world league when measured by the share of high-technology
exports to total exports. Table 1.2 shows that electronics and electrical products account for 56 % of the
manufactured exports from Malaysia, although this share decreased from 65% in 2005. But comparison of
domestic value-added to total output value suggests that Malaysia remains highly reliant on low- and semi-
skill intensive assembly-type manufacturing. The global economic crisis caused exports to decline by 17%
in 2009 with the trade surplus falling by a similar proportion. Malaysia’s technology-based export products
have high import content, so the fall in export orders from advanced economies resulted in a sudden drop
in intermediate imports. At present, Malaysian exports continue their climb out of one of their most severe
slumps in history, driven by regional and, increasingly, global demand. As growth prospects improved,
firms in China resumed stocking parts and components from regional suppliers, particularly electronics
from Malaysia. Demand from Japan, the United States and the European Union remains weak in
comparison to pre-crisis levels.
Table 1.2. Share of Electronics and Electrical in Manufactured Exports and Value Added, 2005-2010
Years % of gross exports out of total manufactured exports % of value added
Semi- conductors
Electronic equipment
& parts
Consumer electrical products
Industrial & commercial
electrical products
Electrical industrial
machinery & equipment
Household electrical
appliances
Total (Electronics & electrical)
Value Added out of total
manufacturing value added
2005 20.9 27.3 5.2 6.7 4.6 0.7 65.4 26.4
2006 19.8 27.0 4.0 7.3 4.7 0.7 63.5 24.7
2007 20.4 24.7 3.5 6.3 5.1 0.7 60.7 25.7
2008 18.3 21.6 4.0 6.7 5.0 0.7 56.4 20.7
2009 21.6 20.0 4.4 5.6 5.1 0.7 57.3 n/a
2010 20.1 19.9 5.3 4.6 5.1 0.7 55.8 n/a
Source: Thiruchelvam et al., (2011) calculation based on monthly statistical bulletin January 2011.
9. Capital accumulation and labour inputs have been the most important drivers of growth in
Malaysia (Table 1.3), while technological progress and knowledge inputs have played a much smaller role.
The manufacturing sector registered the highest productivity growth prior to 2003, but in recent years the
services sector has led (Table 1.4). In the last ten years, trends in total factor productivity (TFP) suggest a
weakening dynamism in key sectors of the economy. In industry, the slowdown in TFP was from 3.4% to
2.2%, masking an even larger drop in the manufacturing sector from 7.8% to 4.5%. The agriculture and
services sectors on the other hand improved their productivity performance.
Page 5
5
Table 1.3. Growths of Gross Domestic Product and Total Factor Productivity, 1999-2008
Period Growth (%)
Labour Capital TFP GDP
1999–2008 1.40 2.20 2.01 5.61
1999–2003 1.22 2.18 1.88 5.24
2004–2008 1.58 2.27 2.14 5.98
Source: MPC (2009).
Table 1.4. Growth of Total Factor Productivity by Sector, 1999-2008
Sector TFP Growth (%)
1999–2008 1999–2003 2004–2008
Agriculture 1.01 1.03 1.26
Mining 1.26 1.48 0.41
Manufacturing 2.26 3.09 1.41
Utilities 1.63 1.13 2.13
Transport 1.36 1.27 1.44
Trade 2.12 0.40 3.82
Finance 1.87 1.72 2.02
Others 1.02 3.08 0.71
Source: MPC (2009).
10. Rapid economic growth in Malaysia has led to large per capita income increases, resulting in a
reduction of aggregate poverty from 10% in 1995 to 3.8% in 2008. But Malaysia has experienced a rise in
inequality over the same period. Income distribution and the incidence of poverty vary within Malaysia,
resulting from regional and urban-rural disparities. Poverty is largely a rural problem with urban estimates
at 2% and rural poverty nearing 8%. The export-oriented industrialization process, equity ownership
restructuring, and the unevenness in access to education and training underlie the persistence of inequality
in the country.
11. In 2010, Malaysia joined Singapore, the United States and Sweden in the top 10 of 58 countries
on the IMD World Competitiveness Scoreboard. The advancement in the country’s rating from 19th in
2009 to 9th in 2010 was based largely on improvements in government efficiency and efforts to enhance the
business climate, fight corruption, and improve infrastructure. The same year Malaysia ranked 26th out of
139 countries on the Global Competitiveness Index of the World Economic Forum which was also an
improvement on previous scores. Among the Southeast Asian countries, Malaysia’s performance is
generally ranked second after Singapore in most indices.
Page 6
6
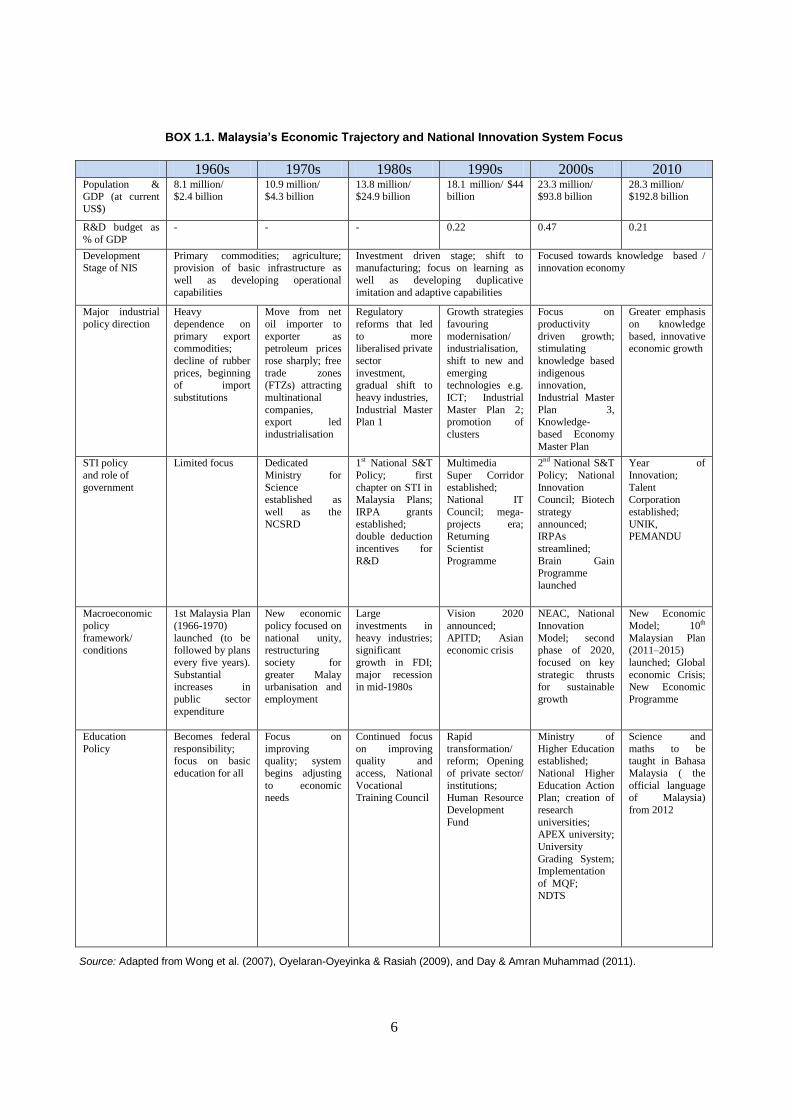
BOX 1.1. Malaysia’s Economic Trajectory and National Innovation System Focus
1960s 1970s 1980s 1990s 2000s 2010 Population & GDP (at current
US$)
8.1 million/ $2.4 billion
10.9 million/ $4.3 billion
13.8 million/ $24.9 billion
18.1 million/ $44 billion
23.3 million/ $93.8 billion
28.3 million/ $192.8 billion
R&D budget as
% of GDP
- - - 0.22 0.47 0.21
Development Stage of NIS
Primary commodities; agriculture; provision of basic infrastructure as
well as developing operational
capabilities
Investment driven stage; shift to manufacturing; focus on learning as
well as developing duplicative
imitation and adaptive capabilities
Focused towards knowledge based / innovation economy
Major industrial
policy direction
Heavy
dependence on
primary export commodities;
decline of rubber
prices, beginning of import
substitutions
Move from net
oil importer to
exporter as petroleum prices
rose sharply; free
trade zones (FTZs) attracting
multinational
companies, export led
industrialisation
Regulatory
reforms that led
to more liberalised private
sector
investment, gradual shift to
heavy industries,
Industrial Master Plan 1
Growth strategies
favouring
modernisation/ industrialisation,
shift to new and
emerging technologies e.g.
ICT; Industrial
Master Plan 2; promotion of
clusters
Focus on
productivity
driven growth; stimulating
knowledge based
indigenous innovation,
Industrial Master
Plan 3, Knowledge-
based Economy
Master Plan
Greater emphasis
on knowledge
based, innovative economic growth
STI policy
and role of
government
Limited focus
Dedicated
Ministry for
Science established as
well as the
NCSRD
1st National S&T
Policy; first
chapter on STI in Malaysia Plans;
IRPA grants
established; double deduction
incentives for
R&D
Multimedia
Super Corridor
established; National IT
Council; mega-
projects era; Returning
Scientist
Programme
2nd National S&T
Policy; National
Innovation Council; Biotech
strategy
announced; IRPAs
streamlined;
Brain Gain Programme
launched
Year of
Innovation;
Talent Corporation
established;
UNIK, PEMANDU
Macroeconomic
policy
framework/ conditions
1st Malaysia Plan
(1966-1970)
launched (to be followed by plans
every five years).
Substantial increases in
public sector
expenditure
New economic
policy focused on
national unity, restructuring
society for
greater Malay urbanisation and
employment
Large
investments in
heavy industries; significant
growth in FDI;
major recession in mid-1980s
Vision 2020
announced;
APITD; Asian economic crisis
NEAC, National
Innovation
Model; second phase of 2020,
focused on key
strategic thrusts for sustainable
growth
New Economic
Model; 10th
Malaysian Plan (2011–2015)
launched; Global
economic Crisis; New Economic
Programme
Education
Policy
Becomes federal
responsibility; focus on basic
education for all
Focus on
improving quality; system
begins adjusting
to economic needs
Continued focus
on improving quality and
access, National
Vocational Training Council
Rapid
transformation/ reform; Opening
of private sector/
institutions; Human Resource
Development
Fund
Ministry of
Higher Education established;
National Higher
Education Action Plan; creation of
research
universities; APEX university;
University
Grading System;
Implementation
of MQF;
NDTS
Science and
maths to be taught in Bahasa
Malaysia ( the
official language of Malaysia)
from 2012
Source: Adapted from Wong et al. (2007), Oyelaran-Oyeyinka & Rasiah (2009), and Day & Amran Muhammad (2011).
Page 7
7
1.2. Framework conditions for innovation
12. The state plays a significant but declining role in guiding economic activity in Malaysia through
macroeconomic five-year plans. The plans are largely aimed at accelerating the growth of the economy by
investing in selective sectors and improving their supporting infrastructure. The overall effectiveness of the
five-year plans is disputed as a large portion of the allocated funds remain undisbursed and industrial
competitiveness and innovation tend to still be confined to export-oriented subsidiaries of multinational
companies.
13. The current initiatives of the government are the New Economic Model (NEM) and the 10th
Malaysia Plan (2011-2015) which both emphasize, among other priorities, the importance of improving
innovation capability and human capital development as well as institutional efficiency. National income
per capita is targeted to grow at 6% per year propelled by the service and manufacturing sectors. During
the 10th Malaysia Plan, the government aims to increase the growth of private sector investment at a rate of
12.8% per year and reduce the fiscal deficit from 5.3% of GDP in 2010 to less than 3% in 2015.
14. Implementation of the productivity-enhancing structural reforms put forward in the New
Economic Model is crucial to future growth. These range from improving the skills of the labour force to
ensuring the inclusiveness and sustainability of the growth process. Other key features of the plan are an
emphasis on quality rather than just quantity in the accumulation of capital and labour inputs; private rather
than public endeavours in promoting more competition in the economy; bottom-up rather than top-down
decision-making in more decentralized and participative processes; unbalanced rather than balanced
regional growth with an emphasis on industrial clusters; selective and targeted incentives rather than
sector-based approaches; and making better use of foreign skilled labour.
15. The NEM has identified growth drivers in the electrical and electronics industry, information
technology (IT), nanotechnology, biotechnology and life sciences, palm oil-related downstream industries,
high-end commercial agriculture, the oil and gas industry, medical and bio-tourism services, green
technology industries and services, and integrated Islamic finance involving banking, capital markets and
insurance. Specific incentives are being used to attract more multinational enterprises (MNEs) to locate
their research and development (R&D) centres as well as advanced production and assembly operations in
Malaysia.
16. Malaysia has made large investments in infrastructure development including
telecommunications, transport, and power generation to meet the bottlenecks caused by rapid
industrialization. Some of the more visible projects include the Kuala Lumpur International Airport, the
Bakun hydroelectric dam, the national administrative city of Putrajaya, and the Multimedia Super Corridor
(MSC). The MSC was designed to catapult the Malaysian economy into the digital age. Roughly
equivalent in size to Singapore, this 20-year project was envisaged to attract large IT multinationals as well
as local businesses, act as a test bed for digital invention and research, and support a large share of
Malaysia’s local ICT workforce. There are plans for other development corridors such as the Sarawak
Corridor of Renewable Energy (SCORE). However, the corridors tend to act as tax havens for offshore
production and call centers rather than part of the integrated R&D efforts of large multinationals.
17. Due to government investments, Malaysia’s broadband infrastructure is more advanced than
many of its regional neighbours. Malaysia’s percentage of fixed broadband subscribers is around 5% which
is about the same level as in Vietnam and Thailand. Household penetration rates improved significantly
from 1% in 2004 to 32% in 2009, where access occurs mostly through fixed broadband. The Government
has also undertaken measures to stimulate demand for broadband through the MSC plus Internet
connections for government offices, schools, universities and healthcare facilities, and has considered
fiscal incentives for increasing access to computers.
Page 8
8
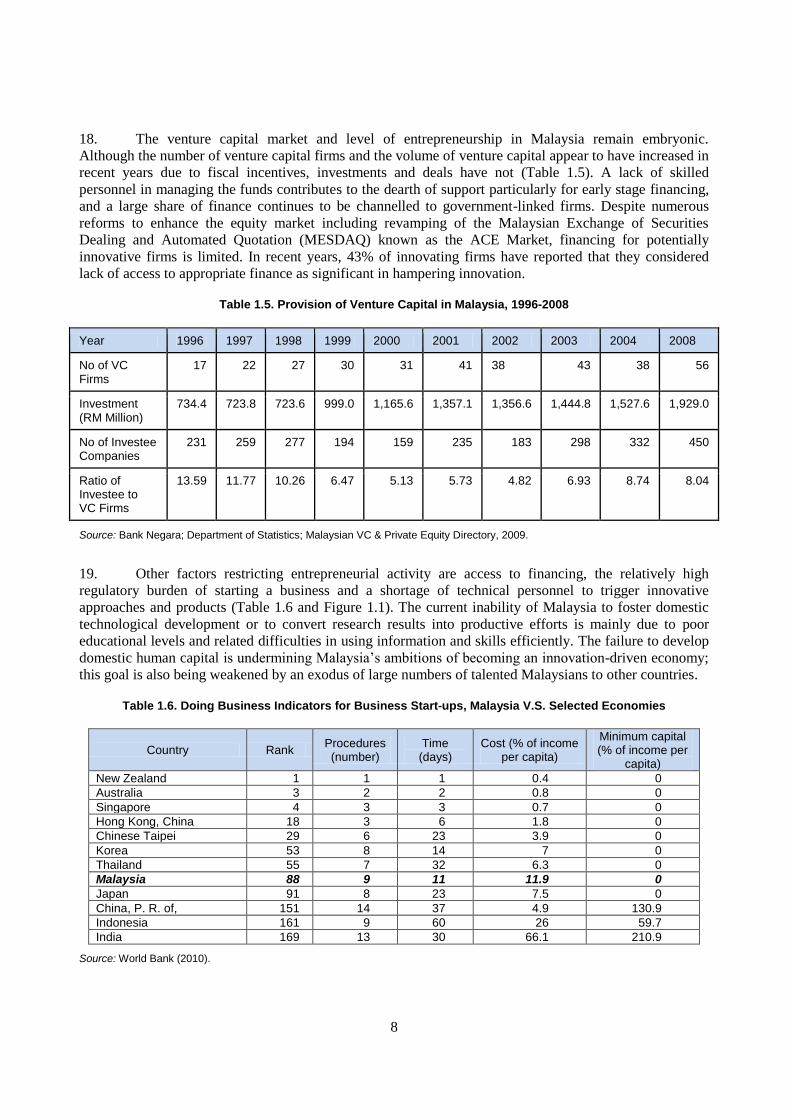
18. The venture capital market and level of entrepreneurship in Malaysia remain embryonic.
Although the number of venture capital firms and the volume of venture capital appear to have increased in
recent years due to fiscal incentives, investments and deals have not (Table 1.5). A lack of skilled
personnel in managing the funds contributes to the dearth of support particularly for early stage financing,
and a large share of finance continues to be channelled to government-linked firms. Despite numerous
reforms to enhance the equity market including revamping of the Malaysian Exchange of Securities
Dealing and Automated Quotation (MESDAQ) known as the ACE Market, financing for potentially
innovative firms is limited. In recent years, 43% of innovating firms have reported that they considered
lack of access to appropriate finance as significant in hampering innovation.
Table 1.5. Provision of Venture Capital in Malaysia, 1996-2008
Year 1996 1997 1998 1999 2000 2001 2002 2003 2004 2008
No of VC Firms
17 22 27 30 31 41 38 43 38 56
Investment (RM Million)
734.4 723.8 723.6 999.0 1,165.6 1,357.1 1,356.6 1,444.8 1,527.6 1,929.0
No of Investee Companies
231 259 277 194 159 235 183 298 332 450
Ratio of Investee to VC Firms
13.59 11.77 10.26 6.47 5.13 5.73 4.82 6.93 8.74 8.04
Source: Bank Negara; Department of Statistics; Malaysian VC & Private Equity Directory, 2009.
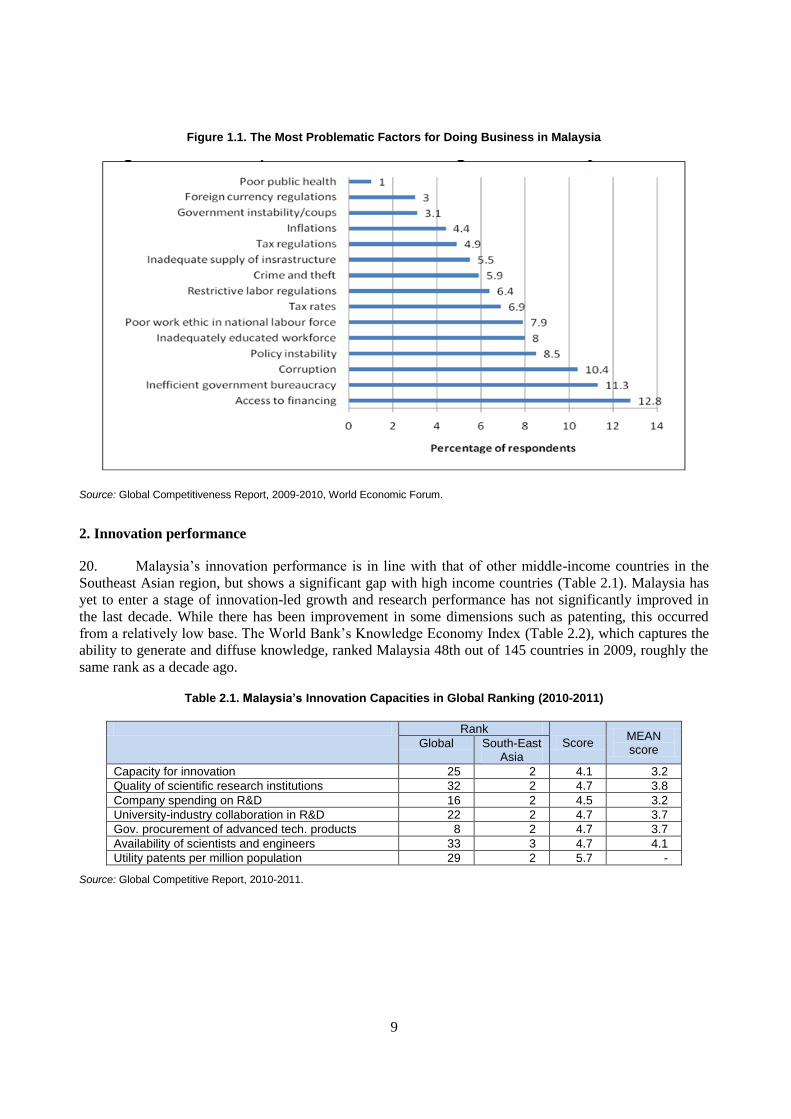
19. Other factors restricting entrepreneurial activity are access to financing, the relatively high
regulatory burden of starting a business and a shortage of technical personnel to trigger innovative
approaches and products (Table 1.6 and Figure 1.1). The current inability of Malaysia to foster domestic
technological development or to convert research results into productive efforts is mainly due to poor
educational levels and related difficulties in using information and skills efficiently. The failure to develop
domestic human capital is undermining Malaysia’s ambitions of becoming an innovation-driven economy;
this goal is also being weakened by an exodus of large numbers of talented Malaysians to other countries.
Table 1.6. Doing Business Indicators for Business Start-ups, Malaysia V.S. Selected Economies
Country Rank Procedures (number)
Time (days)
Cost (% of income per capita)
Minimum capital (% of income per
capita)
New Zealand 1 1 1 0.4 0
Australia 3 2 2 0.8 0
Singapore 4 3 3 0.7 0
Hong Kong, China 18 3 6 1.8 0
Chinese Taipei 29 6 23 3.9 0
Korea 53 8 14 7 0
Thailand 55 7 32 6.3 0
Malaysia 88 9 11 11.9 0
Japan 91 8 23 7.5 0
China, P. R. of, 151 14 37 4.9 130.9
Indonesia 161 9 60 26 59.7
India 169 13 30 66.1 210.9
Source: World Bank (2010).
Page 9
9
Figure 1.1. The Most Problematic Factors for Doing Business in Malaysia
Source: Global Competitiveness Report, 2009-2010, World Economic Forum.
2. Innovation performance
20. Malaysia’s innovation performance is in line with that of other middle-income countries in the
Southeast Asian region, but shows a significant gap with high income countries (Table 2.1). Malaysia has
yet to enter a stage of innovation-led growth and research performance has not significantly improved in
the last decade. While there has been improvement in some dimensions such as patenting, this occurred
from a relatively low base. The World Bank’s Knowledge Economy Index (Table 2.2), which captures the
ability to generate and diffuse knowledge, ranked Malaysia 48th out of 145 countries in 2009, roughly the
same rank as a decade ago.
Table 2.1. Malaysia’s Innovation Capacities in Global Ranking (2010-2011)
Rank
Score MEAN score
Global South-East Asia
Capacity for innovation 25 2 4.1 3.2
Quality of scientific research institutions 32 2 4.7 3.8
Company spending on R&D 16 2 4.5 3.2
University-industry collaboration in R&D 22 2 4.7 3.7
Gov. procurement of advanced tech. products 8 2 4.7 3.7
Availability of scientists and engineers 33 3 4.7 4.1
Utility patents per million population 29 2 5.7 -
Source: Global Competitive Report, 2010-2011.
Page 10
10
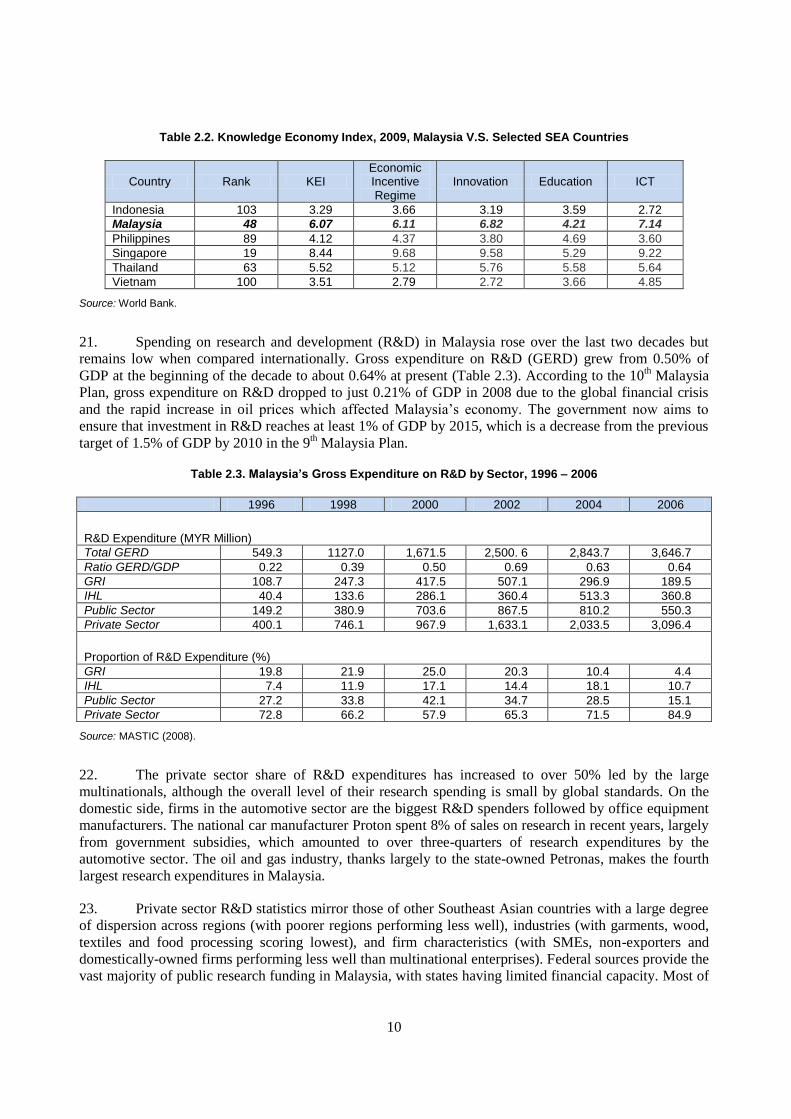
Table 2.2. Knowledge Economy Index, 2009, Malaysia V.S. Selected SEA Countries
Country Rank KEI Economic Incentive Regime
Innovation Education ICT
Indonesia 103 3.29 3.66 3.19 3.59 2.72
Malaysia 48 6.07 6.11 6.82 4.21 7.14
Philippines 89 4.12 4.37 3.80 4.69 3.60
Singapore 19 8.44 9.68 9.58 5.29 9.22
Thailand 63 5.52 5.12 5.76 5.58 5.64
Vietnam 100 3.51 2.79 2.72 3.66 4.85
Source: World Bank.
21. Spending on research and development (R&D) in Malaysia rose over the last two decades but
remains low when compared internationally. Gross expenditure on R&D (GERD) grew from 0.50% of
GDP at the beginning of the decade to about 0.64% at present (Table 2.3). According to the 10th Malaysia
Plan, gross expenditure on R&D dropped to just 0.21% of GDP in 2008 due to the global financial crisis
and the rapid increase in oil prices which affected Malaysia’s economy. The government now aims to
ensure that investment in R&D reaches at least 1% of GDP by 2015, which is a decrease from the previous
target of 1.5% of GDP by 2010 in the 9th Malaysia Plan.
Table 2.3. Malaysia’s Gross Expenditure on R&D by Sector, 1996 – 2006
1996 1998 2000 2002 2004 2006
R&D Expenditure (MYR Million)
Total GERD 549.3 1127.0 1,671.5 2,500. 6 2,843.7 3,646.7
Ratio GERD/GDP 0.22 0.39 0.50 0.69 0.63 0.64
GRI 108.7 247.3 417.5 507.1 296.9 189.5
IHL 40.4 133.6 286.1 360.4 513.3 360.8
Public Sector 149.2 380.9 703.6 867.5 810.2 550.3
Private Sector 400.1 746.1 967.9 1,633.1 2,033.5 3,096.4
Proportion of R&D Expenditure (%)
GRI 19.8 21.9 25.0 20.3 10.4 4.4
IHL 7.4 11.9 17.1 14.4 18.1 10.7
Public Sector 27.2 33.8 42.1 34.7 28.5 15.1
Private Sector 72.8 66.2 57.9 65.3 71.5 84.9
Source: MASTIC (2008).
22. The private sector share of R&D expenditures has increased to over 50% led by the large
multinationals, although the overall level of their research spending is small by global standards. On the
domestic side, firms in the automotive sector are the biggest R&D spenders followed by office equipment
manufacturers. The national car manufacturer Proton spent 8% of sales on research in recent years, largely
from government subsidies, which amounted to over three-quarters of research expenditures by the
automotive sector. The oil and gas industry, thanks largely to the state-owned Petronas, makes the fourth
largest research expenditures in Malaysia.
23. Private sector R&D statistics mirror those of other Southeast Asian countries with a large degree
of dispersion across regions (with poorer regions performing less well), industries (with garments, wood,
textiles and food processing scoring lowest), and firm characteristics (with SMEs, non-exporters and
domestically-owned firms performing less well than multinational enterprises). Federal sources provide the
vast majority of public research funding in Malaysia, with states having limited financial capacity. Most of
Page 11
11
the national R&D budget is expended in the four most developed states of the country indicating a skewed
distribution.
24. Small and medium-sized enterprises (SMEs) in Malaysia comprise 95% of firms and contribute
about 32% of GDP but conduct little research or innovative activity. In terms of total national R&D
expenditure, businesses with revenues under RM10 million account for only about 9% of research
expenditures. This is partly because 86% of SMEs are concentrated in the services sector rather than in
manufacturing or agriculture, but it also reflects inertia and the limited capabilities of smaller firms. Fewer
than 20% of Malaysian SMEs had access to the internet in 2007.
25. The evolution in the number of personnel engaged in R&D in Malaysia (Table 2.4) has mirrored
the developments in research spending. The number of researchers per 10,000 workers in the labour force
increased to below 20 in the last decade and decreased significantly in 2008. The Malaysia Higher
Education Plan (2007–2010) set an ambitious target of raising this to 100 researchers per 10,000 jobs in the
labour force by 2020, but it seems unlikely that this will be achieved at the current rate of progress. In
Malaysia unlike in most advanced scientific nations, the majority of R&D personnel work in universities
(45%) or public research organizations (17%) rather than the industrial sector (38%).
Table2.4. Researchers to Labour Force/Population Ratios, Headcount & Full Time Equivalence, 1994-2004
1996 1998 2000 2002 2004 2006
Total Population (Million) 21.17 22.18 23.27 24.53 25.62 26.90
Total Labour Force ( ' 000) 8,616.0 8,883.6 9,616.1 9,886.2 10,856.0 11,545.0
Researcher per 10,000 Labour Force
5.1 7.0 15.6 18.0 21.3 17.9
Researcher per 10,000 Population
2.0 2.8 6.4 7.3 9.0 7.1
Headcount (Researcher, Technician & Others)
9,233 12,127 23,262 24,937 30,983 24,588
Full Time Equivalence 4,437.30 6,656.33 10,059.67 10,730.95 17,886.55 14,800.00
Source: MASTIC (2008).
26. Malaysia’s increasing scientific publication and patenting record, although second among
Association of Southeast Asian Nations (ASEAN) countries, is poor when compared internationally
(Table 2.5). Most patents granted in Malaysia have been to foreigners, and Malaysia’s most patented
technology class is that of active solid-state devices including transistors and solid-state diodes. Following
the creation of the Intellectual Property Corporation of Malaysia (MyIPO), an increasing share of patents
has gone to locals reaching about 8% of the total in 2009. Between 1995 and 2008, US patents issued to
residents of Malaysia rose twenty-fold but from a very low base. Most US patents are granted to MNCs
located in Malaysia. With the exception of individually-owned patents, only four Malaysian organizations
— Silterra, Malaysian Palm Oil Board (MPOB), Harn Marketing, and Universiti Putra Malaysia (UPM) —
were granted five or more patents each between 2003 and 2007. The patents issued domestically are
mainly for chemistry and metallurgy, operational technology, electricity and physics.
Page 12
12
Table 2.5. Number of Patents Granted by USPTO (1977-2007), Malaysia V.S. Selected Countries
Country No. of patents granted
China 5348
Germany 251597
Japan 682050
Malaysia 949
Singapore 4016
South Korea 54036
Sweden 33523
Thailand 440
USA 2004055
Source: US Patent and Trademark Office (USPTO).
27. The recent increase in domestic patents and publication rates (see Figure 2.1) is in part due to
incentive schemes for patent research within universities and government research institutes. Still,
Malaysia continues to rank behind Singapore and Thailand in the number of scientific publications and
citations in any given year. A low proportion (about 2%) of papers published are in high impact scientific
publications. Key fields for scientific articles include medicine, engineering, biochemistry, and computer
science.
Figure 2.1.Increases in Patents Granted and Scientific Publications in Malaysia, 2000-10
Page 13
13
3. Innovation policy frameworks
28. Science and technology has been a featured part of Malaysia’s economic planning since 1986
when the First National Science and Technology Policy was formulated and included as a distinctive strand
within the 5th Malaysia Plan (1986–1990). In 1991, Malaysia developed ―Vision 2020,‖ its blueprint to
become a knowledge-based economy. The 10th Malaysia Plan (2011–2015) announced a new structure to
streamline the governance of science and technology with a more prominent role for the Prime Minister’s
Office. The Unit Inovasi Khas (UNIK) was created to oversee an integrated innovation policy and
entrusted with commercializing research findings from public research institutions and universities. UNIK
is also responsible for drafting the National Innovation Policy for the country, while a statutory
organization – the Malaysian Innovation Agency (AIM) – was established in 2011 to drive the nation’s
innovation agenda.
29. The Ministry of Science, Technology and Innovation (MOSTI), which was originally formed as
the Ministry of Technology, Research and Local Government in 1973, is the general administrator of
science and technology policy in Malaysia. MOSTI provides the bulk of grants for research through
specialized schemes including the Science Fund, the Strategic Thrusts of Research Areas program and the
TechnoFund. Its programs are currently clustered into five focus areas: biotechnology, information
technology, industry, sea to space, and the science and technology core. In addition, a Nanotechnology
Directorate was created in 2010 when the Prime Minister launched the National Nanotechnology Statement
to promote research in this field.
30. Decisions on the allocation of the S&T budget, the integration of S&T plans with national
development planning and the determination of manpower requirements to execute these plans rest with
other agencies -- the Treasury, the Economic Planning Unit, and the Public Services Department
respectively. A number of sectoral ministries have a role in S&T development through research institutions
which come under their jurisdiction. These include the Malaysian Agricultural Research and Development
Institute (MARDI) and the Malaysian Palm Oil Board (MPOB) which report to the Ministry of Agriculture
and the Ministry of Plantation Industries, respectively. In addition, technology transfer comes under the
purview of the Ministry of International Trade and Industry, while fiscal and financial incentives for R&D
are administered by the Ministry of Finance.
31. Organizations under MOSTI such as the Malaysia-Industry High Technology Group (MIGHT)
provide advisory services and engage in technology foresight and industry-specific activities. Other bodies
include the Academy of Sciences Malaysia, inaugurated in 1995, which advances general science across
Malaysia and administers certain schemes like ―Brain Gain Malaysia‖. The Malaysian Science and
Technology Information Centre (MASTIC) is the official reference centre for science and technology
statistics and indicators. In 2011, a revamped National Science and Research Council (NSRC) was
established to replace the National Council for Scientific Research and Development (NCSRD) formed in
1975.
32. The Ministry of Education (MOE) has oversight of the school system from pre-school to
secondary level where students are streamed into academic, technical, vocational or religious studies. The
Ministry of Higher Education is responsible for tertiary education and currently has targets of developing
20 Centers of Excellence that are internationally recognized in terms of research output; ensuring at least
75% of lecturers possess a PhD or equivalent and that 30% of lecturers in polytechnics and community
colleges possess a Masters Degree; and attracting foreign students to form up to 10% of the total student
population at university level.
33. In recent years, Malaysia has introduced a range of measures – both fiscal and non-fiscal – to
promote research and innovative activities by foreign and domestic firms. These include attracting foreign
Page 14
14
knowledge-intensive companies and promoting technology acquisition and diffusion. Fiscal incentives are
extended to spur greater research and development including a double deduction on non-capital expenses
incurred for undertaking R&D activities. The fiscal relief also covers activities for export promotion and
branding. Large firms had been the main beneficiaries of the R&D tax incentives while small firms find the
procedures to access these incentives too cumbersome.
34. Malaysia has expanded its banking system and capital markets to promote the establishment of
new companies although results to date have been disappointing. Under the national plans, funds have been
channelled to various government-linked venture companies to promote and finance innovation,
technology acquisition and commercialization of R&D findings. Recently, the Mudharabah Innovation
Fund was formed to provide risk capital to government-backed enterprises. In 2009, the Securities
Commission of Malaysia introduced new tax incentives guidelines whereby venture capital companies
could be eligible for a five-year tax exemption if they invest at least 30% of their funds in the form of seed
capital, start-up and/or early-stage financing.
35. Box 3.1 provides an illustration of the key actors of the Malaysian national innovation system
and their relations.
Page 15
15
Government machinery, R&D sector, innovation support centres, financing sector, education
and training institutions and enterprises are the main innovation actors in Malaysia. These
actors are linked through formal and informal networks, and contribute to the generation and
diffusion of knowledge.
The knowledge generation and diffusion process, as well as the networks and linkages among
these innovation actors are supported by a wide spectrum of institutional framework, namely
the S&T policies, knowledge and technology transfer, communication and transparency,
social-economic condition, market, trade structure and legal, social capital, and skills and
human capital resources. These institutional frameworks function as innovation-enablers of the
NIS.
There is no central coordinating body that is orchestrating the whole of Malaysia’s NIS.
BOX 3.1. A Bird’s View Illustration of Malaysia’s National Innovation System - Actors and Linkages
Source: Illustration by Boon-Kwee, Ng.
National and Sectoral
S&T Policies
Skills
&
Human
Capital
Resour
ces
Social
Capital
Market, Trade
Structure & Legal
Social-economic
Conditions
Comm
unicati
on &
Transp
arency
Knowl
edge &
Techno
logy
Transf
er
Gov. Machinery
Ministries
High-level councils
R&D Sector
Universities
GRIs
Research companies
Inno. Support
Tech-Parks
Incubators
Cluster
Enterprises
SMEs, GLCs &
MNCs
Consultants
Edu. & Training
Schools & IHLs
Skills Dev.
Centre
Financing
Commercial Bank
&, DFIs
Venture Capitals
Knowledge
generation,
learning and
diffusions
Page 16
16
4. National innovation system
4.1. Business Sector
36. Malaysia’s economy is dominated by large multinational firms which assemble and export
electronics and other manufactured products. Large state-owned enterprises in automotive, oil and gas, and
commodity sectors also feature on the economic landscape. Small and medium-sized enterprises (SMEs),
which constitute almost 95% of the total population of firms, have minimal linkages with the larger
companies. There are also few additions to the ranks of the largest business entities indicating limited
dynamism in Malaysia’s business environment.
37. On average, only 5.5% of firms in Malaysia actively participate in R&D activities and these are
mostly the multinational companies. Consequently, foreign firms were granted with more patents than
Malaysian firms (Figure 4.1). There are a large number of MNEs which conduct high-end research who
have a presence in Malaysia, including global brands like Hewlett Packard, Motorola, Intel, and Dyson.
However, it is difficult to know what share of their activities in Malaysia is R&D-oriented as opposed to
manufacturing or after-sales support and to ascertain the number of scientific personnel they employ.
Research activity mostly involves the electrical and electronics (E&E), chemicals, food and beverages,
rubber and plastics, and automotive sectors. The electronics sector alone accounts for 46% of total foreign
R&D. In 2008, due to the global crisis, the number of firms involved in R&D significantly shrunk although
there is a trend of increasing research investments per establishment. Chemistry, metallurgy and electricity
are the industrial sectors that lead the numbers of patents granted (Figure 4.2).
Figure 4.1. Malaysian and U.S. Patents Granted to Malaysian Industry by Ownership of Firms, 1988-2008.
Source: Thiruchelvam et al, (2011).
Page 17
17
Figure 4.2. Malaysian and U.S. Patents Granted to Malaysian Industry by Industrial Sector, 1988-2008.
Source: Thiruchelvam et al, (2011).
38. A number of factors account for the lack of internationalization of R&D activities in the
Malaysian manufacturing sector, including reliance of research activities on the interest of MNE
headquarters abroad, undemanding technological content activities as in the case of electronics assembly
and testing, lack of public sector participation in industry-linked research, and poor organizational support
in terms of skilled labour and infrastructure. The quality of human capital in Malaysia and low capacity to
absorb new technology have also contributed to the limited transfer of knowledge from MNEs to domestic
firms.
39. Among domestic firms, most R&D is conducted by the large state-owned enterprises including
the automobile manufacturer Proton, the oil and gas company Petronas, and the large palm oil firms. These
companies rely on government subsidies for their research investments. Unlike in the electronics sector
where most R&D is conducted by foreign firms, the National Automotive Policy and local content
requirements have concentrated automotive research with Proton. The state-owned automobile company
accounts for nearly 76% of Malaysia’s R&D expenditure in this sector, while foreign players like Honda
and Toyota tend to maintain their research strongholds in Thailand.
40. The significant presence of multinational enterprises has provided the country with export-
oriented platforms, but Malaysia has had limited success in transferring the technological capabilities of
MNEs to indigenous companies and in multiplying the linkages of MNEs with the domestic economy.
Clusters have developed around the MNE-led manufacturing core, but these are primarily logistical –
deriving benefits from the reduction of supply chain costs -- rather than technological or knowledge-based
groupings. For example, transfer of knowledge from Japanese subsidiaries in the electrical and electronics
sector to their local suppliers is mostly in product and process technology. With regard to products, this
involves physical and technical specifications for manufacturing, while process technology transfers
primarily regard the supply of tools and input procurement. Technological learning by local firms via
interaction with foreign subsidiaries is therefore limited in Malaysia.
4.2. Higher Education Institutes
41. The Ministry of Higher Education is entrusted with the oversight of the 20 public Higher
Education Institutes (HEIs) in the country as well as private universities, foreign branch campuses and
colleges. Prior to 1969, there was only one university in Malaysia and since then the number of public
universities has risen to 20 at present (Table 4.1). Following the passage of the Private Higher Educational
Page 18
18
Institutions Act, private universities were permitted to operate and presently there are 33 private
institutions plus four branch campuses of foreign universities.
Table 4.1. Number of Higher Education Institutions in Malaysia
Type of Institution Number
Public Higher Education Institutions 20
Private Universities 18
Private University Colleges 15
Foreign University Branch Campus 4
Private Colleges 488
Polytechnics 24
Community Colleges 37
Source: Ministry of Higher Education Malaysia website.
42. A Rating System for Malaysian Higher Education Institutions (SETARA) was introduced in 2007
to enhance quality and promote best practices among public universities. In order to intensify research and
innovation activities, four universities were accorded Research University status by the government. As
part of this process, universities were encouraged to participate in the competitive Accelerated Programme
for Excellence (APEX). In 2008, the Universiti Sains Malaysia (USM) became the first APEX university.
With this title comes greater autonomy in governance, finance, and admissions and prioritized
infrastructure investments. In non-APEX institutions, the Ministry of Higher Education still tightly
controls student admissions, course structure, remuneration and financial management, while academic
mobility between universities is limited.
43. Despite the massive investments by the government in the higher education sector, the research
outputs from the universities have been disappointing. About 53% of the nation’s R&D personnel are
found in higher education institutes, which account for about 10-15% of total R&D expenditures in
Malaysia. The proportion of academic staff with PhD qualifications in public universities has slowly risen
to 36% in 2009. The system of research assistants is not well established in Malaysia as many scientists go
straight from their PhD to a university position where they have a heavy teaching load and lack the
experienced assistance needed to do research. Malaysia would benefit from a post-doctoral scheme which
enables early career scientists to strengthen their experience of research and teaching as part of their career
development.
44. Nevertheless, there are some premier research institutes associated with universities. These
include USAINS, the commercialization arm of Universiti Sains Malaysia, and the Institute of Bioscience
associated with Universiti Putra Malaysia (UPM). This institute has five laboratories covering natural
products, molecular biomedicine, industrial biotechnology, marine science and aquaculture, and cancer
research. The Department of Pathology at the University of Malaysia has pioneered a number of scientific
developments from laboratory information systems to microwave-stimulated antigen retrieval techniques.
Closely aligned with the National Biotechnology Policy, research programs span plant biotechnology, drug
discovery, vaccine technology, and immunotherapeutics.
45. The commercialization rate of universities funded under the grants for ―Intensification of
Research in Priority Areas‖ is only 5% of research results. The failure to improve the commercialization
rate of university research is attributed to insufficient industry-relevant research projects and a lack of
funding for the various stages of the commercialization process including pilot projects and marketing.
Patents applied for and granted to universities are typically at an early stage of development characterized
by a high degree of technical and market uncertainty. In recent years, the Malaysian Government
introduced incentives for university researchers and inventors to publish, patent and commercialize their
Page 19
19
research including cash rewards on disclosure of an invention and funding for initial development when a
patent is granted.
4.3. Public Research Organizations
46. In general, Malaysia’s public sector research is characterized by too many areas of funding and
multiple institutes as well as being driven predominantly by the interests of researchers. Of the 29 public
research organisations, one is a company under MOSTI and the remainder are departments or institutes of
the sectoral ministries. Most of these institutions have a sector focus and MOSTI has no direct authority in
determining their research agendas. Malaysia’s public research organisations (PROs) perform mainly
downstream or applied research, rather than basic or experimental research, in order to be relevant to their
target customers or to satisfy their departmental remits.
47. The agricultural sciences dominate the work of the public research institutes while other areas of
research include forestry, materials, engineering and biotechnology. In addition to the Malaysian
Agricultural Research and Development Institute (MARDI), a large share of public funding goes to
commodity research organisations such as the Malaysian Palm Oil Board (MPOB), Malaysian Rubber
Board (MRB), Malaysian Cocoa Board (MCB) and Forest Research Institutions Malaysia (FRIM). These
research institutes focused on agriculture and forestry tend to work closely with firms in the relevant
sector.
48. In order to strengthen technological capability in the manufacturing sector, several PROs and
complementary institutions have been established to provide research and services related to industry and
engineering. These include the Malaysian Institute of Microelectronic Systems (MIMOS) for research on
electronics and information technology development. The Standards and Industrial Research Institute of
Malaysia (SIRIM) and the Malaysian Productivity Corporation (MPC) conduct research to help improve
overall productivity. To spur advancement in selected fields, institutes have been created such as Nuclear
Malaysia which provides nuclear technology research facilities; the Malaysian Remote Sensing Agency for
the development of remote sensing technology in national planning and resource management; and the
Malaysian Institute of Economic Research (MIER) which provides expertise in economic, financial and
business related issues.
49. A number of PROs have been assigned to safeguard the quality of health care of Malaysians
including the Institute for Medical Research (IMR) and the National Heart Institute (IJN). The Cancer
Research Initiatives Foundation (CARIF) focuses on diseases most commonly found in Asian countries
with a growing reputation in cell and molecular biology, gene expression, and drug discovery techniques.
Individual and corporate donors such as Sime Darby and Petronas supplement government funding for
CARIF. Biotechnology is another priority for investment, with a focus on pharmaceutical breakthroughs at
the Agro-Biotechnology Institute, the Malaysia Genome Institute, and the Institute of Nutraceutical and
Pharmaceuticals. In the 10th Malaysian Plan, the Government identified some broad areas of research in the
public interest -- including tropical medicine, global warming, food security, infectious diseases, and water
and energy security -- to be undertaken by public institutes.
4.4. Linkages
50. Despite numerous public research institutes and universities involved in R&D, their contribution
to industrial development in Malaysia is limited due to poor linkages and collaboration. Bureaucratic
procedures and the lack of relevance of university research to industry are cited as the main reasons
deterring firms from collaborating with higher education institutes in the development of science and
technology. The lack of industrial extension programmes and weak bridging organizations have hampered
the transfer of research results and technology from the public research organisations. The exception is the
Page 20
20
close linkages between the sector research institutes and industry in specific commodities such as rubber
and palm oil.
51. Malaysia has had mixed success in facilitating technology transfers from multinational
enterprises and in multiplying domestic linkages with them. The capabilities of indigenous firms are highly
dispersed, creating room for the beneficial diffusion of knowledge through best practice programs, SME
assistance and technology brokers. However, forward and backward linkages with multinational firms have
not contributed significantly to technology learning or upgrading of indigenous suppliers. While
technology transfer from MNEs to local businesses has been weak, state-owned companies such as
Petronas have had more success in nurturing smaller enterprises. There is also potential in improving the
productivity of upstream and downstream activities in the palm oil sector, since Malaysia is the world’s
second largest producer of palm oil after Indonesia.
52. There is presently a lack of dedicated institutions entrusted in the transfer of industrial technology
from the universities and PROs to industry, particularly SMEs, as extension activities are poorly developed
for the industrial sector. In addition to improving the teaching and research capabilities of universities,
intermediary organizations are needed to facilitate matchmaking between universities and the private
sector in specific fields. The technology support organizations in the country have failed to coordinate their
roles to support the commercialization of R&D output from Malaysian public research.
53. There are numerous projects aimed at fostering high-technology clusters in Malaysia and the
government has supported a number of science parks across the country. These benefit from strong
government support, adequate funds for infrastructure, and tax incentives, yet university links are relatively
weak. The first park established was the Kulim High Technology Park in 1993 which caters to high-
technology manufacturing. Technology Park Malaysia (TPM), established in 1996, is targeted more at
R&D-based businesses and is now home to over 160 firms. The third largest park is the ICT-focused
cluster of Cyberjava located in the Multimedia Super Corridor which has attracted the international firms
Dell, Hewlett-Packard, Motorola and Ericsson.
5. Human Resources
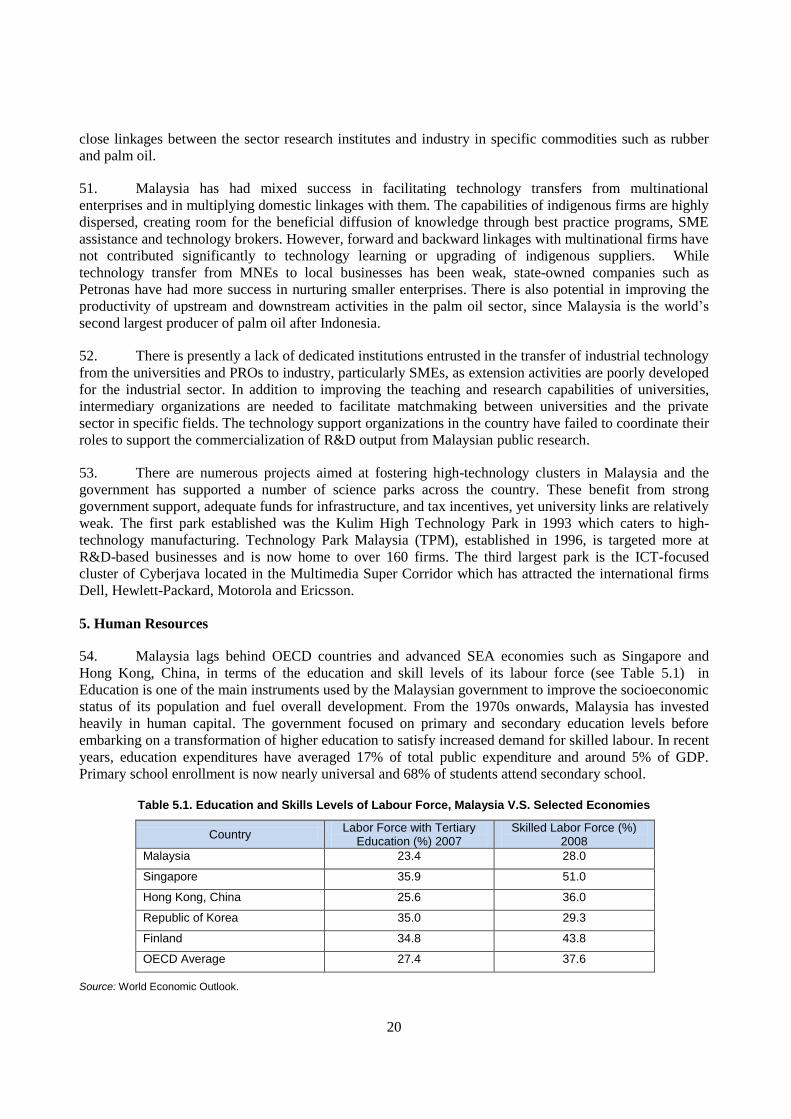
54. Malaysia lags behind OECD countries and advanced SEA economies such as Singapore and
Hong Kong, China, in terms of the education and skill levels of its labour force (see Table 5.1) in
Education is one of the main instruments used by the Malaysian government to improve the socioeconomic
status of its population and fuel overall development. From the 1970s onwards, Malaysia has invested
heavily in human capital. The government focused on primary and secondary education levels before
embarking on a transformation of higher education to satisfy increased demand for skilled labour. In recent
years, education expenditures have averaged 17% of total public expenditure and around 5% of GDP.
Primary school enrollment is now nearly universal and 68% of students attend secondary school.
Table 5.1. Education and Skills Levels of Labour Force, Malaysia V.S. Selected Economies
Country Labor Force with Tertiary
Education (%) 2007 Skilled Labor Force (%)
2008
Malaysia 23.4 28.0
Singapore 35.9 51.0
Hong Kong, China 25.6 36.0
Republic of Korea 35.0 29.3
Finland 34.8 43.8
OECD Average 27.4 37.6
Source: World Economic Outlook.
Page 21
21
55. Despite the large push in access and participation in school, especially in primary education, the
quality of education remains below other comparable economies. The tertiary education system is
disadvantaged by a secondary school system that does not prepare its students for university education.
Only 20% of tertiary entrants go on to graduate which raises serious problems for the government’s target
of creating 100,000 PhD holders by 2020 under the ―MyBrain 15‖ initiative. In 2008, Malaysia had under
4 000 PhD students over half of whom were educated in part outside the country. In general, there is
concern about the quality of tertiary education and serious mismatches between the products of the higher
education system and industrial skill needs.
56. Malaysia’s higher education system has undergone a rapid transformation (Table 5.2). In the 8th
Malaysia Plan (2000–2005), nearly 47% of the allocation for education was designated for tertiary schools.
Another area of expansion was in privately provided education as the government opened the gates to
private and foreign universities to assist public institutions in catering for increasing demand for skilled
labour. Higher education enrolment increased to 30% of the 18-24 year old population. The international
student population grew and by 2008, 70,000 international students were enrolled in Malaysian
universities. The number of students enrolled in science and technical subjects at both undergraduate and
graduate level more than doubled.
Table 5.2. Enrolment and Graduation of Students in higher education institutions, Malaysia (2002-2008)
Number of Enrolments/Graduates
2002 2003 2004 2005 2006 2007 2008*
Public Higher Education Institutions
281,839 294,359 293,978 307,121 331,025 382,997 403,009
57,435 75,842 71,924 79,934 81,095 85,448 56317
Private Higher Education Institutions
294,600 314,344 322,891 258,825 323,787 365,800 419,778
139,150 137,018 134,987 57,953 83,186 83,431 51,571
Colleges/Polytechnics/ Community Colleges
56,105 59,916 73,327 83,707 93,318 98,688 102,429
18,774 20,714 21,441 28,555 31,870 34,451 35,873
TOTAL 632,544 668,619 690,196 649,653 748,130 847,485 925,216
215,359 233,574 228,352 166,442 196,151 203,330 143,761
Note: * 2008 Data on enrolment and gradation is up to July 2008 only, taken from Quick Facts Malaysia Higher Education Statistics 2008, Ministry of Higher Education, December 2008.
Source: Ministry of Higher Education Malaysia (2008).
57. The 10th Malaysia Plan (2011-2015) specifically addresses the human capital deficiency and the
need to train qualified students and develop a skilled workforce. The Higher Education Strategic Plan
under the Ministry of Higher Education was put in place to revamp education to meet labour market needs.
Emphasis is placed on enhancing the quality of students, teachers and delivery systems. At lower school
levels, efforts are concentrated in improving quality, ensuring literacy and numeracy, and raising the
standards of secondary schools. Government policy is also focused on shifting the balance of student
enrolment to a 60:40 ratio in favour of science-based studies at tertiary level. This will largely depend on
an increased focus within secondary education upon these fields, as well as ensuring sufficient career
opportunities in the broader economy.
58. Malaysia’s ambition to move from a focus on fabrication in the manufacturing sector towards
higher-value, front-end aspects such as design is also dependent on increasing the pool of engineers and
technical personnel. Over 18% of students in tertiary education are now enrolled in engineering, but there
are few students trained in the maintenance of highly complex scientific instruments and machinery.
Page 22
22
Would-be technicians have been deterred from vocational training seen as inferior to university
qualifications. Statistics show that only about 10% of students are enrolling in technical and vocational
education. Improving the availability, access and quality of the technical pathway is equally as important
as upgrading the academic pathway of education.
59. The Government set up several new university colleges with the ultimate aim to revamp the
science, technology, and engineering education system by incorporating some extent of vocational training
in both secondary and tertiary education. A national dual training system has been incorporated into
existing vocational education to address technical labour shortages. This apprenticeship program involves a
two-year training program carried out 70-80% in workplaces and the remaining 20-30% in selected
training institutions. Graduates are expected to acquire the necessary hands-on experience which is
immediately applicable in the labour market in order to play a role in modernising production and in
innovation.
60. In spite of substantial education expenditures, the supply of skilled labour in Malaysia is still in
shortage. Labour force participation rates by education level show that the majority of workers have only a
secondary education or below. In 2010, unskilled workers represented more than 75% of total workers
employed while those with college level education and applicable skills made up only a quarter of the
workforce. Only 28% of Malaysian jobs are in the higher skilled bracket. There are also shortages in
critical professions such as qualified engineers, scientists and R&D personnel which is limiting the
evolution of current industries and firms into higher value added activities.
61. Enrolment in higher education in Malaysia is still biased towards academic disciplines which
follow a rote-learning model. In order to ensure the curriculum and courses offered by Malaysia’s 50
universities are of high quality and relevant to the needs of industry, existing programmes are being
reviewed for compliance with the Malaysian Qualification Framework (MQF) to determine whether
standards are in line with international best practices. Firms are demanding that universities build better
curriculum and impart not only technical skills but also intangible skills such as creativity, communication
and problem-solving as well as language skills especially English.
62. To its credit, Malaysia has put in place many programs to promote gender equality. The illiteracy
rate for women decreased from 35% in 1980 to about 12% at present compared to 5% for males. At the
secondary school level, female students achieve significantly higher scores than their male counterparts
and a large share of university enrolees are women. These educational gains for women are not reflected in
the labour market, as women constitute only about 30% of the labour force mostly in household service
sectors. The female share of higher skill jobs, including professionals and technicians, is low at under 25%.
63. Due to Malaysia’s foreign labour policy, firms are able to employ cheap unskilled foreign
workers, while the current wage structure does not encourage employees to upgrade their skills. A lack of
spending on training by firms, especially SMEs, limits knowledge upgrading and undermines progression
to higher value added and productivity driven activities. Due to limited financial resources and human
resource personnel, firms have difficulties in sourcing and planning training programs for their employees.
At the same time, the number of skilled expatriates working in Malaysia has declined in recent years,
limiting opportunities for leveraging their knowledge and technological capabilities. The result is a very
tight market for skilled labour.
64. The outflow of Malaysian talent is also increasing. It is estimated that about 4% of the country’s
population resides overseas, approximately 40% in Singapore. More than 300,000 Malaysians – many of
whom possess tertiary qualifications – have migrated annually in recent years. The government now views
this substantial ―brain drain‖ as a potential asset and is increasing linkages with talented overseas
Malaysians. In 2011, it established the Talent Corporation Malaysia aimed at retaining talent and attracting
Page 23
23
skilled Malaysians residing abroad to fill the growing deficits in skilled manpower in the country. The
Skills Development Fund is dedicated to financing more PhD students and extending educational loans.
Top students currently overseas will have their final year of study paid for by the government on the
condition that they return. Greater visa flexibility for foreign researchers and technicians has also been
instituted to fill private sector skills gaps.
Page 24
24
REFERENCES
Day, Natalie and Amran bin Muhammad (2011), ―Malaysia‖, The Atlas of Islamic-World Science and
Innovation Country, Case Study No. 1.
Thiruchelvam K., Chandran V. G. R., Ng Boon Kwee, and Wong Chan Yuan (2011), ―A Country Profile
of Malaysia on Innovation‖, paper prepared for the OECD.
World Bank (2007), ―Malaysia and the Knowledge Economy: Building a World Class Higher Education
System‖, Human Development Sector Reports for East Asia and the Pacific Region.
World Bank (2010), Malaysia Economic Monitor: Growth through Innovation, Washington, D.C.