52
N U C L E A R E N E R G Y A G E N C Y OECD/NEA Behaviour of Iodine Project Nuclear Safety NEA/CSNI/R(2011)11 January 2012 www.oecd-nea.org Final Summary Report
N U C L E A R E N E R G Y A G E N C Y
OECD/NEA Behaviour of Iodine Project
Nuclear Safety NEA/CSNI/R(2011)11January 2012
www.oecd-nea.org
Final Summary Report

Unclassified NEA/CSNI/R(2011)11 Organisation de Coopération et de Développement Économiques Organisation for Economic Co-operation and Development 11-Jan-2012 ___________________________________________________________________________________________
English text only NUCLEAR ENERGY AGENCY COMMITTEE ON THE SAFETY OF NUCLEAR INSTALLATIONS
BEHAVIOUR OF IODINE PROJECT FINAL SUMMARY REPORT
This report was originally published in December 2011 as AECL Report n° 153-126530-440-015 Revision 0
JT03314206
Document complet disponible sur OLIS dans son format d'origine Complete document available on OLIS in its original format
NEA
/CSN
I/R(2011)11
Unclassified
English text only
Cancels & replaces the same document of 11 January 2012
NEA/CSNI/R(2011)11
2
ORGANISATION FOR ECONOMIC CO-OPERATION AND DEVELOPMENT
The OECD is a unique forum where the governments of 34 democracies work together to address the economic, social and environmental challenges of globalisation. The OECD is also at the forefront of efforts to understand and to help governments respond to new developments and concerns, such as corporate governance, the information economy and the challenges of an ageing population. The Organisation provides a setting where governments can compare policy experiences, seek answers to common problems, identify good practice and work to co-ordinate domestic and international policies.
The OECD member countries are: Australia, Austria, Belgium, Canada, Chile, the Czech Republic, Denmark, Estonia, Finland, France, Germany, Greece, Hungary, Iceland, Ireland, Israel, Italy, Japan, Luxembourg, Mexico, the Netherlands, New Zealand, Norway, Poland, Portugal, the Republic of Korea, the Slovak Republic, Slovenia, Spain, Sweden, Switzerland, Turkey, the United Kingdom and the United States. The European Commission takes part in the work of the OECD.
OECD Publishing disseminates widely the results of the Organisation’s statistics gathering and research on economic, social and environmental issues, as well as the conventions, guidelines and standards agreed by its members.
This work is published on the responsibility of the OECD Secretary-General. The opinions expressed and arguments employed herein do not necessarily reflect the official
views of the Organisation or of the governments of its member countries.
NUCLEAR ENERGY AGENCY
The OECD Nuclear Energy Agency (NEA) was established on 1 February 1958. Current NEA membership consists of 30 OECD member countries: Australia, Austria, Belgium, Canada, the Czech Republic, Denmark, Finland, France, Germany, Greece, Hungary, Iceland, Ireland, Italy, Japan, Luxembourg, Mexico, the Netherlands, Norway, Poland, Portugal, the Republic of Korea, the Slovak Republic, Slovenia, Spain, Sweden, Switzerland, Turkey, the United Kingdom and the United States. The European Commission also takes part in the work of the Agency.
The mission of the NEA is: – to assist its member countries in maintaining and further developing, through international co-operation, the
scientific, technological and legal bases required for a safe, environmentally friendly and economical use of nuclear energy for peaceful purposes, as well as
– to provide authoritative assessments and to forge common understandings on key issues, as input to government decisions on nuclear energy policy and to broader OECD policy analyses in areas such as energy and sustainable development.
Specific areas of competence of the NEA include the safety and regulation of nuclear activities, radioactive waste management, radiological protection, nuclear science, economic and technical analyses of the nuclear fuel cycle, nuclear law and liability, and public information.
The NEA Data Bank provides nuclear data and computer program services for participating countries. In these and related tasks, the NEA works in close collaboration with the International Atomic Energy Agency in Vienna, with which it has a Co-operation Agreement, as well as with other international organisations in the nuclear field.
This document and any map included herein are without prejudice to the status of or sovereignty over any territory, to the delimitation of international frontiers and boundaries and to the name of any territory, city or area. Corrigenda to OECD publications may be found online at: www.oecd.org/publishing/corrigenda. © OECD 2012
You can copy, download or print OECD content for your own use, and you can include excerpts from OECD publications, databases and multimedia products in your own documents, presentations, blogs, websites and teaching materials, provided that suitable acknowledgment of the OECD as source and copyright owner is given. All requests for public or commercial use and translation rights should be submitted to [email protected]. Requests for permission to photocopy portions of this material for public or commercial use shall be addressed directly to the Copyright Clearance Center (CCC) at [email protected] or the Centre français d'exploitation du droit de copie (CFC) [email protected].

NEA/CSNI/R(2011)11
3
COMMITTEE ON THE SAFETY OF NUCLEAR INSTALLATIONS
Within the OECD framework, the NEA Committee on the Safety of Nuclear Installations (CSNI) is an international committee made of senior scientists and engineers, with broad responsibilities for safety technology and research programmes, as well as representatives from regulatory authorities. It was set up in 1973 to develop and co-ordinate the activities of the NEA concerning the technical aspects of the design, construction and operation of nuclear installations insofar as they affect the safety of such installations.
The committee’s purpose is to foster international co-operation in nuclear safety amongst the NEA member countries. The CSNI’s main tasks are to exchange technical information and to promote collaboration between research, development, engineering and regulatory organisations; to review operating experience and the state of knowledge on selected topics of nuclear safety technology and safety assessment; to initiate and conduct programmes to overcome discrepancies, develop improvements and research consensus on technical issues; and to promote the co-ordination of work that serves to maintain competence in nuclear safety matters, including the establishment of joint undertakings.
The clear priority of the committee is on the safety of nuclear installations and the design and construction of new reactors and installations. For advanced reactor designs the committee provides a forum for improving safety related knowledge and a vehicle for joint research.
In implementing its programme, the CSNI establishes co-operate mechanisms with the NEA’s Committee on Nuclear Regulatory Activities (CNRA) which is responsible for the programme of the Agency concerning the regulation, licensing and inspection of nuclear installations with regard to safety. It also co-operates with the other NEA’s Standing Committees as well as with key international organisations (e.g., the IAEA) on matters of common interest.
NEA/CSNI/R(2011)11
4

NEA/CSNI/R(2011)11
5

NEA/CSNI/R(2011)11
6
NEA/CSNI/R(2011)11
7
TABLE OF CONTENTS
COMMITTEE ON THE SAFETY OF NUCLEAR INSTALLATIONS ......................................... 3
TABLE OF CONTENTS .................................................................................................................. 7
1. EXECUTIVE SUMMARY ........................................................................................................... 9
2. DESCRIPTION OF THE BIP PROJECT ................................................................................... 11
2.1 Iodine Deposition onto Surfaces ............................................................................................ 11 2.2 Organic Iodide Formation from Irradiated Surfaces .............................................................. 12 2.3 Radioiodine Test Facility Experiments.................................................................................. 12
3. TEST MATRIX .......................................................................................................................... 13
4. EXPERIMENTAL SUMMARY ................................................................................................ 17
4.1 Coupons ................................................................................................................................. 17 4.2 Aqueous Phase Iodine Adsorption ......................................................................................... 23 4.3 Gas Phase Adsorption Apparatus and Procedure .................................................................. 24 4.4 Organic Iodide Production Tests ........................................................................................... 25
5. RADIOIODINE TEST FACILITY (RTF) RESULTS ............................................................... 31
5.1 General Description of the RTF............................................................................................. 31 5.2 Summary of RTF P9T1.......................................................................................................... 32 5.3 Summary of RTF P9T2.......................................................................................................... 33 5.4 Summary of RTF P10T2........................................................................................................ 34 5.5 Summary of RTF P10T3........................................................................................................ 35 5.6 Summary of RTF P11T1........................................................................................................ 35
6. ADSORPTION TESTS ............................................................................................................... 37
6.1 Aqueous Adsorption .............................................................................................................. 37 6.2 Gas Phase Adsorption ............................................................................................................ 39
7. ORGANIC IODINE FORMATION TESTS .............................................................................. 43
8. FURTHER WORK ..................................................................................................................... 47
9. REFERENCES ............................................................................................................................ 49
BIP Project Reports ..................................................................................................................... 49 Other References.......................................................................................................................... 50
APPENDIX A ................................................................................................................................. 51

NEA/CSNI/R(2011)11
8
Tables
Table 1. BIP Test Naming Convention ..................................................................................................... 13 Table 2. Aqueous Phase Iodine Adsorption Tests ..................................................................................... 13 Table 3. Organic Iodide Tests ................................................................................................................... 14 Table 4. Gas Phase Iodine Adsorption Tests ............................................................................................. 16 Table 5. Painted Coupon Types ................................................................................................................ 22 Table 6. Post-Test Vessel Wash ................................................................................................................ 29 Table 7. RTF Experiments Selected for Study .......................................................................................... 32
Figures
Figure 1. Freshly Coated Epigrip Coupon (left) and Amerlock Coupon, Larger Size (right .................... 18 Figure 2. Photograph of 316Ti Coupon ..................................................................................................... 18 Figure 3. Photograph of RMI Type A from which a 1.27 cm diameter discs were punched .................... 19 Figure 4. Photograph of an Inverted RMI Cassette showing where Type B (Cassette Interior) and Type C (Cassette Inner Foil) sample discs were taken .......................................................................................... 19 Figure 5. Photograph of RMI Cassette showing where Type D (Cassette Exterior) sample discs were taken .......................................................................................................................................................... 20 Figure 6. Photograph of EPIGRIP M253 Coated Metal (Base Metal for 1994 sample and Painted Surface of 1998 Sample Shown). ........................................................................................................................... 20 Figure 7. Photograph of Nukon Wool Sample from which a 1.5 cm x 1.5 cm x 1 cm Test Specimen was Cut ............................................................................................................................................................. 21 Figure 8. Glassware used for Aqueous Phase Adsorption Studies ............................................................ 24 Figure 9. Schematic Diagram of Multiple Coupon Radioiodine Adsorption Apparatus RH, T and P denote relative humidity, temperature and pressure transducers, and UHP N2 corresponds to ultra high purity nitrogen. .......................................................................................................................................... 25 Figure 10. Irradiation Vessel (Pre-irradiation, without the Coupon Holders) ........................................... 26 Figure 11. Irradiation Vessel (Post-irradiation, with Coupons and Holders) ............................................ 27 Figure 12. Diagram of Speciation Tube .................................................................................................... 28 Figure 13. Schematic of the RTF Facility ................................................................................................. 32 Figure 14. Adsorption of Aqueous I2 onto Fresh Amerlock Paint (Large Coupon) (Test A-7). .............. 37 Figure 15. Adsorption of Aqueous CsI onto Nukon( Wool Samples (Test A-14 and Test A-2) .............. 38 Figure 16. Iodine Deposition on Aged Ripolin (Test G-4)........................................................................ 39 Figure 17. Iodine Deposition on THAI 316Ti Stainless Steel (Test G-1) ................................................. 40 Figure 18. Methyl Iodide Profiles Typical of ORGx-G Tests (Normalized Linear Scale) ....................... 43 Figure 19. Methyl Iodide Profiles Typical of ORGx-A Tests (Normalized Linear Scale) ....................... 44

NEA/CSNI/R(2011)11
9
1. EXECUTIVE SUMMARY
A CSNI status report on iodine behaviour published in February 2007 concluded that although the understanding of iodine behaviour in containment had advanced considerably over the past several decades, there were still some areas where further investigation was warranted. As a result, the Nuclear Energy Agency (NEA) Committee for the Safety of Nuclear Installations (CSNI) initiated the Behaviour of Iodine Project (BIP) with AECL as the operating agent. The Behaviour of Iodine Project performed work in three distinct areas:
1. Adsorption of iodine on surfaces (from both the aqueous and gas phase).
2. Organic iodide formation from containment paints loaded with iodine from the gas or aqueous phase.
3. Provision of Radioiodine Test Facility (RTF) experimental data from experiments performed in the 1990’s.
The rate of gas phase iodine deposition onto various surfaces was measured using a purpose-built facility at Chalk River Laboratories (CRL). Three types of epoxy paint were tested, along with some steel and mineral samples. Paint has a high capacity for adsorption of iodine (aqueous and gas phase), whereas adsorption onto steel is much lower. For the three epoxy paints tested, the deposition rates were within an order of magnitude of each other. Heat treatment, pre-irradiation and paint age had small effects on deposition rates. Relative humidity was shown to have the largest impact on the iodine deposition rate on painted surfaces. Deposition velocities increased as relative humidity increased, and the effect of temperature was small when the gas phase water concentration was held constant. It has been surmised that the layer of water on the coupon surface is an important aspect of the iodine adsorption mechanism. This conclusion, and the deposition rates provided by the BIP program, will help safety analysts choose appropriate parameters within computer models of iodine behaviour.
Experiments were performed to study the radiolytic formation and destruction of organic iodides during static, closed vessel irradiations in a Gammacell 220 60Co irradiator. Organic iodides are a particularly volatile chemical form of the fission product iodine that is difficult to retain by post-accident filtration systems. Methyl iodide, the simplest and most abundantly form, was selected as the representative organic iodide to be used to monitor the kinetics of organic iodide production. In the BIP experiments, very small concentrations of radiolytically-produced methyl iodide were measured using a specially-tuned gas chromatograph equipped with an electron capture detector. The main focus of the BIP tests was to investigate the role of water in the formation of organic iodides on irradiated paint. To do this, iodine was loaded in two ways: from the aqueous phase and from the gas phase. In some cases, coupons were pre-soaked in water to further increase the moisture content of the coupons prior to iodine loading. It was found that methyl iodide production was, on average, about an order of magnitude higher when the coupon was loaded in the aqueous phase as compared to gas phase loaded coupons. In addition, a quick burst of methyl iodide was detected in experiments when the coupons were pre-soaked. Methyl iodide production was greater when coupons were pre-irradiated, and when fresh paint was used. In addition to the formation rate, the rapid radiolytic destruction rate of gas phase methyl iodide was determined under the conditions of the BIP tests. The destruction rate is an important phenomenon that must be considered when modeling this type of test. Improved knowledge of organic iodide formation and destruction will

NEA/CSNI/R(2011)11
10
help explain tests performed in larger scale experiments such as PHEBUS FP and RTF. The BIP experiments are complementary to EPICUR studies, which are of the “continuous purge” design.
The Radioiodine Test Facility was an intermediate scale test facility, situated at AECL’s Whiteshell Laboratories, that was designed to study iodine behaviour under postulated post accident conditions, including radiation. BIP members selected 5 tests that were completed in the 90’s for inclusion in the program, where the main focus was on organic paints and impurities. The tests demonstrate the dissolution of residual paint solvents and their subsequent radiolytic degradation and formation of organic iodides. The tests also demonstrate the relative importance of various iodine sinks. The RTF data will help members develop and validate computer models.
The BIP project officially started in July 2007 and ended in June 2010, but it lasted several extra months to perform some extra tests and to complete the documentation. The members included Belgium, Canada, Finland, France, Germany, Japan, Korea, the Netherlands, Spain, Switzerland, Sweden, the United Kingdom and the United States. The total budget of the project was about 1.5 million Canadian dollars, half of which was contributed by Canada. The project reports will be available to non-participants in September 2013.
Although good progress was achieved regarding the understanding of the formation of methyl iodide from irradiated paint, the mechanism is not understood. A mechanistic understanding, applied to models for these phenomena, improves our ability to explain results to our regulatory agencies, and justifies application of these results to ranges outside of the tested conditions (e.g., extrapolation to wider selection of materials and to larger scale experiments and containment conditions). A more detailed mechanistic understanding of the formation of methyl iodide from irradiated paint is the goal of BIP2.

NEA/CSNI/R(2011)11
11
2. DESCRIPTION OF THE BIP PROJECT
A CSNI status report on iodine behaviour [Clément et al., 2007] recently concluded that although the understanding of iodine behaviour in containment has advanced considerably over the past several decades, there are still some areas where further investigation is warranted.
As a result, the Nuclear Energy Agency (NEA) Committee for the Safety of Nuclear Installations (CSNI) initiated the Behaviour of Iodine Project (BIP) with AECL as the operating agent. This three-year program had three research areas, each of which will be summarized in the following sections:
1. Iodine deposition onto surfaces,
2. Organic iodide formation from irradiated surfaces, and
3. Radioiodine Test Facility experiments.
2.1 Iodine Deposition onto Surfaces
The CSNI Status Report on Iodine Behaviour highlighted uncertainties that still exist regarding the adsorption of iodine on containment surfaces, the speciation of sorbed iodine, the potential for its revolatilisation, and the ease of decontamination of surfaces. It also noted that iodine deposition on surfaces as a function of temperature and relative humidity (including condensing conditions) has not been established rigorously.
Previous studies at AECL have determined that the rate of adsorption of gaseous iodine on organic paints, stainless steel, carbon steel, zinc primer paint and aluminium are strongly dependent upon the temperature and relative humidity of the air stream containing iodine as well as on the nature of the carrier gas (e.g., desorption from stainless steel is dependent upon the oxygen concentration) and the rate of mass transfer to the surface. Most iodine codes do not capture these effects because there is not sufficient understanding regarding the conditions under which adsorption of iodine on surfaces occurs, and what conditions are necessary to initiate adsorption and corrosion.
The BIP tests provide data from which kinetic parameters, such as deposition velocity can be derived for the various surfaces found in containment. The main parameters adjusted were surface type (including steel samples), temperature and relative humidity.
In addition to measurements of iodine adsorption in the gas phase, some tests were performed to study the deposition of aqueous I2 (or I–) onto various containment surfaces. In addition to paint, insulation and some corrosion product material (aluminium hydroxide and iron oxide) were also tested for affinity for iodine.
These sorption measurements can be used to develop a model for iodine adsorption onto (and desorption from) surfaces and can be incorporated into iodine behaviour codes.

NEA/CSNI/R(2011)11
12
2.2 Organic Iodide Formation from Irradiated Surfaces
The formation of organic iodides in post accident containment could result from gas or aqueous phase homogeneous processes, or from processes initiated at the surfaces of containment paints. Although there are some data available on the production of organic iodides from painted surfaces, a systematic study was warranted. The need for additional data on organic iodide production was also highlighted in the CSNI sponsored Status Report on Iodine behaviour.
BIP experiments studied the rate of organic iodide production by monitoring the concentration of methyl iodide in the vessel during irradiation. In addition to studying the effect of different epoxy paints (epoxy was chosen because it is one of the most common containment paint types), one of the main goals of the project was to demonstrate that organic iodide production depends upon the amount of water that is co-adsorbed. Therefore, in addition to paint type (age and treatment), the main experimental parameters included various methods of altering the surface water loading (aqueous or gas loading, with or without pre-soaking).
Any methyl iodide produced is subjected to continuous irradiation. As such, the radiolytic degradation rate of gas phase methyl iodide is also important and was determined at the conditions of the BIP tests (dose rate, concentration, etc.). The experiments quantified the overall (or steady-state) rate of production of organic iodide.
These experiments are complementary to those performed within IRSN’s EPICUR facility. The EPICUR experiments, which are continuously purged, provide information regarding the rate of production of organic iodides, but do not give information about its destruction. The combination of the two experimental programmes provides a comprehensive view of organic formation.
2.3 Radioiodine Test Facility Experiments
The time-dependent concentration of airborne radioiodine in reactor containment is an important parameter used to evaluate the radiological impact of a reactor accident. Predicting this concentration is not a straightforward problem because a number of complex kinetic phenomena must be considered. The RTF was built at AECL’s Whiteshell Laboratories (WL) to study these phenomena by reproducing many of the features of a reactor containment building, and simulating postulated reactor accident conditions. In the RTF, the effects of a variety of parameters on the volatility of iodine could be examined, separately, or in combination. These included the presence of a radiation field, the temperature of the gas and aqueous phases and surfaces, the circulation of the gas and aqueous phases, venting of the gas phase, the influence of surface treatments and coatings, the effect of addition of various chemicals, the pH, and the presence of condensing conditions.
The RTF was designed and built starting in 1986 and was commissioned in 1988. The last test was performed in November 1998, and the facility was decommissioned in the following years. BIP members selected 5 tests for inclusion in the BIP program, where the main focus was on organic paints and impurities. The tests demonstrate the dissolution of residual paint solvents and their subsequent radiolytic degradation and formation of organic iodides. The tests also demonstrate the relative importance of various iodine sinks. The RTF data will help members develop and validate computer models.

NEA/CSNI/R(2011)11
13
3. TEST MATRIX
Within the BIP project, there were several types of tests performed. The following naming convention was adopted (Table 1): A and G designations refer to the phase from which iodine loading was performed, (i.e., A-x and G-x for aqueous or gas) and the designation “ORG” indicates that the coupons were subsequently used to measure organic iodide formation (ORGx A and ORGx-G were loaded from the aqueous and gas phases respectively). The “x” refers to a sequential test number. A summary of tests performed during BIP are given in Tables 2 through 4.
Table 1. BIP Test Naming Convention
Test Series Name Test Type
ORGx-G Organic Iodide Test (Loaded in the gas phase)
ORGx-A Organic Iodide Test (Loaded in the aqueous phase)
ORGx-M Methyl Iodide Degradation Test (No pre-loaded coupons)
A-x Aqueous Phase Adsorption Test
G-x Gas Phase Iodine Adsorption Test
Table 2. Aqueous Phase Iodine Adsorption Tests
Test Temp. (°C) Loading Conditions pH Control pH Sample Description/Notes
A-1 Ambient 1.0e-4 M CsI solution none 10 Ripolin (2), Amerlock (2) / 2 vessels with 22 ml of solution, each containing 2 coupons
A-2 Ambient 1.0e-5 M CsI solution 0.1 M H3BO3 8 Nukon base wool unexposed (2) / 1 vessel with 2 samples in 22 ml of solution
A-3 Ambient Saturated I2 solution 0.01 M KH2PO4 6 Amerlock (5 coats) (2) / 1 vessel with 2 coupons in 22 ml of solution
A-4 Ambient Saturated I2 solution 0.01 M KH2PO4 6 New Amerlock (1) / 1 vessel with 1 coupon in 22 ml of solution
A-5 Ambient Saturated I2 solution 0.01 M KH2PO4 6 New Amerlock (1) / 1 vessel with 1 coupon in 22 ml of solution
A-6 Ambient 1.0e-5 M CsI solution 0.01 M H3BO3 10 New Amerlock (1) / 1 vessel with 2 coupons in 22 ml of solution
A-7 Ambient Saturated I2 solution 0.01 M KH2PO4 6 Fresh Amerlock paint (large coupon)
A-8 Ambient Saturated I2 solution 0.01 M KH2PO4 6 Fresh Amerlock, pre-irradiated for 200 h at 1.77 kGy/h (large coupon)

NEA/CSNI/R(2011)11
14
Test Temp. (°C) Loading Conditions pH Control pH Sample Description/Notes
A-9 Ambient Saturated I2 solution 0.01 M KH2PO4 6 Fresh Amerlock – Thermally cured for 100 h at 110°C, (large coupons)
A-12 Ambient 1.0e-5 M CsI solution 0.01 M KH2PO4 5 Gibbsite, 5 g of Al(OH)3 in 100 ml of solution
A-13 Ambient 1.0e-5 M CsI solution none 5.4 Gibbsite, 5 g of Al(OH)3 in 100 ml of solution
A-14 Ambient 1.0e-5 M CsI solution 0.1 M H3BO3 5 Nukon wool
A-15 Ambient 1.0e-5 M CsI solution none 5 Goethite, 5 g of α-FeO(OH) in 100 ml of solution
A-16 Ambient 1.0e-5 M CsI solution 10-3 M H3BO3 8 Goethite, 5 g of α-FeO(OH) in 100 ml of solution
Table 3. Organic Iodide Tests
Test # Coupon Coating Temp. °C
RH (%) Other Information
ORG1-G Aged Amerlock 400 (3 coat) 70 70 Base conditions (70°C, 70% RH, 4 hour exposure to 1e-8 M I2(g) in air)
ORG2-G Aged Amerlock 400 (3 coat) 70 70 Base conditions
ORG3-G Aged Amerlock 400 (3 coat) 70 30 4x higher concentration (4e-8 M I2(g) in air)
ORG4-G Aged Amerlock 400 (3 coat) 70 70 Base conditions, no irradiation
ORG5-G Aged Amerlock 400 (3 coat) 70 70 Base conditions, pre-soaked coupons (~2 months)
ORG6-G Aged Amerlock 400 (3 coat) 70 30 4x higher concentration (4e-8 M I2(g) in air), 24 hour desorption
ORG7-A Aged Amerlock 400 (3 coat) Room - Loaded in aqueous phase at pH 6 with saturated I2 solution in 0.01 M KH2PO4 buffer
ORG8-G Aged Ripolin 70 70 Base conditions
ORG9-G Aged Amerlock 400 (5 coat) 70 70 Base conditions
ORG10-A Aged Amerlock 400 (5 coat) Room - Loaded in aqueous phase at pH 6 with saturated I2 solution in 0.01 M KH2PO4 buffer (72 h presoak)
ORG11-A Aged Amerlock 400 (3 coat) Room - Loaded in aqueous phase at pH 6 with saturated I2 solution in 0.01 M KH2PO4 buffer (17 h presoak)
ORG12-A Aged Amerlock 400 (5 coat) Room - Loaded in aqueous phase at pH 6 with saturated I2 solution in 0.01 M KH2PO4 buffer (72 h presoak)
ORG13-A Aged Amerlock 400 (3 coat) Room - Loaded in aqueous phase at pH 6 with saturated I2 solution in 0.01 M KH2PO4 buffer (17 h presoak)
ORG14-A Aged Ripolin Room - Loaded in aqueous phase at pH 6 with saturated I2 solution in 0.01 M KH2PO4 buffer (16 h presoak)
ORG15-A Aged Amerlock 400 (3 coat) Room - Loaded in aqueous phase at pH 6 with saturated I2 solution in 0.01 M KH2PO4 buffer (~100 h presoak)
ORG16-G Aged Amerlock 400 (3 coat) 70 70
Base conditions. Argon atmosphere during irradiation to investigate the effect of radiolytic oxidation on quantity and speciation of iodine evolved from coupons.

NEA/CSNI/R(2011)11
15
Test # Coupon Coating Temp. °C
RH (%) Other Information
ORG17-G Aged Amerlock 400 (3 coat) 70 70
Base conditions. Stop the irradiation after 3 days, perform speciation and vessel washes and then restart the irradiation. Evaluate whether build-up of radiolysis products influences organic iodide release kinetics.
ORG18-G Fresh Amerlock 400 (3 coat) 70 70 Base conditions – effect of ageing, aged 6 days prior to loading
ORG19-G Aged Amerlock 400 (3 coat) 70 70 Base conditions – effect of ageing, thermal cure for 100 h @ 110°C
ORG20-G Fresh Ripolin 70 70 Base conditions – effect of ageing, thermal cure for 100 h @ 110°C
ORG21-G Pre-irradiated Amerlock (3 coat) 70 70 Base conditions – Effect of radiation on aged
paint, coupons pre-irradiated for 200 h at 2 kGy/h
ORG22-A Aged Amerlock 400 (3 coat) Room - Loaded in I– solution (10-3 M CsI at pH 10, no buffer)
ORG23-G Aged Ripolin 70 70 Duplicate of ORG8-G
ORG24-G Aged Amerlock 400 (3 coat) 70 70 Lower I2 conc. (10-9 M) for 4 h. Comparison to EPICUR
ORG25-A Aged Amerlock 400 (3 coat) Room - I2 loading from solution (lower concentration)
ORG26-G Aged Ripolin (3 coat) 70 70 Duplicate of ORG8-G and ORG23-G
ORG27-G Aged Amerlock 400 70 70 Base conditions with low dose rate (0.34 kGy/h)
ORG28-A Aged Epigrip (1994) Room - Loaded in aqueous phase at pH 6 with saturated I2 solution in 0.01 M KH2PO4 buffer
ORG29-G Fresh Epigrip 70 70 Base conditions, use fresh, thicker Epigrip. Compare to Ripolin and Amerlock
ORG30-A Aged Ripolin Room - Coupons pre-soaked in pure water for 16 h (duplicate of ORG14-A)
ORG31-A Aged Amerlock 400 (3 coat) Room - Coupons were pre-soaked in pure water for 72 h (duplicate of ORG-10A and ORG-12A)
ORG32-M Gas Phase Methyl Iodide Room -
No coupon – methyl iodide degradation in the Gammacell (attempt to identify products). Re-inject after irradiation to see if degradation rate changes.
ORG33-M Gas Phase Methyl Iodide Room - With 6 Amerlock coupons
ORG34-M Gas Phase Methyl Iodide Room - No irradiation
ORG35-M Gas Phase Methyl Iodide Room - Irradiation with dry air and vessel
ORG36-M Gas Phase Methyl Iodide (in Argon) Room - Irradiation, 10x higher methyl iodide was used due
to the fast degradation rate
ORG37-A Aged Amerlock, presoaked Room - Duplicate of 11A, 13A (3 coat), loaded in aqueous phase at pH 6 with saturated I2 solution in 0.01 M KH2PO4 buffer (17 h presoak)
ORG38-A Aged Amerlock Room - Duplicate of 25A (Lower loading concentration - dipped for 5 minutes rather than 10)
ORG39-A Aged Ripolin Room - Duplicate of 14A, 30A
ORG40-G Fresh Ripolin 70 70 Duplicate of ORG20-G, base conditions, thermal cure @110° C
ORG41-M Gas Phase Methyl Iodide Room Multiple injections
NEA/CSNI/R(2011)11
16
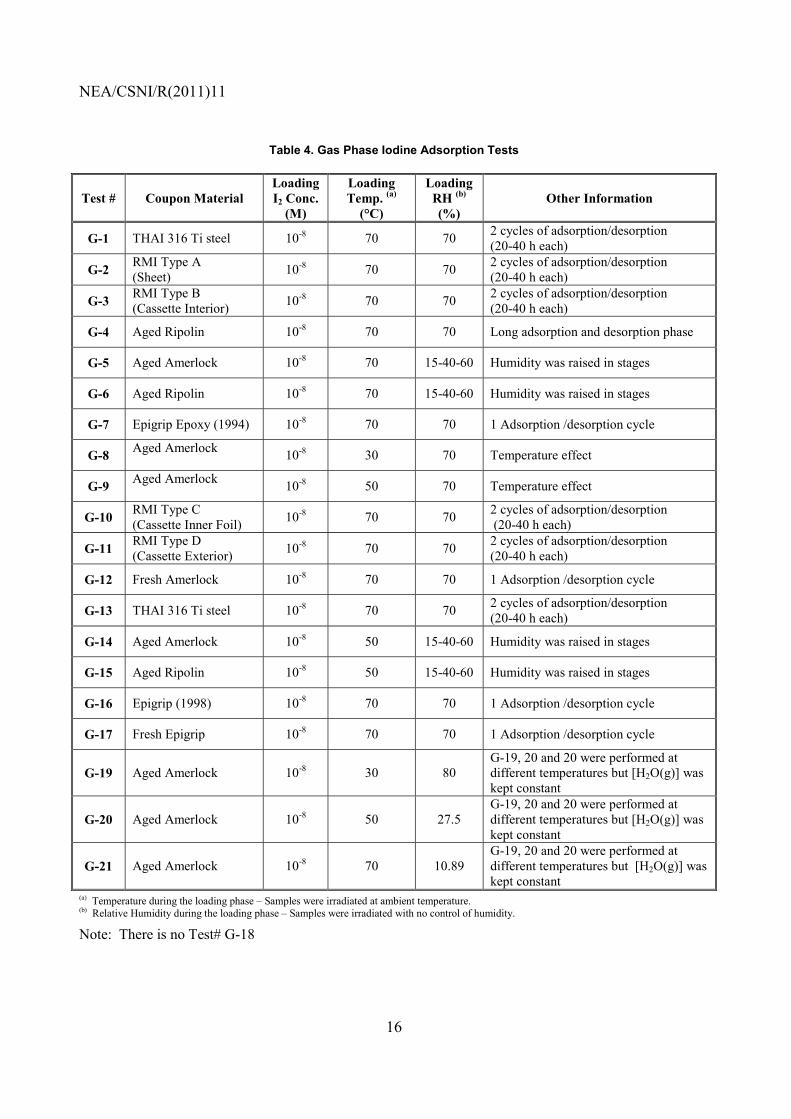
Table 4. Gas Phase Iodine Adsorption Tests
Test # Coupon Material Loading I2 Conc.
(M)
Loading Temp. (a)
(°C)
Loading RH (b)
(%) Other Information
G-1 THAI 316 Ti steel 10-8 70 70 2 cycles of adsorption/desorption (20-40 h each)
G-2 RMI Type A (Sheet) 10-8 70 70 2 cycles of adsorption/desorption
(20-40 h each)
G-3 RMI Type B (Cassette Interior) 10-8 70 70 2 cycles of adsorption/desorption
(20-40 h each)
G-4 Aged Ripolin 10-8 70 70 Long adsorption and desorption phase
G-5 Aged Amerlock 10-8 70 15-40-60 Humidity was raised in stages
G-6 Aged Ripolin 10-8 70 15-40-60 Humidity was raised in stages
G-7 Epigrip Epoxy (1994) 10-8 70 70 1 Adsorption /desorption cycle
G-8 Aged Amerlock 10-8 30 70 Temperature effect
G-9 Aged Amerlock 10-8 50 70 Temperature effect
G-10 RMI Type C (Cassette Inner Foil) 10-8 70 70 2 cycles of adsorption/desorption
(20-40 h each)
G-11 RMI Type D (Cassette Exterior) 10-8 70 70 2 cycles of adsorption/desorption
(20-40 h each)
G-12 Fresh Amerlock 10-8 70 70 1 Adsorption /desorption cycle
G-13 THAI 316 Ti steel 10-8 70 70 2 cycles of adsorption/desorption (20-40 h each)
G-14 Aged Amerlock 10-8 50 15-40-60 Humidity was raised in stages
G-15 Aged Ripolin 10-8 50 15-40-60 Humidity was raised in stages
G-16 Epigrip (1998) 10-8 70 70 1 Adsorption /desorption cycle
G-17 Fresh Epigrip 10-8 70 70 1 Adsorption /desorption cycle
G-19 Aged Amerlock 10-8 30 80 G-19, 20 and 20 were performed at different temperatures but [H2O(g)] was kept constant
G-20 Aged Amerlock 10-8 50 27.5 G-19, 20 and 20 were performed at different temperatures but [H2O(g)] was kept constant
G-21 Aged Amerlock 10-8 70 10.89 G-19, 20 and 20 were performed at different temperatures but [H2O(g)] was kept constant
(a) Temperature during the loading phase – Samples were irradiated at ambient temperature. (b) Relative Humidity during the loading phase – Samples were irradiated with no control of humidity.
Note: There is no Test# G-18

NEA/CSNI/R(2011)11
17
4. EXPERIMENTAL SUMMARY
4.1 Coupons
Gas and liquid phase adsorption and desorption tests and organic iodide formation studies were performed on two groups of sample geometries, an AECL standard coupon geometry and customer supplied geometries. Painted coupons with an AECL standard coupon geometry had a surface area of approximately 5.07 cm2 (1/2 inch (1.27 cm) in diameter and ¼ inch (0.635 cm) in thickness) and were made from cylindrical rods of carbon steel. Each coupon was prepared by spray-coating with the appropriate coating(s) according to the paint manufacturers’ specifications. The curing times between successive layers of coating were those recommended by the manufacturers. The Ripolin coupons were prepared at IRSN in France, and had an epoxy primer (Centrepox N Ripolin) undercoat with a topcoat of Hydrocentrifugon 901 Ripolin white finishing coating. The manufacturer’s specifications indicate that one layer of undercoat (approximately 0.15 mm) and four layers of the finishing coat (totalling approximately 0.25 mm) be applied. This provides a total paint thickness of about 0.4 mm. Tests with fresh Ripolin paint (ORG20-G and ORG40-G) were heat treated in an oven for 100 h at 110°C. In addition, two tests with fresh Amerlock paint (A-9 and ORG-19-G) were heat treated in the same manner.
The paint thickness was controlled carefully in the case of the aged Amerlock 400 epoxy paint. The carbon steel coupons were coated with one to five layers of the paint (no undercoat). Most of the studies on aged Amerlock paint were performed with coupons covered with 3 coats, with a total average thickness of 0.18 mm. Test ORG12-A (in addition to the Year 1 Tests ORG9 G and ORG10 A) was conducted with coupons covered with 5 coats of paint, having a total average thickness of about 0.33 mm. Some new coupons were more recently prepared so that the behaviour of fresh paint could be compared to the aged paint.
Determining the effect of paint age on organic iodide formation was one of the objectives of the BIP project. Fortunately, coupons were available that were prepared years ago for other projects. The coupons have been stored at ambient temperature and humidity within our laboratories. Table 5 presents a summary of the coupons used in these tests. Throughout this report, the full paint names have been shortened for convenience: “Amerlock” refers to Ameron Amerlock 400 epoxy paint, while “Ripolin” refers to Hydrocentrifugon 901 Ripolin white finishing coating (prepared with Centrepox N Ripolin primer). Typical painted coupons (Epigrip, freshly coated and Amerlock, larger size) are shown in Figure 1. The large size coupons were 4.45 cm (1.75 inch) long, 1.27 cm (0.5 inch) wide, and 1.59 mm (1/16 inch) thick with a 0.5 cm diameter hole.

NEA/CSNI/R(2011)11
18
Figure 1. Freshly Coated Epigrip Coupon (left) and Amerlock Coupon, Larger Size (right)
In addition to the standard painted coupons, coupons of other materials were tested in the second, third and fourth years of the BIP program. The samples included 316Ti stainless steel, Reflective Metal Insulation (RMI), Epigrip™ Epoxy coated steel (1), Nukon ™ wool insulation (2), Gibbsite (Al(OH)3) and Goethite (α-FeO(OH)). Photographs of customer-supplied materials are shown in Figures 2 through 7.
The 316Ti coupons (Figure 2) were supplied by GRS and Becker Technologies. They are made of AISI Type 316Ti stainless steel (WS 1.4571), which is the same kind of steel as used in the THAI (3) vessel. The coupons were supplied pre-cleaned and etched and conformed to our standard coupon geometry. They were used as received and were not cleaned or modified in any way.
Figure 2. Photograph of 316Ti Coupon
(1) .EpigripTM is a trademark of Leighs Paints, Bolton, United Kingdom (2) .NukonTM wool (fibreglass insulation) is a trademark of Owens Corning (3) .The THAI facility is used to study Thermalhydraulics, Hydrogen, Aerosols and Iodine in Germany. The first
phase of the OECD THAI project ended in 2010.
NEA/CSNI/R(2011)11
19
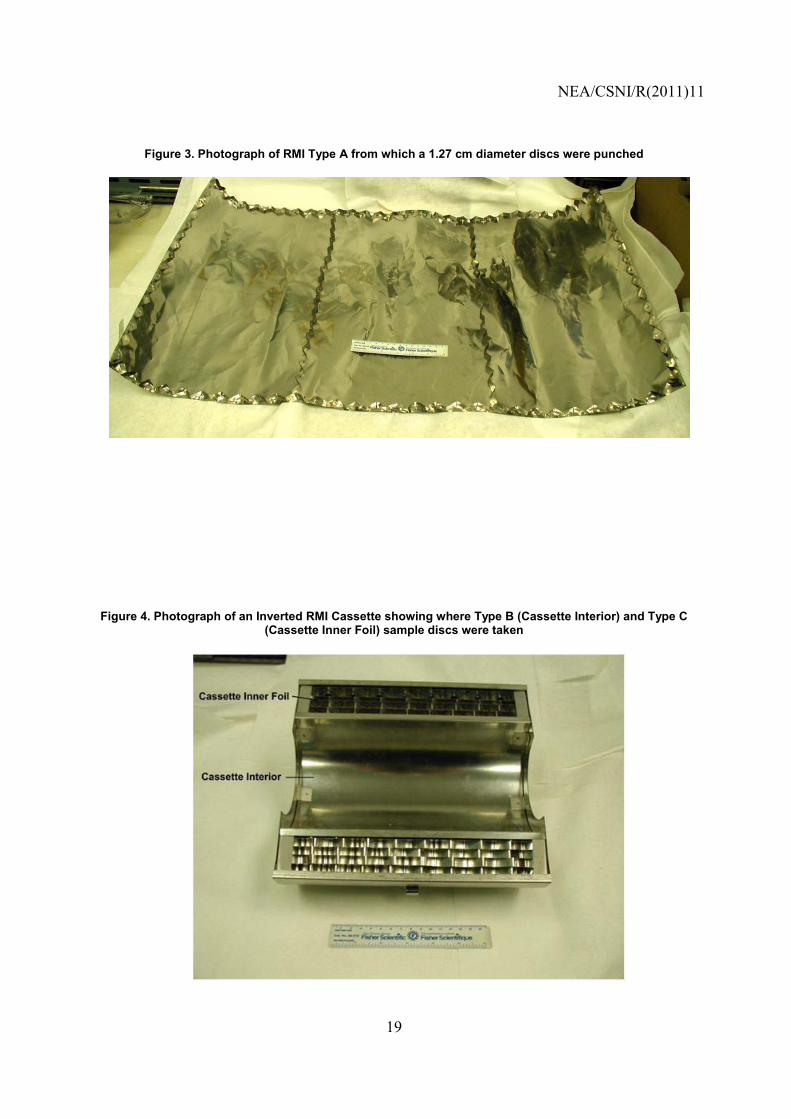
Figure 3. Photograph of RMI Type A from which a 1.27 cm diameter discs were punched
Figure 4. Photograph of an Inverted RMI Cassette showing where Type B (Cassette Interior) and Type C (Cassette Inner Foil) sample discs were taken

NEA/CSNI/R(2011)11
20
Figure 5. Photograph of RMI Cassette showing where Type D (Cassette Exterior) sample discs were taken
Figure 6. Photograph of EPIGRIP M253 Coated Metal (Base Metal for 1994 sample and Painted Surface of 1998 Sample Shown).

NEA/CSNI/R(2011)11
21
Figure 7. Photograph of Nukon™ Wool Sample from which a 1.5 cm x 1.5 cm x 1 cm Test Specimen was Cut
The United States Nuclear Regulatory Commission (US NRC) supplied two types of Reflective Metal
Insulation (RMI): an RMI sheet (Figure 3) and one half of an RMI “cassette” (Figure 4 and Figure 5). Four sets of samples were prepared by punching out disks from the two types of RMI. They are identified as:
RMI Type A: 1.27 cm discs from a large single sheet of RMI RMI Type B: 1.27 cm discs from the cassette interior RMI Type C: 1.27 cm discs from the cassette inner foil RMI Type D: 1.27 cm discs from cassette exterior
Two different samples of aged Epigrip M253 coated stainless steel foil (type 304) were supplied by National Nuclear Laboratory Limited (United Kingdom), labelled “1994” and “1998”. Thin disks matching our standard coupon diameter (1.27 cm diameter) were punched from the original sample sheet that was painted on one side (Figure 6). The other side was bare metal.
The Nukon ™ wool insulation (Figure 7) was also supplied by US NRC. It was labelled “Nukon base wool unexposed” when received. Small samples of approximately 1.5 cm × 1.5 cm × 1 cm were cut from the large sample. These samples were weighed prior to loading.

NEA/CSNI/R(2011)11
22
Table 5. Painted Coupon Types
Coupon Name Coating Paint Age Average Paint Thickness (mm) Primer
Aged Amerlock Ameron Amerlock 400 Epoxy ~12 years (Painted Oct. 1998)
0.18 (3 coats or 0.33 (5 coats) None
Fresh Amerlock (Larger size)* Ameron Amerlock 400 Epoxy 1-2 years (Painted
Apr. 25 2008) 0.24 None
Fresh Amerlock Ameron Amerlock 400 Epoxy <1 year (Painted June 16 2009) 0.4 None
Aged Ripolin Hydrocentrifugon 901 Ripolin white finishing coating 12-15 years 0.44 Centrepox
N Ripolin
Fresh Ripolin Hydrocentrifugon 901 Ripolin white finishing coating
<1 year (Received Nov. 29 2009) Not known Not Known
Fresh Epigrip Epigrip M253 < 1 year (Painted Sep. 10 2010) Not known None
Aged Epigrip Epigrip M253 “1994” ~16 years Not known Not Known
Aged Epigrip Epigrip M253 “1998” ~12 years Not known Not Known
* The larger size coupons have an area of 12.96 cm2. They were used for Tests A-7, A-8 and A-9.

NEA/CSNI/R(2011)11
23
4.2 Aqueous Phase Iodine Adsorption
Stock solutions of 131I labelled CsI were prepared by addition of approximately 0.01 mCi of 131I (as NaI) into a 1 dm3 solution containing 0.01 M boric acid (H3BO3) and about 2.6×10⁻³ g CsI in purified water to provide an iodide concentration of approximately 1×10⁻⁵ M. The solution was adjusted to the desired pH value (10) by addition of LiOH. Stock solutions of 131I labelled I2 were prepared by addition of 0.01 mCi of 131I (as NaI) into a 100 mL saturated(4) solution of I2 in purified water containing 0.01 M KH2PO4 adjusted to pH 6 with LiOH. In cases where lower I2 concentrations were desired, the stock solution was diluted. The specific activities of these solutions were determined by γ-counting a 1 mL sample in a Wallac Wizard 1480 Gamma Counter.
In each experiment, 20 to 25 mL of the stock solution was added to a series of reaction vessels containing a small Teflon-coated magnetic stir bar. One or two coupons were suspended in the aqueous phase in each vessel on a glass tube fitted with small glass hooks. The solutions were stirred, and periodically, coupons were removed from the solution, blotted to remove excess water droplets, placed into a 20 mL scintillation vial designed to centre the coupon (with a glass tube), and γ-counted. After counting, the coupons were reinstalled in the vessel and the stirring was resumed. The coupon was out of solution for about 10 minutes during each measurement. A typical glass vessel used in the experiments is shown in Figure 8. For ORG22-A, the loading time was expected to be long, so the six coupons were loaded simultaneously in a single glass vessel containing 150 mL of 10-3 M CsI.
Tests A-15 and A-16 tested iodide adsorption on to Goethite (α-FeO(OH)) powder (Reade International, 325 Mesh (<50 µm)). Goethite is an iron corrosion product that may be present in post-accident containment sump water. The test was performed by stirring 5 g of the powder in 100 mL of a trace-labelled 10-5 M CsI solution in a glass vessel. Samples of the liquid were removed, filtered and analysed for iodine content. The pH of Test A-15 was about pH 5 (not adjusted), while A-16 was buffered at pH 8 with boric acid (adjusted with LiOH).
Tests A-12 and A-13 were performed with aluminum hydroxide (Gibbsite), which was obtained from Almatis (Grade C-33, 50 µm). Aluminum hydroxide may be present in post accident containment sump water as an aluminum corrosion product. Tests were performed in the same manner as Tests A-15 and A-16. The pH of test A-13 was unadjusted and started at pH 5.4.
(4) The solubility of I2 in water at 25°C is about 0.38 g/L (1.5×10⁻³ M).

NEA/CSNI/R(2011)11
24
Figure 8. Glassware used for Aqueous Phase Adsorption Studies
4.3 Gas Phase Adsorption Apparatus and Procedure
The iodine adsorption and desorption on surfaces were studied as a function of iodine concentration in the carrier gas, Relative Humidity (RH), and temperature. The sorption experiments were carried out in the Radioiodine Adsorption Apparatus (Figure 9). In a typical test, three samples (in the form of coupons) were placed in a glass flow cells and exposed to a continuous flow of humidified air containing 131I-labelled I2 (1×10⁻⁹ to 4×10⁻⁸ M), followed by a purging period with iodine-free air. The iodine activity accumulated on each sample was continuously monitored during loading and purging using in-situ NaI (Tl) γ-detectors. Small known fractions of the flows entering and leaving the adsorption cell were diverted to charcoal traps (referred to as the inlet and outlet trap, respectively). The 131I activities accumulated in these traps were also continuously monitored to determine the iodine loading and release concentrations in the inlet and effluent gas flows.

NEA/CSNI/R(2011)11
25
Figure 9. Schematic Diagram of Multiple Coupon Radioiodine Adsorption Apparatus RH, T and P denote relative humidity, temperature and pressure transducers, and UHP N2 corresponds to ultra high purity
nitrogen.
4.4 Organic Iodide Production Tests
In these experiments, a glass vessel containing coupons (pre-loaded with 131I-labelled I2 as described in Sections 4.2 and 4.3) and laboratory air was irradiated in a Gammacell 220 60Co irradiator(5) for the purpose of evaluating the formation of organic iodides. Six coupons, each with a surface area of approximately 5.07 cm2, were used for most tests, except for Test ORG2-G, which had 8 coupons.
After adsorbing 131I trace labelled I2 on the coupons either by loading in the Radioiodine Adsorption Apparatus(6) (for adsorption in the gas phase) or by immersing coupons in a saturated I2 solution, they were moved to scintillation vials using tweezers and γ-counted. The coupons were stored in these vials until the irradiation phase began. Because only up to three coupons could be loaded at a time in the gas phase adsorption rig and because six or more were irradiated at a time, some coupons were stored in sealed vials prior to irradiation (for various lengths of time).
(5) The Gammacell 220 60Co irradiator is distributed by MDS Nordion. (6) Loading data is presented in three adsorption data reports [Glowa et al., 2010a, 2010b and 2011a].

NEA/CSNI/R(2011)11
26
Coupons were then moved to glass holders suspended within the irradiation vessel, which is shown in Figure 10 and Figure 11. The vessel consists of upper and lower sections made from borosilicate glass (Schott Duran). The upper section contains a screw cap port with a septum for gas sampling. With the coupon holders and 6 coupons in place, the vessel volume contains 927 mL of airspace. The glass surface area is estimated to be about 870 cm2, including the glassware shown in Figure 10, but excluding the coupon holders. There was no provision to heat the vessel and coupons during irradiation. However, items tended to warm slightly during irradiation (solutions are generally ~ 32°C during irradiation). The dose rates during irradiation were estimated from Fricke dosimetry (ferrous sulphate solutions) previously performed in similar geometries. Dose rates for individual tests are provided in the data reports [Ball and Boulianne, 2010; Ball et al., 2010; Glowa et al., 2011b].
Figure 10. Irradiation Vessel (Pre-irradiation, without the Coupon Holders)
NEA/CSNI/R(2011)11
27
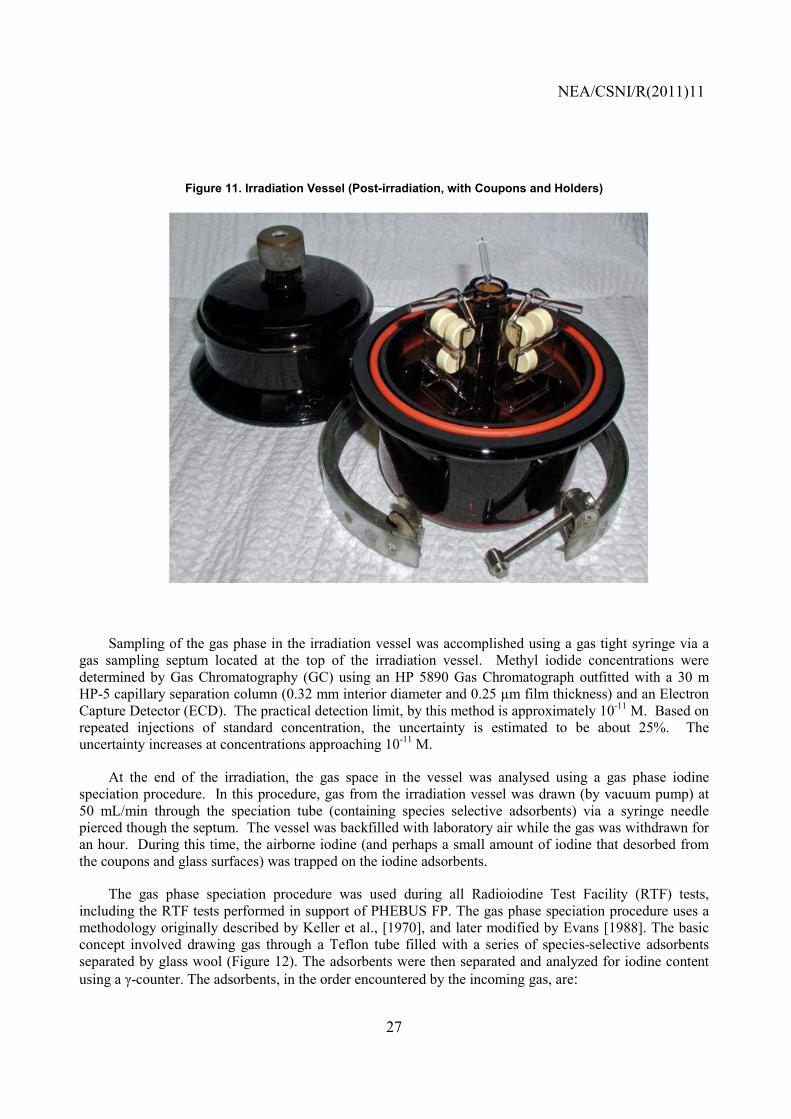
Figure 11. Irradiation Vessel (Post-irradiation, with Coupons and Holders)
Sampling of the gas phase in the irradiation vessel was accomplished using a gas tight syringe via a gas sampling septum located at the top of the irradiation vessel. Methyl iodide concentrations were determined by Gas Chromatography (GC) using an HP 5890 Gas Chromatograph outfitted with a 30 m HP-5 capillary separation column (0.32 mm interior diameter and 0.25 µm film thickness) and an Electron Capture Detector (ECD). The practical detection limit, by this method is approximately 10-11 M. Based on repeated injections of standard concentration, the uncertainty is estimated to be about 25%. The uncertainty increases at concentrations approaching 10-11 M.
At the end of the irradiation, the gas space in the vessel was analysed using a gas phase iodine speciation procedure. In this procedure, gas from the irradiation vessel was drawn (by vacuum pump) at 50 mL/min through the speciation tube (containing species selective adsorbents) via a syringe needle pierced though the septum. The vessel was backfilled with laboratory air while the gas was withdrawn for an hour. During this time, the airborne iodine (and perhaps a small amount of iodine that desorbed from the coupons and glass surfaces) was trapped on the iodine adsorbents.
The gas phase speciation procedure was used during all Radioiodine Test Facility (RTF) tests, including the RTF tests performed in support of PHEBUS FP. The gas phase speciation procedure uses a methodology originally described by Keller et al., [1970], and later modified by Evans [1988]. The basic concept involved drawing gas through a Teflon tube filled with a series of species-selective adsorbents separated by glass wool (Figure 12). The adsorbents were then separated and analyzed for iodine content using a γ-counter. The adsorbents, in the order encountered by the incoming gas, are:

NEA/CSNI/R(2011)11
28
1. CdI2 (supported on Chromosorb P), which selectively adsorbs I2,
2. Iodophenol, which absorbs Low Volatility Organic Iodides (LVRI), and
3. TEDA (tetraethylenediamine) impregnated charcoal, which adsorbs High Volatility Organic Iodides (HVRI).
Figure 12. Diagram of Speciation Tube
When the speciation methodology was originally developed, the intended function of the iodophenol section was to trap HOI, which was then considered to be highly volatile. Later calculations determined that HOI was not volatile and analysis of compounds adsorbed in the various sections of the gas speciation tube showed that although methyl and ethyl iodide were trapped mainly on the TEDA-charcoal, butyl iodide was also partially trapped on the iodophenol fraction [Evans, 1988]. Consequently, in the data reports, the organic iodides trapped in the iodophenol and TEDA charcoal sections are referred to as high molecular weight and low molecular weight organic iodides (HMWRI and LMWRI), respectively. More recent findings [Glowa and Wren, 2003] suggest that under reactor accident or RTF conditions, oxygen-containing organic-iodides could be formed more abundantly than alkyl iodides. Some of these species may have low molecular weights, but are much less volatile than methyl and ethyl iodides. It has not been verified that oxygen-containing organic iodides would be adsorbed exclusively in the iodophenol section, however, iodophenol, having an OH group and an aromatic ring, will adsorb oxygen-containing and aromatic organic iodides. The OH group promotes hydrogen bonding with oxygen containing molecules and aromatic species7. Methyl and ethyl iodide possess a dipole moment, but do not contain an oxygen atom to promote hydrogen bonding, and therefore penetrate the iodophenol fraction of the speciation tube. This idea is supported by RTF results, which show that the concentration of organic iodides adsorbed in the TEDA charcoal section generally compares well (within a factor of 5) to the concentration of methyl iodide in the gas sample measured by gas chromatography. In experiments performed for this project, the concentration of methyl iodide as determined by gas chromatography was generally within a factor of two from that adsorbed on the TEDA charcoal section.
After gas phase speciation, the irradiation vessel was opened and the coupons γ-counted to determine the amount of iodine desorbed by comparison to their pre-test loading. The vessel, including the vertical section seen in Figure 10, was then rinsed according to the procedure described in Figure 6 in order to remove iodine from the surface and assess the overall mass balance. The delicate coupon holders (seen in Figure 11) were not rinsed and not included in the mass balance. The coupon holder, however, represents a small percentage of the surface area.
7 Phenol-like compounds, polyphenyl ether and polyethylene glycol (Carbowax), are commonly used as the
stationary phases for gas chromatography columns to separate alcohols, acids, esters and other oxygen-containing compounds and aromatic compounds.
CdI2(on Chromosorb P)
4-Iodophenol(on Alumina)
Charcoal(TEDA impregnated)
GlassWool
GlassWool
GlassWool
GlassWool
Syringe needle
To VacuumPump

NEA/CSNI/R(2011)11
29
Table 6. Post-Test Vessel Wash
Test # Rinse Description
ORG1 to ORG4 20 mL water
ORG5 to ORG7 20 mL 0.05 M NaOH
All tests after ORG8 3 rinses of 20 mL 0.05 M NaOH
After the NaOH washes, the vessel was cleaned with methanol, acetone and propanol to dissolve any remaining organic residue. In preparation for the next experiment, the vessel received a final wash with pure water before being baked at 500°C to remove residual organic contaminants.

NEA/CSNI/R(2011)11
30

NEA/CSNI/R(2011)11
31
5. RADIOIODINE TEST FACILITY (RTF) RESULTS
5.1 General Description of the RTF
The RTF consisted of a replaceable cylindrical main vessel(8), which was generally partially filled with water and into which a radiation source could be placed. The vessel itself was fabricated using either carbon steel or stainless steel. The carbon steel vessels were coated with several different types of coatings applied to the inner surface to simulate the surfaces present in containment. The stainless steel vessels were not coated, however, in some cases, the surface was electropolished to minimize the interactions between iodine and the surface.
In a typical RTF experiment, 25 dm3 of water was added to the main vessel, leaving a 315 dm3 gas space. Volumes for each test are reported in their respective data reports. More detail about the RTF facility and procedures have been provided to BIP members [Glowa, 2009a].
Figure 13 shows a schematic of the RTF. The facility consisted primarily of an instrumented main vessel. Electric heaters around the exterior of the vessel could control the temperature of the water up to 90°C and the vessel walls up to 110°C. In some cases, cooling loops filled with recirculating water were coiled around the vessel exterior to induce condensation.
The vessel was connected to a variety of flow loops, each of which had different functions and components (Figure 13, Table 7). The loops were intended to be as inert as possible with respect to iodine. Initially, untreated stainless steel (316 L) was used, however, after the Advanced Containment Experiment (ACE) tests, when it was observed that the loops retained significant quantities of iodine, the gas-sampling loop was replaced with glass-lined stainless steel. The aqueous sampling loop was replaced with glass-lined stainless steel in November 1996. During higher temperature tests (>25ºC) the lines were trace heated and insulated to avoid condensation. Flow rates in each of the lines and details regarding the individual loop lengths and surface areas varied somewhat from test to test and are provided in the data reports.
The Radioiodine Test Facility experimental programme produced over 50 integral experiments on iodine behaviour. The RTF experiments measured gas and aqueous phase iodine concentrations and speciation from irradiated and non-irradiated solutions of CsI in the presence of various containment surfaces and in the presence of several additives (including Ag). Extensive chemical analysis of organic and inorganic species in the aqueous phase was performed routinely in these experiments. As well, iodine speciation in the gas phase was supplemented with gas chromatographic analysis of organic compounds and organic iodides. These data have been invaluable for evaluation of AECL’s iodine behaviour model, but for the most part were unavailable to the international community before the BIP.
The BIP Program Review Group Members selected the 5 RTF tests described in Table 7 for inclusion into the program. The experiments focused mainly on organic impurities and the effect of painted surfaces on iodine behaviour.
(8) Most tests used a 340 dm3 vessel, which was 91.8 cm internal height with a 34.3 cm radius. The Advanced Containment Experiments (ACE) tests used slightly larger (350 and 387 dm3) vessels.

NEA/CSNI/R(2011)11
32
Figure 13. Schematic of the RTF Facility
DO
ORP
pH
AAIS
Gas Recirculation Loop
H2 Sensor
AqueousRecirculation
Loop
Gas Ventilation LoopCharcoal Filter
AqueousSampling
Loop
Lead Canister
GasSampling
Loop
Main Vessel
pH control
pHOnlineGamma 60Co Radiation SourceSpectrometer
DO
ORP
pH
AAIS
Gas Recirculation Loop
H2 Sensor
AqueousRecirculation
Loop
Gas Ventilation LoopCharcoal Filter
AqueousSampling
Loop
Lead Canister
GasSampling
Loop
Main Vessel
pH control
pHOnlineGamma 60Co Radiation SourceSpectrometer
Table 7. RTF Experiments Selected for Study
Test Vessel Dose Rate
(kGy/h)
T (ºC) Major Experimental Events pH Scheme Duration
(h)
P9T1 Stainless steel 0.78 60 pH steps 10 to 5 to 9 in steps
500
P9T2 Epoxy paint 0 60 Initial species was I3– Controlled at 5
then 9 265
P10T2 Epoxy paint 0.61 25 Includes 48 h pre-test with no iodine tracer – organic analysis
Initially 10, then uncontrolled
283
P10T3 Epoxy paint
0.56 90 Includes 26 h pre-test with no iodine tracer – organic analysis. Condensing conditions halfway through test.
Initially 10, then uncontrolled
187
P11T1 Electropolished stainless steel
0.6 25 Slow MIBK injection to simulate dissolution
Mainly uncontrolled
306
5.2 Summary of RTF P9T1
Phase 9 Test 1 of the Radioiodine Test Facility was performed in May 1996 to study iodine behaviour in a stainless steel vessel at 60°C. The pH in the vessel sump, which contained an irradiated solution of CsI, was decreased stepwise from 10 to 5 in order to determine the pH dependence on iodine volatility. The pH was then raised back to 9 to encourage desorption from system surfaces. Qualitatively, the test results were consistent with expectations and past experiments [Glowa and Ball, 2010]:

NEA/CSNI/R(2011)11
33
• Iodine volatility rose as the pH decreased.
• The organic iodide concentration was a very small fraction of the total iodine inventory.
• Iodine interacted with stainless steel in the main vessel and the recirculation loops. This was evidenced by the reduction in the iodine concentration in the sump that could not be accounted for by its loss to the gas phase and by the accumulation of dissolved metals (Fe, Ni, Mn and Cr) and corrosion products.
• A fraction of the iodine was lost to system surfaces.
• Hydrogen was produced by water radiolysis.
• Nitrate and nitrite were produced by air radiolysis.
• Only a portion of the iodine was recovered back in the sump when the pH was made alkaline at 432 h, and during the washing stage. Iodine was retained as insoluble deposits contacting the water, or as non-volatile deposits on surfaces in contact with the gas phase.
The data from this test can be used to check a model’s sensitivity of iodine volatility to pH at 60°C. In addition, some information can be derived regarding iodine deposition on surfaces, but because of the poor mass balance, the location of the iodine is not known with certainty. Nevertheless, bounding deposition rates can be derived by simulation of the total sump concentration and the total gas phase concentration.
5.3 Summary of RTF P9T2
Phase 9 Test 2 (P9T2) of the Radioiodine Test Facility was performed in December 1996 to study iodine behaviour in an epoxy painted (Amercoat 66) vessel in the absence of radiation [Glowa 2010]. In order to focus on measurements of mass transfer, adsorption onto surfaces, and reaction with organics, the initial iodine species for this test was an aqueous mixture of I2 and I–. The concentrations of organic compounds were closely monitored to provide additional data on the dissolution of solvents from painted surfaces. From this test, the following results were drawn:
• Paint constituents were detected in the gas and aqueous phase, and tended to accumulate prior to the tracer addition. Rather large concentrations (millimolar range) were detected in the water; note, however, that the paint had not aged long (<6 months).
• The concentration of aqueous and gas phase organic compounds released from the paint decreased when the iodine tracer was added. This may have been the result of the interaction between organic compounds and I2.
• Iodine was transferred out of the aqueous phase to surfaces contacting the water and the gas phase. This is evidenced by the reduction in the total aqueous phase iodine concentration as well as its adherence to surfaces contacting the gas phase.
• The quantity of iodine removed from the aqueous phase was larger than the amount initially present as I2, suggesting that a portion of the I– also deposited onto the surfaces.
• A very large decrease in the total gas iodine concentration occurred when the pH was raised to 9. The speciation measurements showed that the gas phase I2 concentration dropped quickly, as did the low volatility organic iodide concentration, after the pH increase.

NEA/CSNI/R(2011)11
34
• Although the iodine chemistry occurring in this experiment was simplified by the absence of the 60Co source, the transfer of I2 from aqueous solutions to the gas phase is still complex. It was a function of:
Interfacial mass transfer,
Adsorption onto surfaces (contacting both the aqueous and gas phase),
Hydrolysis reactions (fast at 60°C), and
Reactions between I2 and dissolved organic compounds.
• This test can be used to assess organic dissolution models, and reactions between I2 and organic compounds.
5.4 Summary of RTF P10T2
Phase 10 Test 2 of the Radioiodine Test Facility was an experiment performed in March 1998, to study the behaviour of iodine for an irradiated solution of iodide in an Amerlock 400 Epoxy painted vessel [Glowa and Ball, 2009]. About two days before the main test, the vessel was filled with ~ 25 L of distilled water. During the next 48 hours the release of organic compounds from the paint and the pH change associated with the radiolytic degradation of these compounds was monitored. Previous bench scale coupon studies had determined that the major compounds released from the paint were the aromatic compounds xylene and ethyl benzene, which are components of the paint and the thinner used during application of the coating. Iodine (and a fresh charge of water) was introduced at the start of the main portion of the test, during which the pH was held at 10 for 45 hours, after which the pH control was released.
The main conclusions of this test are:
• Organic impurities, originating from the solvents used within the paint formulation were released during the test, and were present to the end of the test. The radiolytic degradation of these species contributed to the reduction in pH, and the production of organic iodides, both of which affect the gas phase iodine concentration. It must be noted that the painted surface used in this test received much less curing time than the painted surfaces of most reactor containment buildings.
• Organic iodides, much of which can be attributed to methyl iodide, made up the majority of the gas phase iodine species.
• The concentration of aqueous organic iodides is very closely linked to the pH, which supports the view that a significant portion of the organic iodides was formed in the sump.
• Although the concentration of gas phase organic iodides decreased when the pH was raised to 10 at 210 h, a certain fraction persisted. In addition, the persistent concentration was much larger than observed during the initial pH 10 stage. These observations could be taken as evidence that a portion of the gas phase organic iodides were formed on the dry painted surfaces; however, an alternative explanation is that the concentration of organic species in the sump was higher at the end of the test, leading to a higher rate of organic iodide production.
• The surfaces, in particular the painted surfaces, are an efficient iodine sink (more than 75% of the iodine was retained by the surfaces at the end of the test). Iodine was mainly irreversibly retained.

NEA/CSNI/R(2011)11
35
5.5 Summary of RTF P10T3
Phase 10 Test 3 of the Radioiodine Test Facility (RTF) was an experiment performed in October 1998 to study the behaviour of iodine in an epoxy (Ameron Amerlock 400) painted vessel at 90°C with and without wall cooling [Glowa and Ball, 2011]. Prior to the iodine being added, the vessel was partially filled with water, and the solution was irradiated for 26 hours to monitor the release of organic compounds from the paint, and measure the associated pH drop. Iodine was present for the second portion of this test, which began after the first sump water was drained and fresh water added.
The pH was initially set to about 10, but was left uncontrolled and allowed to drop due to the production of acids from the radiolysis of air and aqueous paint solvents. Throughout the test, most of the gas phase iodine, 75 to 95%, was present in the form of organic iodide because much of the available I2 was converted to organic iodides in solution. Although ~90% of the iodine inventory was deposited onto surfaces during the test, very little (~5%) was re-dissolved upon adjusting, and holding the pH at 10. Such a strong attachment suggests that a chemical reaction between iodine and the surfaces occurred.
Wall cooling commenced at 49 hours by flowing cooling water through coils wrapped around the outside of the vessel walls. This cooled the walls to ~75°C while the sump temperature was maintained at 90°C. Because of the high sump temperatures, dissolved oxygen and hydrogen peroxide measurements were not made during this test. The vessel included a 26 cm strip of electropolished stainless steel fitted against the vessel wall (~40 cm from the top of the vessel) to form a collection channel to divert condensate into a steel collection cup. The condensate was sampled by pumping the condensate from the collector cup though stainless steel tubing (1/8 inch, i.e. 0.318 cm).
The main conclusions of this test are:
• Organic impurities, originating from the compounds within the paint formulation were released during the test, and were present to the end of the test. The radiolytic degradation of these solvents contributed to the reduction of the pH, and the production of organic iodides, both of which affect the gas phase iodine concentration.
• The concentrations of the original paint solvents (e.g., ethylbenzene, xylene) decreased over the course of the test, whereas the concentration of their degradation products (e.g., formaldehyde, CO2) increased over the course of the test.
• Organic iodides, much of which was methyl iodide, made up the majority of the gas phase iodine species.
• At the onset of wall cooling, only minor changes were observed in the speciation and overall concentration of iodine. The short-term increases in the gas phase iodine concentrations measured on-line may have been caused by spurious disruptions in the flow rate measurements.
• At the conclusion of the test, the majority of the iodine inventory resided neither in the sump nor in the gas phase. The bulk of the iodine was irreversibly attached to surfaces within the system (loops and painted wall surfaces).
5.6 Summary of RTF P11T1
Phase 11 Test 1 of the Radioiodine Test Facility was performed in May 1998 to study iodine behaviour in an electropolished stainless steel vessel to which an organic compound was added in a manner that would approximate the rate at which trapped solvents would leach into the water from painted surfaces [Glowa, 2009b]. To accomplish this, a stock solution of 0.026 M solution of Methyl Isobutyl

NEA/CSNI/R(2011)11
36
Ketone (MIBK), a common containment paint solvent, was added during the test at 0.8 mL/h, and later at 4 mL/h, using a syringe pump. These rates were chosen to approximate MIBK dissolution rates observed from paint samples immersed in water at ~25°C and 40°C, respectively, from epoxy paint aged for about a year.
This experiment is an important component of the RTF program because it allows the study of organic radiolysis and organic iodide formation in a situation where the organic source term is well known. Furthermore, it restricted the formation of organic iodides to aqueous processes. Because there were no painted surfaces present, the possibility of organic iodide formation from the painted surfaces was eliminated.
This experiment demonstrated a variety of important concepts in iodine behaviour that can be summarized as:
• Gas phase iodine concentrations increase when pH decreases.
• The radiolysis of organic material creates acidic species that lower the pH.
• Adding organic material to the aqueous phase contributes to the formation of gas phase organic iodides.
• Surfaces (even stainless steel) can be an important iodine sink.
The effect of dissolved organic solvents on pH behaviour and organic iodide formation demonstrate that dissolved organic solvents, similar to those that would be expected to leach from containment paints, can contribute to the overall rate of organic iodide production from painted surfaces and have a significant influence on the pH.
NEA/CSNI/R(2011)11
37
6. ADSORPTION TESTS
The BIP adsorption tests are described in detail in three data reports [Glowa et al., 2010a; 2010b; 2011].
6.1 Aqueous Adsorption
Aqueous iodine adsorption was studied to a much lesser extent than gas phase iodine adsorption, and the ORG-A series tests do not include kinetic adsorption data. However, a few tests were performed to evaluate aqueous iodine adsorption on paint and other surfaces that may be present during an accident, such as insulation and corrosion products. In addition to the BIP (A series) tests, 16 tests performed previously at AECL on painted coupons were released to the BIP members as supplemental information (AECL series). A summary of tests performed during the AECL series tests is provided in Appendix A. In these experiments, the adsorption phase was followed by a phase in which the coupons previously loaded with iodine were immersed in fresh water (sometimes containing a buffer) to determine if any of the iodine was reversibly retained.
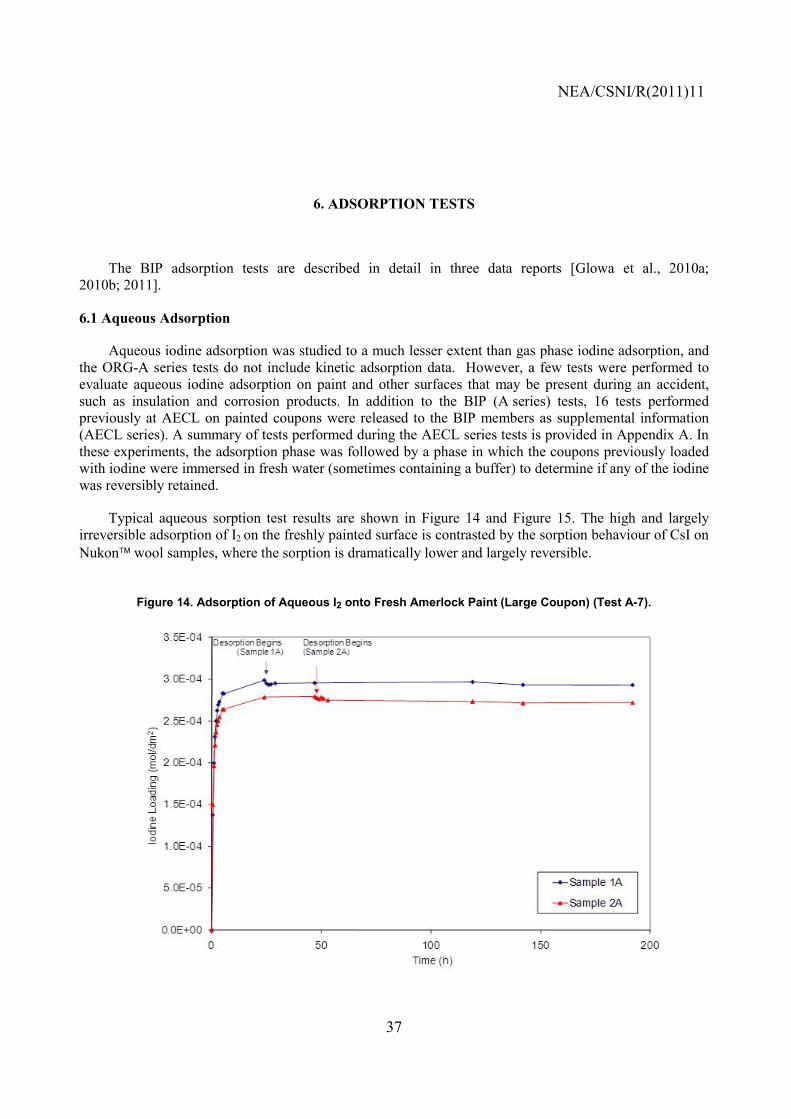
Typical aqueous sorption test results are shown in Figure 14 and Figure 15. The high and largely irreversible adsorption of I2 on the freshly painted surface is contrasted by the sorption behaviour of CsI on Nukon wool samples, where the sorption is dramatically lower and largely reversible.
Figure 14. Adsorption of Aqueous I2 onto Fresh Amerlock Paint (Large Coupon) (Test A-7).

NEA/CSNI/R(2011)11
38
Figure 15. Adsorption of Aqueous CsI onto Nukon™ Wool Samples (Test A-14 and Test A-2)
As the set of tests performed during this study is relatively small and covers many variables, few definite conclusions can be drawn. However, some preliminary qualitative observations can be made:
• Paint has a high capacity for scavenging I2. In many cases, the final loading concentration we observe in the tests probably corresponds to the amount of iodine available in the solution, rather than a true saturation capacity (when placed in a fresh solution, coupons adsorb more). A more concentrated solution (or larger volume) may be needed to observe a true saturation capacity. For now, the observed adsorption profiles can be fit to a model to extract deposition velocities.
• I2 adsorbs much faster than I–, suggesting that a chemical reaction takes place with the more reactive I2, whereas with I–, adsorption is largely a physical process.
• Iodide adsorption seems related to water uptake of the coupon, so iodide may simply be diffusing into the paint matrix.
• Adsorption of I– and I2 is faster at higher temperatures. The temperatures dependence may be related to diffusion rates or chemical reactions or both (note that for I2, hydrolysis reactions become more important as the temperatures increases).
• There may be differences in the loading rate between fresh, pre-irradiated and thermally treated painted coupons.

NEA/CSNI/R(2011)11
39
• Desorption (in fresh buffer or water) from coupons loaded with I– or I2, is very slow, and only a small amount of the adsorbed iodine is removable.
• Buffer (boric acid or phosphate) may inhibit iodide adsorption [Glowa et al., 2010a].
• Iodide deposition onto Nukon™ wool was quite small. At pH 5, more iodine was retained by Nukon™ wool (after soaking in fresh, iodine-free buffer solution) than at pH 8. Note that for this test, it was difficult to differentiate between the iodine physically (or chemically) adsorbed on the Nukon™ wool, and dissolved iodine within droplets of tracer solution that are difficult to remove from the wool.
• Iodide deposition on Goethite was undetectable during Test A-15 and Test A-16, where the iodine solution was monitored for a reduction in concentration. This finding does not preclude a small amount of adsorption, but the tests only indicate an upper limit.
• The rate of adsorption of both I2 and I– was comparable for Ripolin and Amerlock paint [Glowa et al., 2010a].
Clearly, adsorption of aqueous iodine species demands more attention in the future. Many parameters have yet to be explored.
6.2 Gas Phase Adsorption
The results of typical gas phase sorption experiments are shown in Figure 16 and Figure 17. In most of the experiments, the adsorption phase was followed by a period of purging the loaded coupon holder with air containing no iodine, to determine if any of the iodine was merely physically or reversibly retained. Figure 16 shows the sorption behaviour on aged Ripolin paint (Test G-4). The deposition velocity decreased slightly with time and like Amerlock painted coupons, very little desorption was detected. The coupon was noted to be yellowish after the test.
Figure 16. Iodine Deposition on Aged Ripolin (Test G-4)

NEA/CSNI/R(2011)11
40
Figure 17 shows the sorption behaviour of one of the coupons in Test G-1, which used 316Ti stainless steel coupons. In the first desorption phase, about one third of the iodine was observed to desorb. Subsequent to the second adsorption period, it appears that much of the iodine remained on the coupon, implying that there may be more than one “type” of iodine on the surface (i.e., a type that desorbs and one that does not). This behaviour is consistent with previous studies on iodine deposition on other types of stainless steel [Wren et al., 1999]. It is evident from the deposition velocity, and the desorption behaviour, that this stainless steel is a poor iodine sink as compared to the painted coupons.
Figure 17. Iodine Deposition on THAI 316Ti Stainless Steel (Test G-1)
The following conclusions can be drawn from the BIP tests regarding iodine adsorption:
• The deposition velocity of iodine onto 3 different epoxy paints has been measured. Deposition rates were within an order of magnitude of each other. The importance of this effect to the total gas phase iodine concentrations in post accident containment must be assessed within an integral code.
• Water vapour concentration (humidity) strongly affects the rate of adsorption of iodine onto painted surfaces. Iodine adsorbs faster when the humidity is high.
• At a fixed water vapour concentration, the effect of temperature is not strong. This suggests that the chemical reaction between I2 and the paint is not the rate determining step.
• For 2 different epoxy paints, we are able to compare the deposition velocity of iodine on fresh and aged paint. In the Amerlock case, the deposition rate was lower for freshly painted coupons,

NEA/CSNI/R(2011)11
41
whereas it was higher for freshly painted Ripolin coupons.
• Pre-irradiation appears to reduce the deposition velocity of iodine onto aged Amerlock coupons.
• Heat treatment did not affect the deposition velocity of iodine onto freshly painted Amerlock coupons.
• The deposition velocity of iodine onto 316Ti stainless steel is much lower than that onto paint, and this material was shown to behave like other stainless steels tested in the past.
• The deposition velocity of iodine onto Reflective Metal Insulation (RMI) was very low and difficult to measure using the present BIP adsorption facility and procedure.
• Iodine deposition velocities are an essential input for iodine release calculations [Glowa et al., 2011a]. The relationships between temperature, humidity and deposition velocity will help analysts choose experimental values to best meet their needs. Further experiments may be necessary if the expected accident conditions are outside of those attainable by the Radioiodine Adsorption Apparatus.

NEA/CSNI/R(2011)11
42

NEA/CSNI/R(2011)11
43
7. ORGANIC IODINE FORMATION TESTS
As stated earlier, the ORG-series tests were performed with coupons loaded in the aqueous phase or the gas phase. In many cases, the coupons loaded in the aqueous phase were also pre soaked in water for a period of time to ensure water absorption. Methyl iodide profiles typical of gas phase iodine loaded tests (ORGx-G) are presented in Figure 18, whereas methyl iodide profiles typical of aqueous phase iodine loading (ORGx-A) are presented in Figure 19. Methyl iodine production test were described in detail within 3 data reports [Ball and Boulianne, 2010; Ball et al., 2010; Glowa et al., 2011b].
Figure 18. Methyl Iodide Profiles Typical of ORGx-G Tests (Normalized Linear Scale)
0 50 100 150 200
CH3I
(M)
Time (h)
ORG1-G (Aged Amerlock)
ORG2-G (Aged Amerlock)
ORG18-G (Fresh Amerlock)
ORG23-G (Aged Ripolin)
ORG26-G (Aged Ripolin)
ORG29-G (Fresh Epigrip)

NEA/CSNI/R(2011)11
44
Figure 19. Methyl Iodide Profiles Typical of ORGx-A Tests (Normalized Linear Scale)
Upon the completion of about forty ORG-series tests, the following conclusions can be drawn:
• Very small concentrations of radiolytically-produced methyl iodide can be measured using a specially-tuned gas chromatograph equipped with an electron capture detector.
• Methyl iodide is detected in the gas phase of our irradiation experiments. Methyl iodide is not detected during a non-radiation test.
• Gas phase methyl iodide is quickly destroyed by radiolysis (M-series tests).
• Adsorbed iodine is lost from the painted surface. Radiation is required for this to happen. A higher percentage of the iodine is lost from the coupon when loaded in the aqueous phase. On average, 34% was lost during the aqueous-loaded tests, whereas an average of 8% was lost during gas-loaded tests. In general, the total amount of iodine released from the coupon was correlated with the amount of CH3I observed in the gas phase during irradiation.
• On average, over the long term, methyl iodide concentrations were about an order of magnitude higher for the aqueous loaded coupons than the gas phase loaded coupons.
NEA/CSNI/R(2011)11
45
• Most of the tests with pre-soaked coupons displayed a much larger initial methyl iodide production rate than the other tests. This shows that water plays a role during the formation or release of methyl iodide from the paint.
• The tests with iodine adsorbed on coupons from the gas phase, had the highest methyl iodide concentrations when performed with freshly painted coupons. This suggests that a residual solvent, or other time dependent curing phenomenon, plays a role in determining the potential of the paint to form organic iodides under irradiation.
• Many of the tests were performed with painted coupons that were more than a decade old. Methyl iodide production was detected during these tests. This suggests that residual solvents are still present in these coupons, or that methyl iodide is created from material other than residual solvents.
• Methyl iodide is formed even when iodine is loaded in the form of CsI, although its rate of formation is much less than when it is loaded with I2. The iodide ion is less likely to form bonds with the paint matrix than I2, therefore, if an interaction between I2 and the paint matrix is required in order for methyl iodide to be formed, some radiolysis of I¬ to I2 on the surface water layer may be taking place.
• The formation of organic iodide from painted surfaces represents a phenomenon that can contribute to total gas phase iodine concentration over long periods of time and is independent of the chemistry of an adjacent water pool.
• Experiments are complementary to EPICUR studies, which are of the “continuous purge” design. The fast radiolytic destruction rate of methyl iodide must be considered in the analysis of BIP tests.
• The test results can be used to develop or test a model that simulates the formation of organic iodide from the irradiation of painted surfaces on which iodine is adsorbed.

NEA/CSNI/R(2011)11
46
NEA/CSNI/R(2011)11
47
8. FURTHER WORK
In the BIP, although substantial progress was achieved regarding the understanding of the formation of methyl iodide from irradiated paint, the mechanistic details are not understood. A mechanistic understanding, applied to models for these phenomena, would improve our ability to explain results to our regulatory agencies and justify application of these results to ranges outside of the tested conditions (e.g., extrapolation to wider selection of materials and to larger scale experiments and containment conditions). A more detailed mechanistic understanding will be the goal of the BIP2 Project.

NEA/CSNI/R(2011)11
48

NEA/CSNI/R(2011)11
49
9. REFERENCES
BIP Project Reports
[1] Ball, J.M., Glowa, G.A. and Boulianne, D., 2010. Behaviour of Iodine Project: Data Report for Organic Iodine Studies (Year 1). Atomic Energy of Canada Limited Report, 153 126530 440 006.
[2] Ball, J.M. and Boulianne, D., 2010. Behaviour of Iodine Project: Data Report for Organic Iodine Studies (Year 2). Atomic Energy of Canada Limited Report, 153 126530 440 010.
[3] Glowa, G.A. and Ball, J.M., 2011. Radioiodine Test Facility P10T3 Test Report. Atomic Energy of Canada Limited Report, 153 126530 440 005, Rev. 1.
[4] Glowa, G.A., Moore, C.J. and Boulianne, D., 2011a. Behaviour of Iodine Project: Final Report on Iodine Adsorption Studies, Atomic Energy of Canada Limited Report, 153 126530 440 013.
[5] Glowa, G.A., Ball, J.M., Boulianne, D. and Mitchell, J.R., 2011b. Behaviour of Iodine Project: Final Report for Organic Iodine Studies. Atomic Energy of Canada Limited Report, 153 126530 440 014.
[6] Glowa, G.A., 2010. Radioiodine Test Facility P9T2 Test Report. Atomic Energy of Canada Limited Report, 153 126530 440 012, Rev. 0.
[7] Glowa, G.A. and Ball, J.M., 2010. Radioiodine Test Facility P9T1 Test Report. Atomic Energy of Canada Limited Report, 153 126530 440 008, Rev. 0.
[8] Glowa, G.A., Ball, J.M., and Boulianne, D., 2010a. Behaviour of Iodine Project: Data Report for Iodine Adsorption Studies (Year 1). Atomic Energy of Canada Limited Report, 153 126530 440 007.
[9] Glowa, G.A., Moore, C.J., and Boulianne, D., 2010b. Behaviour of Iodine Project: Data Report for Iodine Adsorption Studies (Year 2). Atomic Energy of Canada Limited Report, 153 126530 440 011.
[10] Glowa, G.A. and Ball, J.M., 2009. Radioiodine Test Facility P10T2 Test Report. Atomic Energy of Canada Limited Report, 153¬126530 440 004, Rev. 0.
[11] Glowa, G.A., 2009a. The Radioiodine Test Facility. Atomic Energy of Canada Limited Report, 153 126530 440 003, Rev. 1.
[12] Glowa, G.A., 2009b. Radioiodine Test Facility P11T1 Test Report. Atomic Energy of Canada Limited Report, 153 126530 440 002, Rev. 1.

NEA/CSNI/R(2011)11
50
Other References
[1] Clément, B., Cantrel, L., Ducros, G., Funke, F., Herranz, L., Rydl, A., Weber, G. and Wren, J.C., 2007. State of the Art Report on Iodine Chemistry. Nuclear Energy Agency Report, NEA/CSNI/R(2007)1.
[2] Evans, G.J., 1988. An Experimental Assessment of Iodine Partitioning and Speciation in Relation to Nuclear Reactor Accidents. Ph. D. Thesis, Department of Chemical Engineering and Applied Chemistry, University of Toronto.
[3] Glowa, G.A. and Wren, J.C., 2003. Aqueous-Gas Phase Partitioning and Hydrolysis of Organic Iodides. Can. J. Chem., 81, 230 243.
[4] Keller, J.H., Duce, F.A. and Maeck, W.J., 1970. A Selective Adsorbent Sampling System for Differentiating Airborne Iodine Species. Proc. 11th AEC Air Cleaning Conference, CONF 700816, 2, 621.
[5] Wren, J.C., Glowa, G.A., and Merritt, J., 1999. Corrosion of Stainless Steel by Gaseous I2. J. Nucl. Mat., 265, 161 177.

NEA/CSNI/R(2011)11
51
APPENDIX A
Supplemental Aqueous Adsorption Tests Released to the BIP Project
Test Temp.
(°C) Loading Conditions pH Control pH Notes
AECL-2 Ambient 1.0e-5 M CsI 1.0e-3 M H3BO3 10 Amerlock (4) / 2 vessels with 25 ml of solution, each containing 2 coupons.
AECL-4 Ambient 2.0e-5 M I2 0.01 M KH2PO4 6 Amerlock (4) / 2 vessels with 22 ml of solution, each containing 2 coupons. Desorption in buffer.
AECL-5 Ambient 4.0e-5 M I2 0.01 M KH2PO4 6 Amerlock (2) / 2 vessels with 22 ml of solution, each containing 1 coupon.
AECL-6 Ambient 1.6e-4 M I2 0.01 M KH2PO4 6
Amerlock (2) / 2 vessels with 22 ml of solution, each containing 1 coupon. Desorption w/ buffer, then one coupon desorption in 1.0e-5 CsI.
AECL-7 Ambient Saturated I2 solution 0.01 M KH2PO4 6
Amerlock (2), Ripolin (2) / 2 vessels with 22 ml of solution, each containing 2 coupons of one type, excess iodine crystals in each vessel. Desorption in buffer.
AECL-8 Ambient Saturated I2 solution 0.01 M KH2PO4 6 Ripolin (2) /1 vessel with 2 coupons in 22 ml of solution, excess iodine in vessel.
AECL-9 Ambient 1.0e-5 M CsI solution 0.01 M H3BO3 10 Ripolin (2) /1 vessel with 2 coupons in 22 ml of solution, excess iodine in vessel. Desorption in buffer.
AECL-11 Ambient 1.0e-4 M CsI solution 0.01 M H3BO3 10 Amerlock (2), Ripolin (1) / 2 vessels with 22 ml of solution, 2 Amerlock coupons in one, 1 Ripolin coupon in another.
AECL-12 40 1.0e-5 M CsI solution 0.01 M H3BO3 10 Amerlock (1), Ripolin (1) / 2 vessels with 22 ml of solution, each containing 1 coupon.
AECL-13 60 1.0e-5 M CsI solution 0.01 M H3BO3 10 Amerlock (1), Ripolin (1) / 2 vessels with 22 ml of solution, each containing 1 coupon.
AECL-15 Ambient Saturated I2 solution 0.01 M KH2PO4 6 Ripolin (2) / 1 vessel with 2 coupons in 22 ml of solution. Excess iodine in vessel, I2 solution was replaced.
AECL-17 40 Saturated I2 solution 0.01 M KH2PO4 6 Ripolin (2) / 1 vessel with 2 coupons in 22 ml of solution. Excess iodine in vessel, I2 solution was replaced.
AECL-20 60 Saturated I2 solution 0.01 M KH2PO4 6 Ripolin (2) / 1 vessel with 2 coupons in 22 ml of solution. Excess iodine in vessel, I2 solution was replaced.
AECL-21 50 Saturated I2 solution 0.01 M KH2PO4 6
Amerlock (1), Ripolin(1) / in Erlenmeyer flask, 2 Erlenmeyer flasks with 130 ml of solution, each containing 2 coupons. Excess iodine in vessel, I2 solution was replaced.
AECL-22 Ambient 1.0e-4 M CsI solution 0.01 M H3BO3 10 Amerlock (2), Ripolin (1) /2 vessels with 22 ml of solution, 2 Amerlock coupons in one, 1 Ripolin coupon in another.
AECL-23 Ambient 1.0e-5 M CsI solution none 10 Amerlock (2), Ripolin (2) / 2 vessels with 22 ml of solution, each containing 2 coupons.


