21
20.10.17 CA EED Meeting Sofia 1 ... of energy efficiency

20.10.17 CA EED Meeting Sofia 1
... of energy efficiency

20.10.17 CA EED Meeting Sofia
Energy savings Climate Change
Sustainability
EE policy
2

20.10.17 CA EED Meeting Sofia
Energy savings Climate Change
Sustainability
EE policy

20.10.17 CA EED Meeting Sofia 4
Energy savings Climate Change
Sustainability
Air pollu8on
health poverty
resources
economy labour market
energy system security
EE policy
COM EED IA
June 2017 1
The macro-level and sectoral impacts of Energy Efficiency
policies
Final report

20.10.17 CA EED Meeting Sofia 5
Energy savings Climate Change
Sustainability
Air pollu8on
health poverty
resources
economy labour market
energy system security
-‐ Forward-‐looking: 2030 -‐ Based on EEI ac8ons
2017
2017
-‐ ex-‐post analysis -‐ policy assessment

This project has received funding from the European Union’s Horizon 2020 research and innovation programme under grant agreement No 649724. This document reflects only the author's view. The Agency is not responsible for any information it contains.
Energy efficiency & -savings More than energy and greenhouse gas savings
Johannes Thema 20 October 2017 Plenary Meeting Concerted Action 2 EED, Sofia
[Use your partner] [ logo here ]
www.combi-‐project.eu

Cost-benefit analysis of Energy Efficiency
§ Inclusion of other („multiple“) impacts - à COMBI project
20.10.17 CA EED Meeting Sofia 7
Source: Ecofys/WI 2014
Source: ACEEE 2014

Traditional cost-benefit analysis Example: CBA of total values
0
2
4
6
8
10
12
14
1 2 3 4 5 6 7 8 9 10
M€
yr
Investment
Energy cost savings

Traditional cost-benefit analysis Example: CBA of total values
0
2
4
6
8
10
12
14
1 2 3 4 5 6 7 8 9 10
M€
yr
Investment
Energy cost savings
Cumulated energy cost savings
discoun8ng of life8me-‐savings
Total cost/benefit comparison

Expanded Cost-benefit analysis CBA including Multiple Impacts of Energy Efficiency
0
2
4
6
8
10
12
1 2 3 4 5 6 7 8 9 10
M€
yr
Investment
Energy cost savings
Cumulated energy cost savings
Multiple Impacts
Cumulated MIs
discoun8ng
Total cost/benefit comparison
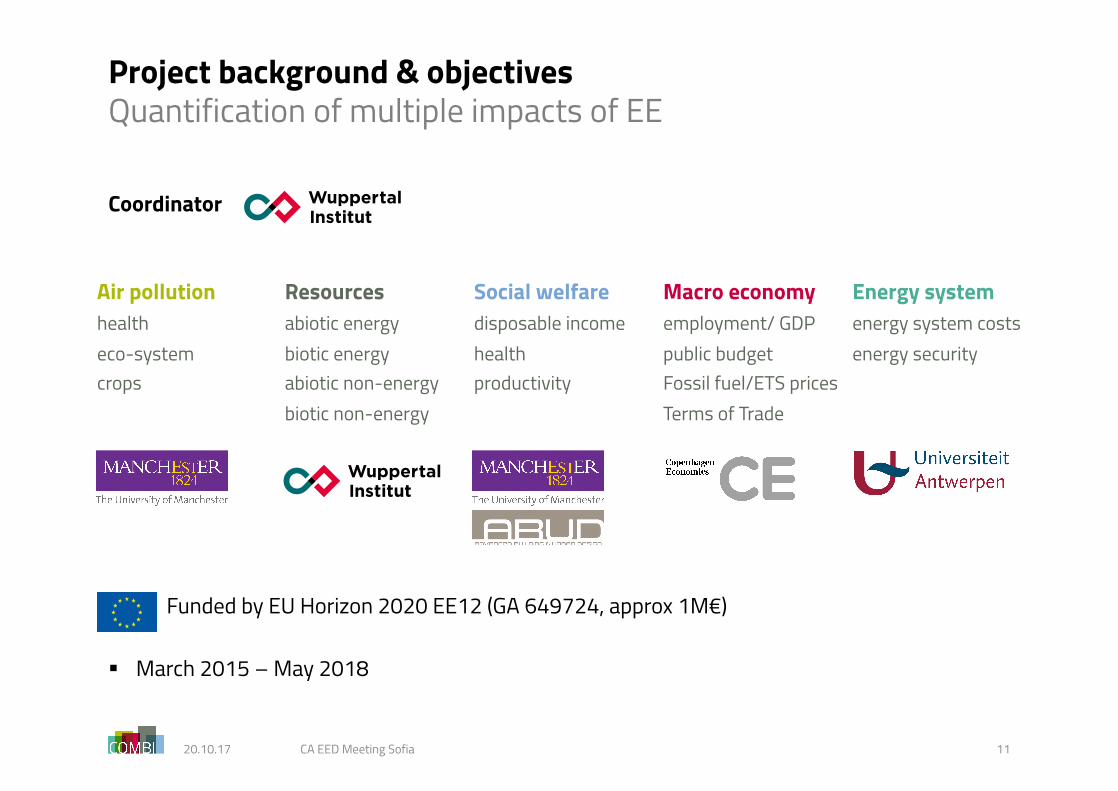
Project background & objectives Quantification of multiple impacts of EE
Coordinator
- Funded by EU Horizon 2020 EE12 (GA 649724, approx 1M€)
§ March 2015 – May 2018
20.10.17 CA EED Meeting Sofia 11
Air pollution health eco-system crops
Resources abiotic energy biotic energy abiotic non-energy biotic non-energy
Social welfare disposable income health productivity
Macro economy employment/ GDP public budget Fossil fuel/ETS prices Terms of Trade
Energy system energy system costs energy security
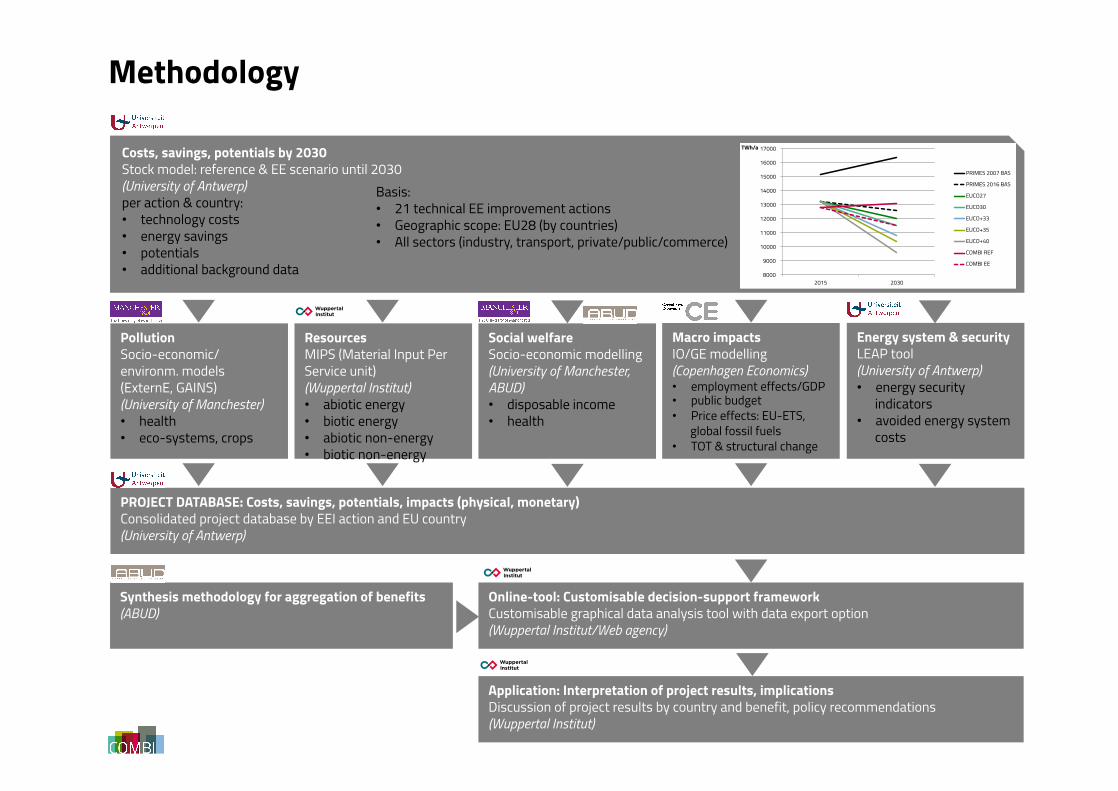
Methodology
Macro impacts IO/GE modelling (Copenhagen Economics) • employment effects/GDP • public budget • Price effects: EU-ETS,
global fossil fuels • TOT & structural change
Social welfare Socio-economic modelling (University of Manchester, ABUD) • disposable income • health
Pollution Socio-economic/ environm. models (ExternE, GAINS) (University of Manchester) • health • eco-systems, crops
Resources MIPS (Material Input Per Service unit) (Wuppertal Institut) • abiotic energy • biotic energy • abiotic non-energy • biotic non-energy
Energy system & security LEAP tool (University of Antwerp) • energy security
indicators • avoided energy system
costs
PROJECT DATABASE: Costs, savings, potentials, impacts (physical, monetary) Consolidated project database by EEI action and EU country (University of Antwerp)
Online-tool: Customisable decision-support framework Customisable graphical data analysis tool with data export option (Wuppertal Institut/Web agency)
Costs, savings, potentials by 2030 Stock model: reference & EE scenario until 2030 (University of Antwerp) per action & country: • technology costs • energy savings • potentials • additional background data
Application: Interpretation of project results, implications Discussion of project results by country and benefit, policy recommendations (Wuppertal Institut)
Synthesis methodology for aggregation of benefits (ABUD)
Basis: • 21 technical EE improvement actions • Geographic scope: EU28 (by countries) • All sectors (industry, transport, private/public/commerce)
8000
9000
10000
11000
12000
13000
14000
15000
16000
17000
2015 2030
TWh/a
PRIMES 2007 BAS
PRIMES 2016 BAS
EUCO27
EUCO30
EUCO+33
EUCO+35
EUCO+40
COMBI REF
COMBI EE

8000
9000
10000
11000
12000
13000
14000
15000
16000
17000
2015 2030
TWh/a
PRIMES 2007 BAS
PRIMES 2016 BAS
EUCO27
EUCO30
EUCO+33
EUCO+35
EUCO+40
8000
9000
10000
11000
12000
13000
14000
15000
16000
17000
2015 2030
TWh/a
PRIMES 2007 BAS
PRIMES 2016 BAS
EUCO27
EUCO30
EUCO+33
EUCO+35
EUCO+40
COMBI REF
COMBI EE
Comparison of COMBI and EED IA (PRIMES 2016) scenarios Graphical analysis
more recent statistics COMBI: conservative (ambitious baseline)
excl. agric, industry raw ambition ≈EUCO+33
-27% à EUCO27

The goal: a more complete picture COMBI online tool
20.10.17 CA EED Meeting Sofia
WP Benefit Category
# Impact end-point Units Physical primary unit
Physical (for aggregation)
Monetary (yes/no)
3" Air"pollution" 1" Human"health" YLL"(possibly"DALY?)" DALY?" yes"
" " 2" Eco>systems:"acidification" %"change"in"area"affected"by"excess"acidification" no"aggregation?,"final"EP?"
no"
" " 3" Eco>systems:"eutrophication" %"change"in"area"affected"by"eutrophication" no"aggregation?,"final"EP?"
no"
" " 4" Eco>systems:"ozone"exp." %"change"in"area"affected"by"ground>level"ozone"exposure" no"aggregation?,"final"EP?"
no"
" " 5" Eco>systems:"crop"loss" %"change"in"area"affected"by"crop"losses,"t"of"crop"loss" km2?" yes"
" " 6" Air"pollution:"emissions"(mid>points)" t" " no"
4" Resources" 7" Fossil"Fuels" tons" " yes(part"of"energy"costs)"
" " 8" Metal"Ores" tons" " yes"(part"of"energy"costs?)"
" " 9" Minerals" tons" " no"
" " 10" Abiotic"raw"materials"(sum"of"above)" tons" " no"
" " 11" Biotic"raw"materials" tons" " no"
" " 12" Material"Footprint"(sum"abiotic"&"biotic"&"unused)" tons" " no"
" " 13" Direct"carbon"emissions" tons"of"CO2"equivalents"(GWP"100a)" no"(yes:"ranges/IPCC)"
" " 14" Carbon"Footprint"(GWP,"lifecycle"emissions"incl."direct"emissions)"
tons"of"CO2"equivalents"(GWP"100a)" no"(yes:"ranges/IPCC)"
5" Social"welfare" 15" Excess"winter"mortality"attributable"to"inadequate"housing"
Number"of"deaths"avoided"due"to"improved"building"ventilation"(morbidity"expert"judgement)"
DALY?"together"with"below" yes"
" " 16" Excess"winter"morbidity"attributable"to"inadequate"housing"
YLL,"DALY?" DALY?"together"with"above" yes"
" " 17" Asthma"due"to"indoor"dampness" DALY,"YLL" DALY?" yes"
" " 18" Energy"cost"savings/available"income"effect"(WP2?)" €"(perspective!)" " yes"
" " 19" Productivity"impact"through"health"(asthma,"allergy,"cardiovascular"disease,"cold"and"flu)""
Number"of"days"suffered"due"to"these"diseases" active"days,"(DALY"for"health)"
yes"
" " 20" Active"time"loss" Labour"input"and"travel"time"saved"per"hour" active"days" yes"
" " 21" Workforce"productivity"" Labour"input"per"hour" active"days"(probably)" yes"
6" Macro>economy"
22" Temporary"(business>cycle)"employment/GDP"effects" Number"of"job"years" " yes"(GDP)"
" " 23" Temporary"(business>cycle)"public"budget"effects" %"of"budget"or"GDP" " yes"(public"budget)"
" " 24" Fossil"fuel"price"effects"" €/MWh,"%"change" " yes"(no"aggr.)"
" " 25" ETS"price"effect" €/tCO2" " yes"(no"aggr.)"
" " 26" Terms"of"Trade"effect" TOT"index"change" " yes"(no"aggr.)"
" " 27" Sectoral"shifts" %"change" " yes"(no"aggr.)"
7" Energy"system"&"security"
28" Energy"import"dependency" Monetary"share"spent"on"importing"energy" yes"(part"of"energy"costs)"
" " 29" Import"dependence"and"diversity"(incl."geopolitical"risks)" Herfindahl>Hirschman"index"HHI" no"
" " 30" Energy"intensity" ktoe/1000€" " no"
" " 31" Derated"capacity"margin" Share"(%)" " no"
20+ physical MI end-points (physical/monetary unit)
to 10+ impacts (phys./monetary)
€ monetization
λΣieΨαx
CBA selection (no double-counting)
pre-aggregation quantification
conversion to € (where possible)
aggregation Cost-benefit analysis
C-‐S-‐IM
(C-‐S-‐IM)/E
BCRs
CBA calculations (life-time, annualised, MACC)
All outputs accessible graphically via online tool • data export option • by EEI action (/sector) • by EU country • by impact type
14

COMBI online tool (under development) Display of physical & monetary impacts
20.10.17 CA EED Meeting Sofia 15 values not finalised, only graphical representa8on

COMBI online tool Cost-Benefit Analysis
20.10.17 CA EED Meeting Sofia 16 values not finalised, only graphical representa8on

COMBI online tool Dynamic MAC curves incl. multiple impacts (GHG, energy saved)
20.10.17 CA EED Meeting Sofia 17 values not finalised, only graphical representa8on

COMBI take-away Overview on Multiple Impacts of EE in Europe 2030
Analyse potentials of EE improvement (EEI) in Europe: Energy savings, GHG emissions and multiple impacts (MIs) § Country comparisons § Sector comparisons § EEI action comparisons § If monetized: size of impacts § Net value of EEI actions with/without selected MIs - also in ralation to savings potential (energy, GHG) à MACC - Values: life-time, annualised, levelized - Sensitivity analysis: energy prices, discount rates, impact selection
§ Check physical & monetized values and effect on Cost-Benefit Analysis § Concise report on effects & policy conclusions

This project has received funding from the European Union’s Horizon 2020 research and innovation programme under grant agreement No 649724. This document reflects only the author's view. The Agency is not responsible for any information it contains.
Thank you Johannes Thema [email protected] Wuppertal Institute for Climate, Environment and Energy Research Group Energy, Climate and Transport Policy
FOLLOW US! Websites h^p://combi-‐project.eu www.wupperinst.org On Twi^er @COMBI_project @wupperinst
Subscribe to COMBI newsle^er at h^p://combi-‐project.eu

Impacts quantified Pre-aggregated impacts
à total: 35+ impact end-points (annex)

COMBI energy efficiency improvement (EEI) List of 21 EEI actions
Buildings (residential & tertiary) Transport Industry
Difference to PRIMES/EED-IA: • not complete energy system (excl. agric., only selected EEI actions, excl. supply sector) • disaggregated stock analysis model à bottom-up funding of scenarios
Buildings (residential & tertiary) Transport Industry
Actions 1 (residential) and 5 (non-residential): refurbishment of building shell + replacement of building systems (space heating, cooling and ventilation)
Actions 2 (residential) and 6 (non-residential): energy efficiency improvements of new dwellings or buildings, focusing on Passive House standards;
Actions 3 (residential) and 7 (non-residential): energy efficiency improvements for lighting systems;
Actions 4 (residential) and 8 (non-residential): energy efficiency improvements of cold appliances (residential) or product cooling (non-residential).
Actions 9 and 12: modal shifts for both passenger and freight transport;
Action 10: energy efficiency improvements of motorized two-wheelers;
Action 11: energy efficiency improvements of passenger cars;
Action 13: energy efficiency improvements of public road transport, i.e. bus or coach;
Action 14: efficiency improvements of light duty trucks (LDTs);
Action 15: efficiency improvements of heavy duty trucks (HDTs).
Action 16: energy efficiency improvements of high temperature process heating (furnaces, ovens, kilns, dryers, …)
Action 17: energy efficiency improvements of low and medium temperature process heating (boilers and steam systems in general);
Action 18: energy efficiency improvements of industrial process cooling and refrigeration;
Action 19: energy efficiency improvements of process specific use of electricity, mainly electrochemical processes in non ferrous metals and chemicals;
Action 20: energy efficiency improvements of motor drive systems, including pumps, compressed air for utilities, compressed gas/air systems for processes; fans and blowers, and other motor applications;
Action 21: energy efficiency improvements of heating, ventilation and air-conditioning (HVAC) systems in industrial buildings.


